 Yi-Hsin Chen
 Isaac Y. Li2*
 Chunhua Cao
 Yan Wang
94% of researchers rate our articles as excellent or good
Learn more about the work of our research integrity team to safeguard the quality of each article we publish.
Find out more
BRIEF RESEARCH REPORT article
Front. Educ. , 28 February 2025
Sec. Assessment, Testing and Applied Measurement
Volume 10 - 2025 | https://doi.org/10.3389/feduc.2025.1506674
A simulation study is designed to explore the accuracy of attribute parameter estimation in the crossed random effects linear logistic test model (CRELLTM) with the impact of Q-matrix misspecification on attribute parameter estimation using the SAS® GLIMMIX procedure with a scaling constraint on item parameter. In addition, the impact of the interactions of Q-matrix misspecification with other manipulated factors, such as population distribution, sample size, and Q-matrix density, on parameter estimation is also investigated. The results indicated that misspecification type and percent have a considerable impact on the bias and root mean squared error of attribute estimates, especially under the conditions of high percent misspecification and over-misspecification. However, attribute correlation between the estimated and true parameters is not affected by misspecification type and percent. Other manipulated variables have no impact or interaction effects with Q-matrix misspecifications on attribute estimates. Since the Q-matrix is an indispensable element in applying the crossed random effects linear logistic test model, specifying an appropriate Q-matrix is a crucial task and must be completed with generous assistance from content and subject experts.
One of the central concerns in educational assessment pertains to the validity of tests, specifically, whether they accurately measure what they are intended to assess (Chen, 2006, 2012; Cronbach and Meehl, 1955). This issue applies to all types of tests, including standardized educational assessments and classroom teacher-made tests. Over the past several decades, significant progress has been made in understanding the cognitive processes involved in solving test items. Researchers have drawn upon principles from cognitive psychology to address challenges in educational assessment and to establish the theoretical foundations of construct validity associated with these tests (Chen, 2012; Ma and Green, 2017).
Psychometricians have leveraged cognitive psychology principles to develop psychometric models for educational assessment data. These models are known as skills-based psychometric models (Stout, 2002) or, more recently, cognitive diagnostic models (CDMs) or diagnostic classification models (DCMs; Rupp et al., 2010). A common thread among these approaches is the integration of cognitive information within statistical models (Embretson and Reise, 2000; Embretson and Gorin, 2001). Specifically, these psychometric models incorporate a design matrix (Fischer, 1973, 1995), also called the Q-matrix (Tatsuoka, 2009), which explicitly represents the construct of interest and delineates the relationships between test items and underlying cognitive components.
Among skills-based psychometric models, the Linear Logistic Test Model (LLTM), proposed by Fischer (1973), stands out as one of the earliest mathematical frameworks to explicitly incorporate cognitive components (Stout, 2002). Before the LLTM, Scheiblechner (1972) introduced a two-step regression approach to explore how cognitive operations—necessary for solving test items—predict item difficulty estimates within the Rasch model. Building upon this foundation, Fischer (1972, 1973) directly decomposed item difficulty parameters into a linear combination of cognitive operations within the Rasch model formula. For a more detailed understanding of these decomposition processes, readers can refer to Kubinger (2008).
An essential feature of applying the LLTM involves identifying a comprehensive list of cognitive components relevant to the test tasks. Subsequently, the relationships between test tasks and these cognitive components are established prior to parameter estimation. The resulting product is called a design matrix (Fischer, 1973) or a Q-matrix (Tatsuoka, 2009), with dimensions I (number of items) × K (number of cognitive components). DiBello et al. (2007) asserted that the formulation of a Q-matrix within the LLTM represents a critical advancement. This development serves as a bridge, transitioning from unidimensional item response theory (IRT) models (such as the Rasch model) to comprehensive cognitive diagnostic models (CDMs). The Q-matrix can be a binary matrix where 1 s indicate the presence of cognitive components on particular items, otherwise 0 s. Identifying cognitive components and constructing a Q-matrix have been considered essential and challenging tasks (e.g., Baker, 1993; Chen et al., 2008; de la Torre, 2008; DiBello et al., 2007; Rupp et al., 2010; Ma and Green, 2017).
The LLTM is considered an extension of the Rasch model because the mathematical equation of the LLTM can be expanded directly from the Rasch model (e.g., Chen et al., 2011; Effatpanah and Baghaei, 2021; Hartig et al., 2012) and all the features of the Rasch model (e.g., one-parameter model, specific objectivity, sufficient statistic, parameter separability; Effatpanah and Baghaei, 2021) can be applied to the LLTM as well. The mathematical equation of the Rasch model is presented as follows:
where P(Xip = 1) represents the probability of the correct response to item i for person p, θp is the ability level of person p, and βi is the item difficulty of item i. In the LLTM, a linear combination of cognitive components replaces item difficulty, βi, βj, of the Rasch model. In other words, the item parameters of the Rasch model are replaced by a product of cognitive components and their weights (i.e., entries in a Q-matrix), which can be conceptualized as
where qik, an entry in a Q-matrix, is the fixed and predetermined weight assigned to cognitive component k that is involved in item I, ηk is the estimated parameter for cognitive component k, and c is the normalizing constant and is simply defined as the mean of the βi estimates under the Rasch model. Thus, the mathematical equation of the LLTM is presented as follows:
A well-known assumption behind the LLTM is that the variance of item difficulties is explained completely by cognitive components (i.e., ). This assumption does not consider the fact that sampling items from an item population results in item sampling variance (De Boeck, 2008). In applications, the LLTM assumption leads to the same item difficulty estimates for the items requiring the same cognitive components and weights. This may not always be true. Thus, this can be considered a disadvantage of applying the LLTM to decompose item difficulty into cognitive components (e.g., Hartig et al., 2012; Janssen et al., 2004). To overcome the disadvantage of the LLTM, Janssen et al. (2003, 2004) proposed the crossed random-effects linear logistic test model (CRELLTM), just like in a regular regression model, by adding the error term on item difficulty to relax the assumption of the LLTM as the equation below where is an error term with a normal distribution,
In SAS, the NLMIXED procedure, which fits NonLinear MIXED models (SAS Institute Inc, 2015), has been widely used to formulate diverse item response theory (IRT) models due to its availability of software and modeling flexibility (De Boeck and Wilson, 2004; Sheu et al., 2005; Wang and Jin, 2010). However, the SAS NLMIXED procedure cannot be applied in this study because the CRELLTM requires random effects for person ability and item difficulty simultaneously, which is referred to as crossed random effects (De Boeck and Wilson, 2004). Instead, the GLIMMIX procedure in SAS is suitable for models with crossed random effects (Wang and Jin, 2010). Historically, the GLIMMIX procedure was available as a SAS macro add-on product in SAS 9.1. In SAS 9.3, it became an individual package with significant improvements (Li et al., 2013; Tan et al., 2011). Like the NLMIXED procedure, the GLIMMIX procedure performs estimation and statistical inference for Generalized LInear MIXed Models, extending the class of Generalized Linear Models (GLM) by incorporating normally distributed random effects (SAS Institute Inc, 2015). Although the GLIMMIX procedure has been applied to formulate IRT-related models (e.g., Rasch models or linear logistic test models), only a few studies have examined its efficiency in parameter recovery (e.g., Black and Butler, 2012; MacDonald, 2014).
Using generalized linear or nonlinear models for the formulation of IRT models, such as the CRELLTM, there are the three required specifications, including (1) the random or distribution component, (2) the systematic component, and (3) the link component (De Boeck and Wilson, 2004; Wang and Jin, 2010). The random or distribution component specifies the distribution of the data. For dichotomous or binary data, it is appropriate to assign the Bernoulli or binary distribution. The Bernoulli distribution is one of the exponential distributions. The distribution component describes the relation between the distribution of the data (Yip) and the expected value of the distribution (μip), which is the probability of the correct response (Pip) for dichotomous data. The systematic component defines a linear or nonlinear function of the predictors for persons and items, denoted ηip. The equation of the systematic component for the CRELLTM is shown below.
The Rasch-based model’s scaling constraint can be applied to either the item or person parameter to ensure the identifiability of the model. The scaling constraint for the CRELLTM in this study is to set 0 for the mean of item parameters (i.e., difficulty estimates) and, therefore, the person parameters (i.e., ability estimates) freely estimated. This is a common practice in Rasch modeling with some advantages. First, a constraint on item parameters is easy to model with SAS. In the SAS GLIMMIX procedure, when fitting a Rasch-based model, the default setting for the scaling constraint is applied to the item estimates (i.e., difficulty) to be 0 (Pan and Chen, 2019), which means an easy-to-use procedure (Black and Butler, 2012). Furthermore, by constraining the item parameter, comparisons between individuals remain independent of the specific items used, which is a fundamental principle of Rasch models named specific objectivity (Feuerstahler and Wilson, 2019), and item parameters are more stable and interpretable across different samples or contexts (Brandt, 2008; Feuerstahler and Wilson, 2019). Conversely, imposing a constraint on the person parameter complicates the estimation process and may result in biased estimates, particularly in small sample sizes (Hoijtink and Boomsma, 1995).
The link component connects the expected value of the data to ηip, which is the systematic, nonlinear function for the CRELLTM. The logit link function is more commonly used than the probit link function for IRT models. The link function of the CRELLTM can be presented as follows:
By conducting mathematical transformation, the probability of correct response based on ability level, cognitive component, and Q-matrix for the CRELLTM can be expressed below, and all the notations can be found in the previous paragraphs.
There are two categories of estimation methods under the GLIMMIX procedure: (1) pseudo-likelihood under linearization and (2) maximum likelihood with Laplace approximation (METHOD = LAPLACE) or adaptive quadrature (METHOD = QUAD). Pseudo-likelihood estimation methods yield biased estimates for non-normal data with small sample sizes. Maximum likelihood estimation with Laplace integral approximation seems to be an appropriate estimation method for the CRELLTM because the CRELLTM is a random-person random-item model that does not require the fixed effect (R-side effect in SAS) in parameter estimation processes. Please refer to the SAS User’s Guide (2015) for detailed information on these estimation methods.
The following is the SAS code of the CRELLTM to obtain cognitive attribute estimates using the SAS GLIMMIX procedure. In the code, resp1 represents an item response, which is the dependent variable,
PROC GLIMMIX data = longformat method = laplace;
CLASS item person;
MODEL resp1 (descending) = a1 a2 a3 a4/s noint link = logit dist = binary error = binomial;
RANDOM int. / subject = person s;
RANDOM int. / subject = item s;
run;
and there are four cognitive components, a1 to a4, as predictors.
In the context of utilizing the LLTM or CRELLTM, it is crucial to identify well-defined cognitive attributes (or task characteristics) and establish the appropriate relationships between test tasks (e.g., test questions) and cognitive attributes, which is the Q-matrix (Tatsuoka, 2009) in addition to determining the psychometric model for the probability of the correct response. For the LLTM without random effects, studies have examined if the model provides accurate parameter estimates for cognitive attributes (e.g., Cassuto, 1996; Green and Smith, 1987; MacDonald, 2014) and if the model is sensitive to misspecification of the Q-matrix (e.g., Baker, 1993). For the LLTM with random item effects, its sensitivity to misspecification of the Q-matrix has not been examined yet, to our knowledge, at least using the SAS GLIMMIX procedure as an estimation tool.
Based on the aforementioned rationale, a series of simulations were conducted in this study to explore the effects of Q-matrix misspecification on parameter estimation in the LLTM model with random item effects. The SAS GLIMMIX procedure was utilized to estimate the parameters of cognitive attributes. Q-matrix misspecification involves misspecification percent (i.e., 2.4, 4.8, and 9.6%) and misspecification type (i.e., over-, under-, and balanced-misspecifications). In addition, the impact of population distribution, sample size, and Q-matrix density with Q-matrix misspecification on parameter estimation was also explored.
The following specific research questions were explored in this study: (a) how do the type and percent of Q-matrix misspecification affect parameter estimation? And (b) are the effects of Q-matrix misspecification (i.e., type and percent) on parameter estimation different across various populations, sample sizes, and Q-matrix densities?
This research has a limited scope based on the nature of the CRELLTM model. First, only the recovery of the cognitive attribute parameters is examined, as the cognitive attribute parameter is the focus of the CRELLTM model. Second, the aggregate means of all cognitive attributes under diverse simulation conditions are investigated as outcome variables instead of individual attribute means. Third, the Rasch-type model is applied, which sets item discrimination to 1 and item guessing to 0 because the CRELLTM is an extension of the Rasch model.
Datasets were simulated based on the LLTM model with random item effects using the SAS/IML package. The population distributions included normal (skewness = 0, kurtosis = 0), negatively-skewed (skewness = −0.5, kurtosis = 3), and positively-skewed (skewness = 0.5, kurtosis = 3) distributions. Person parameter estimates in the CRELLTM were assumed to be normally distributed with the mean freely estimated. However, we were interested in exploring whether the positively or negatively skewed population distributions affect the estimates of cognitive attributes. A skewness of 0.5 or − 0.5 is noticeable but not an extreme deviation from the symmetry, which may occur in educational data (Cassuto, 1996; MacDonald, 2014). Unlike specified attribute parameters, the ability parameters were generated based on Fleishman’s (1978) method. The ability parameter recovery was not the focus of this brief report.
Sample size is an essential factor in research related to the Q-matrix (e.g., Baker, 1993; Cassuto, 1996; MacDonald, 2014). In this study, we chose 50, 250, and 1,000 sample sizes to represent small, moderate, and large samples in the Rasch model context (Baker, 1993). The percentages of misspecification in the Q-matrix were 2.4% (4 out of 168 entries), 4.8% (8 entries), and 9.6% (16 entries). We considered these proportions minor, moderate, and significant levels of misspecifications. These proportions were similar to those in Baker (1993) study. Bake considered 1, 2, and 3% the lower levels and 5, 7.5, and 10% the higher levels. In Rupp and Templin’s (2008) study, which was based on the design of misspecifications for blocks of items, had a similar range from 1.66% (1 out of 60) to 10% (6 out of 60) except 23.33% (14 out of 60) for the balanced misspecification.
Like Rupp and Templin’s (2008) study, there were three types of misspecifications, including over-misspecification (0 s → 1 s), under-misspecification (1 s → 0 s), and balanced-misspecification (0 s → 1 s and 1 s → 0 s). For each condition, 1,000 replications were generated. Parameters in the LLTM with random item effects were estimated by applying the SAS GLIMMIX procedure. The parameters of interest in this study were the estimates of cognitive attributes.
As for attribute parameters, there were two sets of specified attribute parameters for spare and dense Q-matrices in Baker’s (1993) study. However, we only used the attribute parameters for the spare Q-matrix in Bakers’ study as the true attribute parameters in this study to simplify manipulated design factors. The true cognitive attribute parameters for both sparse and dense Q-matrices, therefore, were η1 = 2.152, η2 = 1.229, η3 = −0.468, η4 = 1.907, η5 = 1.051, η6 = 0.086, η7 = 0.141, and η8 = −0.474.
We adopted the sparse and dense Q-matrices in Baker’s (1993) study, which were initially extracted from Fischer’s (1972) and Medina-Diaz’s (1993) studies. In the Q-matrix, 21 items with 8 cognitive attributes were involved. The sparse Q-matrix had only 48 out of 168 entries that contained 1 s (approximately 30% 1 s), whereas the dense Q-matrix had 96 out of 168 entries that contained 1 s (approximately 60% 1 s). These two Q-matrices represented the true Q-matrices. Misspecified entries in the Q-matrix were randomly assigned using SAS based on design factors of misspecification percent and type mentioned in the previous paragraph. For instance, under the 2.4% (4 out of 168) under-misspecified Q-matrix, the SAS program was designed to randomly change four entries in the true Q-matrix from 1 s to 0 s. There were two reasons for randomly assigning misspecifications in the Q-matrics instead of specifically designing misspecifications, as in Rupp and Templin’s (2008) study. First, we were interested in the overall effects of misspecification type and misspecification percent. Second, Rupp and Templin (2008) reported the overall effects of misspecification type without considering specific designs on misspecification, indicating no effect on specific designs.
Three decision criteria were used to assess the sensitivity of the CRELLTM to Q-matrix misspecification, including bias, root mean square error (RMSE), and correlation. The estimation bias was computed as the average difference between the estimated and true parameters. The formula for estimation bias for cognitive attributes is as follows:
The RMSE is the square root of the average squared difference between the estimated and true parameters and was used to detect the magnitude of estimation error. The RMSE formula is as follows:
Person product–moment correlation was used to detect the consistency between the estimated and true sets of parameters. A high correlation coefficient indicates that the estimated parameters are consistent with the true parameters. Finally, factorial ANOVA analyses with the generalized eta-squared effect size were used to examine what manipulated factors affect bias, RMSE, and correlation. Cohen’s moderate effect size of 0.0588 (Cohen, 1988) was applied as the practical significant level.
To explore the effects of Q-matrix misspecification, including type and percent on parameter estimation of cognitive attributes, the boxplots that describe the distribution of bias, RMSE, and correlation for Q-matrix misspecification type and percent were examined. In addition, the eta-squared effect sizes (η2) of the main effects and the first-level interactions with Q-matrix misspecification that were associated with manipulated factors in this study (i.e., sample size, population shape, and Q-matrix density) were computed. A graph of the significant interaction effect was shown as well.
The results of factorial ANOVA analyses with generalized eta-squared effect sizes for estimated bias indicated that the main effect of misspecification types (η2 = 0.3064) and the interaction between type and percent of misspecification (η2 = 0.0743) were significantly associated with the bias of cognitive attribute estimation using the 0.0588 as the practical significant level. The main effect of misspecification percent (η2 = 0.0014) did not emerge as a significant impact on estimated bias. Population shape, Q-matrix density, and sample size did not show an interactive impact with Q-matrix misspecification (i.e., type and percent) on estimated bias either.
The most significant impact of manipulated factors on the estimated bias of cognitive attributes was misspecification type involving under-misspecification, over-misspecification, and balanced misspecification. The distributions of the estimated bias are shown in Figure 1. As shown in Figure 1, the average estimated bias (Mean = −0.0131) for the true Q-matrix was negligible and close to 0. When the Q-matrix was under-misspecified, parameter estimates seemed to yield positive bias (Mean = 0.0607); that is, cognitive attribute parameters were slightly over-estimated when the Q-matrix was misspecified from 1 s to 0 s. In contrast, there was a larger negative bias (Mean = −0.1180) when the Q-matrix was over-misspecified (i.e., from 0 s to 1 s) compared to the under-misspecified Q-matrix. In other words, cognitive attribute parameters tended to be underestimated when there were many Q-matrix entries misspecified from 0 s to 1 s. As for the balanced-misspecified Q-matrix, there was a very small negative bias (Mean = −0.0348). The standard deviations of estimated bias for three types of misspecifications and no misspecification were similar, approximately equal to 0.10.
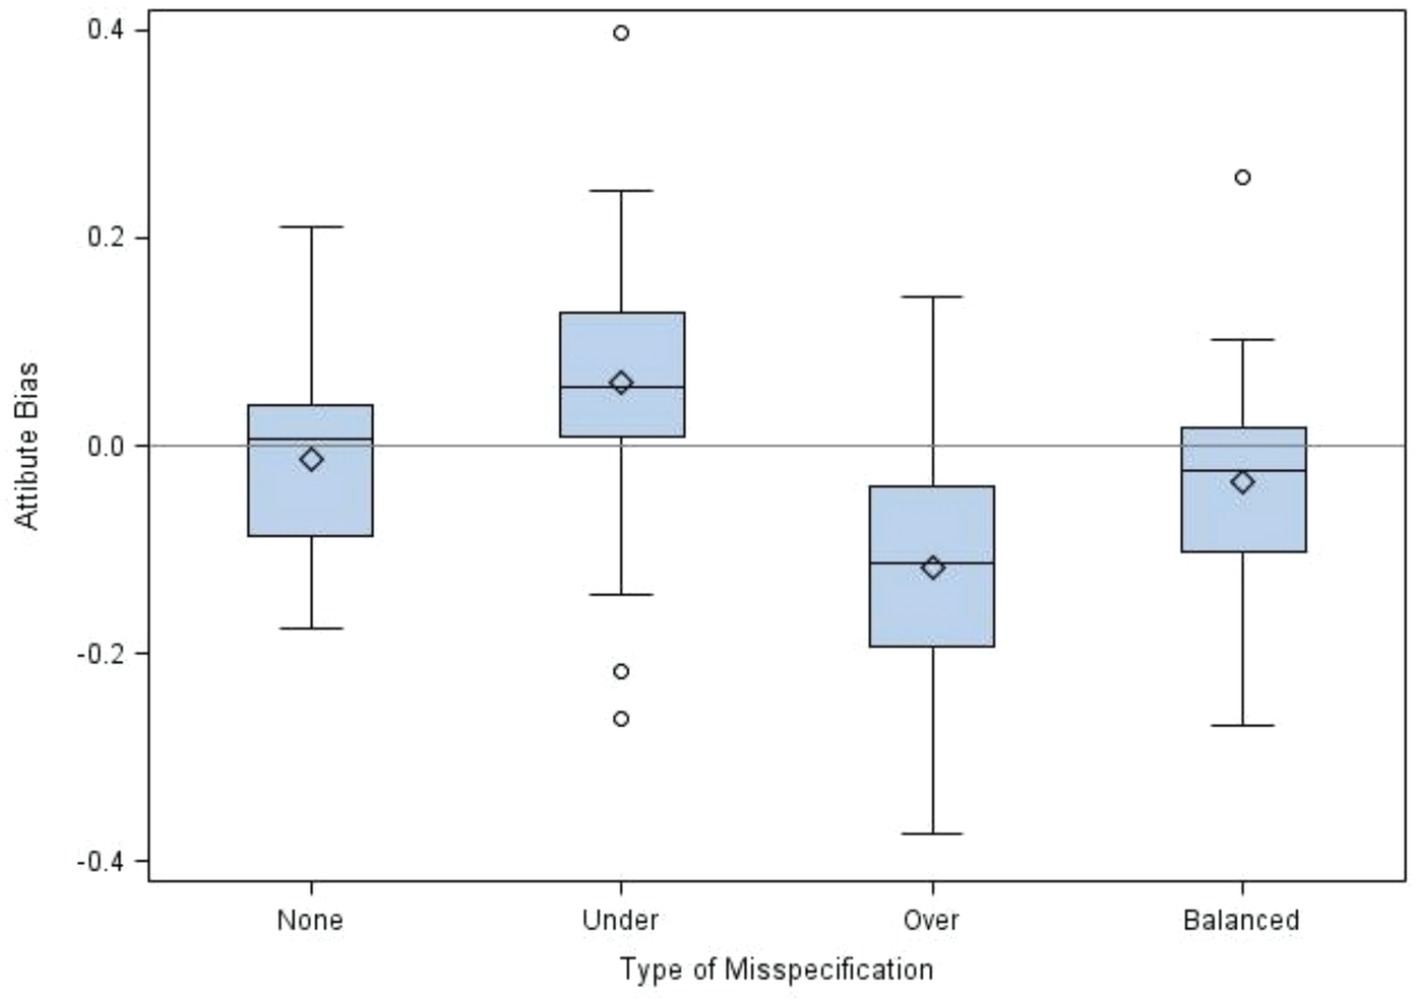
Figure 1. Distributions of estimated bias for cognitive attributes by misspecification type.
The means for 0, 2.4, 4.8, and 9.6% of the Q-matrix entry misspecification are −0.013, −0.026, −0.028, and − 0.038, respectively with the standard deviations of 0.103, 0.108, 0.119, and 0.155, respectively. Estimated bias slightly increased as the misspecification percent increased, but the mean bias differences among different percentages of misspecification were negligible, as evident in the reported eta-squared effect size (η2 = 0.0014). However, misspecification type and percent had a significant interaction effect on the estimated bias (η2 = 0.0743). As shown in Figure 2, the over-misspecification increased bias in the negative direction as the misspecification percentage increased. The under-misspecification also increased bias but in the positive direction as the misspecification rate increased. Compared to the over-misspecification, the increases in bias for the under-misspecification were slightly less. Interestingly, as the misspecification rate increased, the balanced misspecification yielded slightly increased estimated bias in a negative direction.
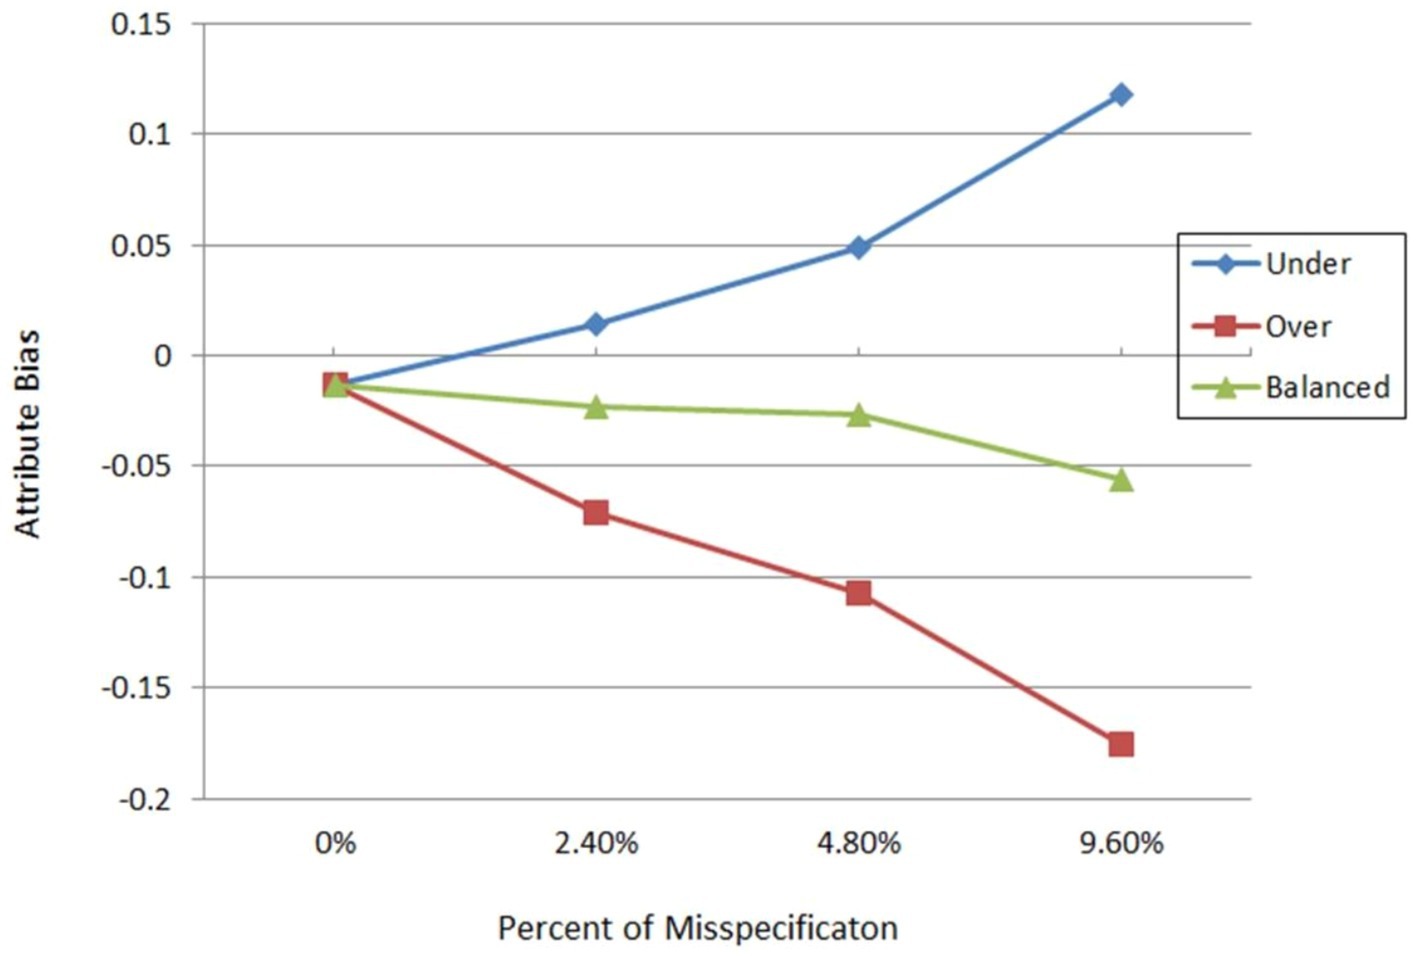
Figure 2. Mean estimated bias by misspecification type and percent.
The eta-squared effect sizes of misspecification factors and interactions with other manipulated factors (i.e., sample size, population shape, and Q-matrix density) for RMSE indicated that the main effects of misspecification percent (η2 = 0.193) and type (η2 = 0.158) were highly associated with RMSE of attribute estimates. Misspecification factors did not show interactions with other manipulated factors regarding estimated RMSE. That is, these other factors (i.e., sample size, population shape, and Q-matrix density) did not affect the impact of Q-matrix misspecification on RMSE of attribute estimates.
Figure 3 displays the distributions of RMSE for cognitive attribute by misspecification percent. The graph showed that the RMSE significantly increased when the percentage of misspecification increased. The RMSE means for 0, 2.4, 4.8, and 9.6% of misspecification in the Q-matrix were 0.54, 0.66, 0.75, and 0.85, respectively. Figure 4 presents the distributions of RMSE for cognitive attribute by misspecification type. The RMSE means for none, under, over, and balanced misspecifications of the Q-matrix were 0.54, 0.77, 0.73, and 0.76, respectively. Larger RMSEs were yielded by three types of misspecifications, compared to no misspecification. However, there seemed to be no differences among the means of RMSE for the three types of misspecifications.
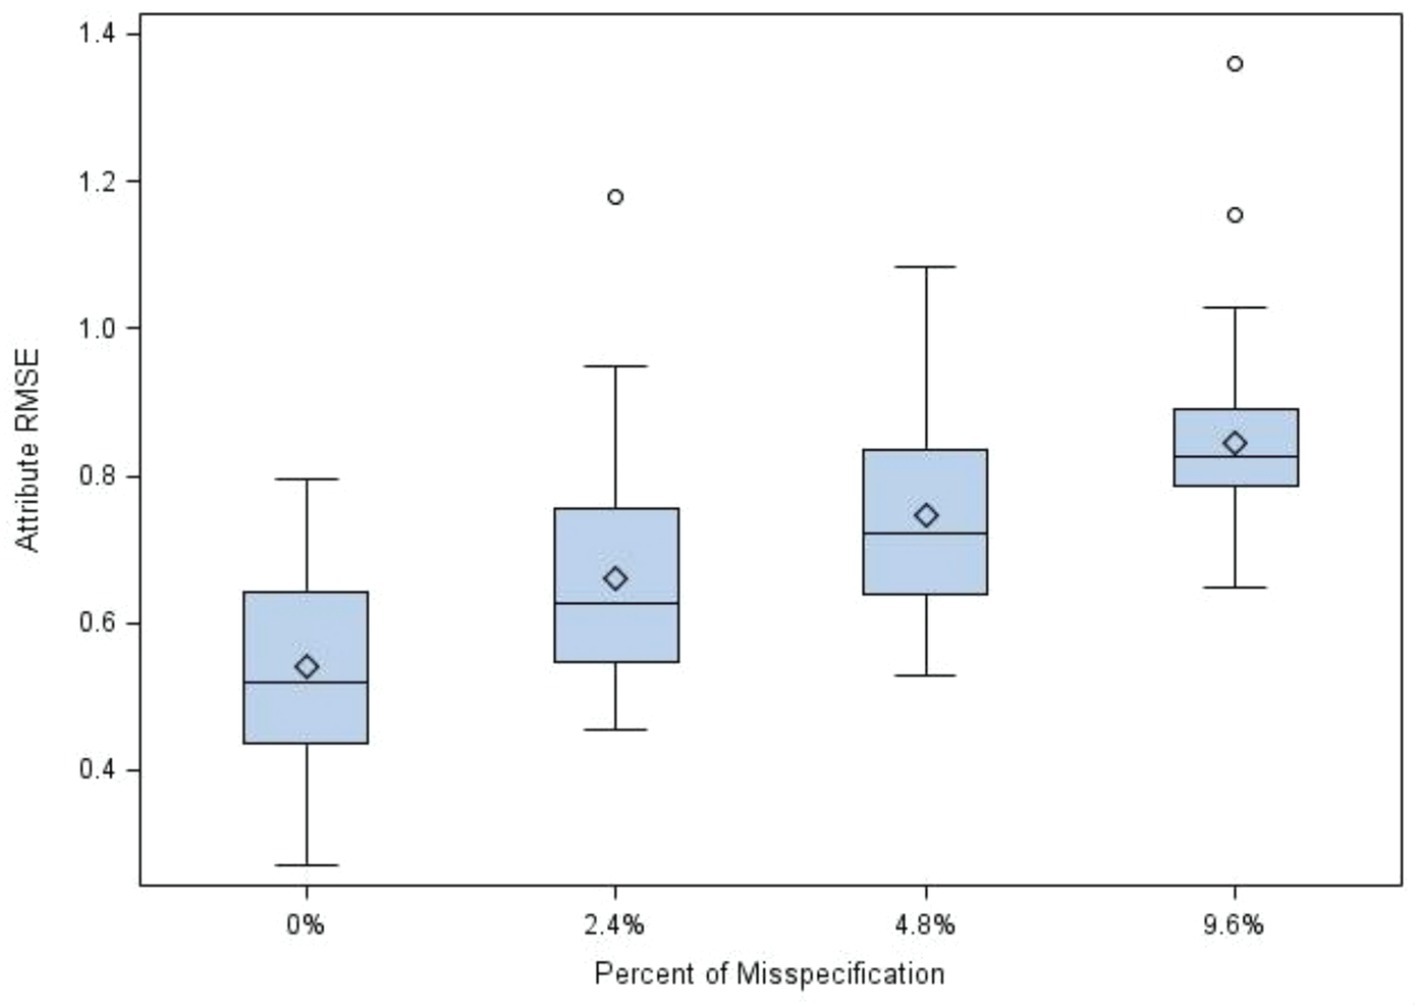
Figure 3. Distributions of RMSE for cognitive attribute by misspecification percent.
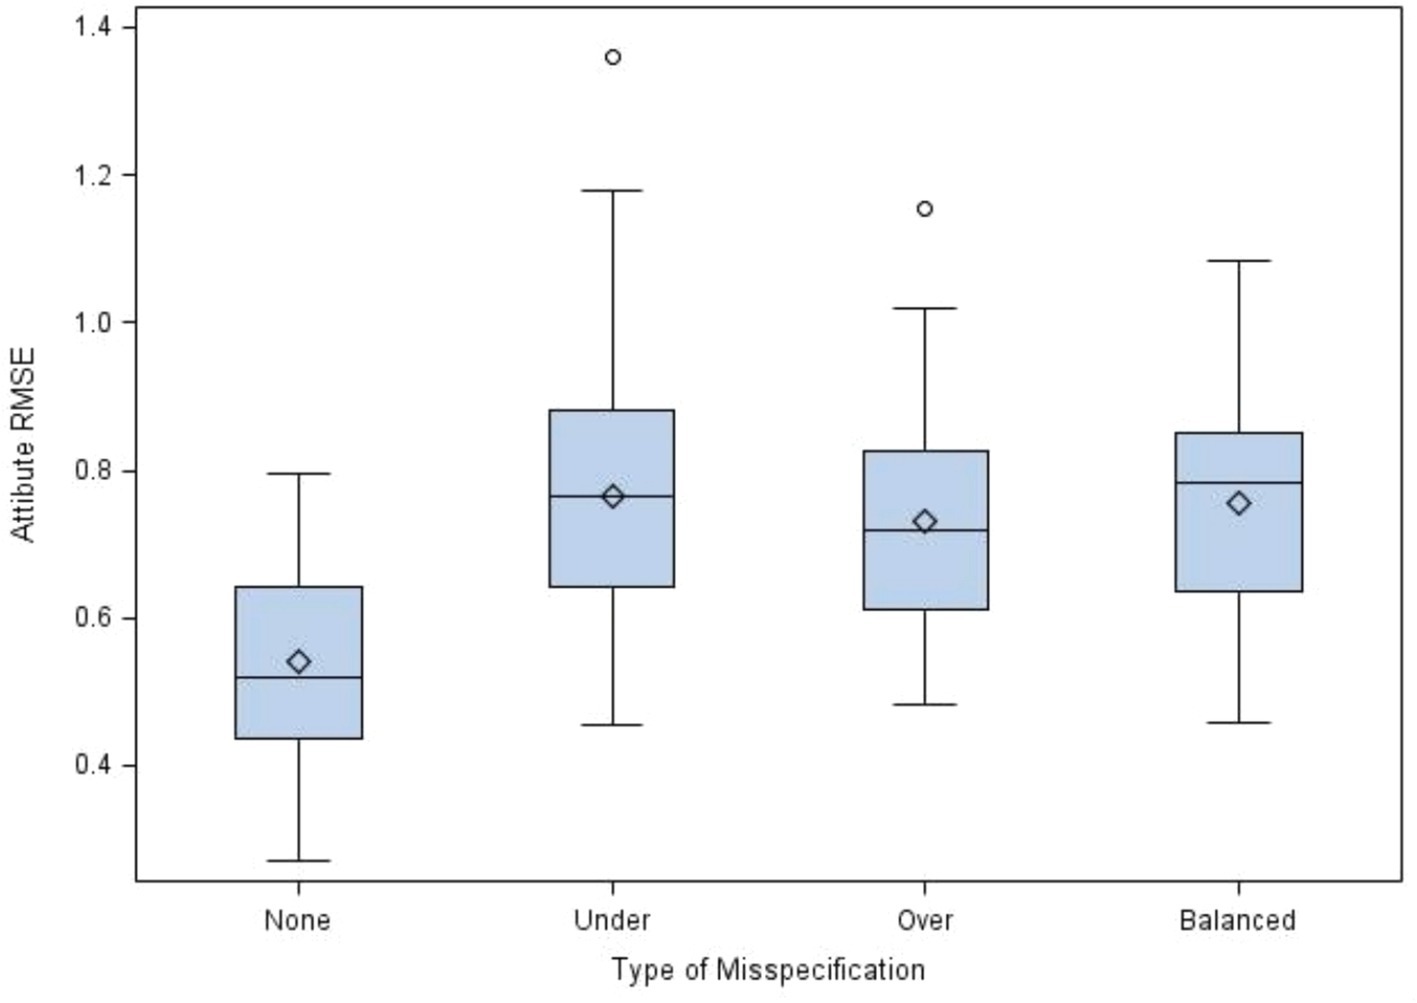
Figure 4. Distributions of RMSE for cognitive attribute by misspecification type.
Unlike bias and RMSE of attribute parameter estimates, misspecification factors (i.e., percent and type) showed a small impact on attribute correlations between estimated and true attribute parameters (η2 = 0.0131 and 0.0066, respectively). The effects of interactions between misspecification factors and manipulated factors on attribute correlation did not reach the cutoff value of the eta-squared effect size (i.e., all η2 values < 0.0588).
The mean correlations for 0, 2.4, 4.8, and 9.6% of the Q-matrix misspecification were 0.86, 0.87, 0.88, and 0.89, respectively, indicating no effects of misspecification percent on attribute correlations. Similarly, the mean correlations for zero, under, over, and balanced misspecifications were 0.86, 0.88, 0.89, and 0.88, respectively.
The linear logistic test model, one of the explanatory item response models, is a well-known method for estimating cognitive attribute parameters with the purpose of decomposing item difficulty. As Embretson and Daniel (2008) and other researchers (e.g., Baghaei and Kubinger, 2015; Chen et al., 2011) indicated, it offers several advantages in educational measurement. First, the LLTM enables researchers to empirically test hypotheses about required knowledge, skills, and abilities (KSAs; Chen et al., 2008) for solving test items, which explicates the construct representation of test items (Embretson and Reise, 2000). For instance, Yuan and Engelhard (2023) applied the LLTM to investigate cognitive complexity and linguistic cohesion in science items. Second, the LLTM can be used to explore the features of the required KSAs so these KSAS can be manipulated for item development, test design, and item bank construction, which means providing a basic foundation for item generation, test design, and item bank (Hornke and Habon, 1986).
The LLTM with random item effects, also known as the crossed random effects LLTM or CRELLTM, has been developed to address a limitation of the LLTM: the assumption that the variances of item difficulty are entirely explained by cognitive attributes (Rijmen and De Boeck, 2002). However, the sensitivity of this model to the misspecification of the Q-matrix in terms of cognitive attribute estimates using the SAS GLIMMIX procedure has not yet been examined. This study aimed to provide practitioners and researchers with insight into the CRELLTM model and the utility of the SAS GLIMMIX procedure.
The results indicated that, without Q-matrix misspecifications, cognitive attributes of the CRELLTM can be estimated precisely with the SAS GLIMMIX procedure, as evidenced by a mean bias close to 0 and a high correlation between the estimated and true cognitive parameters. However, as the percentage of misspecification in the Q-matrix increased, the impacts on attribute estimate RMSE increased substantially. In this study, the magnitude of the RMSE in attribute estimates dramatically increased with higher misspecification percentages in the Q-matrix. Compared to the condition of no misspecification, the over-, under-, and balanced-misspecifications had substantial increases in RMSE. This finding is consistent with other relevant studies (e.g., Baker, 1993; Cassuto, 1996; Green and Smith, 1987; MacDonald, 2014), which found that cognitive attribute parameters are sensitive to Q-matrix misspecifications, even with lower-level misspecifications (e.g., 3% or less; Baker, 1993). This consistent finding underscores the importance of accurate Q-matrix specification in attribute parameter estimation. As for misspecification type, there were no differences in RMSE’s magnitude between the three types of misspecifications (i.e., all RMSEs were around 0.75).
Interestingly, this study found an interaction effect on bias between misspecification type and misspecification percent, indicating that different types of misspecification yielded bias differently. Specifically, with an over-misspecified Q-matrix (i.e., 0 s were misspecified as 1 s), attribute parameters tended to be underestimated. Conversely, attributes were overestimated with an under-misspecified Q-matrix (i.e., 1 s were misspecified as 0 s). Furthermore, as the percentage of misspecification increased, over-misspecifications resulted in slightly higher bias compared to under-misspecifications. In the case of balanced misspecification (i.e., some 1 s were misspecified as 0 s and an equal number of 0 s as 1 s), attribute estimated bias slightly increased negatively as the misspecification percentage increased. This may be due to the balancing effect of over- and under-misspecifications. Since over-misspecification had a slightly larger impact than under-misspecification, the balanced misspecification of the Q-matrix resulted in a small, negative bias. This interesting finding has not been reported in existing studies.
Regarding attribute estimate correlation between estimated and true parameters, misspecification factors had no impact on it. In other words, regardless of different types or percentages of misspecification in the Q-matrix, the attribute estimates and the corresponding true parameters were highly consistent, which means that the relative difficulties (or sample estimates’ order) for cognitive attributes were consistent with the true attribute difficulties (or population parameters’ order).
We also investigated other manipulated factors (i.e., sample size, Q-matrix density, and population distribution) in this study, and all these factors showed no impact on RMSE, bias, or correlation. These findings may or may not be in line with other studies. Baker (1993) found that a dense Q-matrix with misspecifications yielded RMSE for attribute parameter estimates that were approximately half as large as those obtained with a sparse Q-matrix. Furthermore, as the sample size increased, the RMSE decreased for the dense Q-matrix in almost all conditions. Cassuto (1996) found that with larger samples or orthogonal-dense Q-matrix, attribute parameter estimates had smaller RMSE magnitudes and higher correlations. Green and Smith (1987) and MacDonald (2014) indicated that as long as there are large enough samples, the LLTM appears robust to Q-matrix misspecifications. In MacDonald’s (2014) study, some findings align with the findings in this study. He concluded that the LLTM is robust to the density of the Q-matrix and to the ability distributions with minor skewness.
The Q-matrix is an indispensable element in applying CRELLTM. Exploring the quality of the Q-matrix and the impact of misspecifications is crucial. Generally speaking, this simulation study suggests that misspecification type and percent do have a considerable impact on the bias and RMSE of attribute estimates in the crossed random effects LLTM using the SAS GLIMMIX procedure, especially under the conditions of high percent misspecification and over-misspecification. Fortunately, the attribute correlation between the estimated and true parameters is not affected by misspecification type and misspecification percent. Other factors, such as sample size, the density of the Q-matrix, and ability distribution, do not impact attribute parameter estimation. Overall, this study contributes to the growing body of literature on Q-matrix misspecification, offering valuable insights and practical recommendations for improving the accuracy and reliability of attribute parameter estimates.
Based on the findings from this study and other relevant studies, there are several important and practical implications. First, this study and others show that cognitive attribute parameters are highly sensitive to Q-matrix misspecifications and highlight the critical need for precise and accurate Q-matrix specification. Even a few misspecifications in the Q-matrix can lead to significant impacts on attribute estimates. For researchers and practitioners, these findings emphasize the necessity of rigorous validation and careful construction of the Q-matrix. Ensuring the accuracy of the Q-matrix can lead to more reliable and valid interpretations of students’ cognitive attributes, ultimately improving the quality of educational assessments.
Second, this study indicates that different types of misspecifications (e.g., over- and under-misspecifications) affect attribute estimates differently. This highlights the need for careful consideration of the potential type of misspecification when interpreting cognitive attribute parameters. Furthermore, the finding that all types of misspecifications resulted in similar RMSE magnitudes suggests that the type of misspecification may not be as critical as the presence of misspecification itself. This implies that efforts should focus on reducing overall misspecification rather than prioritizing one type over another.
Third, the LLTM with random item effects might be preferred over the LLTM without random effects. Incorporating random effects allows for modeling item-specific variations not explained by the cognitive attributes alone, leading to more accurate and realistic parameter estimates by accounting for the inherent variability in item difficulties (Kim and Wilson, 2020). For example, this study found that the LLTM with random item effects provided a nuanced understanding of bias and RMSE (e.g., the significant interaction effect on bias, uniform RMSE for misspecification type), which have not been captured by models without random effects (e.g., Baker, 1993; Cassuto, 1996; MacDonald, 2014). Additionally, this study indicates that using the SAS GLIMMIX procedure with a scaling constraint on item parameters to implement the CRELLTM can make the model robust to Q-matrix misspecifications with variations in sample size, Q-matrix density, and minor skewed ability distribution. This further demonstrates the advantages and strengths of the CRELLTM and the feasibility of the SAS GLIMMIX procedure.
Overall, these implications highlight the importance of precision and careful consideration in the specification of Q-matrices when applying CRELLTM. They also provide valuable guidance for practical applications in the field of educational testing.
This study includes several fixed variables, such as the number of items, attributes, and correlations among cognitive attributes. These variables are often manipulated in other relevant studies (e.g., Baker, 1993; Cassuto, 1996; Green and Smith, 1987; MacDonald, 2014). Some manipulated variables in this study have limited levels. For example, only two minor skewed ability distributions and randomly assigned misspecifications. These factors form the limitations of this study. Future research can expand the research design to investigate the impact of Q-matrix misspecifications on the CRELLTM model more thoroughly. First, future research should explore a wider range of misspecification patterns, including more complex combinations of under- and over-misspecification and well-designed misspecification patterns (Rupp and Templin, 2008). This will provide a more comprehensive understanding of how different types of misspecifications affect attribute parameter estimates (Baghaei and Ravand, 2015). Second, future research should design various Q-matrix conditions with different numbers of items and attributes and correlations among attributes. For instance, Cassuto’s (1996) and Green and Smith’s (1987) studies indicate different impacts of misspecifications on orthogonal and correlated Q-matrics. Third, future research should investigate the impact of more extreme skewness levels on parameter estimates to better understand how these distributions affect the influence of misspecifications on attribute parameter estimation in diverse educational settings (Lee and Park, 2018). Fourth, future research should apply the LLTM with random item effects to real-world educational data to validate the findings from simulation studies. This will help assess the practical applicability and robustness of the model in real assessment contexts (Krell et al., 2021).
Finally, the outcome variable in this study focused on attribute parameters. As seen in other studies (e.g., Cassuto, 1996; MacDonald, 2014), Future research can also investigate item difficulty and ability parameter recovery with the influence of Q-matrix misspecifications. This study applied the LLTM with random item effects for binary data. Future research can use the same research design and apply the same measurement model for polytomous data (e.g., Kim and Wilson, 2020). The CRELLTM is an extension of the Rasch model. Future research can explore the effects of item discrimination and guessing with Q-matrix misspecifications on cognitive attribute estimation using the CRELLTM.
The original contributions presented in the study are included in the article. Further inquiries can be directed to the corresponding author.
Y-HC: Conceptualization, Formal analysis, Investigation, Methodology, Software, Supervision, Visualization, Writing – original draft, Writing – review & editing. IL: Formal analysis, Software, Visualization, Writing – original draft, Writing – review & editing. CC: Formal analysis, Software, Visualization, Writing – original draft, Writing – review & editing. YW: Formal analysis, Software, Visualization, Writing – original draft, Writing – review & editing.
The author(s) declare that no financial support was received for the research, authorship, and/or publication of this article.
The authors declare that the research was conducted in the absence of any commercial or financial relationships that could be construed as a potential conflict of interest.
The author(s) declare that Microsoft Copilot was used to search for relevant literature and to check and rephrase the writing.
All claims expressed in this article are solely those of the authors and do not necessarily represent those of their affiliated organizations, or those of the publisher, the editors and the reviewers. Any product that may be evaluated in this article, or claim that may be made by its manufacturer, is not guaranteed or endorsed by the publisher.
Baghaei, P., and Kubinger, K. D. (2015). Linear logistic test modeling with R. Pract. Assess. Res. Eval. 20:1. doi: 10.7275/8f33-hz58
Baghaei, P., and Ravand, H. (2015). A cognitive processing model of reading comprehension in English as a foreign language using a linear logistic test model. Learn. Individ. Differ. 43, 100–105. doi: 10.1016/j.lindif.2015.09.001
Baker, F. B. (1993). Sensitivity of the linear logistic test model to misspecification of the weight matrix. Appl. Psychol. Meas. 17, 201–210. doi: 10.1177/014662169301700301
Black, R. A., and Butler, S. F. (2012). Using the GLIMMIX procedure in SAS 9.3 to fit a standard dichotomous Rasch and hierarchical 1-PL IRT model. Appl. Psychol. Meas. 36, 237–248. doi: 10.1177/0146621612441857
Brandt, S. (2008). Estimation of a Rasch model including subdimensions. in M. von Davier and D. Hastedt (Eds.), IERI monograph series: Issues and methodologies in large-scale assessments, Volume, United States/Germany: IEA-ETS Research Institute. 1, 51–70.
Cassuto, N. (1996). The performance of the linear logistic test model under different testing conditions (publication no. 9711393) [doctoral dissertation]. Minneapolis, MN: University of Minnesota.
Chen, Y.-H., Gorin, J. S., Thompson, M. S., and Tatusoka, K. K. (2008). Cross-cultural validity of the TIMSS-1999 mathematics test: verification of a cognitive model. Int. J. Test. 8, 251–271. doi: 10.1080/15305050802262217
Chen, Y.-H., MacDonald, G., and Leu, Y.-C. (2011). Validating cognitive sources of mathematics item difficulty: application of the LLTM to fraction conceptual items. Int. J. Educ. Psychol. Assessment 7, 74–93.
Cohen, J. (1988). Statistical power analysis for the behavioral sciences. 2nd Edn. New York, NY: Academic Press.
Chen, Y.-H. (2012). Cognitive diagnosis of mathematics performance between rural and urban students in Taiwan. Assessment in Education, 19, 193–209. doi: 10.1080/0969594X.2011.560562
Chen, Y.-H. (2006). Cognitively diagnostic examination of Taiwanese mathematics achievement on TIMSS-1999 [Unpublished Doctoral Dissertation]. Arizona State University.
Cronbach, L. J., and Meehl, P. E. (1955). Construct validity in psychological tests. Psychological Bulletin, 52, 281–302. doi: 10.1037/h0040957
De Boeck, P. (2008). Random item IRT models. Pschometrika 73, 533–559. doi: 10.1007/s11336-008-9092-x
De Boeck, P., and Wilson, M. (2004). A framework for item response models. In P. BoeckDe and M. Wilson, (eds.), Explanatory item response models: A generalized linear and nonlinear approach (pp.1–41). New York, NY: Springer
de la Torre, J. (2008). An empirically based method of Q-matrix validation for the DINA model: development and applications. J. Educ. Meas. 45, 343–362. doi: 10.1111/j.1745-3984.2008.00069.x
DiBello, L. V., Roussos, L. A., and Stout, W. (2007). “Review of cognitively diagnostic assessment and a summary of psychometric models” in Handbook of statistics Psychometrics. eds. C. R. Rao and S. Sinharay (Amsterdam: Elsevier), 979–1030.
Effatpanah, F., and Baghaei, P. (2021). Cognitive components of writing in a second language: an analysis with the linear logistic test model. Psychol. Test Assess. Model. 63, 13–44.
Embretson, S. E., and Daniel, R. C. (2008). Understanding and quantifying cognitive complexity level in mathematical problem solving items. Psychol. Sci. Q. 50, 328–344.
Embretson, S. E., and Reise, S. P. (2000). Item response theory for psychologists. Mahwah, NJ: Erlbaum.
Embretson, S. E., and Gorin, J. (2001). Improving construct validity with cognitive psychology principles. Journal of Educational Measurement, 38, 343–368. doi: 10.1111/j.1745-3984.2001.tb01131.x
Feuerstahler, L., and Wilson, M. (2019). Scale alignment in between-item multidimensional Rasch models. J. Educ. Meas. 56, 280–301. doi: 10.1111/jedm.12209
Fischer, G. H. (1972). Conditional maximum-likelihood estimations of item parameters for a linear logistic test model. Research bulletin. Vienna: Psychological Institute University of Vienna.
Fischer, G. H. (1973). The linear logistic test model as an instrument in educational research. Acta Psychol. 37, 359–374. doi: 10.1016/0001-6918(73)90003-6
Fischer, G. H. (1995). “The linear logistic test model” in Rasch Models. eds. G. H. Fischer and I. W. Molenaar (New York, NY: Springer).
Fleishman, A. (1978). A method for simulating non-normal distributions. Psychometrika 43, 521–532. doi: 10.1007/BF02293811
Green, K., and Smith, R. M. (1987). A comparison of two methods of decomposing item difficulties. J. Educ. Stat. 12, 369–381. doi: 10.3102/10769986012004369
Hartig, J., Frey, A., Nold, G., and Klieme, E. (2012). An application of explanatory item response modeling for model-based proficiency scaling. Educ. Psychol. Meas. 72, 665–686. doi: 10.1177/0013164411430707
Hoijtink, H., and Boomsma, A. (1995). “On person parameter estimation in the dichotomous Rasch model” in Rasch models. eds. G. H. Fischer and I. W. Molenaar (Cham: Springer), 53–68.
Hornke, L. F., and Habon, M. W. (1986). Rule-based item Bank construction and evaluation within the linear logistic framework. Appl. Psychol. Meas. 10, 369–380. doi: 10.1177/014662168601000405
Janssen, R., Schepers, J., and Peres, D. (2004). Models with item and item group predictors. In P. BoeckDe and M. Wilson (Eds.), Explanatory item response models: A generalized linear and nonlinear approach (pp. 189–212). New York, NY: Springer,
Janssen, R., Tuerlinckx, F., Meulders, M., and DeBoeck, P. (2003). A hierarchical IRT model for criterion-referenced measurement. J. Educ. Behav. Stat. 25, 285–306. doi: 10.3102/10769986025003285
Kim, J., and Wilson, M. (2020). Polytomous item explanatory IRT models with random item effects: concepts and an application. Measurement 151:107062. doi: 10.1016/j.measurement.2019.107062
Krell, M., Khan, S., and van Driel, J. (2021). Analyzing cognitive demands of a scientific reasoning test using the linear logistic test model (LLTM). Educ. Sci. 11:472. doi: 10.3390/educsci11090472
Kubinger, K. (2008). On the revival of the Rasch-model based LLTM: from constructing tests using item generating rules to measuring item administration effects. Psychol. Sci. Q. 50, 311–327.
Lee, Y., and Park, I. (2018). Random item response model approaches to evaluating item format effects. J. Stu. Educ. 8, 98–111. doi: 10.5296/jse.v8i3.13387
Li, I. Y., Chen, Y.-H., and Kromrey, J. D. (2013). Evaluating the performance of the SAS® GLIMMIX procedure for dichotomous Rasch model: a simulation study. Southeast SAS users group 2013 proceedings (paper SD-10). Cary, NC: SAS Institute Inc.
MacDonald, G. (2014). The performance of the linear logistic test model when the Q-matrix is misspecified: a simulation study [doctoral dissertation]. Tampa, FL: University of South Florida.
Ma, L., and Green, K. E. (2017). Q-Matrix optimization based on the linear logistic test model. Journal of Applied Measurement, 18, 247–267.
Medina-Diaz’s, M. (1993). Analysis of Cognitive Structure Using the Linear Logistic Test Model and Quadratic Assignment. Applied Psychological Measurement, 17, 117–130. doi: 10.1177/014662169301700202
Pan, T., and Chen, Y. (2019). “Using SAS® procedures to fit Rasch models,” in SAS Global Forum Proceedings 2019. Dallas, Texas.
Rijmen, F., and De Boeck, P. (2002). The random weights linear logistic test model. Appl. Psychol. Meas. 26, 271–285. doi: 10.1177/0146621602026003003
Rupp, A. A., and Templin, J. L. (2008). The effects of Q-matrix misspecification on parameter estimates and classification accuracy in the DINA model. Educ. Psychol. Meas. 68, 78–96. doi: 10.1177/0013164407301545
Rupp, A. A., Templin, J. L., and Henson, R. A. (2010). Diagnostic measurement: Theory, methods, and applications. London: Guilford Press.
Sheu, C., Chen, C., Su, Y., and Wang, W. (2005). Using SAS PROC NLMIXED to fit item response theory models. Behav. Res. Methods 37, 202–218. doi: 10.3758/BF03192688
Scheiblechner, H. (1972). Personality and system influences on behavior in social contexts: Frequency models. Acta Psychologica, 36, 322–336. doi: 10.1016/0001-6918(72)90014-5
Stout, W. (2002). Psychometrics: From practice to theory and back. Psychometrika, 67, 485–518. doi: 10.1007/BF02295128
Tan, T. K., Luo, W., and Hogan, D. (2011). Rasch model and beyond with PROC GLIMMIX: a better choice. SAS global forum proceedings. Cary, NC: SAS Institute Inc.
Tatsuoka, K. K. (2009). Cognitive assessment: An introduction to the rule space method. New York, NY: Taylor and Francis.
Wang, W.-C., and Jin, K.-Y. (2010). Multilevel, two-parameter, and random-weights generalizations of a model with internal restrictions on item difficulty. Appl. Psychol. Meas. 34, 46–65. doi: 10.1177/0146621608329505
Yuan, Y., and Engelhard, G. (2023). “Using linear logistic Rasch models to examine cognitive complexity and linguistic cohesion in science items” in Advances in applications of Rasch measurement in science education: Contemporary trends and issues in science education. eds. X. Liu and W. J. Boone (Cham: Springer International Publishing), 455–482.
Keywords: crossed random effects, linear logistic test model, simulation, Q-matrix misspecification, SAS GLIMMIX
Citation: Chen Y-H, Li IY, Cao C and Wang Y (2025) Accuracy of attribute estimation in the crossed random effects linear logistic test model: impact of Q-matrix misspecification. Front. Educ. 10:1506674. doi: 10.3389/feduc.2025.1506674
Edited by:
Yan Liu, Carleton University, CanadaReviewed by:
Manqian Liao, Duolingo, United StatesCopyright © 2025 Chen, Li, Cao and Wang. This is an open-access article distributed under the terms of the Creative Commons Attribution License (CC BY). The use, distribution or reproduction in other forums is permitted, provided the original author(s) and the copyright owner(s) are credited and that the original publication in this journal is cited, in accordance with accepted academic practice. No use, distribution or reproduction is permitted which does not comply with these terms.
*Correspondence: Yi-Hsin Chen, eWNoZW41QHVzZi5lZHU=; Isaac Y. Li, aXNhYWMubGlAYW5hLm9yZw==
Disclaimer: All claims expressed in this article are solely those of the authors and do not necessarily represent those of their affiliated organizations, or those of the publisher, the editors and the reviewers. Any product that may be evaluated in this article or claim that may be made by its manufacturer is not guaranteed or endorsed by the publisher.
Research integrity at Frontiers
Learn more about the work of our research integrity team to safeguard the quality of each article we publish.