 Lucas Silva
 Maritté Tagle
94% of researchers rate our articles as excellent or good
Learn more about the work of our research integrity team to safeguard the quality of each article we publish.
Find out more
ORIGINAL RESEARCH article
Front. Educ., 12 March 2025
Sec. Digital Education
Volume 10 - 2025 | https://doi.org/10.3389/feduc.2025.1406699
Digital assessment data’s increasing prevalence in schools offers a powerful tool to enhance educational outcomes, yet its adoption by teachers varies widely. For the first time, an extended version of the Technology Acceptance Model (TAM) was used in a Chilean sample to explore the factors that explain teachers’ use of digital assessment data. An online survey was conducted with 319 teacher users of Lirmi, a consolidated online educational platform with a student assessment module. Using Structural Equation Modeling (SEM), we found that TAM remains a robust and parsimonious framework for explaining teachers’ adoption of digital monitoring systems in a global southern country. While attitudes toward using the system, intention to use it, and perceived usefulness emerged as key predictors (consistent with prior TAM studies) the study provides novel insights by validating TAM in a real-world K-12 educational setting with a commercial product. Importantly, facilitating conditions were found to explain perceived ease of use, and subjective norms significantly influenced perceived usefulness, underscoring the role of infrastructure and peer influence. The results highlight the need for policymakers, school administrators, and ed-tech providers to ensure proper support to foster teachers’ adoption of digital monitoring systems. By extending TAM’s applicability to the Chilean context, this study contributes to understanding how teachers adopt digital tools for assessment in a specific national setting that remains underexplored in the literature.
Digital technology’s integration in schools has created various tools for collecting and utilizing student assessment data (Wayman et al., 2017). Termed digital monitoring systems (Faber et al., 2022), these platforms enable teachers to gather and present student assessment data on online dashboards throughout the academic year.
Chilean schools increasingly embrace digital monitoring systems as regional connectivity and infrastructure improve [Ministerio de Educación (MINEDUC), 2020]. These systems offer a solution to the shortage of professional staff for school data management tasks (Breiter and Light, 2006), providing access to data without the associated burdens.
In digital monitoring systems, teachers can view assessment data in various layers, including comparisons with similar schools, growth of students’ achievement at the course and student level, strengths and challenges for each class and student, and individual reports of students with their results (Faber et al., 2022; Van Leeuwen et al., 2021). Thus, digital assessment data presented in digital monitoring systems can be seen as an application of learning analytics, understood as “the measurement, collection, analysis and reporting of data about learners and their contexts, for purposes of understanding and optimizing learning and the environments in which it occurs” (Siemens and Gasevic, 2012, p. 1).
The field of data-informed decision-making and learning analytics suggests that teachers can make more informed pedagogical decisions using data from students’ learning as a complement to their experience and intuition (Earl and Katz, 2006; Schildkamp, 2019). In fact, two recent meta-analyses found that using data from digital monitoring systems could be an effective tool for improving student achievement (Faber et al., 2022; Fuchs et al., 2024).
Since its launch in 2013, Lirmi has become a prominent cloud-based educational platform in Chile, serving over 3,000 schools (Lirmi, 2023). Lirmi offers a range of modules, including lesson planning, attendance tracking, discipline management, surveys, and communication with families. A key module of the platform is its digital monitoring system (or evaluation module for short), which allows teachers to conduct digital assessments or manually input results from pen-and-paper evaluations. Teachers can analyze assessment outcomes by achievement level, class, or individual students, helping them identify patterns in student performance, such as specific areas of difficulty. Lirmi is hosted on Amazon Web Services (AWS) and Microsoft Azure, ensuring scalability and security, and operates on a subscription-based model, with costs varying based on the number of enrolled students and selected modules.
Despite the increasing availability of student assessment data through digital platforms like Lirmi (Faber et al., 2022), there are significant variations in how teachers utilize these tools (Fuchs et al., 2024). Simply having access to digital monitoring systems does not guarantee their effective use in instructional decision-making (Hase and Kuhl, 2024), indicating that many teachers may not take advantage of the benefits of data to support student learning.
To reach the potential for using data in education, it is important to pay attention to the factors that explain the variation in teachers’ use of digital monitoring systems. So, the goal of this study is to analyze the factors that explain teachers’ use of Lirmi’s digital monitoring system. Thus, the research question we address in this study is, what factors explain teachers’ use of digital monitoring systems among Lirmi users? This research question will be answered using the Technology Acceptance Model (TAM) (Davis, 1989), a proven framework for explaining the use of educational technology (Scherer and Teo, 2019).
Although the TAM has been widely used to elucidate educational technology adoption, most studies have been conducted in Asia, with limited research in Latin America (Granić and Marangunić, 2019; Scherer and Teo, 2019). Testing TAM in diverse contexts is crucial due to potential shifts in variable weights influenced by cultural and infrastructural differences. In addition, no prior studies in Chile have specifically explored factors predicting the use of assessment data in digital monitoring systems. Moreover, this study also departs from the typical focus on prototypes or research-developed tools (Cechinel et al., 2020) and university-level e-learning systems (e.g., Naveed et al., 2020) by analyzing a commercial product widely adopted in K-12 schools in Chile. By addressing these gaps, this study provides empirical evidence on technology adoption in an underexplored context, offering insights that can inform policy decisions, platform development, and teacher professional development.
The use of assessment data is an important tool for enhancing teaching and learning (Black and Wiliam, 1998; Hattie, 2009). Assessment data are any information about student achievement collected by different means, such as written and oral exams, standardized tests, and portfolios (Lai and Schildkamp, 2013). Faber et al. (2022) conducted a meta-analysis to measure the effects of digital monitoring systems on students’ achievement. After selecting studies using a rigorous set of criteria (e.g., randomized control trials and tests for dependent variables not developed by researchers), they concluded that digital monitoring systems moderately impact students’ achievement (ES = 0.12).
However, the advantages of digital assessment data displayed in digital monitoring systems cannot always be leveraged because the variability in the use of assessment data varies significantly among teachers (Abdusyakur and Poortman, 2019; Albiladi et al., 2020; Datnow et al., 2012; Farrell and Marsh, 2016; Michos et al., 2023). Some studies in data-informed decision-making have used the Theory of Planned Behavior (Ajzen, 1991) to explain teachers’ use of data. For example, Prenger and Schildkamp (2018) found in a sample of teachers from the Netherlands that perceived behavioral control predicted instructional data use, and intention to use data was predicted by affective attitude (called attitude in TAM) and instrumental attitude (called perceived usefulness in TAM). Among pre-service teachers in Singapore, Teo and Tan (2012) found that attitudes toward technology had the greatest influence on the intention to use technology.
Hase et al. (2022) explored primary school teachers’ use of data from digital learning platforms in Germany. They found that the attitude toward data from the platform was the most predictive factor for the intention to use the data. In addition, their results showed that the use of data from the digital learning platform was predicted by the intention to use it, subjective norms, and perceived behavioral control. Mavroudi et al. (2021) used TAM to understand teachers’ perceptions of learning analytics. The analysis showed that participants recognized the utility of learning analytics, but were still skeptical about its adoption. Finally, Michos et al. (2023) found that 84% of teachers have access to digital analytics platforms, although they declare low usage. Their study showed that teachers differ in using digital data based on their positive beliefs towards digital technologies, self-perceived competency in using these platforms, availability of technologies in the school, and the frequency of using digital devices in lessons by students.
The following section aims to describe the Technology Acceptance Model (TAM) and establish its relevance in understanding educators’ utilization of digital assessment data.
The TAM is one of the most important theories for understanding and predicting the use of technology in education (Granić and Marangunić, 2019; Scherer et al., 2019). Developed first by Davis (1989) and later improved (e.g., Venkatesh et al., 2003; Venkatesh and Davis, 2000), the theory posits that perceived usefulness, perceived ease of use, and attitudes toward technology are key determinants of behavioral intention to use a technology, which in turn influences actual technology use.
Building on the original TAM, we integrated external variables from the Unified Theory of Acceptance and Use of Technology (UTAUT) (Venkatesh et al., 2003) to enhance the predictive power of our model. The variables included are subjective norms, computer self-efficacy, and facilitating conditions. We have added these variables to the model, which are also supported by literature in the field of data-informed decision-making. It has been found that subjective norms and facilitating conditions in schools, such as organizational support and infrastructure, positively influence the use of data (Prenger and Schildkamp, 2018; Schildkamp et al., 2017).
Our model also considers relationships between variables found by Scherer and Teo (2019), who use typical path models that exhibit the hypothesized relations depicted in Figure 1. For example, they found a direct effect between PU and BI, but the ATT-to-USE effect was not in the original version of the TAM. However, empirical evidence shows that BI and USE can be explained better by adding these direct effects. We consider these findings and add them to the model.
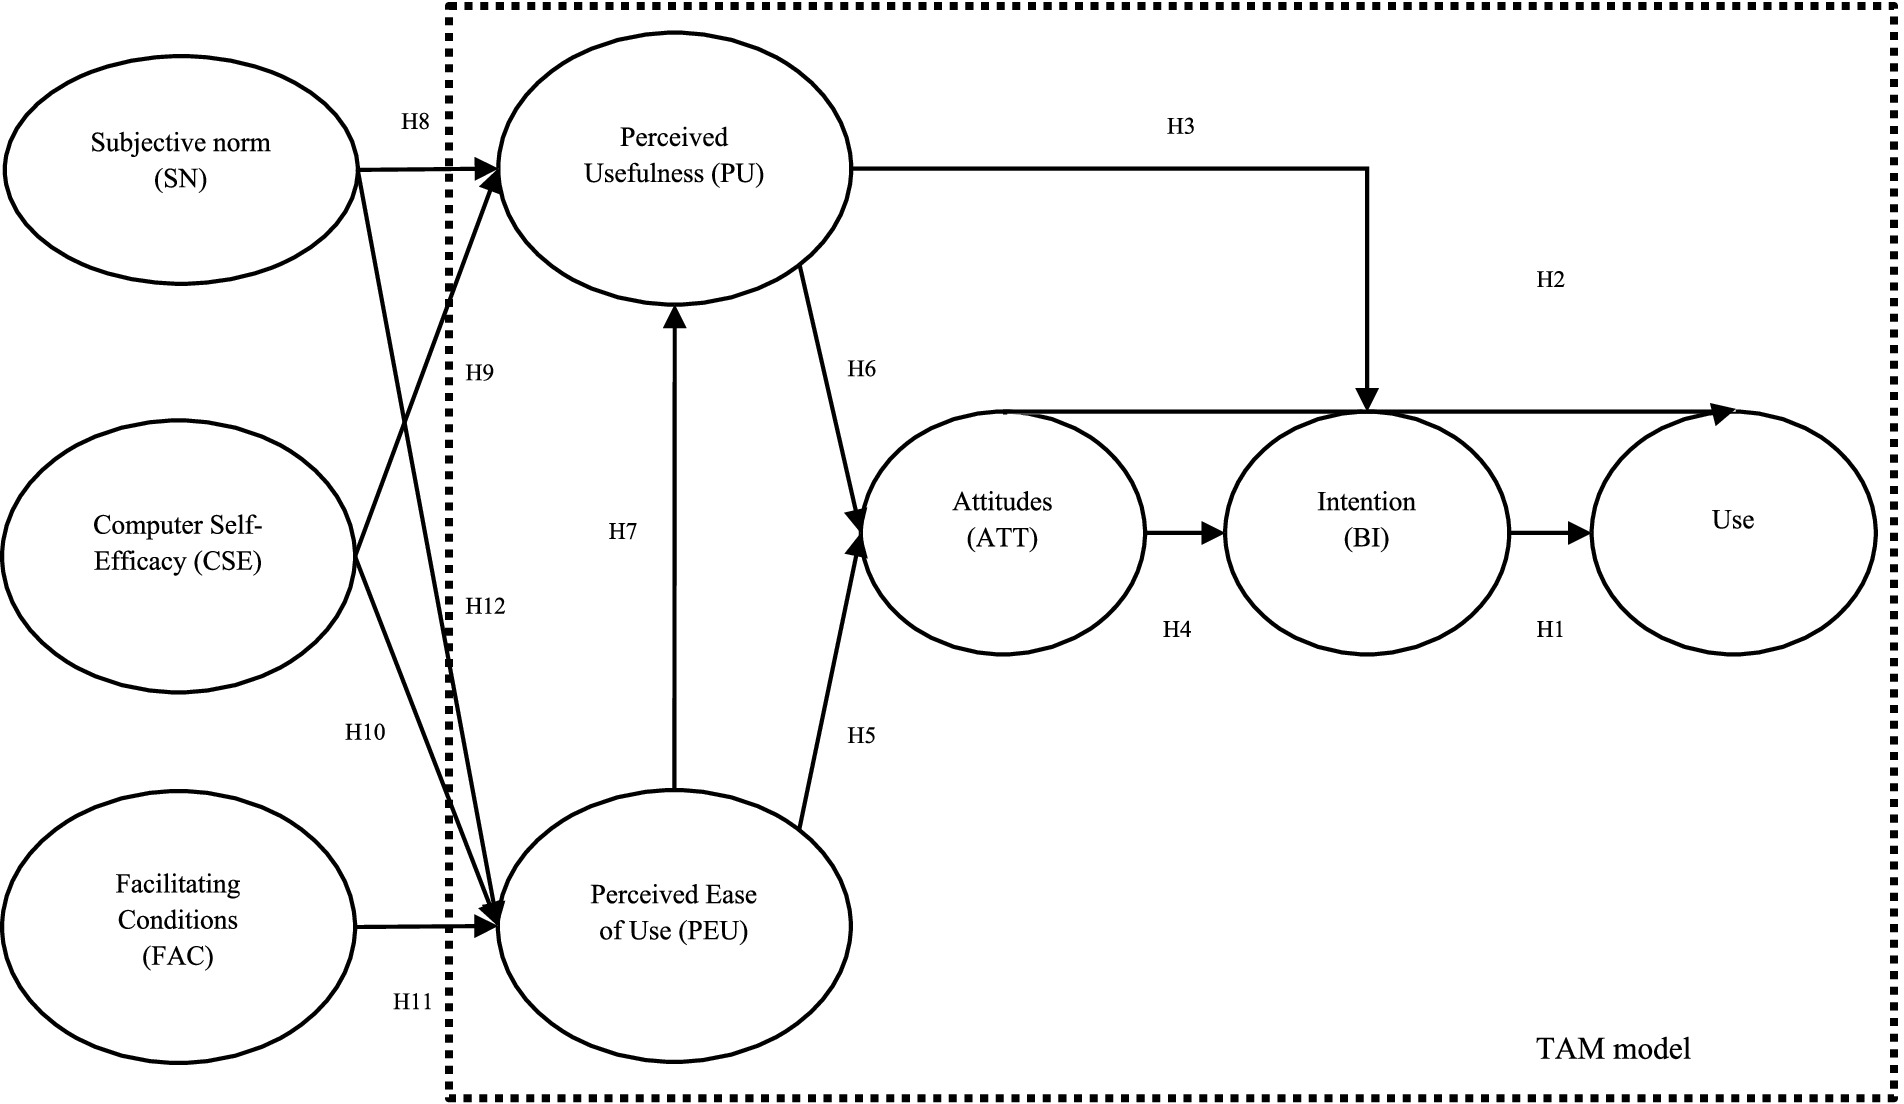
Figure 1. Framework for teachers’ use of Lirmi’s digital monitoring system.
Below, we define each variable considered in this extended version of TAM to understand the use of assessment data in digital monitoring systems (Table 1).
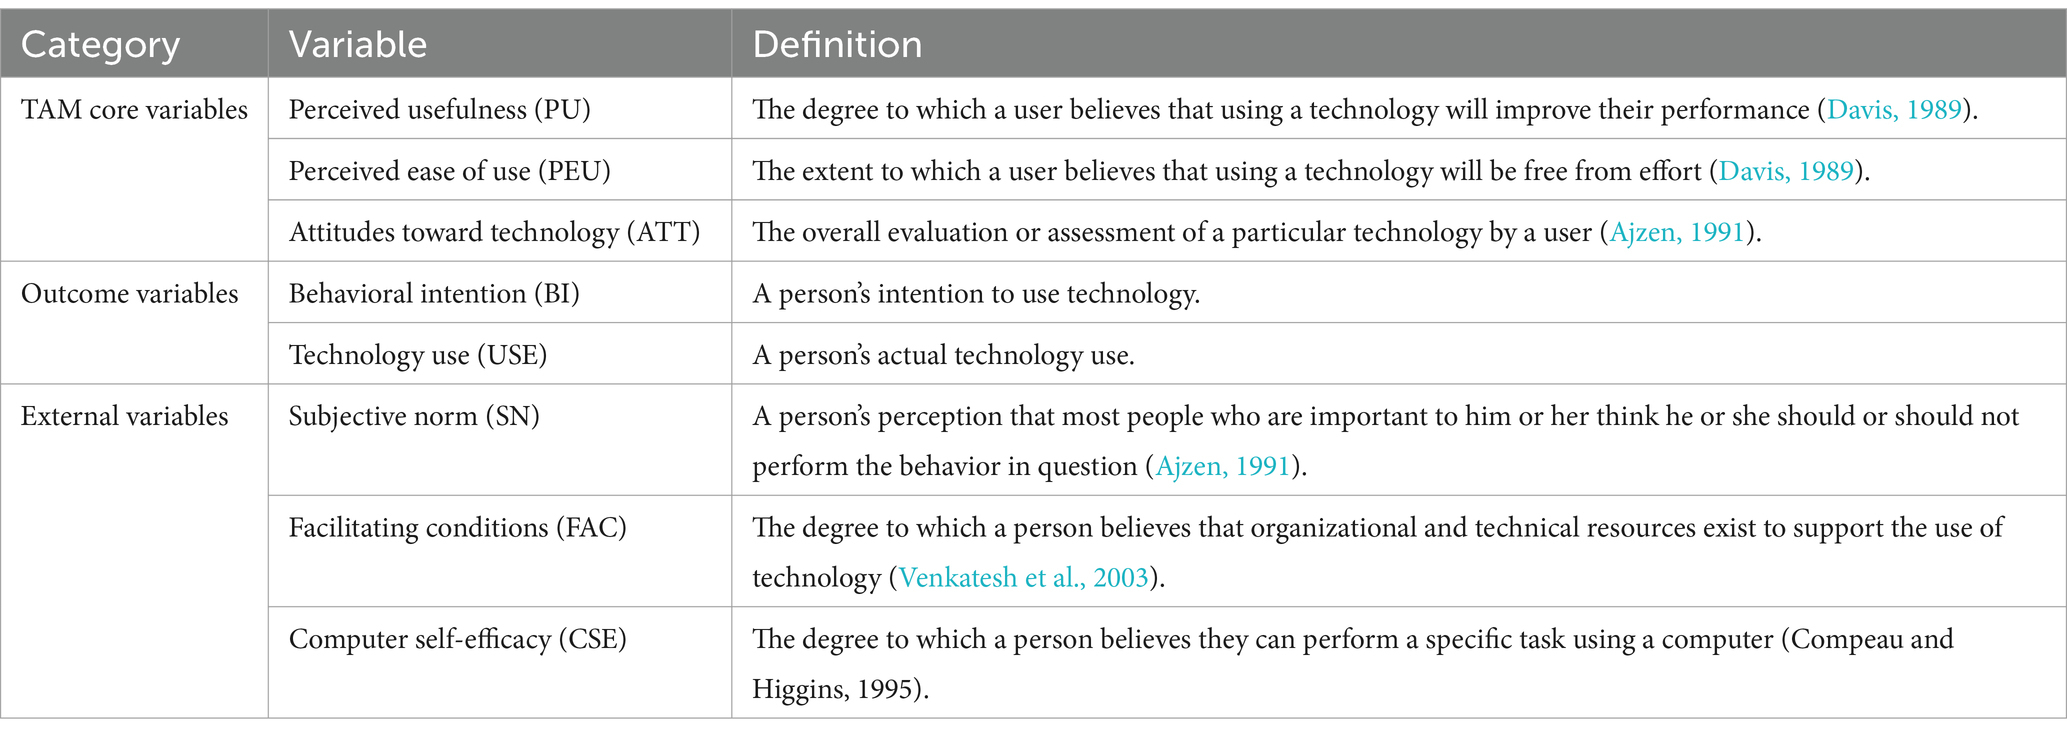
Table 1. Definition of variables.
We will explain how these variables interact and share our hypothesis based on previous research illustrated in Figure 1 (Scherer and Teo, 2019). Hypothesis 1 (H1) states that individuals’ intentions (BI) to use the evaluation module directly and positively impact its use (USE). Hypothesis 2 (H2) extends this by suggesting that users’ attitudes (ATT) toward the module directly influence USE and have an independent effect beyond intentions. Hypothesis 3 (H3) posits that perceived usefulness (PU) directly affects BI, surpassing the impact of ATT. Hypothesis 4 (H4) proposes a direct positive influence of ATT on BI. Hypothesis 5 (H5) posits that perceived ease of use (PEU) directly impacts ATT, while Hypothesis 6 (H6) suggests that PU directly influences ATT. Hypothesis 7 (H7) highlights the direct positive influence of PEU on PU, and Hypothesis 8 (H8) asserts that SN influence direct and positively PU. Computer self-efficacy (CSE) has a direct positive impact on PU (H9) and PEU (H10). Hypothesis 11 (H11) suggests that the Facilitating Conditions (FAC) directly influences PEU. Hypothesis 12 (H12) posits that SN have a direct positive impact on PEU.
Lastly, regarding mediation, we hypothesized that ATT toward the evaluation module has an indirect influence on USE through BI (H13). Hypothesis 14 (H14) states that PEU has an indirect effect on BI through PU and ATT. These hypotheses collectively offer a comprehensive analysis of the interrelated factors influencing the adoption and utilization of the evaluation module.
To answer this research question, we conducted an online cross-sectional survey. We sent an email through SurveyMonkey to 24,000 teachers in Chile who had at least 3 months of experience accessing the evaluation module in Lirmi to participate in the study voluntarily. At the start of the questionnaire, participants were required to provide informed consent to participate in the survey. The participants were provided with detailed information in the informed consent regarding the research objectives, their involvement in it, their voluntary participation, the measures taken to ensure the security and confidentiality of their data (such as storing it in a secure repository accessible only to researchers), their right to withdraw their data before study publication, and their right to choose not to answer the survey questions without facing any consequences. The time frame for answering the survey was 3 weeks, from the last week of May 2023 to the second week of June 2023. The survey content is related to the constructs described in Table 1.
From the 24,000 invitation emails sent to teacher’s users of Lirmi, we collected 419 responses, but 100 were excluded from the analysis when the questionnaire completion was less than 100% to avoid missing values in the sample. The final sample comprised 319 teachers for all variables, except for sex, which has two missing values. Among the participants, 62% were women and 38% were men, from different ages, years of experience, and grades (see Table 2).
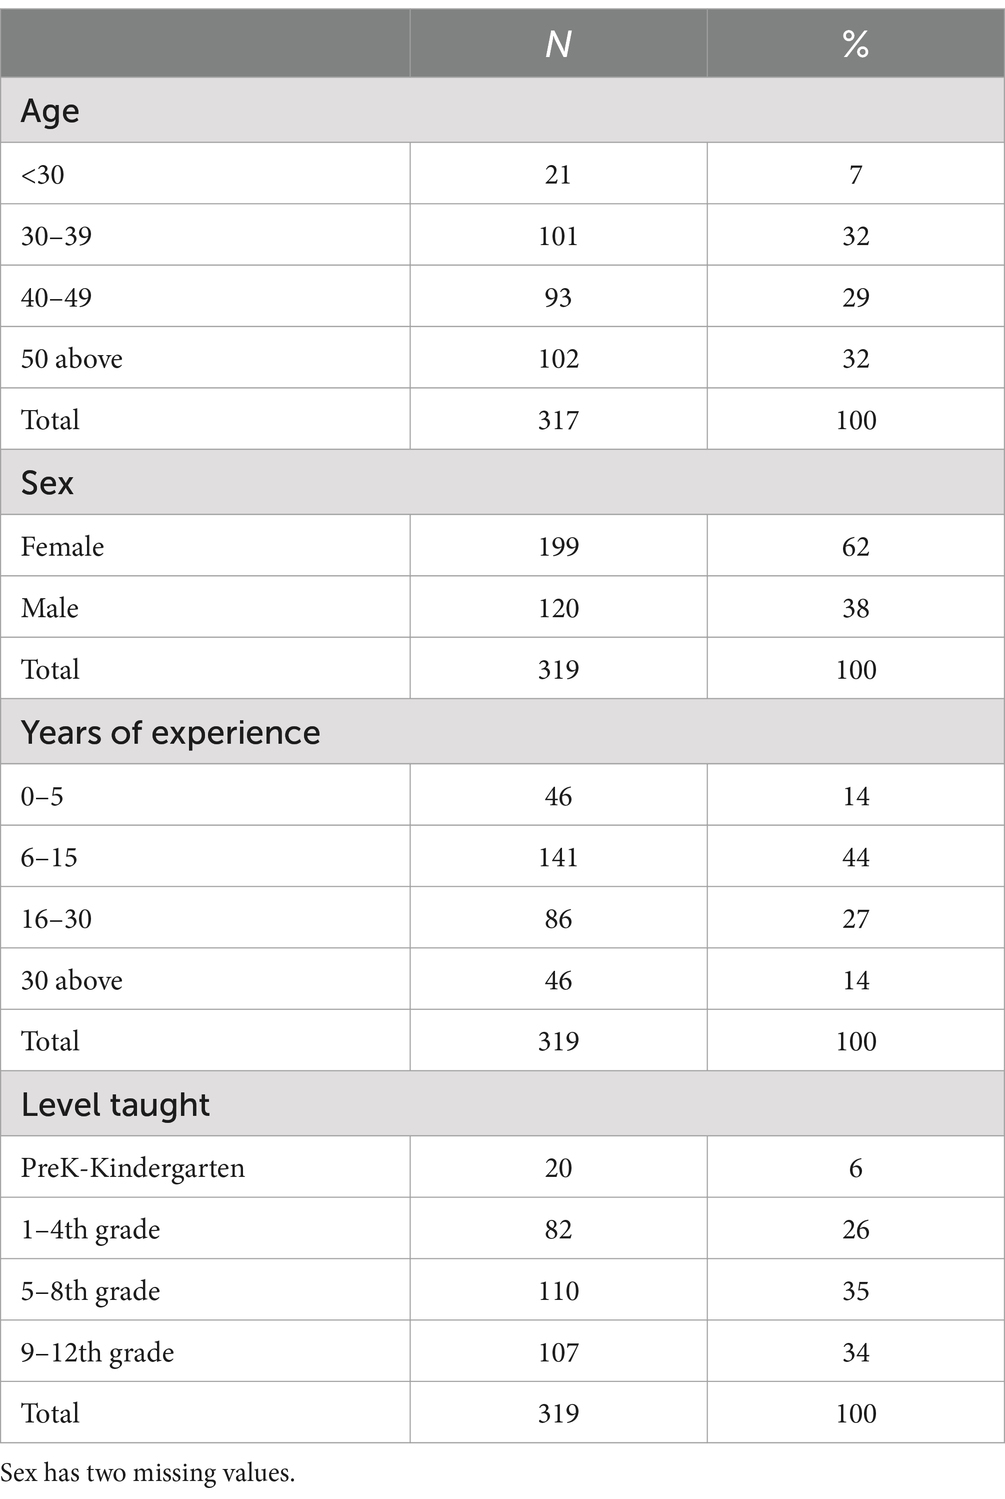
Table 2. Participants’ background.
Regarding sample size adequacy for Structural Equation Modeling (SEM), no universal rule exists, as the required N depends on model complexity, number of estimated parameters, number of indicators of latent variables, effect sizes, indicator reliability, and the values of other parameter in the model (Wang and Rhemtulla, 2021). General guidelines suggest a minimum of 200 cases for SEM models with latent variables (Kline, 2023). While our sample size meets this conventional recommendation, we acknowledge that larger samples could enhance power and model stability. This limitation is discussed further in the limitations section.
To measure the variables to predict teachers’ use of the evaluation module in Lirmi, we designed a survey based on previous research (Ajzen and Schmidt, 2020; Chow et al., 2012; Davis, 1989; Venkatesh et al., 2003) and adjusted to fit the Chilean context and the technology we are focused on. To ensure the participants’ comprehension of the items, three Chilean in-service teachers checked the language, clarity, and comprehension of the items. Minor wording modifications were made based on the feedback received. Teachers responded to the survey using mostly agreed-upon Likert scale (1 = strongly disagree, 2 = disagree, 3 = neither disagree nor agree, 4 = agree, and 5 = strongly agree). The only item that use a different scale was “In a typical month, how often do you use the evaluation module?,” where the response options were about frequency of use (1 = Never; 2 = Once a month; 3 = Two to three times a month; 4 = Once a week; 5 = More than once a week) (see Table 3 for the complete list of items for each variable).

Table 3. Extended TAM variables and items.
Following previous studies in the field (Scherer et al., 2019), the data analysis for this study was conducted using structural equation Modelling (SEM), a set of procedures that allows for the simultaneous examination of relationships between multiple observed and latent variables (Kline, 2016). We used Covariance-Based SEM because it is particularly well suited for our research aims, as it enables the assessment of both direct and indirect effects among the variables included in the extended version of the TAM while accounting for measurement errors and controlling for potential confounding factors (e.g., contextual factors). The analyses were performed in R Studio (R Core Team, 2024; version 2023.03.1 + 446) using the lavaan package (Rosseel, 2012; version 0.6–15).
Descriptive statistics were calculated for all measures to analyze the data and explore their distribution (Table 4). Second, we built a measurement model using Confirmatory Factor Analysis (CFA) to ensure the reliability of further analyses. We built a measurement model by assigning each item to its corresponding latent variable, as shown in Table 1. Third, we used modification indices to explore whether there was some residual covariance in the model that makes sense from TAM theory, so we could specify it and improve the model’s fit. The model fit was evaluated based on the suggestions of Whittaker and Schumacker (2022): χ2 statistics (p > 0.05), comparative fit index (CFI; good fit >0.90), Tucker-Lewis index (TLI; good fit >0.90), root-mean-square error of estimation (RMSEA; adequate fit <0.08, close fit <0.05), and standardized root-mean-square residual (SRMR; good fit <0.05, acceptable fit <0.1). Fourth, we built a structural model based on the extended version of TAM, as shown in Figure 1. All analyses were conducted using R-Studio (version 4.2.2) with the lavaan package (0.6–15).
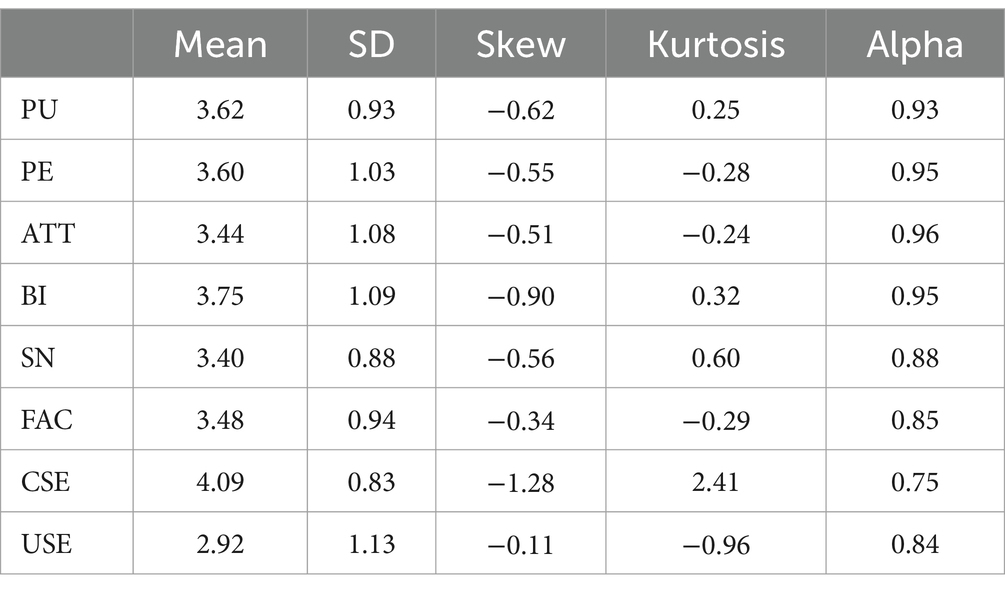
Table 4. Descriptive statistics and reliability analyses.
Even when the data were nested (teachers nested in schools), we could not perform multilevel analyses because there were few observations within each school. Consequently, the teachers were treated as not nested within schools.
Table 4 presents the descriptive statistics and Cronbach’s alpha coefficients of the latent variables. Regarding the means of the latent variables, CSE showed the highest score (4.09), whereas USE had the lowest average (2.92). Skew and Kurtosis are at the expected levels (below 2 and 3, respectively), according to Whittaker and Schumacker (2022), which means that the data are normally distributed. Moreover, all variables demonstrated high internal consistency, as indicated by Cronbach’s alpha values above 0.80. However, CSE had a slightly lower coefficient of 0.75, which is still acceptable (Taber, 2018).
We also report the Pearson correlation matrix for the latent variables in Table 5. All correlations were positive and significant (p < 0.001). Following the guidelines of Cohen et al. (2017), all variables had a medium or large positive correlation, except for CSE and USE, which had low positive correlations.
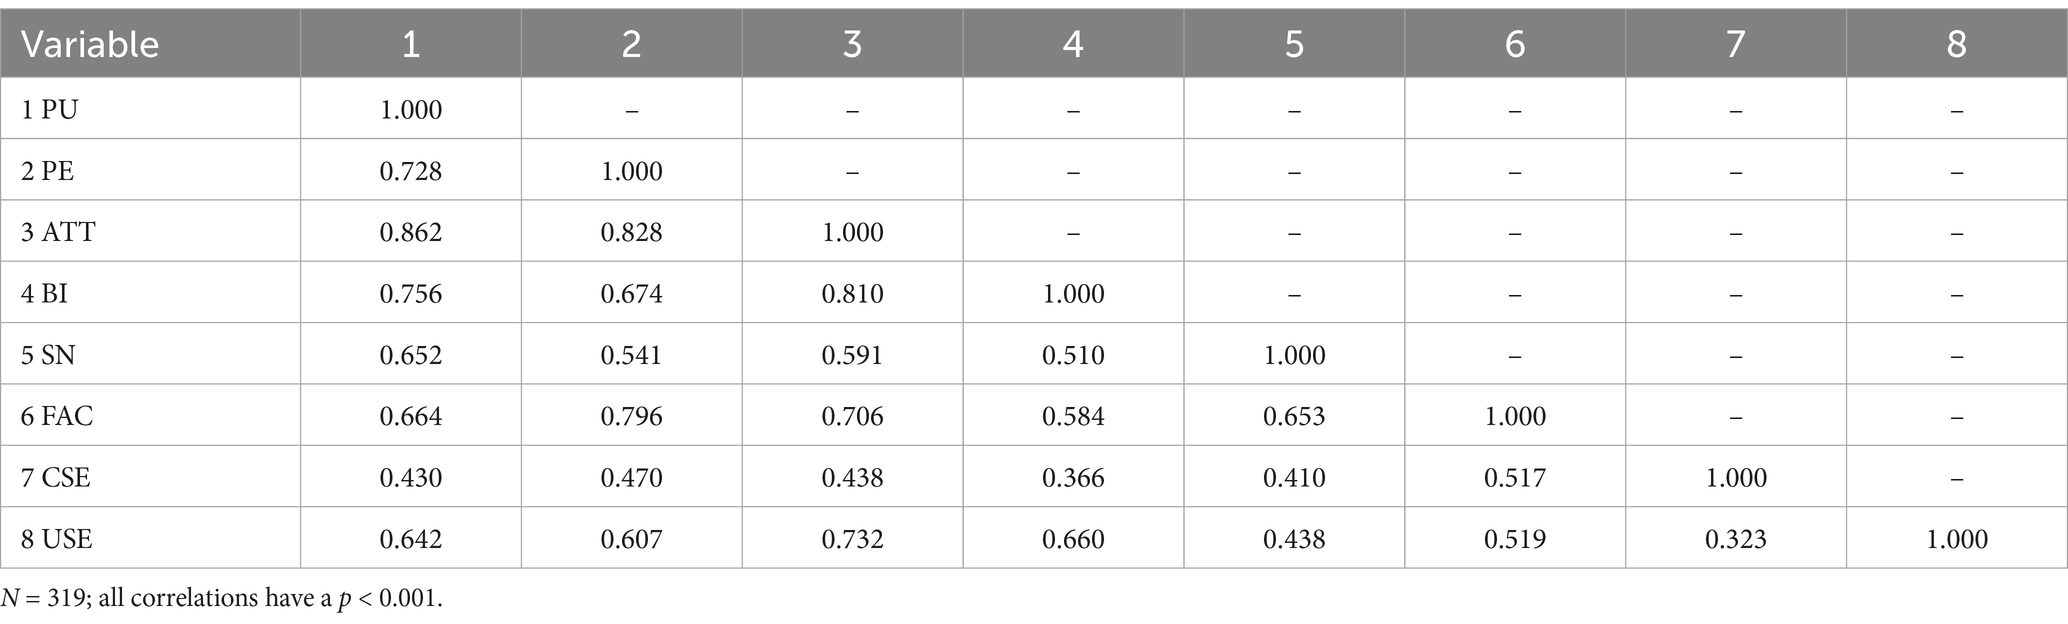
Table 5. Latent variable correlation matrix of all variables for all participants.
To assess discriminant validity, we follow suggestions given by Morrison et al. (2017) on using the Fornell-Larcker criterion (Fornell and Larcker, 1981), which states that each construct’s square root of the Average Variance Extracted (AVE) should exceed its highest correlation with any other construct. The results (Table 6) confirmed discriminant validity for most constructs. However, two exceptions were observed where the correlations were slightly higher than the AVE: PU and ATT (r = 0.862) and FAC and PEU (r = 0.796). Despite these results, we retained these constructs as theoretically distinct, as supported by previous research (e.g., Davis, 1989; Scherer and Teo, 2019). PU and ATT serve different functions in technology acceptance models: PU represents the platform’s instrumental value for completing tasks, whereas ATT reflects affective evaluations toward using the platform. Additionally, FAC and PEU are conceptually distinct, as FAC refers to external resources that support use, while PEU captures the individual’s perception of the effort required to use the platform (Venkatesh et al., 2003).
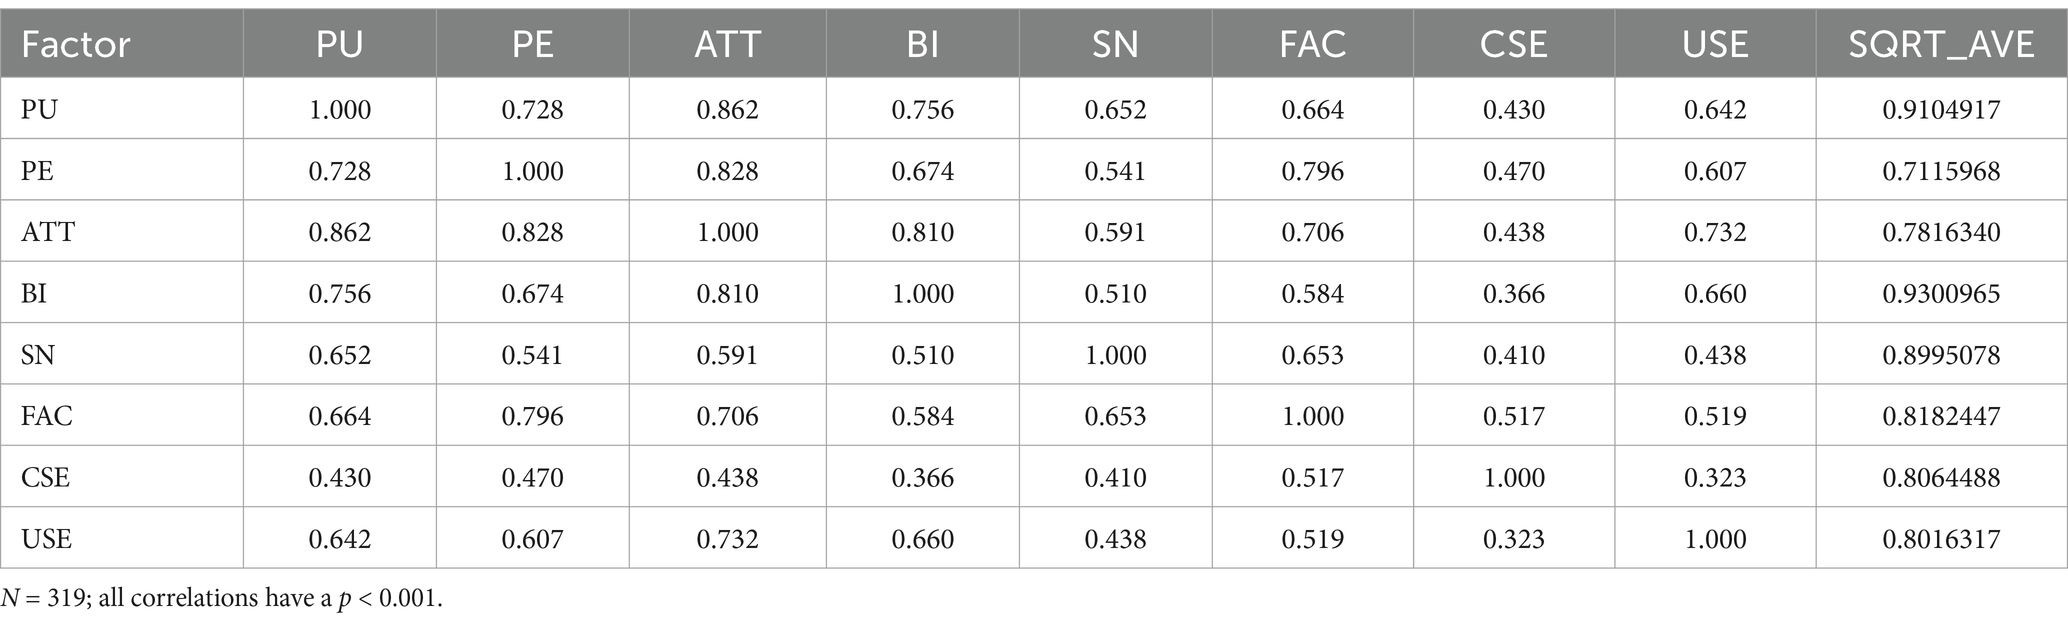
Table 6. Fornell-Larcker criterion table.
A structural model was constructed at both the measurement and structural level. Analyses were conducted using the ML estimator. We built a measurement model by specifying items belonging to each latent variable, as described in Table 1. The model showed an acceptable fit: χ2/df = 2.676, CFI (0.924), TLI (0.914), RMSEA (0.072, 90% CI [0.068–0.077]), and SRMR (0.046). We then used modification indices to improve the model fit. We included the items att_3 (“Using the evaluation module makes my work even more interesting”) and att_4 (“Is interesting to use the evaluation module”) as residual covariances because they have similar wording. After this adjustment, the fit of the measurement model slightly improved: χ2/df = 2.408, CFI (0.936), TLI (0.928), RMSEA (0.066, 90% CI [0.061–0.071]), and SRMS (0.046). We ran a chi-square test in both models to determine the model’s overall fit. The results showed a significant p-value, which suggests that the model did not fit the data well. However, it is well-documented that the chi-square test needs to be interpreted with additional fit indices (Whittaker and Schumacker, 2022), which in this case indicated that the model’s fit was acceptable.
Regarding CFA, all factor loadings were significant, positive, and above the thresholds Tabachnick and Fidell (2007) suggested (see Table 7). These results indicate that all items contribute to this factor (Yong and Pearce, 2013). In summary, our data support the measurement model, so we continued with the structural model (Finch and French, 2015).
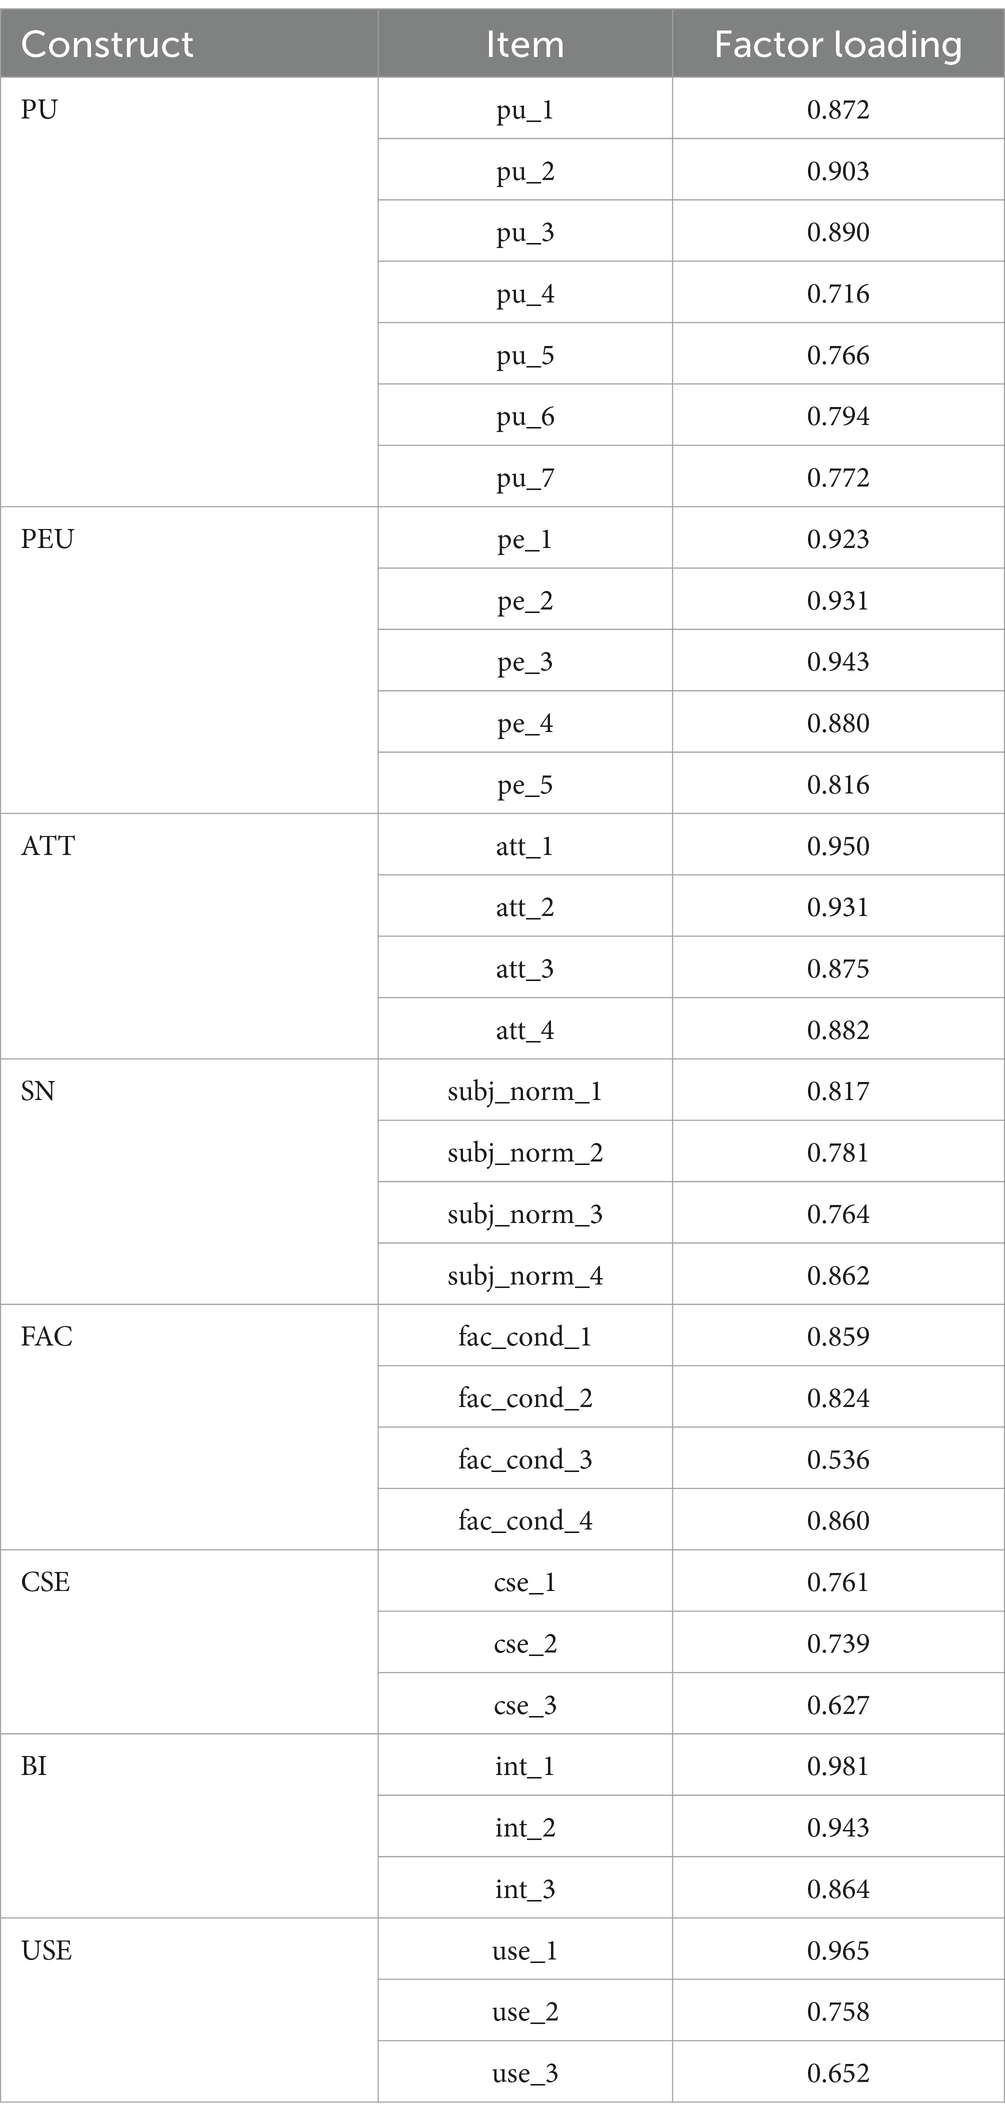
Table 7. Results of testing the measurement model.
Based on the measurement model defined above, we conducted a full structural model (Figure 2) to estimate the relationship between the latent variables.
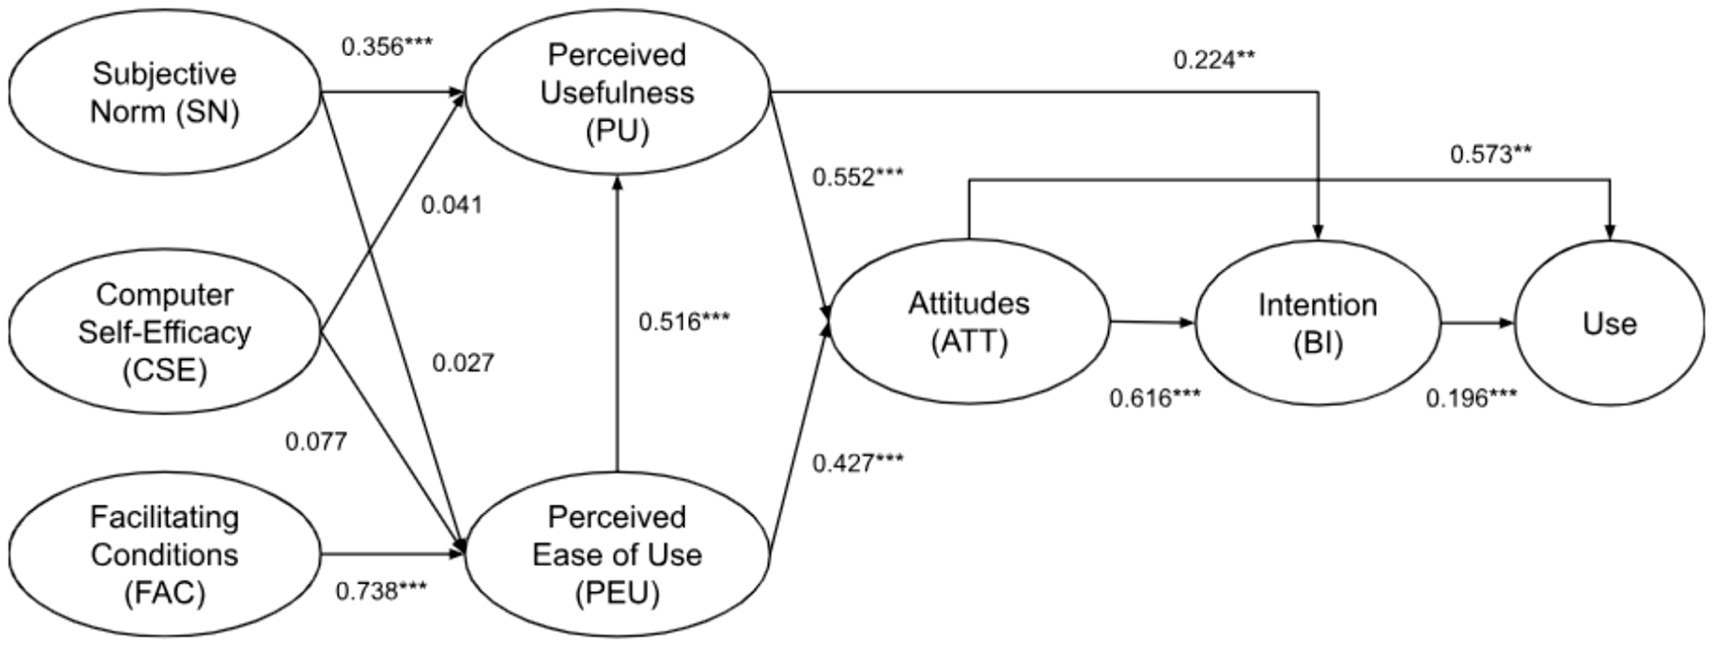
Figure 2. Results of the full structural model. Estimation method: ML; *p < 0.05; **p < 0.01, ***p < 0.001.
The model showed an acceptable fit: χ2/df = 2.556, CFI (0.936), TLI (0.928), RMSEA (0.066, 90% CI [0.061–0.071]), and SRMS (0.046).
The data show that nine of the 12 hypotheses were confirmed (see Tables 8, 9). The USE of the evaluation module in Lirmi can be explained by both the behavioral intention (BI) (β = 0.196, p < 0.001) and attitudes (ATT) (β = 0.573, p < 0.001). This suggests that teachers with greater intent to use the evaluation module declare higher usage, and a more positive attitude towards using the evaluation module is associated with increased use of the module. Furthermore, we performed a path analysis to explore the indirect effect of ATT on USE mediated by BI. These findings indicate that the influence of ATT on USE is not only directly but also indirectly mediated by BI (β = 0.121, p < 0.01). This result highlights the role of BI as a mediator in the relationship between the ATT and USE. Considering the total effects, the combination of direct and indirect influences resulted in a significantly positive total ATT effect on USE (β = 0.694, p < 0.01). This finding implies that ATT exerts a substantial overall impact on USE directly and through its influence on BI.
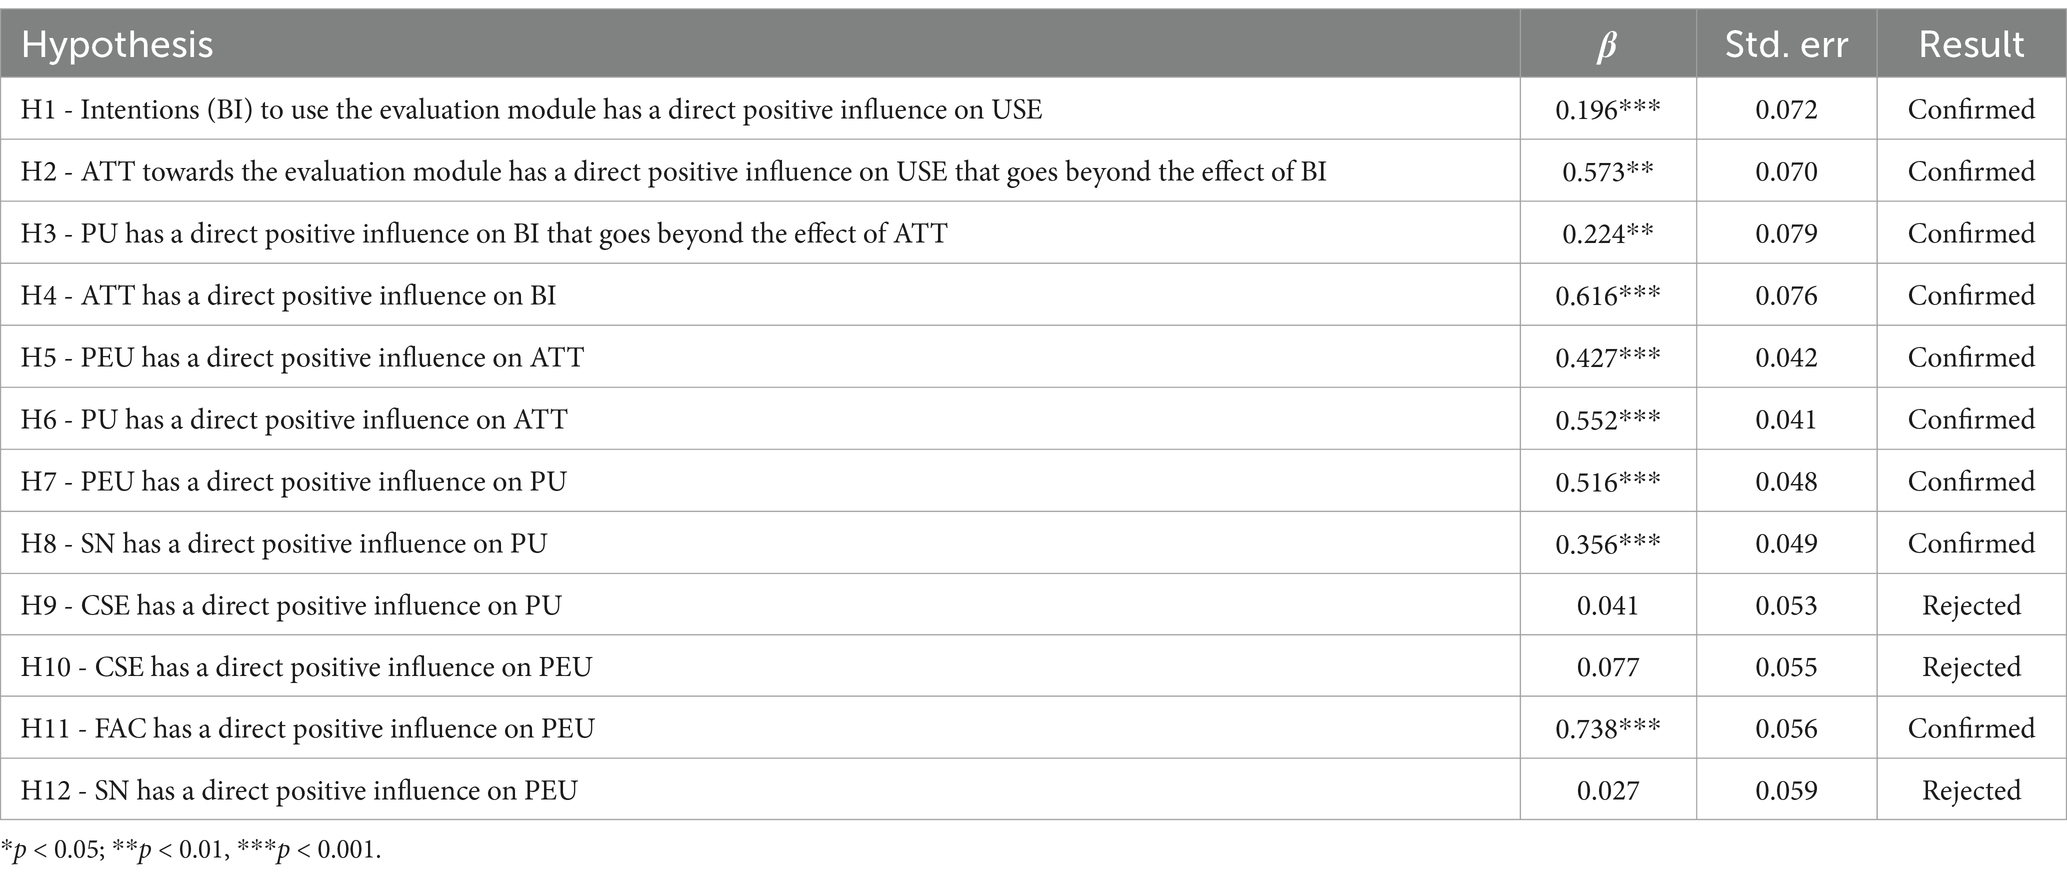
Table 8. Standardized beta values of all relationships in the structural equation model and hypothesis test results.
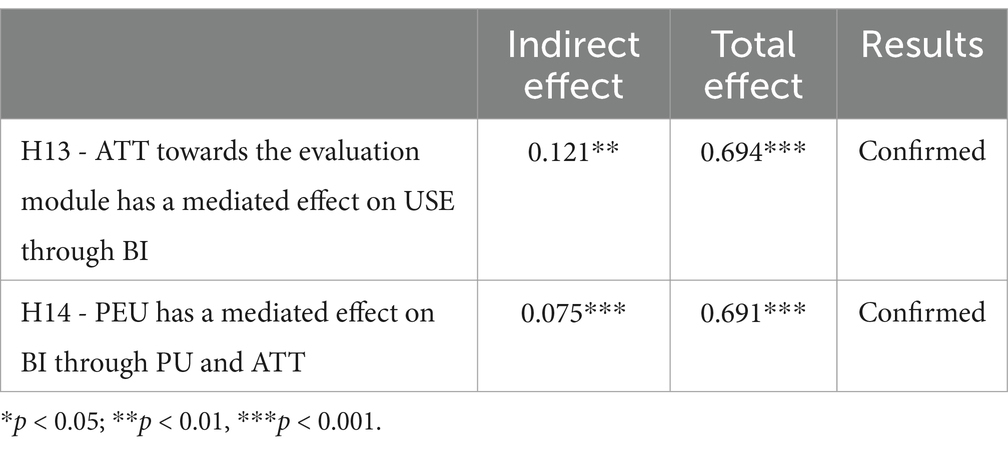
Table 9. Standardized regression coefficients for mediation analysis.
The behavioral intention (BI) to use the evaluation module is strongly influenced by the attitude towards use (ATT) (β = 0.616, p < 0.001), and by the perceived usefulness (PU) (β = 0.224, p < 0.005). This suggests that the more positive an individual’s attitude and the more useful they find a technology, the stronger their intention to use it. Mediation analysis indicates that perceived ease of use (PEU) indirectly affects behavioral intention (BI) through its influence on perceived usefulness (PU) and the attitude toward using technology (ATT) (β = 0.075, p < 0.001). This statistically significant indirect effect supports the idea that PEU can shape BI by affecting perceived usefulness and attitudes toward technology. It should be noted that this effect is small. Regarding the total effects, indirect and direct influences resulted in a significant positive total effect of perceived ease of use (PEU) on behavioral intention (BI) (β = 0.691, p < 0.001). This suggests that PEU is a substantial predictor of BI, demonstrating that the easier the evaluation module is perceived, the stronger the intention to use it.
Attitude towards use (ATT) is also significantly influenced by perceived ease of use (PEU) (β = 0.427, p < 0.001) and perceived usefulness (PU) (β = 0.552, p < 0.001). In other words, teachers who considered the evaluation module easy to use and useful showed more positive attitudes toward using it.
Perceived usefulness (PU) was significantly influenced by subjective norms (SN) (β = 0.356, p < 0.001) and perceived ease of use (PEU) (β = 0.516, p < 0.001). Therefore, the perception of usefulness increases when teachers perceive that the evaluation module is easy to use and when they perceive others as significant for them (e.g., school leaders and colleagues) want them to use it.
The facilitating conditions (FAC) have a positive statistical influence on perceived ease of use (PEU) (β = 0.738, p < 0.001). This suggests that when facilitating conditions improve in their school or through the support provided by Lirmi, individuals perceive the evaluation module to be easier to use.
Table 10 highlights the significant explanatory powers of the variables in our model. Our model could explain 55% of the variance in teachers’ USE in the evaluation module using attitudes (ATT) and behavioral intention (BI). In addition, ATT and PU explained 67% of the variance in BI.
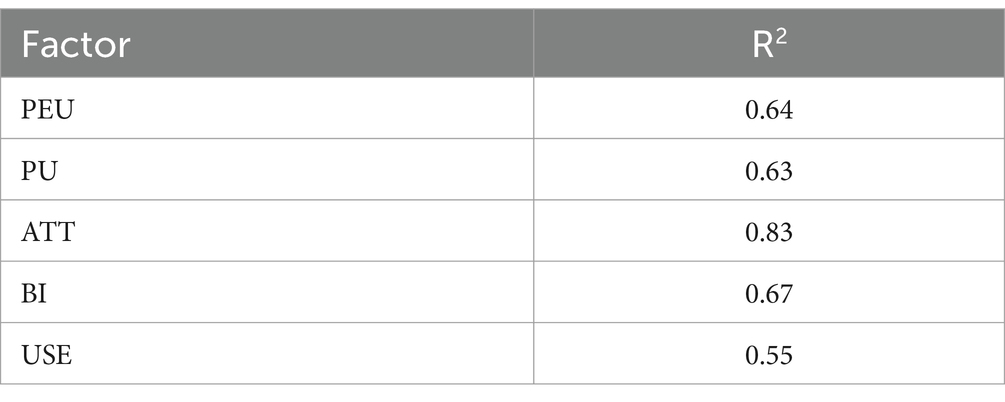
Table 10. R-squared table for TAM variables.
If we want teachers to utilize data in education, providing technologies and data to enable them to do so may not be sufficient. Our study explored the factors that explain the variation in teachers’ use of digital monitoring systems using an extended version of the TAM. Understanding the factors linked to using assessment data in digital monitoring systems can provide valuable insights for teachers’ professional development, educational technology designers, and policymakers.
Most of the hypotheses in the extended version of the TAM tested in this study were confirmed in a population different from that in previous studies (Granić and Marangunić, 2019). We found that 11 of the 14 hypotheses from the model proposed by Scherer et al. (2019) were confirmed (Table 8).
Our results are consistent with prior findings. In Switzerland, Michos et al. (2023) found that teachers’ positive beliefs about digital technologies were related to their use of digital data for teaching. Moreover, Prenger and Schildkamp (2018) found that attitudes were predictors of intention to use data. Finally, Pitsia et al. (2021) reported that teachers with more positive attitudes toward standardized tests tend to use assessment data to inform their teaching more frequently.
The results regarding the relationship between the external variables (SN, CSE, and FAC) influencing PEU and PU are mixed. Our study showed that CSE did not significantly influence PEU or PU. This can be explained by the lack of heterogeneity in participants’ answers. Table 4 shows a mean of 4.09 for that factor (scale 1–5), and was the largest mean for all factors. Moreover, the items used in this study (e.g., “I feel comfortable working with a computer”) may reflect basic digital skills, which teachers in our sample likely perceive themselves as highly proficient. This homogeneity in responses may have resulted in a ceiling effect, attenuating the relationship between CSE and other TAM variables. Future research could consider exploring more nuanced general CSE measures, increasing the number of response options in the Likert scale or selecting samples with greater variability in digital skill levels to validate these findings further. This refinement could better capture the impact of general computer self-efficacy in educational technology adoption. In addition, SN is related to PU, giving importance to the role of social influence in technology adoption (Venkatesh and Davis, 2000). However, SN was not associated with PEU.
Prior research has emphasized the necessity of substantial support for teachers to effectively utilize data (Breiter and Light, 2006; Mandinach and Gummer, 2016; Michos et al., 2023; Schildkamp, 2019). Our study also provides evidence that teachers who are supported by Lirmi and have appropriate infrastructure find the evaluation module easier to use. This has strong implications for governments and administrators, who provide schools with digital assessment data through online platforms. For example, the Agency for the Quality of Education in Chile offers all schools a platform with digital assessment data to monitor learning over the year. This suggests that supportive actions from schools and technology providers can positively alter teachers’ perceptions of technology, thereby enhancing the likelihood of its successful adoption.
In addition, the results show the importance of PU in explaining attitudes and intention to use the evaluation module. This highlights the idea of not building features that teachers do not need and designing from the ground the functionalities that will help them perform their daily tasks better (Breiter and Light, 2006). An approach that has shown to be effective for this purpose is to incorporate teachers as co-designers of solutions, together with researchers and technical professionals (Holstein et al., 2019; McKenney and Mor, 2015). For designers, there is a challenging balance in building important functionalities for teachers, but not too many because it can create an overload in their experience using the platform (Amarasinghe et al., 2022), affecting PEU.
The development of Data Literacy for Teachers (Mandinach and Gummer, 2016) can be a promising avenue for increasing the use of digital assessment data. Pitsia et al. (2021) and Filderman et al. (2021) found that teachers who participated in professional development to use data significantly predicted the frequency of using assessment data. In our study, teachers who perceived sufficient support for using the evaluation module also believed it was easier to use. Developing more capabilities through teachers’ professional development is a way to provide support that can increase the perception of the platform’s usefulness (PU) and more positive attitudes (ATT) towards it. This is also consistent with the literature on ICT adoption in schools, where it has been found that teachers’ professional development is related to better attitudes towards technology (Ferede et al., 2022; Hew and Brush, 2007; Teo and Wei, 2001).
This study supports the applicability of TAM in a new context (i.e., the use of Lirmi digital monitoring system by teachers). Specifically, most hypotheses derived from the extended version of the TAM were confirmed, underscoring its robustness and versatility as a theoretical framework for understanding technology adoption behaviors in Learning Analytics.
Moreover, the findings suggest that some of the external variables hypothesized to influence Perceived Ease of Use (PEU) and Perceived Usefulness (PU) did not hold the same weight in our sample. For instance, the non-significant influence of Computer Self-Efficacy (CSE) on PEU and PU is notable and highlights the importance of exploring external factors that influence technology adoption. For instance, the results associated with facilitating conditions (FAC) are interesting because it means that perceived ease of use is malleable by appropriate support. This is related to the Barrier to Technology Integration Model (Ertmer, 1999), which states that external (like facilitating conditions) and internal (like attitudes) conditions for technology use are intertwined, and it is important to take into account both dimensions when identifying conditions for technology use.
We also confirmed a key relationship in the TAM literature: the positive relationship between PU and attitudes toward using the system. This validates the central role of perceived usefulness in shaping users’ attitudes towards technology.
The implications of these findings are relevant for both practitioners and policymakers. They emphasized the need to optimize the use of digital assessment data by increasing the perception of usefulness and fostering positive attitudes and intentions toward technology use among teachers. Further, understanding the importance of perceived usefulness (PU) and ease of use (PEU) can guide software design and professional development, ensuring that teachers perceive new tools as beneficial and straightforward to use. Moreover, the impact of subjective norms on perceived usefulness emphasizes the role of school leaders and peers in fostering a culture that encourages the adoption of digital assessment data.
In addition, the results invite school leaders and administrators to reflect on how they support teachers in adopting digital assessment data. Given the relationship between facilitating conditions (FAC) and perceived ease of use (PEU), it is important to design and deliver proper support for teachers when using digital assessment data. This can be done through teacher professional development, as we argued before, but also through peers acting as models for adopting new technology, starting with small steps in the adoption of the technology in the school to avoid overloading teachers with too much information.
This study has several limitations. First, our sample consisted of Lirmi users who declared high computer proficiency (mean = 4.07, sd = 0.83). Therefore, the results may not be generalizable to all users of Lirmi. Future research should ensure the sample is more diverse to represent a population with different perceived computer use skills. Second, the participants volunteered to participate in the study, which might have introduced self-selection bias. Third, while our model converged properly and presents acceptable fit indices, our sample size (N = 319) relative to the number of estimated parameters (82) results in an N:q ratio of 3.9:1, which is below the commonly recommended 10:1 or 20:1 ratio for SEM models (Kline, 2023). This may limit statistical power, particularly for detecting small effects or model misspecifications (Wang and Rhemtulla, 2021). Fourth, while the Fornell-Larcker criterion largely supported discriminant validity, two pairs of constructs (PU-ATT and FAC-PEU) exhibited higher than recommended correlations. Nevertheless, we retained these constructs separately due to strong theoretical distinctions and results from confirmatory factor analysis. Future studies should observe whether similar patterns emerge in different contexts, which could indicate a need for further theoretical refinement. Fifth, participant recruitment should be conducted at the school level in future studies for two reasons. First, this approach reduces self-selection bias, ensuring participation from a broader range of teachers beyond those who are highly self-motivated to participate. In addition, it increases the number of teachers per school, facilitating the use of hierarchical linear model. This statistical model, accounts for the nested structure of the data, addressing violations of independence assumptions, modeling random slopes and intercepts to allow the effect of predictors to vary between schools, and testing hypotheses about the influence of school-level variables on teacher-level variables. (e.g., leadership on teachers’ perception of usefulness). Finally, researchers could incorporate objective measures of technology use in future studies to corroborate the self-reported data and reduce potential bias (Lawless and Pellegrino, 2007).
First, future studies with a more heterogeneous sample of CSE scores could provide more information on its relationship with PEU. Second, more exploration is needed regarding the facilitating conditions teachers perceive as providing effective support and why. Is the training delivered by Lirmi or (in)formal support from peers in school? Moreover, do perceptions of effective support vary based on teachers’ experiences and competence in technology? This can help provide personalized and cost-effective strategies to support teachers on a large scale. Third, more variables can be included in the model, such as the voluntary use of digital assessment data, teachers’ age, and previous experience with technology (Venkatesh et al., 2003). Fourth, a longitudinal study would help follow teachers’ journeys on the platform over time, so it would be possible to shed light on how perceptions and usage patterns evolve. This could help design proper support for users at different stages in using digital monitoring system platforms. Fifth, rigorous teacher professional development interventions could be designed to improve teachers’ PEU, PU, and ATT to gain knowledge about how to change teachers’ beliefs to increase the adoption of digital assessment data.
This research can help in using digital assessment data in K-12 education. By understanding the factors that drive teachers’ adoption of digital monitoring systems, we can create a future in which data will be useful for improving teaching and learning.
The raw data supporting the conclusions of this article will be made available by the authors, without undue reservation.
Ethical review and approval was not required for the study on human participants in accordance with the local legislation and institutional requirements. Written informed consent from the participants or participant legal guardian/next of kin was not required to participate in this study in accordance with the national legislation and the institutional requirements.
LS: Conceptualization, Formal analysis, Methodology, Writing – original draft, Writing – review & editing. MT: Conceptualization, Writing – review & editing. IL: Funding acquisition, Project administration, Writing – review & editing.
The author(s) declare that financial support was received for the research, authorship, and/or publication of this article. This study was funded by the Lirmi.
We would like to thank all participating teachers for making time to complete the questionnaire.
LS, MT, and IL were employed by the Lirmi.
All claims expressed in this article are solely those of the authors and do not necessarily represent those of their affiliated organizations, or those of the publisher, the editors and the reviewers. Any product that may be evaluated in this article, or claim that may be made by its manufacturer, is not guaranteed or endorsed by the publisher.
The Supplementary material for this article can be found online at: https://www.frontiersin.org/articles/10.3389/feduc.2025.1406699/full#supplementary-material
Abdusyakur, I., and Poortman, C. L. (2019). Study on data use in Indonesian primary schools. J. Prof. Capital Commun. 4, 198–215. doi: 10.1108/JPCC-11-2018-0029
Ajzen, I. (1991). The theory of planned behavior. Org. Hum. Dec. Proc. 50, 179–211. doi: 10.1016/0749-5978(91)90020-T
Ajzen, I., and Schmidt, P. (2020). “Changing behavior using the theory of planned behavior” in The handbook of behavior change. eds. M. S. Hagger, L. D. Cameron, K. Hamilton, N. Hankonen, and T. Lintunen (Cambridge: Cambridge University Press), 17–31.
Albiladi, W. S., Lasater, K., and Bengston, E. (2020). Data use among principals and teachers: divergent paths or common ground? Implications for the leadership preparation programs. J. School Admin. Res. Dev. 5, 63–76. doi: 10.32674/jsard.v5i2.2240
Amarasinghe, I., Michos, K., Crespi, F., and Hernández-Leo, D. (2022). Learning analytics support to teachers’ design and orchestrating tasks. J. Comput. Assist. Learn. 40, 2416–2431. doi: 10.1111/jcal.12711
Black, P., and Wiliam, D. (1998). Assessment and classroom learning. Assess. Educ. Principles Policy Prac. 5, 7–74. doi: 10.1080/0969595980050102
Breiter, A., and Light, D. (2006). Data for school improvement: factors for designing effective information systems to support decision-making in schools. J. Educ. Technol. Soc. 9, 206–217. doi: jeductechsoci.9.3.206
Cechinel, C., Ochoa, X., Lemos dos Santos, H., Carvalho Nunes, J. B., Rodés, V., and Marques Queiroga, E. (2020). Mapping learning analytics initiatives in Latin America. Br. J. Educ. Technol. 51, 892–914. doi: 10.1111/bjet.12941
Chow, M., Herold, D. K., Choo, T.-M., and Chan, K. (2012). Extending the technology acceptance model to explore the intention to use second life for enhancing healthcare education. Comput. Educ. 59, 1136–1144. doi: 10.1016/j.compedu.2012.05.011
Cohen, L., Manion, L., and Morrison, K. (2017). Research Methods in Education (8th ed.).. London, England: Routledge.
Compeau, D. R., and Higgins, C. A. (1995). Computer Self-Efficacy: Development of a Measure and Initial Test. MIS Quarterly 19, 189–211. doi: 10.2307/249688
Datnow, A., Park, V., and Kennedy-Lewis, B. (2012). High school teachers’ use of data to inform instruction. JESPAR 17, 247–265. doi: 10.1080/10824669.2012.718944
Davis, F. (1989). Perceived usefulness, perceived ease of use, and user acceptance of information technology. MIS Q. 13, 319–340. doi: 10.2307/249008
Earl, L. M., and Katz, S. (2006). Leading schools in a data-rich world: Harnessing data for school improvement. Thousand Oaks, CA: Corwin Press.
Ertmer, P. A. (1999). Addressing first- and second-order barriers to change: strategies for technology integration. Educ. Technol. Res. Dev. 47, 47–61. doi: 10.1007/BF02299597
Faber, J. M., Feskens, R., and Visscher, A. J. (2022). A best-evidence meta-analysis of the effects of digital monitoring tools for teachers on student achievement. Sch. Eff. Sch. Improv. 34, 169–188. doi: 10.1080/09243453.2022.2142247
Farrell, C. C., and Marsh, J. A. (2016). Contributing conditions: a qualitative comparative analysis of teachers’ instructional responses to data. Teach. Teach. Educ. 60, 398–412. doi: 10.1016/j.tate.2016.07.010
Ferede, B., Elen, J., Petegem, W. V., Hunde, A. B., and Goeman, K. (2022). A structural equation model for determinants of instructors’ educational ICT use in higher education in developing countries: evidence from Ethiopia. Comput. Educ. 188:104566. doi: 10.1016/j.compedu.2022.104566
Filderman, M. J., Toste, J. R., and Cooc, N. (2021). Does training predict second-grade teachers’ use of student data for decision-making in Reading and mathematics? Assess. Eff. Interv. 46, 247–258. doi: 10.1177/1534508420902523
Fornell, C., and Larcker, D. F. (1981). Evaluating structural equation models with unobservable variables and measurement error. J. Mark. Res. 18, 39–50. doi: 10.2307/3151312
Fuchs, A., Radkowitsch, A., and Sommerhoff, D. (2024). Using learning Progress monitoring to promote academic performance? A meta-analysis of the effectiveness. Educ. Res. Rev. 46:100648. doi: 10.1016/j.edurev.2024.100648
Granić, A., and Marangunić, N. (2019). Technology acceptance model in educational context: a systematic literature review. Br. J. Educ. Technol. 50, 2572–2593. doi: 10.1111/bjet.12864
Hase, A., Kahnbach, L., Kuhl, P., and Lehr, D. (2022). To use or not to use learning data: a survey study to explain German primary school teachers’ usage of data from digital learning platforms for purposes of individualization. Front. Educ. 7:920498. doi: 10.3389/feduc.2022.920498
Hase, A., and Kuhl, P. (2024). Teachers’ use of data from digital learning platforms for instructional design: a systematic review. Educ. Technol. Res. Dev. 72, 1925–1945. doi: 10.1007/s11423-024-10356-y
Hattie, J. (2009). Visible learning. A synthesis of over 800 Meta-analyses relating to achievement. London: Routledge.
Hew, K. F., and Brush, T. (2007). Integrating technology into K-12 teaching and learning: current knowledge gaps and recommendations for future research. Educ. Technol. Res. Dev. 55, 223–252. doi: 10.1007/s11423-006-9022-5
Holstein, K., McLaren, B. M., and Aleven, V. (2019). Co-designing a real-time classroom orchestration tool to support teacher–AI complementarity. J. Learn. Anal. 6, 27–52. doi: 10.18608/jla.2019.62.3
Kline, R. B. (2016). Principles and practice of structural equation modeling. London: The Guilford Press.
Kline, R. B. (2023). Principles and practice of structural equation modeling. London: The Guilford Press.
Lai, M. K., and Schildkamp, K. (2013). “Data-based decision making: an overview” in Data-based decision making in education: Challenges and opportunities. eds. K. Schildkamp, M. K. Lai, and L. Earl (Berlin: Springer), 9–21.
Lawless, K. A., and Pellegrino, J. W. (2007). Professional development in integrating technology into teaching and learning: knowns, unknowns, and ways to pursue better questions and answers. Rev. Educ. Res. 77, 575–614. doi: 10.3102/0034654307309921
Lirmi , (2023). Available at: https://lirmi.com/cl/ (Accessed April 20, 2023).
Mandinach, E. B., and Gummer, E. S. (2016). What does it mean for teachers to be data literate: laying out the skills, knowledge, and dispositions. Teach. Teach. Educ. 60, 366–376. doi: 10.1016/j.tate.2016.07.011
Mavroudi, A., Papadakis, S., and Ioannou, I. (2021). Teachers’ views regarding learning analytics usage based on the technology acceptance model. TechTrends 65, 278–287. doi: 10.1007/s11528-020-00580-7
McKenney, S., and Mor, Y. (2015). Supporting teachers in data-informed educational design. Br. J. Educ. Technol. 46, 265–279. doi: 10.1111/bjet.12262
Michos, K., Schmitz, M.-L., and Petko, D. (2023). Teachers’ data literacy for learning analytics: a central predictor for digital data use in upper secondary schools. Educ. Inf. Technol. 28, 14453–14471. doi: 10.1007/s10639-023-11772-y
Ministerio de Educación (MINEDUC) . (2020). Gobierno lanza “Conectividad para la Educación 2030”. Available at: https://www.mineduc.cl/gobierno-lanza-conectividad-para-la-educacion-2030/ (Accessed April 20, 2023).
Morrison, T. G., Morrison, M. A., and McCutcheon, J. M. (2017). Best practice recommendations for using structural equation modelling in psychological research. Psychology 8, 1326–1341. doi: 10.4236/psych.2017.89086
Naveed, Q. N., Qureshi, M. R. N., Tairan, N., Mohammad, A., Shaikh, A., Alsayed, A. O., et al. (2020). Evaluating critical success factors in implementing E-learning system using multi-criteria decision-making. PLoS One 15:e0231465. doi: 10.1371/journal.pone.0231465
Pitsia, V., Karakolidis, A., and Lehane, P. (2021). Investigating the use of assessment data by primary school teachers: insights from a large-scale survey in Ireland. Educ. Assess. 26, 145–162. doi: 10.1080/10627197.2021.1917358
Prenger, R., and Schildkamp, K. (2018). Data-based decision making for teacher and student learning: a psychological perspective on the role of the teacher. Educ. Psychol. 38, 734–752. doi: 10.1080/01443410.2018.1426834
R Core Team (2024). R: A language and environment for statistical computing [computer software]. Vienna: R Foundation for Statistical Computing.
Rosseel, Y. (2012). Lavaan: an R package for structural equation modeling. J. Stat. Softw. 48, 1–36. doi: 10.18637/jss.v048.i02
Scherer, R., Siddiq, F., and Tondeur, J. (2019). The technology acceptance model (TAM): a meta-analytic structural equation modeling approach to explaining teachers’ adoption of digital technology in education. Comput. Educ. 128, 13–35. doi: 10.1016/j.compedu.2018.09.009
Scherer, R., and Teo, T. (2019). Unpacking teachers’ intentions to integrate technology: a meta-analysis. Educ. Res. Rev. 27, 90–109. doi: 10.1016/j.edurev.2019.03.001
Schildkamp, K. (2019). Data-based decision-making for school improvement: research insights and gaps. Educ. Res. 61, 257–273. doi: 10.1080/00131881.2019.1625716
Schildkamp, K., Poortman, C., Luyten, H., and Ebbeler, J. (2017). Factors promoting and hindering data-based decision making in schools. Sch. Eff. Sch. Improv. 28, 242–258. doi: 10.1080/09243453.2016.1256901
Siemens, G., and Gasevic, D. (2012). Guest editorial—learning and knowledge analytics. Educ. Technol. Soc. 15, 1–2.
Tabachnick, B. G., and Fidell, L. S. (2007). Using multivariate statistics. 5th Edn. Boston, MA: Allyn & Bacon/Pearson Education.
Taber, K. S. (2018). The use of Cronbach’s alpha when developing and reporting research instruments in science education. Res. Sci. Educ. 48, 1273–1296. doi: 10.1007/s11165-016-9602-2
Teo, H., and Wei, K. (2001). Effective use of computer aided instruction in secondary schools: a causal model of institutional factors and teachers’ roles. J. Educ. Comput. Res. 25, 385–415. doi: 10.2190/68GT-D3P4-0UJ3-5J69
Teo, T., and Tan, L. (2012). The theory of planned behavior (TPB) and pre-service teachers’ technology acceptance: a validation study using structural equation modeling. J. Technol. Teach. Educ. 20, 89–104.
Van Leeuwen, A., Campen, C. A. N. K., Molenaar, I., and Rummel, N. (2021). How teacher characteristics relate to how teachers use dashboards: results from two case studies in K-12. J. Learn. Analytics 8, 6–21. doi: 10.18608/jla.2021.7325
Venkatesh, V., and Davis, F. D. (2000). A theoretical extension of the technology acceptance model: four longitudinal field studies. Manag. Sci. 46, 186–204. doi: 10.1287/mnsc.46.2.186.11926
Venkatesh, V., Morris, M. G., Davis, G. B., and Davis, F. D. (2003). User acceptance of information technology: toward a unified view. MIS Q. 27, 425–478. doi: 10.2307/30036540
Wang, Y. A., and Rhemtulla, M. (2021). Power analysis for parameter estimation in structural equation modeling: a discussion and tutorial. Adv. Methods Pract. Psychol. Sci. 4, 1–17. doi: 10.1177/2515245920918253
Wayman, J. C., Shaw, S., and Cho, V. (2017). Longitudinal effects of teacher use of a computer data system on student achievement. AERA Open 3:233285841668553. doi: 10.1177/2332858416685534
Whittaker, T. A., and Schumacker, R. E. (2022). A Beginner’s guide to structural equation modeling. (5th ed.) Edn. London: Routledge.
Keywords: data-informed decision-making, digital monitoring systems, learning analytics, technology acceptance model (TAM), structural equation modeling, data use
Citation: Silva L, Tagle M and Loncomil I (2025) Analyzing factors promoting teachers’ use of Lirmi: a digital monitoring system in Chile using the technology acceptance model. Front. Educ. 10:1406699. doi: 10.3389/feduc.2025.1406699
Edited by:
Octavian Dospinescu, Alexandru Ioan Cuza University, RomaniaReviewed by:
Mohamed Rafik Noor Mohamed Qureshi, King Khalid University, Saudi ArabiaCopyright © 2025 Silva, Tagle and Loncomil. This is an open-access article distributed under the terms of the Creative Commons Attribution License (CC BY). The use, distribution or reproduction in other forums is permitted, provided the original author(s) and the copyright owner(s) are credited and that the original publication in this journal is cited, in accordance with accepted academic practice. No use, distribution or reproduction is permitted which does not comply with these terms.
*Correspondence: Lucas Silva, bHVjYXMuc2lsdmFAbGlybWkuY29t
Disclaimer: All claims expressed in this article are solely those of the authors and do not necessarily represent those of their affiliated organizations, or those of the publisher, the editors and the reviewers. Any product that may be evaluated in this article or claim that may be made by its manufacturer is not guaranteed or endorsed by the publisher.
Research integrity at Frontiers
Learn more about the work of our research integrity team to safeguard the quality of each article we publish.