 Felix Bittmann
94% of researchers rate our articles as excellent or good
Learn more about the work of our research integrity team to safeguard the quality of each article we publish.
Find out more
ORIGINAL RESEARCH article
Front. Educ., 23 July 2024
Sec. Assessment, Testing and Applied Measurement
Volume 9 - 2024 | https://doi.org/10.3389/feduc.2024.1404076
In educational sociology, it is of greatest interest to explain why some students are more successful than others and obtain higher educational qualifications or receive better grades, which can have long-lasting consequences. The present study compares the influence of early academic performance, which can be regarded as a proxy of overall intelligence, to the socio-economic status (SES) of the family, which measures how much a family can invest in the education of their offspring. Using large-scale German NEPS panel data (N = 5,208), the analyses test statistically how much variance of two outcome variables (acquisition of higher education eligibility and final grade) are explained by academic performance and SES; both measured approximately 9 years earlier at the beginning of secondary education. Dominance analyses reveal that performance has a larger influence (ca. 14% for both outcomes) than SES (ca. 8% for eligibility and ca. 4% for grades). Regression analyses show that high performance can better compensate for low SES than vice versa. These results indicate that performance is probably more relevant for academic success than the SES of one’s own family.
Understanding which factors influence, predict, and explain educational success is one of the central goals of educational sociology. Not only for science but also for practical interventions and political advice, it is relevant to understand why some individuals can obtain high educational qualifications while others fail. Past research has shown that two major factors of influence have been known for a long time: the social origin of the family, also known as socioeconomic status (SES), and factors related to or derived from intelligence or cognitive abilities (Plug and Vijverberg, 2003; Walker et al., 2004; Björklund et al., 2005; Erola et al., 2022). Some argue that this second component is, to a large extent, the result of inherited genes, and there is little one can do to improve one’s cognitive abilities since this aspect is determined biologically at the moment of conception (Marks, 2020; Marks and O’Connell, 2023). Others, and especially sociologists, usually assume that the influence of SES is highly relevant since the amount of energy, time, and material resources a family can spend on the upbringing and education of a child has long-lasting consequences, which affects educational and occupation success (Erola et al., 2016; Hällsten and Thaning, 2018; Broer et al., 2019). The current study attempts to add more empirical evidence to this large and steadily developing field of research and answer a few specific research questions. This is relevant for several reasons. Suppose it could be demonstrated that educational or even occupational success is mostly due to the social origin of one’s own family. In that case, there might be the option for various political and social interventions to amend this issue for individuals from socially disadvantaged families. Nowadays, most modern societies have already implemented such mechanisms, especially through schooling and institutionalized educational support and tutoring, attempting to prevent the reinforcement of social inequalities and grant all individuals fair access to education and occupational positions. In general, a society that upholds meritocratic standards should be interested in reducing the influence of social origin to enable bright minds to reach their full potential for the benefit of everyone. The general belief is that intelligence and abilities should usually be the main driver behind success.
The current study adds to the discussion by providing some new relevant insights based on high-quality German panel data. In Germany, one of the most important educational outcomes is whether an individual obtains higher education eligibility (HEE, Abitur) after secondary schooling. This qualification grants direct access to all tiers of tertiary education. The study’s first research question (RQ) is to analyze how strongly SES and early academic performance, measured by comprehensive performance tests at the very beginning of secondary education, predict educational success about 9 years later. The second RQ tests whether social origin and academic performance can compensate for each other, meaning that a low academic performance can be counterbalanced by a higher social origin regarding educational success and vice versa. The third RQ extends these first two questions to whether the qualification has been obtained and, if so, analyzes the grades that have been awarded. The final grade of the Abitur is highly relevant since some tertiary pathways are restricted, and only individuals above a certain threshold can enter (e.g., studies like medicine or psychology). Grades are important because better grades are signals later in life and can open up more pathways and positions.
First, some central concepts should be defined in more detail to clarify what this study intends to analyze. Social origin, also called socio-economic status (SES), is the total amount of material and immaterial resources a family can access and invest in their offspring. In this terminology, SES is considered a multidimensional construct comprising various other factors, such as financial endowment or total household income, parental education levels, parental positions in the labor market, or the social hierarchy (Blossfeld, 2019). When discussing children’s development, the parents define this status since the child is too young to contribute to any of these factors. Further below, how these different SES factors can contribute to educational outcomes will be outlined. The second central concept is intelligence, which comprises multiple dimensions and sub-concepts. To simplify this definition and restrict the meaning to the following analyses, it makes sense to view it as academic performance, which is the cognitive ability to be successful in the (mostly) institutionalized educational systems all modern societies offer. This is a narrow and rather specialized definition. However, it is useful in the following context as not all cognitive ability or intelligence forms are equally helpful for obtaining educational qualifications in a standardized system.
To understand how filial academic achievement and parental SES can influence educational outcomes, a (simplified) causal diagram can be helpful (Figure 1). As recent research points out, it makes sense to take parental cognitive variables and even genetic information into account since intelligence is largely hereditary, as filial genes depend on parental genes (Marks and O’Connell, 2023). This means that some share of final intelligence or cognitive ability is already determined at birth and cannot be influenced anymore. This is expressed in the figure through the upper pathway, where parental genes cause filial genes, which, in turn, are the source of intelligence or cognitive ability. Educational outcomes, which depend on academic achievement, depend on these cognitive ability forms. Note that this is from a theoretical perspective and cannot be considered with the available data. This pathway is only one part of the complete story since another share of cognitive ability is not due to genes and can be influenced by other factors. Research shows that only about 50% of the variation in intelligence is due to shared genes (Haworth et al., 2010; Plomin et al., 2013). This is depicted through the lower pathway in the diagram. It should be highlighted that parental SES is also, to some extent, due to parental genetic endowment, for the same reasons explained, as more intelligent individuals often achieve a higher social status, on average. As pointed out recently by Marks and O’Connell (2023), the effect of SES on any outcome can be spurious as long as there is no measurement available for genetic information. As soon as some measurement of parental genes or derived influences (such as parental cognitive ability) is taken into account, the causal effect of SES on various educational outcomes is reduced (Carneiro et al., 2013; Dickson et al., 2016; Baier et al., 2022).
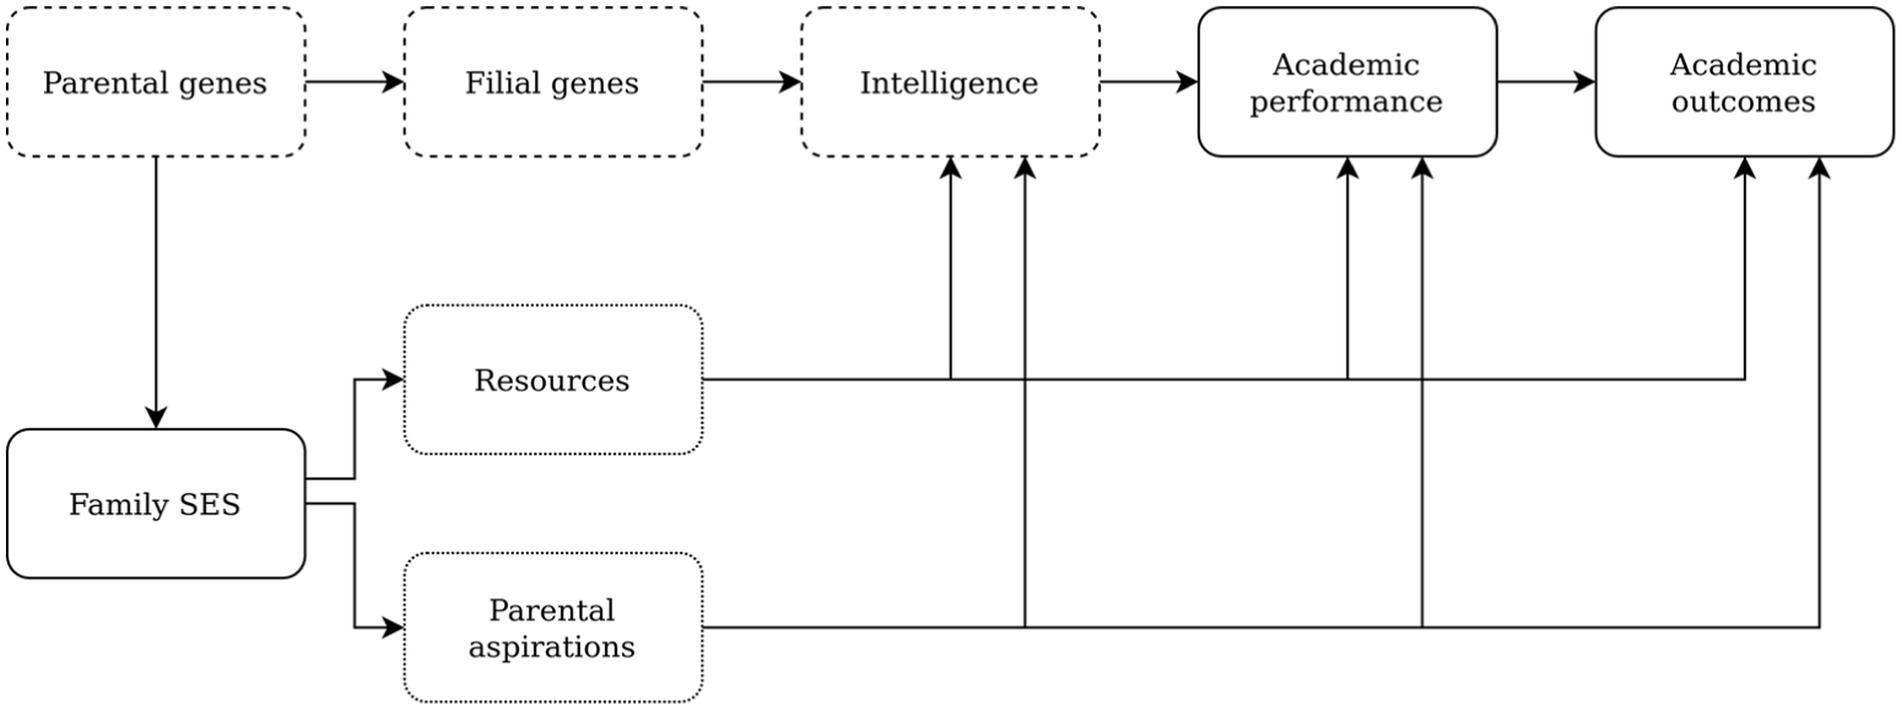
Figure 1. Simplified theoretical model to explain academic outcomes. Source: own design. Dashed boxes represent unmeasured (hidden) influences. Dotted boxes are mediators of SES.
Still, SES can influence intelligence, performance, and grades through various pathways. Parents with higher incomes can invest more money in adequate nutrition, books, and learning tools or provide a better environment to study. They can afford extra tutoring and choose better schools. Hence, SES can provide a better environment for the child, influencing intelligence and biological and neurological development in childhood. However, non-monetary factors can also have a huge impact. More educated parents value education more and carry higher aspirations for their offspring, meaning they are more motivated to obtain at least identical, if not better, qualifications (Boudon, 1974; Buchholz, 2016; Bittmann, 2022). They can navigate the educational system more easily and might influence the teachers for better grades and outcomes (Bittmann and Mantwill, 2020).
When the intention is to compare the influence of academic performance/intelligence and SES on educational outcomes, the theoretical assumptions outline that this is complex due to the various interrelations. While intelligence has a major influence, it also depends on SES to some extent and could, hence, be regarded as a (partial) mediator. However, SES itself, in turn, is to some extent based on shared genes, which can render the effect of SES on outcomes spurious (or at least weaken them). Due to these various interdependencies, the interpretations and conclusions from the following analyses should be made carefully, especially since some theoretical constructs, such as genetic information, are unavailable.
Next, the current state of research is summarized. However, as explained above, most studies do not rigorously compare the influence of SES and cognitive factors and can only serve as an approximation. However, there are a few relevant exceptions. One study with data from the United Kingdom analyses the influence of SES, intelligence, and personality traits on a large number of relevant outcomes (Haider and von Stumm, 2022). The authors report that when educational attainment, measured by the highest educational degree at age 23, is studied, the results show that all three main factors together explain about 30% of the total variance, where SES has the highest impact with about 13% and slightly less influence of IQ (about 11%). However, it must be made clear that these shares are independent contributions of each factor and do not account for shared variance. They also report that about 21% of the effect of family SES on this outcome is mediated through IQ. Another study with United Kingdom data compares the influence of SES and genetic information. It concludes that genetic information explains 14% of the variance of educational outcomes throughout secondary education, while SES explains about 23% (Von Stumm et al., 2020). The study also shows that the effects of the two influences are mostly additive. High SES is better able to compensate for low “cognitive ability” than vice versa (ability was not measured but derived from genes directly through genome-wide polygenic scores).
Overall, as past research shows, it is clear that SES can influence educational outcomes. While some studies can demonstrate that this causal effect is reduced as soon as genetic information is considered, it is still present. For multiple reasons, the following analyses will provide new research insights beyond the current literature. First, the NEPS data offers a high-quality longitudinal perspective with a very long window of observation (more than 10 years), meaning that not only intermediate outcomes (such as grades or test scores) are available but also final and relevant outcomes such as school-leaving qualifications and final grades. Second, the data offer a rich set of variables to measure concepts of interest comprehensively, which is most relevant for SES and academic performance. Additionally, relevant control variables are included as well. However, it should also be made transparent that no genetic or parental cognitive information is available, and hence, no causal effect of SES on outcomes can be estimated. Third, the analyses compare the influence of SES and performance with a high level of insight and in a statistically valid way to clearly distinguish the relative influence of each construct and quantify the uncertainty around point estimate for correct inference. This is of great interest to the ongoing research debate, which often attempts to rank and compare intelligence to SES, yet needs to be more precise. Fourth, in a similar statistical fashion, it can be demonstrated whether or not both constructs can compensate for each other and to which degree can be relevant for assessing how fair and meritocratic the German educational system is.
The German National Educational Panel Study (NEPS) is a well-suited dataset to answer posed research questions (NEPS Network, 2024). The NEPS is the largest and most ambitious panel study in Germany to investigate the role of education in the life course, running since 2010/11. Starting cohort 3 (SC3) is selected within the NEPS, which is a sample of students at the beginning of secondary schooling (Blossfeld and Roßbach, 2019; NEPS Network, 2021). The data fit the research questions well since it is a long-running panel study where students were surveyed approximately annually since 2010/11. Due to this long time frame, almost all students have by now left secondary schooling and have entered either the labor market or tertiary education, meaning that no right-censoring should occur. As students were approximately 11 years old in 2011, and 12 annual waves are available in the most recent data version, they are now about 23 years old. At this age, almost all students have acquired some form of secondary schooling degree, so the outcome of interest is available. Furthermore, the NEPS contains a wide range of relevant explanatory and control variables and information from parents and teachers. In addition, the NEPS conducted various performance tests within the classroom setting multiple times throughout the study to gain precise information about various competence domains, such as reading or mathematics.
There are only two sample restrictions imposed. The first is that only students are retained for analyses who participated in wave one of the survey. This means that some refreshment cohorts, drawn later to add more students to the survey, are removed from the sample as, for them, no early achievement tests are available. This information is crucial and cannot be missing because this is a central explanatory variable. The second restriction is that students who attended a special needs school (Förderschule) in wave one are excluded. This is a rather special group of students with usually very different life courses, where theoretically explained assumptions do not properly apply. Given the 6,112 students in the sampling frame in wave one, a sample of 5,208 individuals for the following analyses is retained. Missing information will be imputed as described in more detail below.
The central dependent variable of the following analyses is whether a student has successfully obtained any form of higher education eligibility. For this purpose, the NEPS SC3 surveys from wave eight on (2016/17) were used to determine whether the student had obtained any school-leaving certificate. The time of completion and the final grade are recorded. By checking this longitudinal information, the highest-ever achieved degree can be deducted. For this study, it is irrelevant when or how (at which track or school) the degree has been obtained. Some students attend the academic track and are awarded the degree directly after completing eight or nine school years; others start at a lower school form and use sequential upgrading to arrive at a higher degree, obtaining one or multiple lower degrees first. The censoring occurs only in the most recent wave (12) in 2020/21. However, as argued before, it is a rather rare occurrence for individuals to achieve school-leaving degrees at this age (while it is clear that second-chance education is possible in Germany, and even adults can obtain these degrees at a much older age). The binary outcome variable indicates whether the general higher education eligibility (HEE, allgemeine Hochschulreife / Abitur) or the restricted HEE (Fachhochschulreife) has been obtained. Students with any of these two degrees are coded with 1, and students with a lower or no degree are coded with 0. This binary coding has been chosen since obtaining the HEE restricts whether it is possible to continue to tertiary education, a major difference from any lower degree. It is both a theoretical and empirical relevant distinction that serves as a good indicator of further success. If a student is eligible, their final grade has also been registered. In the German system, this final grade can range from 1.0 (best grade) to 4.0 (worst passing grade). This will be the second outcome variable to see how well students did on their degree. Note that this second outcome has a lower case number since only students who obtained the HEE are retained.
The first main explanatory construct is the academic performance a student shows. Often, school grades are used for this purpose, which has several problems, such as a rather low variability (only grades from 1 to 6 are available, with very little usage of the two worst grades) and a large influence of teachers (tertiary effects), which add a further bias to this measurement. Instead, the comprehensive NEPS performance tests, conducted in wave one of the survey, are used (conducted between September 2010 and January 2011; Fuß et al., 2019). Five domains were tested at this point (math, reading competence, reading speed, orthography, and basic cognitive skills). Based on initial statistical analyses, such as correlation analyses and tests of unidimensionality, as well as theoretical considerations, three of them were retained and combined to form one single performance indicator: the scores of the math, reading, and orthography tests. Being able to read and write well is a highly relevant factor related to general intelligence. Math is also relevant since it is known that math achievement and IQ are significantly correlated (Moenikia and Zahed-Babelan, 2010), rendering this score well-suited for operationalizing overall academic achievement. The first step in this process is the computation of plausible values (PVs).
In contrast to point estimates, which are useful for comparing students to each other, it is well-known that PVs are better suited to compare groups on the population level as they provide less biased estimates (Lüdtke and Robitzsch, 2017). The PVs are generated using a technique similar to estimating imputed values, as multiple scores are generated for each student. In this process, a large set of background variables is utilized to generate less biased scores at the group level. After the generation of the PVs, the cross-correlations are tested to see if a single performance score with high internal reliability and validity can be formed. The first step is to test the unidimensionality, utilizing a principal component analysis (PCA). The results show that the three domains, math, reading competence, and orthography, yield a single component with an Eigenvalue larger than 1 (2.2) and a Rho of 0.75. This demonstrates empirically that the performance tests are based on the same source of performance and represent some form of general achievement or performance. The scores of the three variables are averaged for each student; the resulting variable is highly reliable (Cronbach’s Alpha = 0.825). The performance score is normally distributed and has been z-standardized to have a mean of 0 and a standard deviation of 1, which is relevant for the following analyses.
As outlined before, it is beneficial to consider the SES of a student as a multidimensional construct that includes various aspects that are relevant to measuring social status and origin precisely. The NEPS includes a wide range of suited variables, enabling the creation of such a construct. Given that often information about both parents is available, the amount of information is considerable and makes it possible to arrive at a final measurement that is not only precise but also displays a large variability over the entire sample, which is a large advantage over using the information of a single parent (Thaning and Hällsten, 2020). Generally, one can consider social origin to be a rather time-constant and stable construct that does not change rapidly. Consequently, to extract the most information possible from the dataset, the parental questionnaire from multiple waves is used, if necessary. For example, if a parent did not respond in wave one but in wave three, this information is used. If multiple waves contain valid info, either the highest value is used (for categorical variables), or an average is computed (the median overall available waves to generate a value that is rather robust to changes over time).
Next, all distinct variables used are described. The first variable is the total household income of the family, adjusted as the OECD equivalent (to account for the number of individuals in the household). To ease inference, this variable has been logarithmized to arrive at a more normally distributed score. This variable measures the financial means a family has available to support the student and how much money can be invested in support, such as tutoring, or equipment, such as books or a room to study. The second variable is the social status of both parents, measured by the occupations held in the labor market. This information can be used to generate the ISEI (International Socio-Economic Index of Occupational Status), a numerical score that ranges from 16 (cleaner) to 90 (judge). A higher score indicates a higher social status in the occupation held. If available, information on both parents is included. Finally, parental education is used and measured with the CASMIN scale. This variable has nine levels, from no educational degree to tertiary education, for both parents (for a detailed overview of the CASMIN, refer to Supplementary Table A1). The generation of a single continuous score out of all mentioned variables is as follows. First, a PCA is conducted to test the dimensionality of these variables. Only a single score with an Eigenvalue larger than one is retained (3.0), Rho is 0.60. This means that the assumption that all five variables load on a single dimension is correct. Empirical Bayes Means are applied in an SEM framework to arrive at a variable with a common scale (Ip and Molenberghs, 2010). This process makes it possible to incorporate the information of all variables, even if measurement scales differ, and respects the original scaling (continuous or ordinal). It creates a latent SES score that is normally distributed and correlates highly with each of the original variables (Spearman’s Rho >0.74). The final score is also z-standardized, rendering it comparable to the academic performance score.
As is common when only observational data is available, the robustness of the results can be strengthened by including control variables. To arrive at unbiased results (as far as possible), all variables that influence the causes and the effects of the analyses should be selected. This means that variables that can influence academic performance, the social origin of the family, and the propensity to obtain an HEE must be selected. However, there are not so many variables that can influence the social origin of a family. Typical controls used in student or school analyses, such as the gender of the child, are therefore not necessary. What is necessary is the migration background of the family, which is measured with four levels: the child is born abroad and moved to Germany later. If the child is born in Germany, three alternatives are possible: none, one, or both parents are born abroad. The size of the household is included, as well as the age of the father and mother (computed in 2011). Finally, the federal state of residence is surveyed in wave one. This is relevant since the educational systems can differ between states due to the strong federal structure in Germany. While the main degrees are identical, school forms and objectives can differ slightly between states, which should be accounted for. As past research indicates, educational reforms are also carried out differently by state, which can create heterogeneous educational landscapes, even within Germany (Helbig and Nikolai, 2015; Schindler and Bittmann, 2021). Not accounting for these aspects might bias the findings. States can also be related to SES since the occupational structures or general wealth might differ between states. Genetic information of the parents or at least proxies (such as parental intelligence scores) might be necessary to arrive at completely unbiased results, which are, however, not available. This should be regarded for the interpretation of the results.
A set of analyses is conducted to answer the research questions. The first question is which independent variable influences the outcome variables most. To do so, dominance analyses are computed, which can quantify the marginal share of explained variance in the outcome. As soon as more than two explanatory variables are present, which are also correlated, a nested regression design is not adequate anymore, and dominance analysis is the superior way of analysis (Budescu, 1993; Azen and Budescu, 2003). In a dominance analysis, many regression models are estimated, which include all possible combinations of independent variables. By averaging the explained variances of all models, the marginal explanatory share of each variable can be estimated validly. For a nontechnical introduction to the approach, refer to Bittmann2. This method allows it to rank the predictors by their relative marginal importance, which is the main goal of the first research question. Note that reported shares of explained variance are neither “net” nor “gross” as they are the averages of many regression models, most of which include other variables. Inference is facilitated by applying bootstrapping to generate standard errors and confidence intervals (Efron and Tibshirani, 1994; Bittmann, 2021). Second, regression models are estimated to test how well the two main predictors, performance and social origin, can compensate for each other. Logistic (outcome HEE, yes or no) and OLS (outcome grades) regression models are estimated with the explanatory variables performance, social origin, and all control variables. All relevant interactions between performance and SES and higher-order terms are included to account for non-linear effects. OLS has been chosen for grades since grades are measured on a continuous scale from 1.0 to 4.0 with decimal values available, as the final grade is an average of multiple tests. Since the numerical interpretation of such large models is difficult, a graphical approach is chosen to visualize the estimated chances of success neatly. For a more rigorous numerical approach, the two main explanatory variables are binned into three groups each (below −1 standard deviation from the mean, −1 to +1 standard deviation around the mean, and above one standard deviation of the mean). This creates a 3×3 matrix with nine groups, which can be compared statistically using confidence intervals and numerical tests. The standard errors are clustered by school since performance tests were conducted in the classroom context in grade five.
One of the biggest challenges of the data is panel attrition. Since the panel is long-running, attrition is common as more and more participants drop out of the survey. This is a problem for the outcome variables as they are measured at the end of the observation window. For example, of the initial 5,208 students in the sample, 3,415 are left in wave nine and only 2,034 in wave 12. To combat this issue, imputation methods are widespread in statistics to reduce bias due to selective dropout. Multiple imputation with chained equations (MICE) to impute all missing variables in the dataset is utilized. Furthermore, a large set of auxiliary variables is included to enhance the quality. Besides the missing outcome variables, missing parental information is a second issue. Since participation is voluntary, about a third of all students do not have parental information. However, plenty of information in the student questionnaire can be used to impute parental information. Overall, there are more than 20 variables with low missing rates yet high correlations with missing values, which should enhance the imputation procedure immensely.1 By doing so, bias due to selective attrition can be amended. The imputation model is based on the scaling of the variable of interest (e.g., predictive mean matching for continuous variables, logistic for binary, etc...). A total of 50 datasets are generated in this process to reach high precision and reduce Monte Carlo error. Common quality measures to assess the imputations have been conducted with fine results, indicating no problems using imputation methods. All analyses are conducted in Stata 16.1 under the usage of the additional packages domin (Luchman, 2015), heatplot (Jann, 2021), and coefplot (Jann, 2014). Plausible values are generated in R with the package NEPSscaling (Scharl et al., 2020). Bootstrapping with imputed data is carried out by the Boot-Impute approach, which promises the highest quality (Bittmann, 2024).
First, some descriptive results are presented to give an overall impression of the data. 48.4% of the students are female; the average age in January 2011 was 11.0 years (SD = 0.68 years). 78.1% of the students only speak German at home, the rest either German and another language or only another language. 26.6% of all students come from a single-parent household. 46.7% of all students attend the academic school track (Gymnasium) in grade eight. Supplementary Table A1 lists a descriptive overview of all variables of interest (excluding auxiliary variables or student characteristics). Since the normality of both key constructs is relevant for a fair comparison, binning, and inference, the univariate distributions are shown in Supplementary Figure A1. Next, the bivariate distribution of performance and SES is visualized in a bivariate histogram in Figure 2 on the left side. This plot shows the distribution of data points. Lighter areas contain more cases, and darker ones have fewer cases. The two variables are approximately jointly normally distributed. This also indicates that some constellations are rare or unavailable, such as having a very high SES and low performance. A binned scatterplot21 with a linear regression fit is depicted on the right side. Binning, collapsing similar data points into fewer dots, gives a clearer overview due to the high number of cases. This graph clearly shows a rather strong and linear relationship between the two key variables, also indicated by a moderate correlation (Pearson’s r = 0.483).
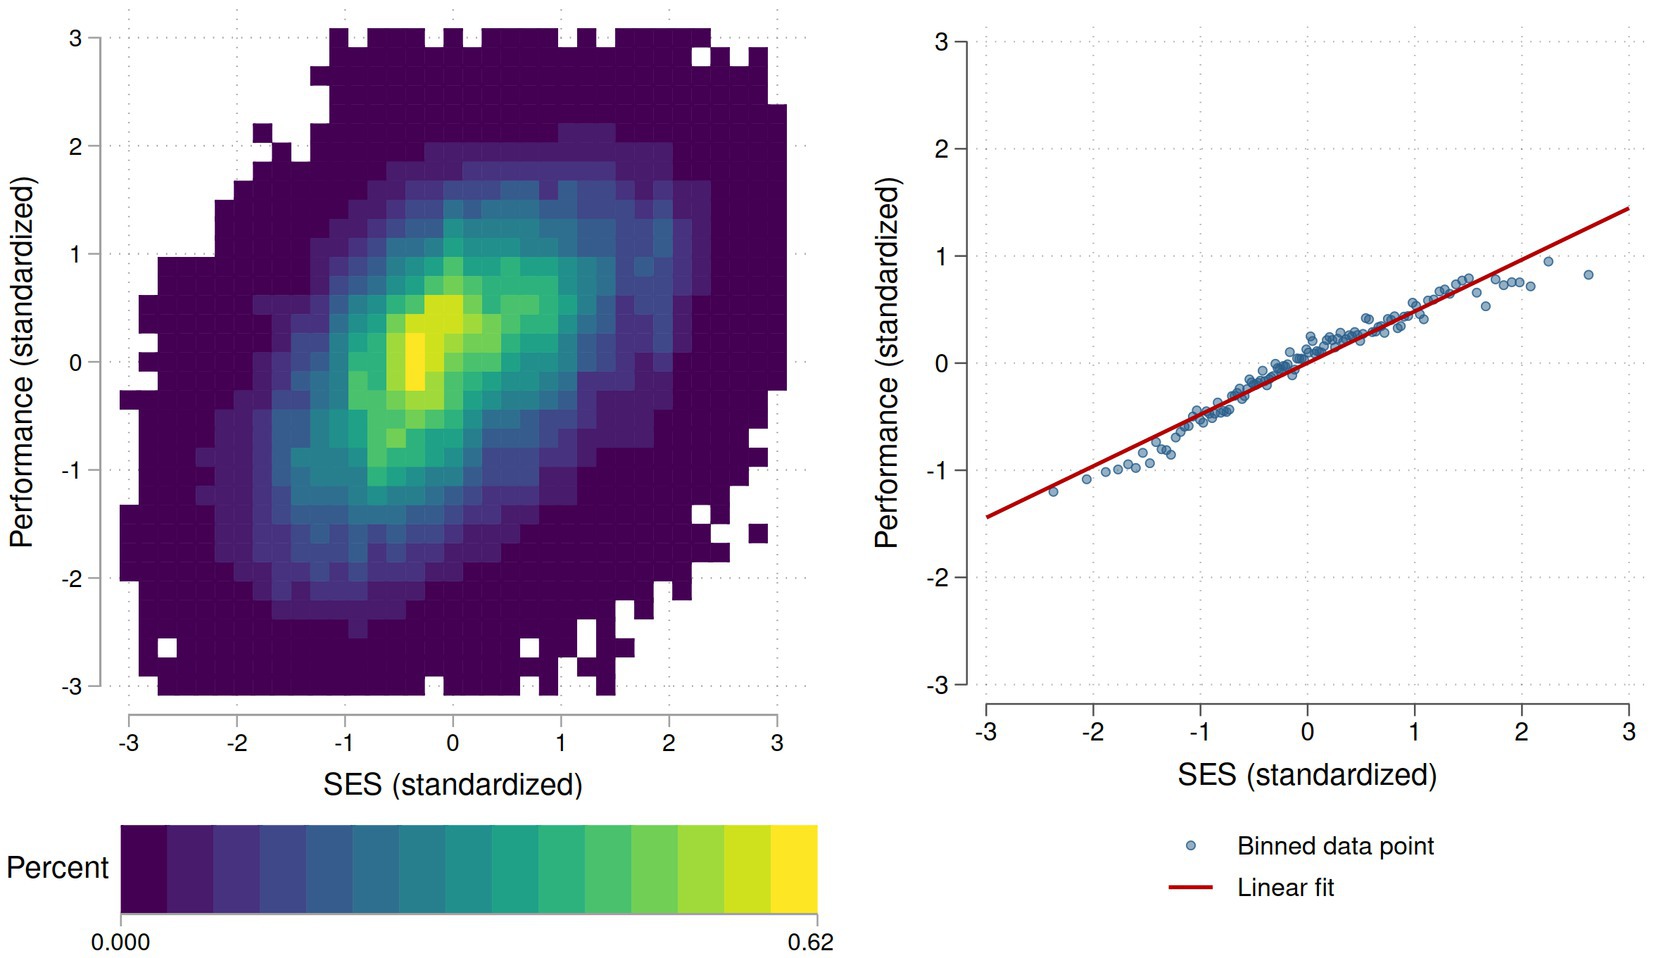
Figure 2. Bivariate histogram (left side) and binned scatterplot (right side). Source: NEPS SC3, imputed data (M = 50). N = 5,208. Lighter areas indicate a larger density and hence a higher number of available data points. The right graph is generated using scatterfit by Leo Ahrens.
The first goal of the analyses is to estimate how strongly performance, SES, and control variables can explain and predict the outcomes done with dominance analyses. The share of explained variance is decomposed for each explanatory factor. Note that the control variables are considered as a single set. The results are depicted graphically in Figure 3. 95% confidence intervals are generated using a bootstrapping procedure (based on 1,000 replications). Note that case numbers differ as the models for final grades only include students who did obtain the HEE.2
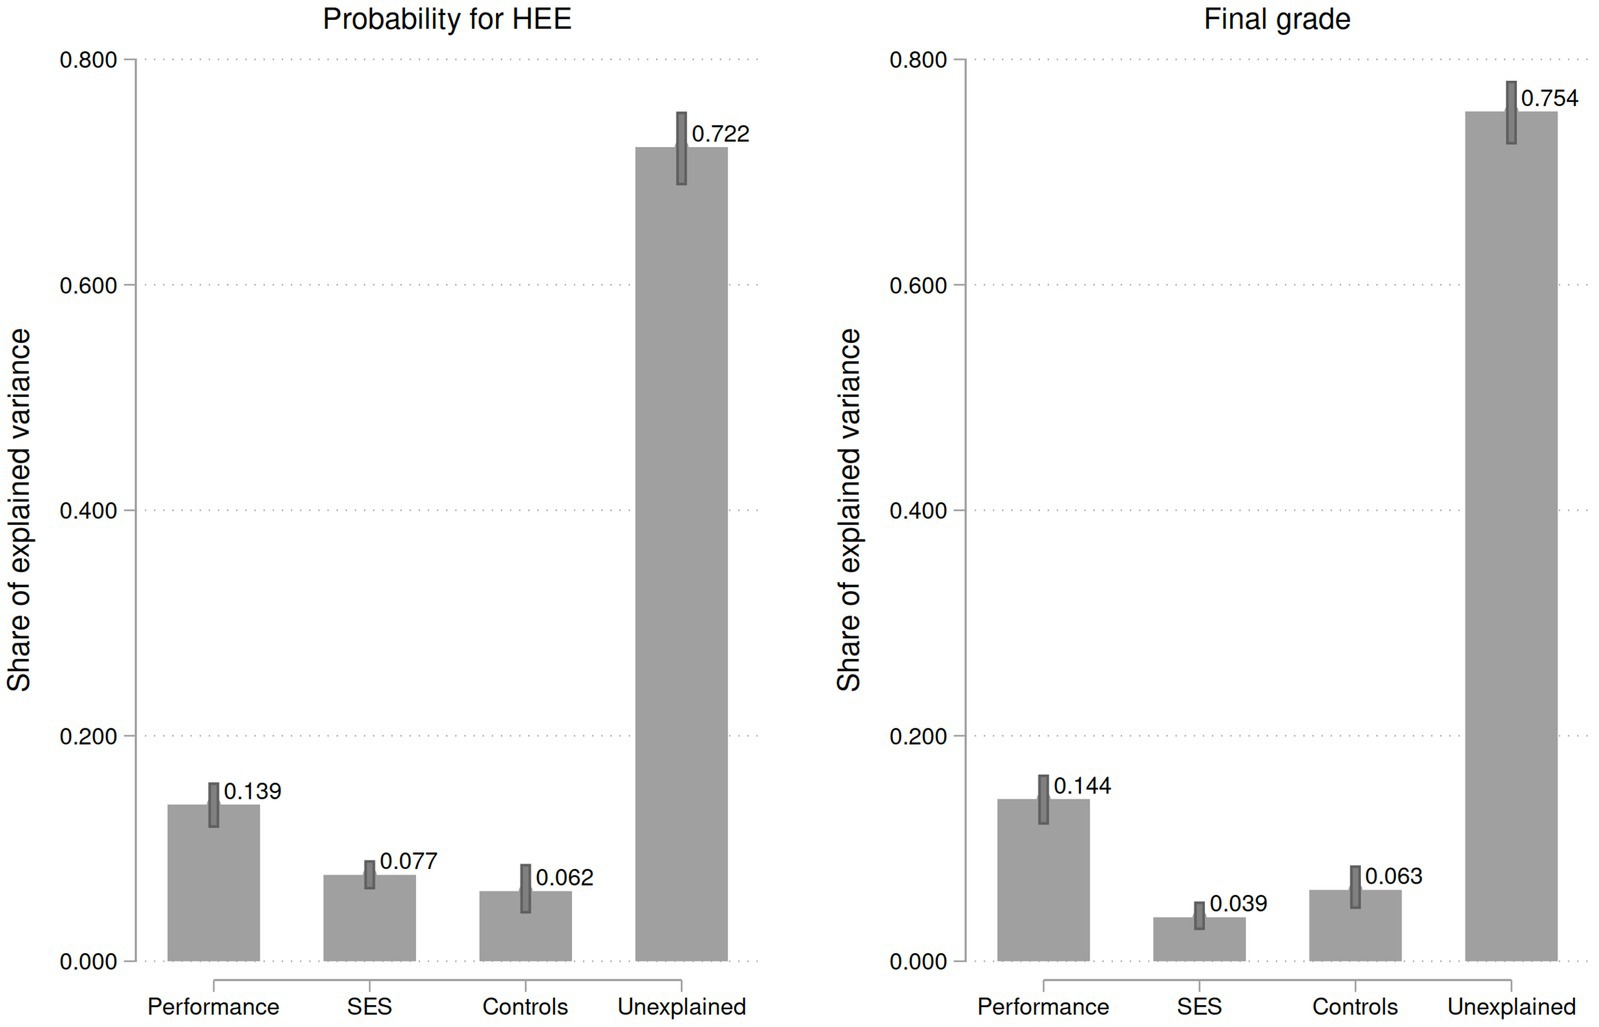
Figure 3. Marginal explained variance in each outcome. Source: NEPS SC3, imputed data (M = 50). 95% confidence intervals based on 1,000 bootstrap replications. N = 5,208 / 2,906. HEE, Higher education eligibility.
For the propensity to obtain a HEE, academic performance explains more variance than SES and statistically significantly so since the CIs do not overlap. The controls only contribute a minor share with about 6% additional explanatory power. The complete model explains about 28% of the total variance, meaning that the large share of more than 72% remains unexplained. For the final grade, the results are similar. While the influence of performance is comparable, the share of SES is smaller and less than half as strong as for the first outcome. This means that only a tiny part of the overall grade variation can be explained by the comprehensive SES measurement, and other potentially unknown factors are more influential.
Next, one would like to visualize how performance and SES predict outcomes and how they interact. Regression models, including controls, are estimated, and predicted outcomes are generated for each observation. The influence of performance and SES can be visually deducted by plotting these data points using heat plots. A logistic model is used for the outcome probability to obtain HEE, and for the outcome grades, a truncated regression model (since grades are bound between 1.0 and 4.0). The results are visualized in Figure 4.
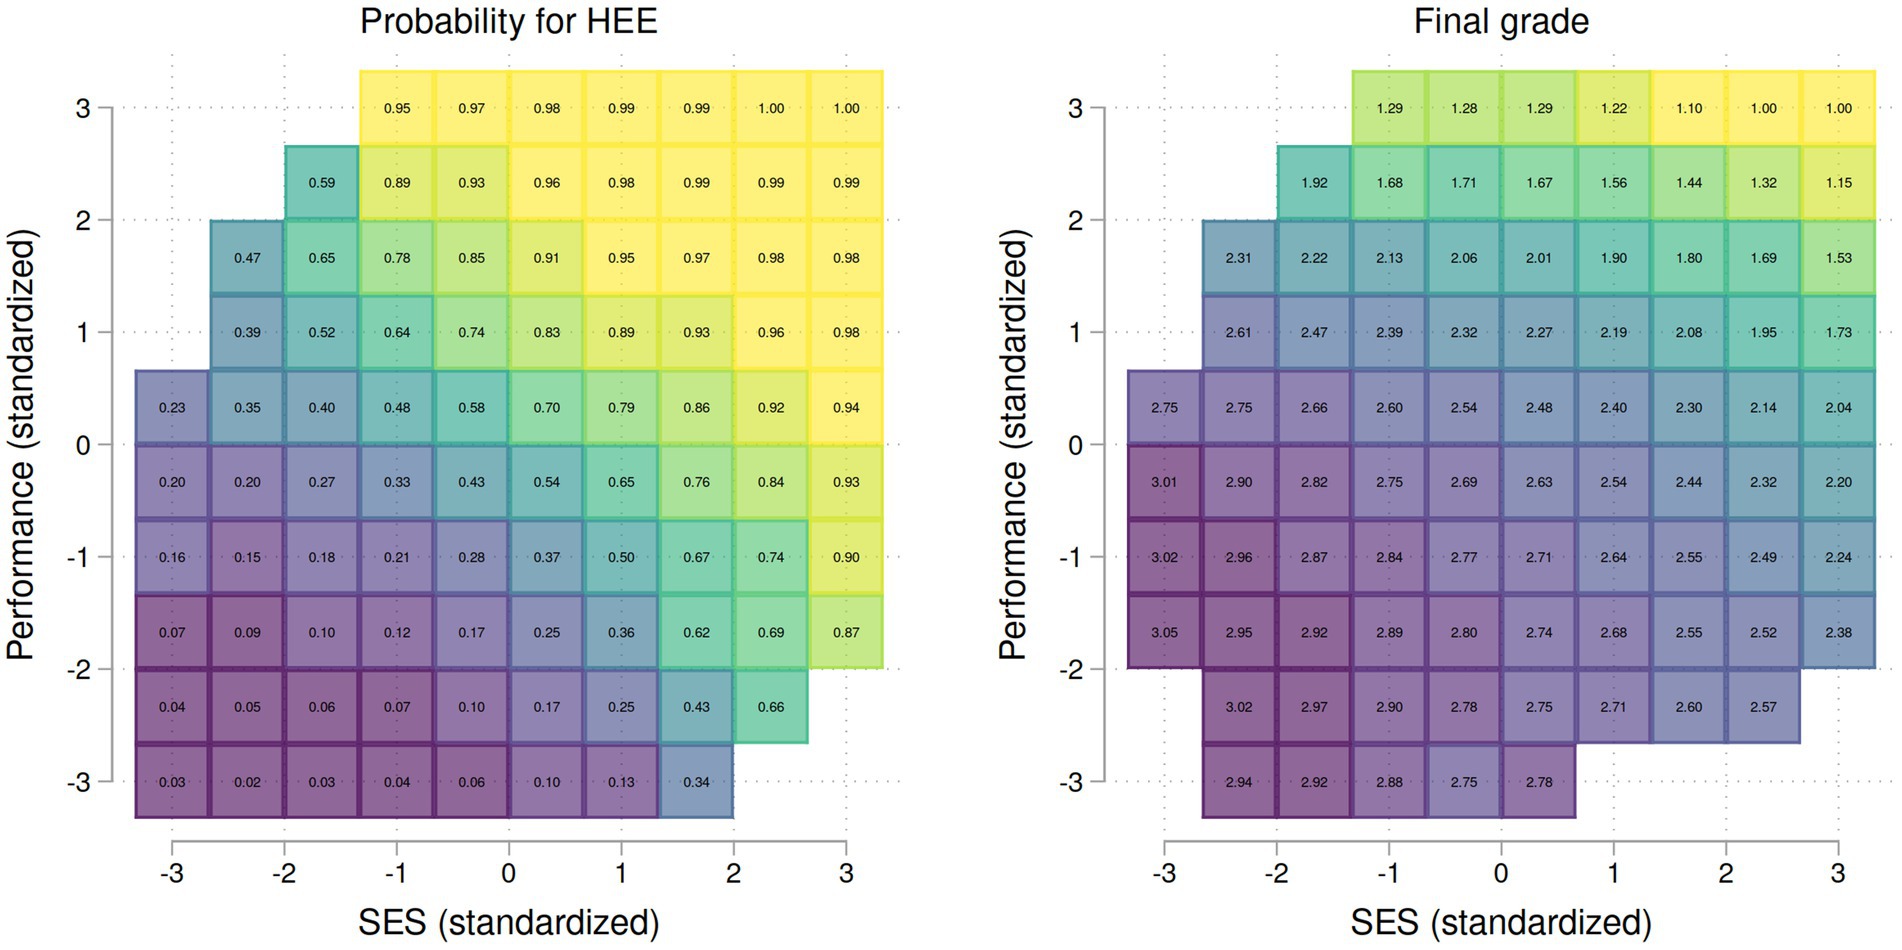
Figure 4. Heatplots visualizing predicted probabilities and grades. Source: NEPS SC3, imputed data (M = 50). N = 5,208/2,906. On the left side, probabilities are predicted, ranging from 0 to 1. On the right side, final exam grades are predicted, ranging from 1.0 to 4.0 with lower values representing better grades. HEE, Higher education eligibility.
On the left side are the predicted probabilities for obtaining the HEE. Students with above-average performance and SES have a high probability of obtaining the HEE, which is close to 100%. On the other end of the graph, when both performance and SES are very low, the chances to obtain the HEE are, in turn, very small and close to zero. In between, basically all values are reached, with the exception of a few areas where no data points are present. This means that some constellations of SES and performance do not exist empirically. This concerns mostly extreme constellations with a very high SES and a very low performance and vice versa. What can be concluded from this fact is that some compensatory effects must be present, which run in a certain causal direction (since SES can influence performance but not the other way around). Hence, having a very high SES protects from very low performance. Regarding the overall results, the visible gradients make sense, and either a higher performance or a higher SES is associated with better chances of obtaining the HEE. Continuing with the final grades, rather similar patterns are visible. Note that the total number of observations is smaller since only students who obtained the HEE are included in the analysis. As smaller numerical numbers represent better grades in the German system, the findings show that having a lower performance or coming from a lower SES background is associated with worse grades. However, using the figures alone, it is not easy to see whether performance and SES can compensate for each other and how strong these compensatory effects are. The next and final analysis tests whether performance and SES can compensate for each other and how strong these effects are. This is done by first binning both variables to create larger groups and comparing them using regression models. Binning means that distinct values are grouped in broader categories to reduce the number of potential pairwise comparisons and increase statistical power. The bins are chosen as follows: having a value below 1 SD from the mean, a value of ±1 SD from the mean, or a value larger than 1 SD from the mean. This is applied to both key variables (performance and SES). The results are shown in Table 1.
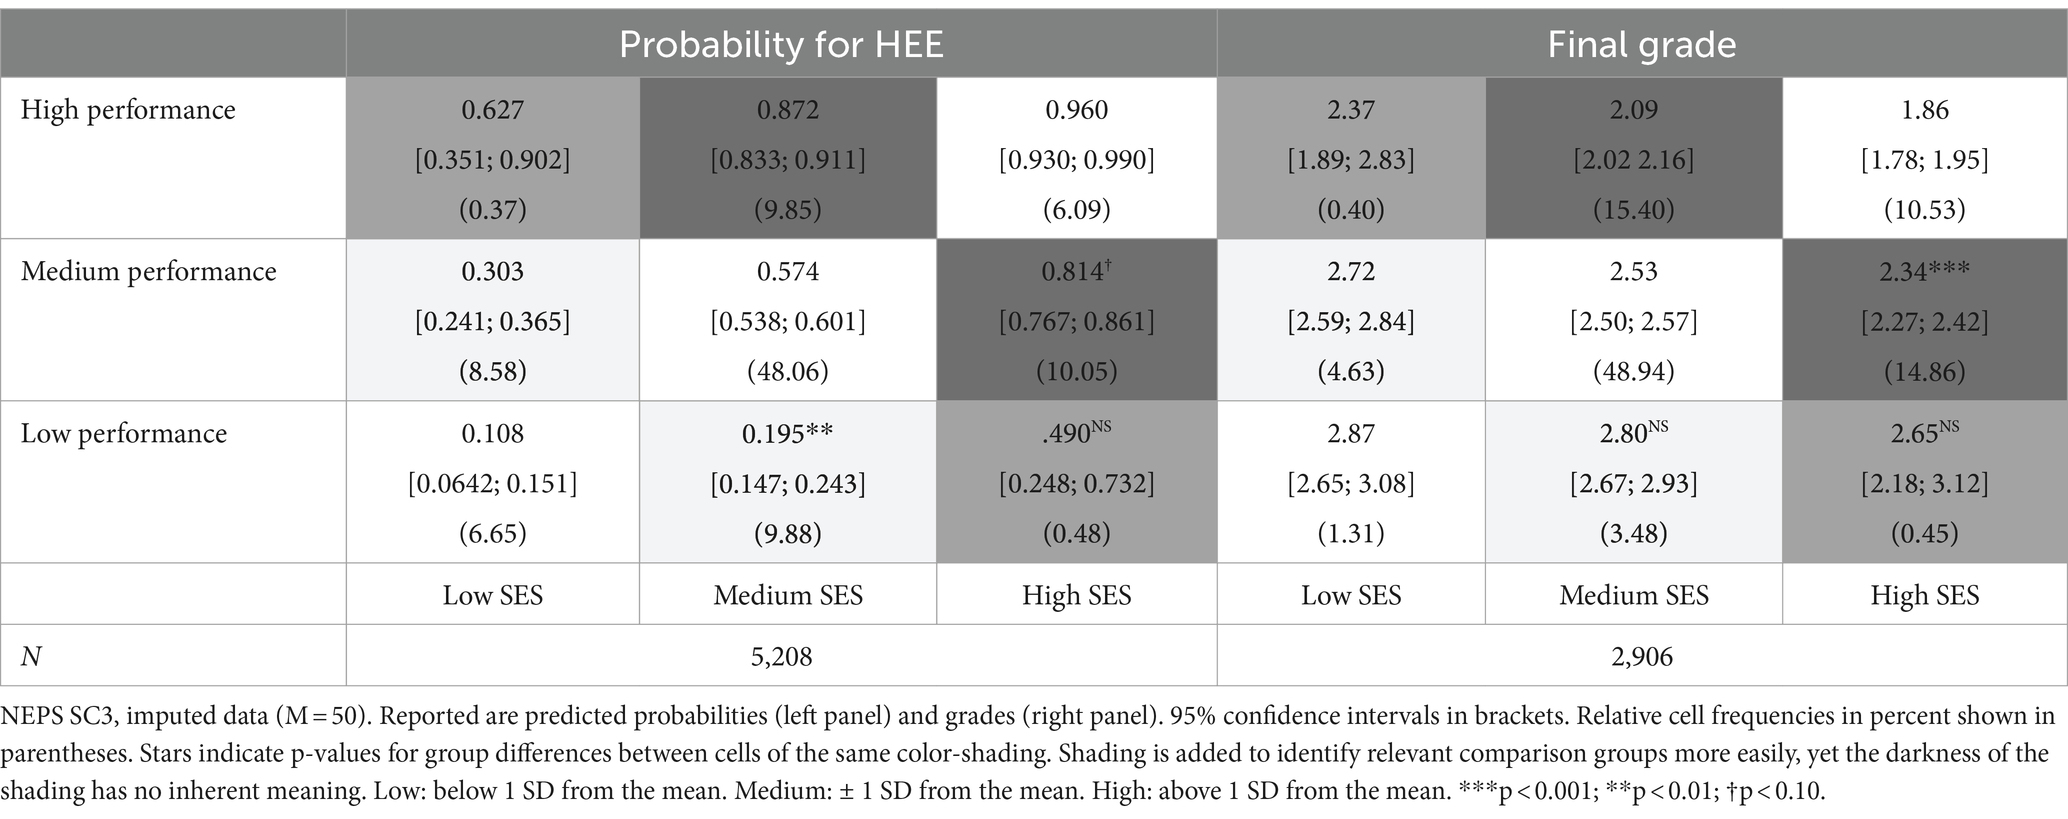
Table 1. Average outcomes for binned variables including statistical test information.
Table 1 contains the same results as Figure 4 but with broader categories to have a better foundation for a numerical comparison. Diagonal groups can be compared to see whether compensatory effects of performance and SES are present, which are color-coded for better identification. The first comparison is between medium performance/low SES and low performance/medium SES (0.303 vs. 0.195). This means that one group has a probability of about 30% to obtain the HEE, while for the other group, this probability is only about 20%, which is a meaningful difference. A Wald test indicates that this difference is statistically significant on the 1% level. This means that performance can better compensate for SES than vice versa. The next comparison (0.627 vs. 0.490) is not statistically significant, even when point estimates differ. The relatively small group numbers (below 0.5%) are due to the extreme constellations, which are uncommon, as discussed before (since performance and SES are correlated). The last difference (0.872 vs. 0.814) is statistically significant at the 10% level and indicates a small advantage in performance over SES.
The results for the final grade are shown on the right side of the table. Here, two group comparisons are not significant with a p-value larger than 0.10 (2.72 vs. 2.80 and 2.37 vs. 2.65), even though the point estimates are different and show a benefit of performance over SES. One comparison is statistically highly significant (2.09 vs. 2.34). It shows that performance can better compensate for SES than the other way around since smaller values indicate better grades. The trends are always the same, even if not all results are statistically significant. A higher academic performance is better able to compensate for a lower SES than a higher SES can compensate for a lower performance.
What is more important to predicting and explaining educational outcomes, such as the probability of obtaining an HEE or having a good final grade? Overall, the empirical results provide some new insights here. First, starting with the description, early academic performance, and SES are strongly correlated. This could mean a few things. Parents and their offspring share genes, and if SES also depends on genetic endowment (as shown in Figure 1), this correlation can arise solely due to shared genes. However, high-SES families can also invest more in early education (in early childhood, Kindergarten, and elementary school), which can increase academic performance, further contributing to the correlation found at the beginning of secondary education. This finding also highlights that extreme data constellations are uncommon, which is relevant for the inference of all further analyses attempting to compare some rather extreme groups.
The main finding regarding the dominance analyses is that a large share of the variances in the two outcomes cannot be explained. While SES and academic performance are usually regarded as the most influential predictors, keep in mind that these are only two variables in the current study, so it is acceptable that the share of explained variance is not huge. Clearly, the addition of further control variables could increase this share. Following some arguments in the literature, potential candidates to explain more variance are students’ psychological traits and characteristics, or parental cognitive ability. Also be aware of the fact that a very long time has elapsed between the measurement of key constructs and outcomes, which is the main reason why no more variance can be explained. Still, this result indicates that more than a strong focus on constructs popular in research history might be needed to give a complete picture of the processes occurring and educational success, probably due to other relevant factors requiring new research concepts. When the key constructs of this study are compared, it turns out that performance is significantly more influential than SES, which only plays a very small part (especially for grades). Given that the German system is intended to select on the principle of meritocracy, this is a rather positive discovery. Given previous research findings, one can suspect that the influence of SES might be even smaller if some measurements of parental genes were available. These results contrast comparable data with British data (Haider and von Stumm, 2022), which is probably explained by the different analysis strategies (not marginal variance under the control of the other factors). However, interestingly, the absolute share of explained variance in the outcomes is similar. One further explanation is that the time between measuring key constructs and outcomes was shorter (from age 16 to 23), and children were older when measuring IQ (16 instead of 11 years old).
When compensatory effects are investigated, it is clear that high performance can much better compensate for a low SES than the other way around. Even if this finding is not always statistically significant for all group comparisons (often due to a very low number of individuals in a cell), the trend is always present and identical for both outcome variables. This hints at a rather robust finding and aligns with previous results. If performance has this compensatory effect, it means that even students of socially disadvantaged families can achieve fine educational qualifications, even if their parents cannot invest as much as other families. This is also a positive finding and in line with meritocratic ideals. Summarized, the current study provides rather definite results backed up by high data quality and rigorous statistical analyses that enable a valid comparison of the two key constructs. As a side note, there is ample evidence for Bernardi’s (2014) theory of compensatory advantage, even if this is not the focus of the current study. In Table 1, when comparing outcomes within rows (that is, performance is held constant), the success increases drastically with increasing SES. For example, in the group of low performers, the probability of obtaining the HEE increases from about 11 to 49% with higher SES, which is a clear hint of the benefits of coming from a high-SES family.
Lastly, the limitations of the study must be addressed. First, as already outlined in the theoretical overview, this study cannot recover pure causal effects due to the potential confounding influence of parental genes. If one argues that parental genes influence SES, the effect of SES on outcomes might be spurious. This rather new yet highly relevant research aspect deserves attention in educational sociology. As some scholars have argued before, the strong focus on SES, especially prevalent in sociology, might be misguided and omit other highly influential factors, such as genetic information, parental intelligence, or personality traits (Marks, 2020; Marks and O’Connell, 2023). Respecting these factors in future analyses is probably only for the benefit of the field. While this does not mean that previous research is incorrect, it could hint at a less strong impact of SES (as demonstrated in this paper). What the current analyses also cannot provide is completely separating SES from performance. As outlined before, from conception, SES can already influence biological development and, hence, intelligence and academic performance. Even regarded from a conceptual standpoint, it is difficult to see how “pure” intelligence could be approximated since gene–environment interactions will always be present, and there is no such thing as an influence of genes completely independent of the environment a person develops in. Second, measurement error is probably present, and the variables used in this study only approximate theoretical concepts such as SES and intelligence. While having many distinct variables available is a strong argument for using NEPS data, it is clear that other researchers might prefer other measurements for their definition of SES. The same goes for academic performance, which is also not narrowly defined. Third, the analyses report total effects; no specific explanatory pathways are addressed. Hence, it is impossible to see why, for example, SES influences the outcomes and which mediators are relevant. However, as the total influence of SES is already rather small, further separating this effect might be difficult, yet it still appears relevant for further research. Finally, especially regarding the analysis of compensatory effects, even if the overall sample size is adequate, comparing extreme groups will usually result in rather small group sizes, which can be an obstacle to precise inference. Hence, all these results should be interpreted cautiously, even if the tendencies are always the same.
Why do some students achieve high levels of education while others do not? A sociological explanation of this question is of great interest to students, parents, teachers and policy makers. The classic sociological approach that the influence of the parental home and social origin plays a significant role is now being called into question by more and more studies. Other explanatory factors, such as the student’s cognitive performance in particular, are coming into focus. In the current study, we tested these two factors stringently and statistically against each other and can state that both factors have a considerable influence, but that cognitive ability has almost twice the explanatory power. Furthermore, we show that social background and cognitive ability can compensate for each other. Accordingly, educational success at secondary level does not necessarily depend on a single factor. In addition, we would like to point out that the inclusion of other factors, such as the cognitive abilities of the parents and other psychological characteristics of the child (e.g., Big Five), may also be relevant and should be investigated further in future studies.
The dataset is freely available after registration as a researcher. This data can be found at: 10.5157/NEPS:SC3:11.0.1.
The studies involving humans were approved by The NEPS study is conducted under the supervision of the German Federal Commissioner for Data Protection and Freedom of Information (BfDI) and in coordination with the German Standing Conference of the Ministers of Education and Cultural Affairs (KMK) and – in the case of surveys at schools – the Educational Ministries of the respective Federal States. All data collection procedures, instruments and documents were checked by the data protection unit of the Leibniz Institute for Educational Trajectories (LIfBi). The necessary steps are taken to protect participants’ confidentiality according to national and international regulations of data security. Participation in the NEPS study is voluntary and based on the informed consent of participants. This consent to participate in the NEPS study can be revoked at any time. The studies were conducted in accordance with the local legislation and institutional requirements. Written informed consent for participation in this study was provided by the participants’ legal guardians/next of kin.
FB: Writing – review & editing, Writing – original draft.
The author(s) declare that financial support was received for the research, authorship, and/or publication of this article. The publication of this article was funded by the Open Access Fund of the Leibniz Association.
Earlier versions of this paper have been presented in two research colloquia, where I received valuable feedback (Colloquium Empirical Social Research in Konstanz/Weekly Doctoral Seminar in Bamberg). I want to thank all participants for their helpful comments. In addition, two reviewers gave helpful comments.
The author declares that the research was conducted in the absence of any commercial or financial relationships that could be construed as a potential conflict of interest.
All claims expressed in this article are solely those of the authors and do not necessarily represent those of their affiliated organizations, or those of the publisher, the editors and the reviewers. Any product that may be evaluated in this article, or claim that may be made by its manufacturer, is not guaranteed or endorsed by the publisher.
The Supplementary material for this article can be found online at: https://www.frontiersin.org/articles/10.3389/feduc.2024.1404076/full#supplementary-material
2. ^Bittmann (2024). https://www.preprints.org/manuscript/202404.1606/v1
1. ^These variables are school grades and other test scores from varying survey waves, the Big Five personality trait inventory, overall life satisfaction, subjective beliefs of academic success, the number of books in the household, students’ assessment of parental aspirations and filial aspirations, and the type of school track attended.
Azen, R., and Budescu, D. V. (2003). The dominance analysis approach for comparing predictors in multiple regression. Psychol. Methods 8, 129–148. doi: 10.1037/1082-989X.8.2.129
Baier, T., Eilertsen, E. M., Ystrøm, E., Zambrana, I. M., and Lyngstad, T. H. (2022). An anatomy of the intergenerational correlation of educational attainment – learning from the educational attainments of Norwegian twins and their children. Res. Soc. Stratif. Mobil. 79:100691. doi: 10.1016/j.rssm.2022.100691
Bernardi, F. (2014). Compensatory advantage as a mechanism of educational inequality: a regression discontinuity based on month of birth. Sociol. Educ. 87, 74–88. doi: 10.1177/0038040714524258
Bittmann, F. (2021). Bootstrapping: An integrated approach with Python and Stata. 1st Edn. Berlin: De Gruyter.
Bittmann, F. (2022). Investigating the role of educational aspirations as central mediators of secondary school track choice in Germany. Res. Soc. Stratif. Mobil. 81:100715. doi: 10.1016/j.rssm.2022.100715
Bittmann, F. (2024). Applied bootstrap analysis with imputed data in Stata. doi: 10.20944/preprints202401.0813.v1
Bittmann, F., and Mantwill, O. (2020). Gute Leistung, gute Noten? Eine Untersuchung über den Zusammenhang von Schulnoten und Kompetenzen in der Sekundarstufe (good performance, good grades? An analysis of the relationship between grades and competences in German secondary education). SSRN J. 2024:172. doi: 10.2139/ssrn.3724172
Björklund, A., Lindahl, M., and Plug, E. (2005). The origins of intergenerational associations: lessons from Swedish adoption data. Q. J. Econ. 121:999. doi: 10.2139/ssrn.807485
Blossfeld, P. N. (2019). A multidimensional measure of social origin: theoretical perspectives, operationalization and empirical application in the field of educational inequality research. Qual. Quant. 53, 1347–1367. doi: 10.1007/s11135-018-0818-2
Blossfeld, H.-P., and Roßbach, H.-G. (2019). Education as a lifelong process: The German National Educational Panel Study. New York: Springer.
Boudon, R. (1974). Education, opportunity, and social inequality: Changing prospects in western society. New York: John Wiley and Sons.
Broer, M., Bai, Y., and Fonseca, F. (2019). “A review of the literature on socioeconomic status and educational achievement” in Socioeconomic inequality and educational outcomes. ed. M. Broer (Cham: Springer International Publishing), 7–17.
Buchholz, S. (2016). “Secondary school differentiation and inequality of educational opportunity in Germany” in Models of secondary education and social inequality. ed. S. Buchholz (Cheltenham, UK: Edward Elgar Publishing), 79–92.
Budescu, D. V. (1993). Dominance analysis: a new approach to the problem of relative importance of predictors in multiple regression. Psychol. Bull. 114, 542–551. doi: 10.1037/0033-2909.114.3.542
Carneiro, P., Meghir, C., and Parey, M. (2013). Maternal education, home environments, and the development of children and adolescents. J. Eur. Econ. Assoc. 11, 123–160. doi: 10.1111/j.1542-4774.2012.01096.x
Dickson, M., Gregg, P., and Robinson, H. (2016). Early, late or never? When does parental education impact child outcomes? Econ. J. 126, F184–F231. doi: 10.1111/ecoj.12356
Efron, B., and Tibshirani, R. J. (1994). An introduction to the bootstrap. Boca Raton, FL: CRC Press.
Erola, J., Jalonen, S., and Lehti, H. (2016). Parental education, class and income over early life course and children’s achievement. Res. Soc. Stratif. Mobil. 44, 33–43. doi: 10.1016/j.rssm.2016.01.003
Erola, J., Lehti, H., Baier, T., and Karhula, A. (2022). Socioeconomic background and gene–environment interplay in social stratification across the early life course. Eur. Sociol. Rev. 38, 1–17. doi: 10.1093/esr/jcab026
Fuß, D., Gnambs, T., Lockl, K., and Attig, M. (2019). Competence data in NEPS:overview of measures and variable naming conventions (starting cohorts 1 to 6). Available at: https://www.neps-data.de/Portals/0/NEPS/Datenzentrum/Forschungsdaten/Kompetenzen/Overview_NEPS_Competence-Data.pdf.
Haider, Z. F., and von Stumm, S. (2022). Predicting educational and social–emotional outcomes in emerging adulthood from intelligence, personality, and socioeconomic status. J. Pers. Soc. Psychol. 123, 1386–1406. doi: 10.1037/pspp0000421
Hällsten, M., and Thaning, M. (2018). Multiple dimensions of social background and horizontal educational attainment in Sweden. Res. Soc. Stratif. Mobil. 56, 40–52. doi: 10.1016/j.rssm.2018.06.005
Haworth, C. M. A., Wright, M. J., Luciano, M., Martin, N. G., de Geus, E. J. C., van Beijsterveldt, C. E. M., et al. (2010). The heritability of general cognitive ability increases linearly from childhood to young adulthood. Mol. Psychiatry 15, 1112–1120. doi: 10.1038/mp.2009.55
Helbig, M., and Nikolai, R. (2015). Die Unvergleichbaren. Der Wandel der Schulsysteme in den deutschen Bundesländern seit 1949. Verlag Julius Klinkhardt. Available at: https://www.pedocs.de/volltexte/2015/11095/pdf/Helbig_Nikolai_2015_Die_Unvergleichbaren.pdf.
Ip, E., and Molenberghs, G. (2010). “Empirical Bayes methods” in International encyclopedia of education. ed. E. Ip (Amsterdam, Netherlands: Elsevier), 142–149.
Jann, B. (2014). Plotting regression coefficients and other estimates. Stata J. 14, 708–737. doi: 10.1177/1536867X1401400402
Jann, B. (2021). Heatplot: Stata module to create heat plots and hexagon plots. Available at: http://ideas.repec.org/c/boc/bocode/s458598.html.
Luchman, J. N. (2015). “DOMIN”: module to conduct dominance analysis. Available at: https://ideas.repec.org/c/boc/bocode/s457629.html.
Lüdtke, O., and Robitzsch, A. (2017). Eine Einführung in die Plausible-Values-Technik für die psychologische Forschung. Diagnostica 63, 193–205. doi: 10.1026/0012-1924/a000175
Marks, G. N. (2020). Is the relationship between socioeconomic status (SES) and student achievement causal? Considering student and parent abilities. Educ. Res. Eval. 26, 344–367. doi: 10.1080/13803611.2021.1968442
Marks, G. N., and O’Connell, M. (2023). The importance of parental ability for cognitive ability and student achievement: implications for social stratification theory and practice. Res. Soc. Stratif. Mobil. 83:100762. doi: 10.1016/j.rssm.2023.100762
Moenikia, M., and Zahed-Babelan, A. (2010). A study of simple and multiple relations between mathematics attitude, academic motivation and intelligence quotient with mathematics achievement. Procedia. Soc. Behav. Sci. 2, 1537–1542. doi: 10.1016/j.sbspro.2010.03.231
NEPS Network. (2024). National Educational Panel Study, Scientific Use File of Starting Cohort Grade 5. Leibniz Institute for Educational Trajectories (LIfBi), Bamberg.
Plomin, R., DeFries, J. C., Knopik, V. S., and Neiderhiser, J. M. (2013). Behavioral genetics: A primer. 6th Edn. New York: Worth Publishers.
Plug, E., and Vijverberg, W. (2003). Schooling, family background, and adoption: is it nature or is it nurture? J. Polit. Econ. 111, 611–641. doi: 10.1086/374185
Scharl, A., Carstensen, C. H., and Gnambs, T. (2020). Estimating plausible values with NEPS data: an example using Reading competence in starting cohort 6. NEPS Survey Papers.
Schindler, S., and Bittmann, F. (2021). Diversion or inclusion? Alternative routes to higher education eligibility and inequality in educational attainment in Germany. Eur. Sociol. Rev. 37, 972–986. doi: 10.1093/esr/jcab025
Thaning, M., and Hällsten, M. (2020). The end of dominance? Evaluating measures of socio-economic background in stratification research. Eur. Sociol. Rev. 36, 533–547. doi: 10.1093/esr/jcaa009
Von Stumm, S., Smith-Woolley, E., Ayorech, Z., McMillan, A., Rimfeld, K., Dale, P. S., et al. (2020). Predicting educational achievement from genomic measures and socioeconomic status. Dev. Sci. 23:e12925. doi: 10.1111/desc.12925
Keywords: academic performance, socio-economic status, educational outcome, social inequality, NEPS, dominance analysis, German secondary education
Citation: Bittmann F (2024) Investigating how early academic performance and parental socio-economic status predict and explain successful completion of secondary education in Germany. Front. Educ. 9:1404076. doi: 10.3389/feduc.2024.1404076
Edited by:
Aldo Bazán-Ramírez, Universidad Nacional José María Arguedas, PeruReviewed by:
Sofía Contreras Roldán, Métrica Educativa, A. C., MexicoCopyright © 2024 Bittmann. This is an open-access article distributed under the terms of the Creative Commons Attribution License (CC BY). The use, distribution or reproduction in other forums is permitted, provided the original author(s) and the copyright owner(s) are credited and that the original publication in this journal is cited, in accordance with accepted academic practice. No use, distribution or reproduction is permitted which does not comply with these terms.
*Correspondence: Felix Bittmann, ZmVsaXguYml0dG1hbm5AbGlmYmkuZGU=
Disclaimer: All claims expressed in this article are solely those of the authors and do not necessarily represent those of their affiliated organizations, or those of the publisher, the editors and the reviewers. Any product that may be evaluated in this article or claim that may be made by its manufacturer is not guaranteed or endorsed by the publisher.
Research integrity at Frontiers
Learn more about the work of our research integrity team to safeguard the quality of each article we publish.