 Lyniesha Wright Ward
 Dan Spencer
 Daivik Chauhan3
- 1Department of Chemistry and Chemical Biology, Indiana University Indianapolis, Indianapolis, IN, United States
- 2Department of Distance Education and Learning Technology Applications (DELTA), North Carolina State University, Raleigh, NC, United States
- 3Department of Informatics, Indiana University Indianapolis, Indianapolis, IN, United States
- 4Department of Chemistry, North Carolina State University, Raleigh, NC, United States
Immersive technologies such as augmented reality (AR) have the potential to enable students to remediate invalid assumptions about molecular structure through visualizing site-specific, non-observable chemical processes. In this study, we explore how this technology-embedded instruction impacted student perceptions and experiences in a collaborative face-to-face and independent remote organic chemistry laboratory, the latter of which occurred during the COVID-19 pandemic. While we acknowledge the emotional toll of the pandemic, it afforded a unique opportunity to compare the differences in implementation when covering the same material. We used a novel AR mobile application, H NMR MoleculAR, and a complementary worksheet to support students’ understanding of proton nuclear magnetic resonance (1H NMR) spectroscopy. We gathered data using a mixed-methods pre-post survey about students’ perceptions and experiences in the remote and in-person environments. There were differences in student user experience and perceptions of NMR knowledge, with face-to-face students showing more positive rankings. Although lower than those in face-to-face environments, perceptions of the remote environment remained neutral or positive for all measures. There were no differences in the reported number of challenges faced, but there were unique challenges in the remote learning environment. Our findings illuminate the complexity of factors that must be considered when implementing novel technologies into instruction in face-to-face and remote environments. We conclude by describing concrete lessons learned and considerations for researchers and instructors leveraging augmented reality.
1 Introduction: background and rationale
In recent years, there has been an increase in the use of augmented reality (AR) to support student understanding of representations and visualizing molecules and chemical phenomena across a variety of topics (Behmke et al., 2018; Tee et al., 2018; Sung et al., 2020; Abdinejad et al., 2021; Mazzuco et al., 2022), though it still is not widely adopted (De Lima et al., 2022). AR affords the ability to overlay 3D virtual images in a real physical space, allowing for more comprehensive interactions with molecular structures, incorporating depth and stereoscopic perception into the understanding of chemical phenomena (Behmke et al., 2018; Goddard et al., 2018), and enabling the visualization of site-specific, non-observable chemical processes (Huwer et al., 2018). AR-embedded instruction has been known to advance the affective domain by increasing motivation, interest, and confidence in learning; the cognitive domain by supporting learning, improving performance, and increasing knowledge retention; and the psychomotor domain by developing spatial skills and allowing the visualization of abstract concepts (Cheng and Tsai, 2013; Mazzuco et al., 2022). Furthermore, the ability to use AR on a mobile device means that students can learn in multiple locations. Combined, these AR affordances can support students and develop their understanding of chemistry.
Leveraging the affordances of AR would be especially advantageous with chemistry content, such as 1H NMR spectroscopy, that demands the visualization of molecular spectra but is known to be challenging for students (Anderson et al., 2020). Studies have shown that textbooks (Anderson et al., 2020) and instructors (Connor and Shultz, 2018) struggle to scaffold 1H NMR instruction adequately, suggesting additional resources are needed to supplement these barriers. Resultingly, we leveraged an AR application to provide technology-embedded instruction about 1H NMR. Herein, we discuss how we implemented an activity that consists of H NMR MoleculAR, a novel AR application, and an accompanying worksheet to support students in understanding the concepts and problem-solving processes underlying 1H NMR spectroscopy. We describe the lessons from incorporating this activity in face-to-face and remote learning environments. Specifically, we answer the following questions:
1. How do students experience the activity in each environment (RQ1)?
2. How do students perceive the activity in each environment (RQ2)?
3. To what extent does the activity adjust students’ perceptions of the importance of visualizations for learning chemistry and their knowledge of 1H NMR (RQ3)?
2 Pedagogical frameworks underlying the educational activity innovation
The H NMR MoleculAR application (the App) uses static and dynamic visualizations to render virtual 3D representations of molecular structure, molecular orbitals, and electrostatic potential maps over unique targets that are 2D images of molecules or spectra. The content in the App and its associated worksheet is structured using the Compare-Predict-Observe-Explain (CPOE) cycle and the contrasting cases framework (Alfieri et al., 2013; Graulich and Schween, 2018). Students are given structures that differ in one important feature (a contrasting case). They are expected to compare these structures, make a prediction about how the difference in features will be reflected on the spectrum, observe the spectra, and then explain the underlying concepts or principles that connect the structural features to the spectral features (see an example in the Supplementary Figure S1). These frameworks increase the interactivity associated with the App while requiring students to orient to key concepts relevant to each task to problem solve. For more details on the App’s design and development, see Wright and Oliver-Hoyo (2021).
3 The learning environments
Sharples and colleagues have a two-part definition of mobile learning. Mobile learning can be education (a) supported by mobile devices or (b) that occurs in unique spaces outside the formal classroom (Sharples et al., 2007). A holistic characterization of mobile learning must consider the design of technological tools and the context in which the learning occurs (Sharples et al., 2007; Imtinan et al., 2013). Therefore, we adopt the Task Model of Mobile Learning to characterize the remote and face-to-face learning environments in which students engaged with the activity (Taylor et al., 2006; Sharples et al., 2007).
The Task Model of Mobile Learning is grounded in activity theory and comprises six factors, each with a technological and semiotic layer. The factors are the learning goals or outcomes (Objective), the learner and their prior knowledge (Subject), the function of the medium or artifact used to facilitate learning processes (Tool), the social and pedagogical parameters that moderate learning (Control), the device’s portability and the environment’s relevance to the learning goals (Context), and the potential for interactions (Communication). Each factor coalesces with the others so that the individual completes the activity as a Changed Object with revised knowledge and skills (Taylor et al., 2006; Frohberg et al., 2009). Frohberg and colleagues used the semiotic layer of the Task Model of Mobile Learning, with technology as the enabler, to create a five-point rating scale for each factor (Table 1) and describe mobile learning environments (Frohberg et al., 2009). By comparing multiple instantiations using this framework, one can characterize activities and explore how differences influence the Subject’s revised knowledge or skills (Sharples et al., 2007). We use these factors in Table 1 to characterize how students completed the same activity in different learning environments.
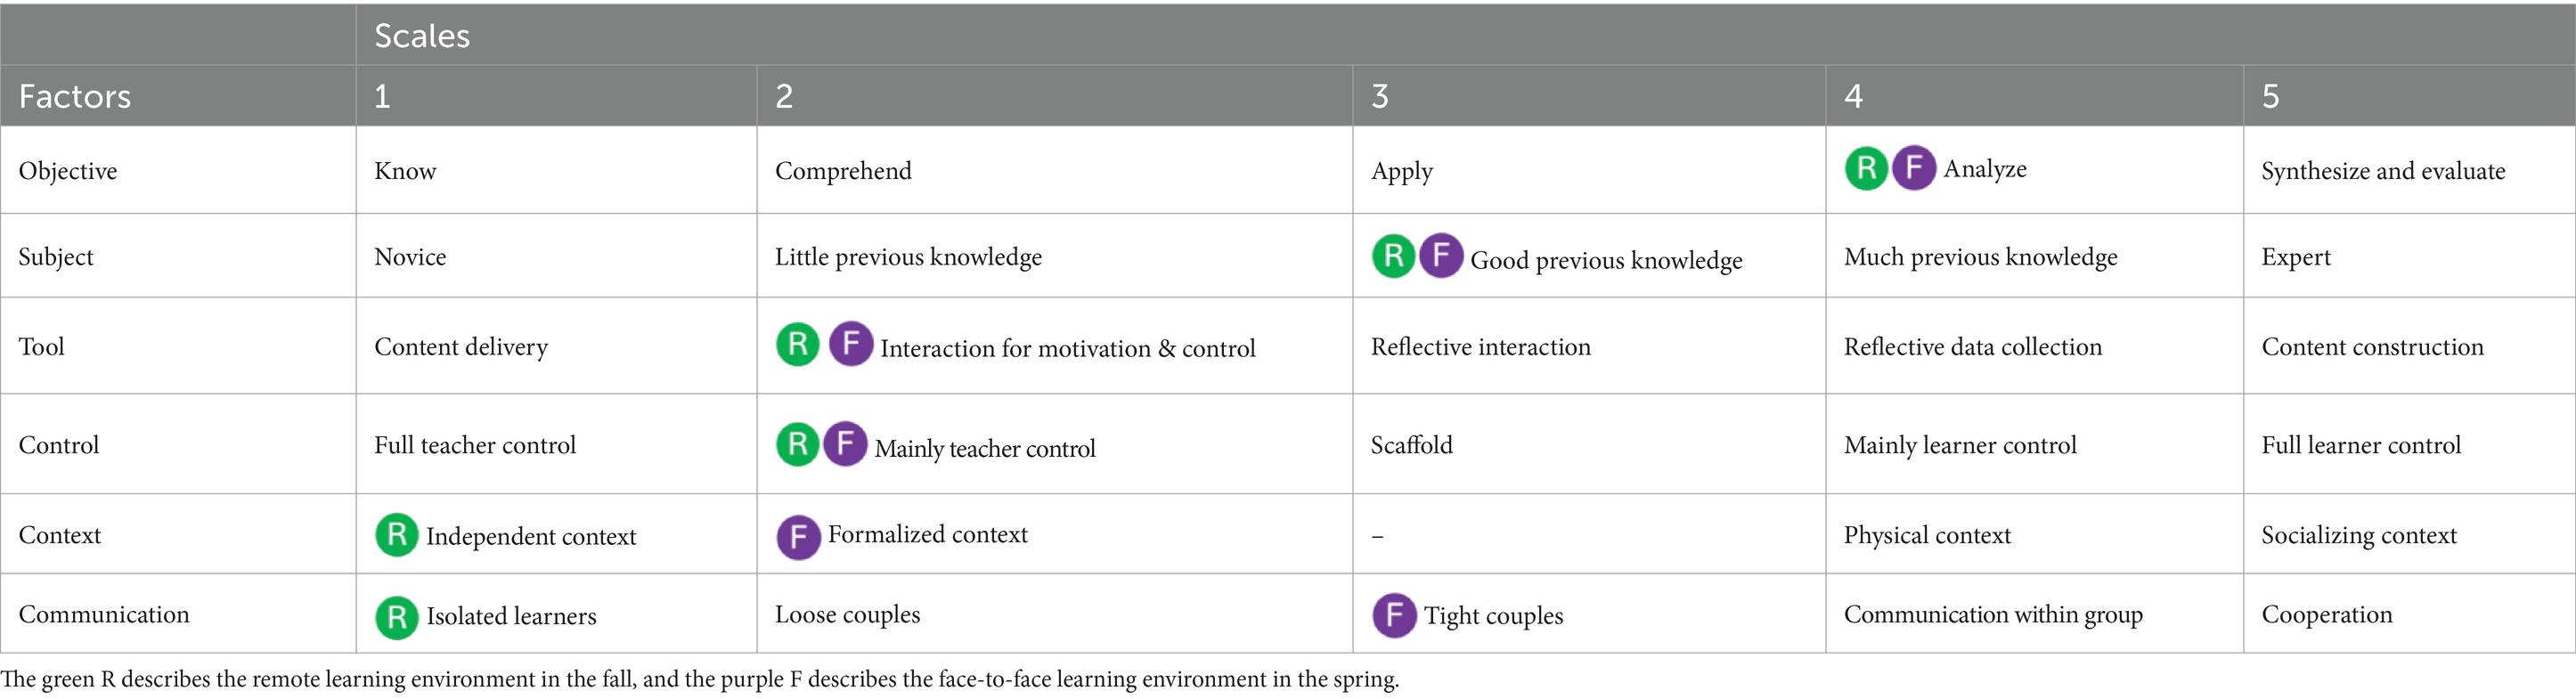
Table 1. An overview of the scales for each factor [adapted from Frohberg et al., 2009].
In both environments, students were expected to analyze and interpret spectra and molecular structures (Objective – analyze). On average, the students reported good prior knowledge (Subject – good previous knowledge). The App was designed for interactivity using the CPOE framework in that it is guided with a playful approach to increase motivation (Tool – interaction for motivation and control) through engagement with structured content that has space for students to make decisions during the learning process (Control - mainly teacher control). However, there were a few differences between the learning environments.
3.1 Face-to-face environment
During the Spring 2020 semester, the activity was administered on instructor–provided tablets within a single three–hour laboratory (Context – formalized) and with a teaching assistant in person. The students completed the activity with a partner (Communication – tightly coupled pairs). The partners shared an iPad and had to advance through the AR experience together; however, they were each responsible for submitting individual work. During the spring semester, students would document their predictions and provide explanations on the worksheet while comparing and observing the AR components in the App.
3.2 Remote environment
The Fall 2020 semester was the first full semester of remote learning due to the COVID-19 pandemic. The students completed the activity in their own space (Context – independent), using personal devices. Students had an entire week to complete the activity. While students could reach out to their teaching assistant via Zoom throughout the week, students did not work with partners (Communication - isolated learners). During the fall semester, students only wrote their explanations on the worksheet. Each AR experience was modified to require students to compare, make a prediction, and make an observation within the App.
4 Participants and data collection and analysis measures
4.1 Participants
The face-to-face data were collected from 114 students across six laboratory sections in the spring. The remote data were collected from 154 students across eight laboratory sections in the fall. All participants were concurrently self-enrolled in the Organic Chemistry II laboratory course lecture. Students participated in the study by taking a pre-and post-survey to gather information about their perception and user experience. Participants were not given incentives to complete the activity or survey as it was part of their coursework; however, they had to consent for their feedback to be used for research per our Institutional Review Board guidelines. In the face-to-face and remote environments, most students were sophomores or juniors (80.7, 67.5%) and self-identified as female (57.9, 54.6%). They reported learning about 1H NMR in their lecture course before the laboratory (64.9, 61.7%). Less than one-third of students reported previously using AR (32.9, 29.2%).
4.2 Data collection and analysis
Using Qualtrics software, participants completed a pre-survey before the activity and a post-survey immediately after. We analyzed the data related to each research question within each environment and compared environments.
To investigate student user experience (research question one, RQ1), we used the user experience questionnaire (UEQ) in the post-survey (Laugwitz et al., 2008; Schrepp et al., 2014). The questionnaire contains 26 items across six scales:
1. Attractiveness - individual’s overall impression of the product.
2. Perspicuity - how easy the app is to understand/learn.
3. Efficiency - how easy the app is to use to solve tasks.
4. Dependability - how dependable the app is to use.
5. Stimulation - how exciting the app is to use.
6. Novelty - how creative or innovative the app is perceived.
The UEQ is a semantic differential survey in which students are given two opposing words and asked to indicate their preference using a seven-point scale (−3 to +3). Responses can be positive (greater than +0.8), neutral (between +0.8 and-0.8), or negative (less than −0.8) (Santoso et al., 2016). All six scales showed relatively acceptable levels of reliability across both semesters (Supplementary Table S1), indicating that every item in the scale was measuring something similar to other items within the scale (Taber, 2018). A MANCOVA was utilized to analyze data from the UEQ across semesters. The outcome variables for the analysis were the six UEQ scales, with the independent variable being the learning environment. Research has shown that prior knowledge influences experience and performance (Kohl and Finkelstein, 2006; Rittle-Johnson et al., 2009; Braithwaite and Goldstone, 2015). The analysis also controlled for students’ prior experience with AR technology and NMR content. All assumptions of the statistical test were met (Field, 2009).
The post-survey contained more items to understand students’ overall perception of the activity (RQ2). Students rated each item on a scale from 1 (Strongly disagree) to 5 (Strongly agree). The prompts were:
1. Given the chance, I would use the AR app again.
2. I found the lab structure more engaging than that of other labs I have taken in the past.
3. The App was effective in increasing my engagement with the content.
4. The worksheet was effective in increasing my engagement with the content.
Students were asked to indicate if they experienced challenges with the worksheet and the App via a yes/no item. In both cases, students could provide an open-ended response to describe their experiences with the activity:
1. Please describe those challenges or difficulties with using the worksheet (App).
2. Please provide 1–2 things you found most helpful about the worksheet (App).
3. Please provide 1–2 things you would improve about the worksheet (App).
Data from items relating to student perceptions of the App and worksheet violated the assumption of normality, and therefore, non-parametric tests were utilized. Mann–Whitney U tests were run for each item, with perception as the outcome variable and learning environment as the independent variable. A separate chi-square analysis was used to explore the frequency of students who stated they experienced challenges using the worksheet and application in each environment. The open-ended responses underwent a content analysis to identify common patterns across the participants within each environment (Patton, 2002). One coder analyzed 20 % of the data and developed a codebook. The codebook was shared with a second coder who coded the same 20 % of the data. The coders met and refined the codebook using constant comparative analysis (Glaser, 1965). Both coders separately analyzed the remainder of the data. After independent coding, the two researchers discussed their codes until a 100% negotiated agreement was reached (Campbell et al., 2013; Saldaña, 2013). Peer debriefing and negative case analysis were used to ensure the credibility of the findings (Lincoln and Guba, 1985).
Lastly, we used pre-post survey questions to investigate if the activity adjusted students’ perception of the importance of chemistry visualizations or student knowledge of 1H NMR (RQ3). The first four items were adapted from a survey to evaluate BiochemAR, another augmented reality educational tool (Sung et al., 2020). The last two items were author-generated and specific to 1H NMR. Students rated the following items on a 1 (Strongly disagree) to 5 (Strongly agree) scale:
1. Seeing a visual helps me connect my knowledge and new information about molecules.
2. Manipulating something physically helps me connect what I know and new information about molecules.
3. Analyzing 2D images or molecules is helpful for learning organic chemistry.
4. Analyzing 3D images of molecules is helpful for learning organic chemistry.
5. I understand the concepts related to 1H NMR.
6. I know how to solve 1H NMR problems.
Data from these items violated the assumption of normality, and reverse score and log transformations were used to correct the data. A mixed (2×2) MANCOVA was run to understand differences between environments over time. The outcome variables for the analysis were item responses at the pre-and post-survey, with the independent variable being the learning environment. Interaction effects (differences between environments over time) and main effects (differences between environments or differences over time) were investigated.
5 Results
5.1 RQ1 – How do students experience the activity in each environment?
5.1.1 Face-to-face
Overall, a majority (> 50%) of students in face-to-face settings indicated that they had positive overall impressions of the App (attractiveness = 56.68% positive). When using the App, a majority indicated it was easy to learn (perspicuity = 61.70%), use (efficiency = 59.57%), and dependable (dependability = 54.26%). A slight majority also found the App exciting (stimulation = 52.13%) and perceived it as creative/innovative (novelty = 55.32%).
5.1.2 Remote learning
Student responses during remote learning were less positive, with less than half indicating they had positive overall impressions of the App (attractiveness = 43.51% positive). Less than half reported finding the App easy to use (efficiency = 46.10%) and viewing it as exciting (stimulation = 37.66%). However, most students did indicate the App was easy to learn (perspicuity = 57.14%), dependable (dependability = 51.30%), and perceived it as creative/innovative (novelty = 59.09%).
5.1.3 Environment comparison
Students in face-to-face had significantly higher ratings than students in remote learning for the efficiency (F (1,211) = 6.50, p = 0.012, eta = 0.03), dependability (F (1,211) = 4.40, p = 0.037, eta = 0.02), stimulation (F (1,211) = 12.32, p < 0.001, eta = 0.06), and attractiveness (F (1,211) = 10.38, p = 0.001, eta = 0.05) factors. There was no difference between the perspicuity (F (1,211) = 1.79, p = 0.18) and novelty (F (1,211) = 0.91, p = 0.34) factors (see Table 2 for mean and standard deviations).
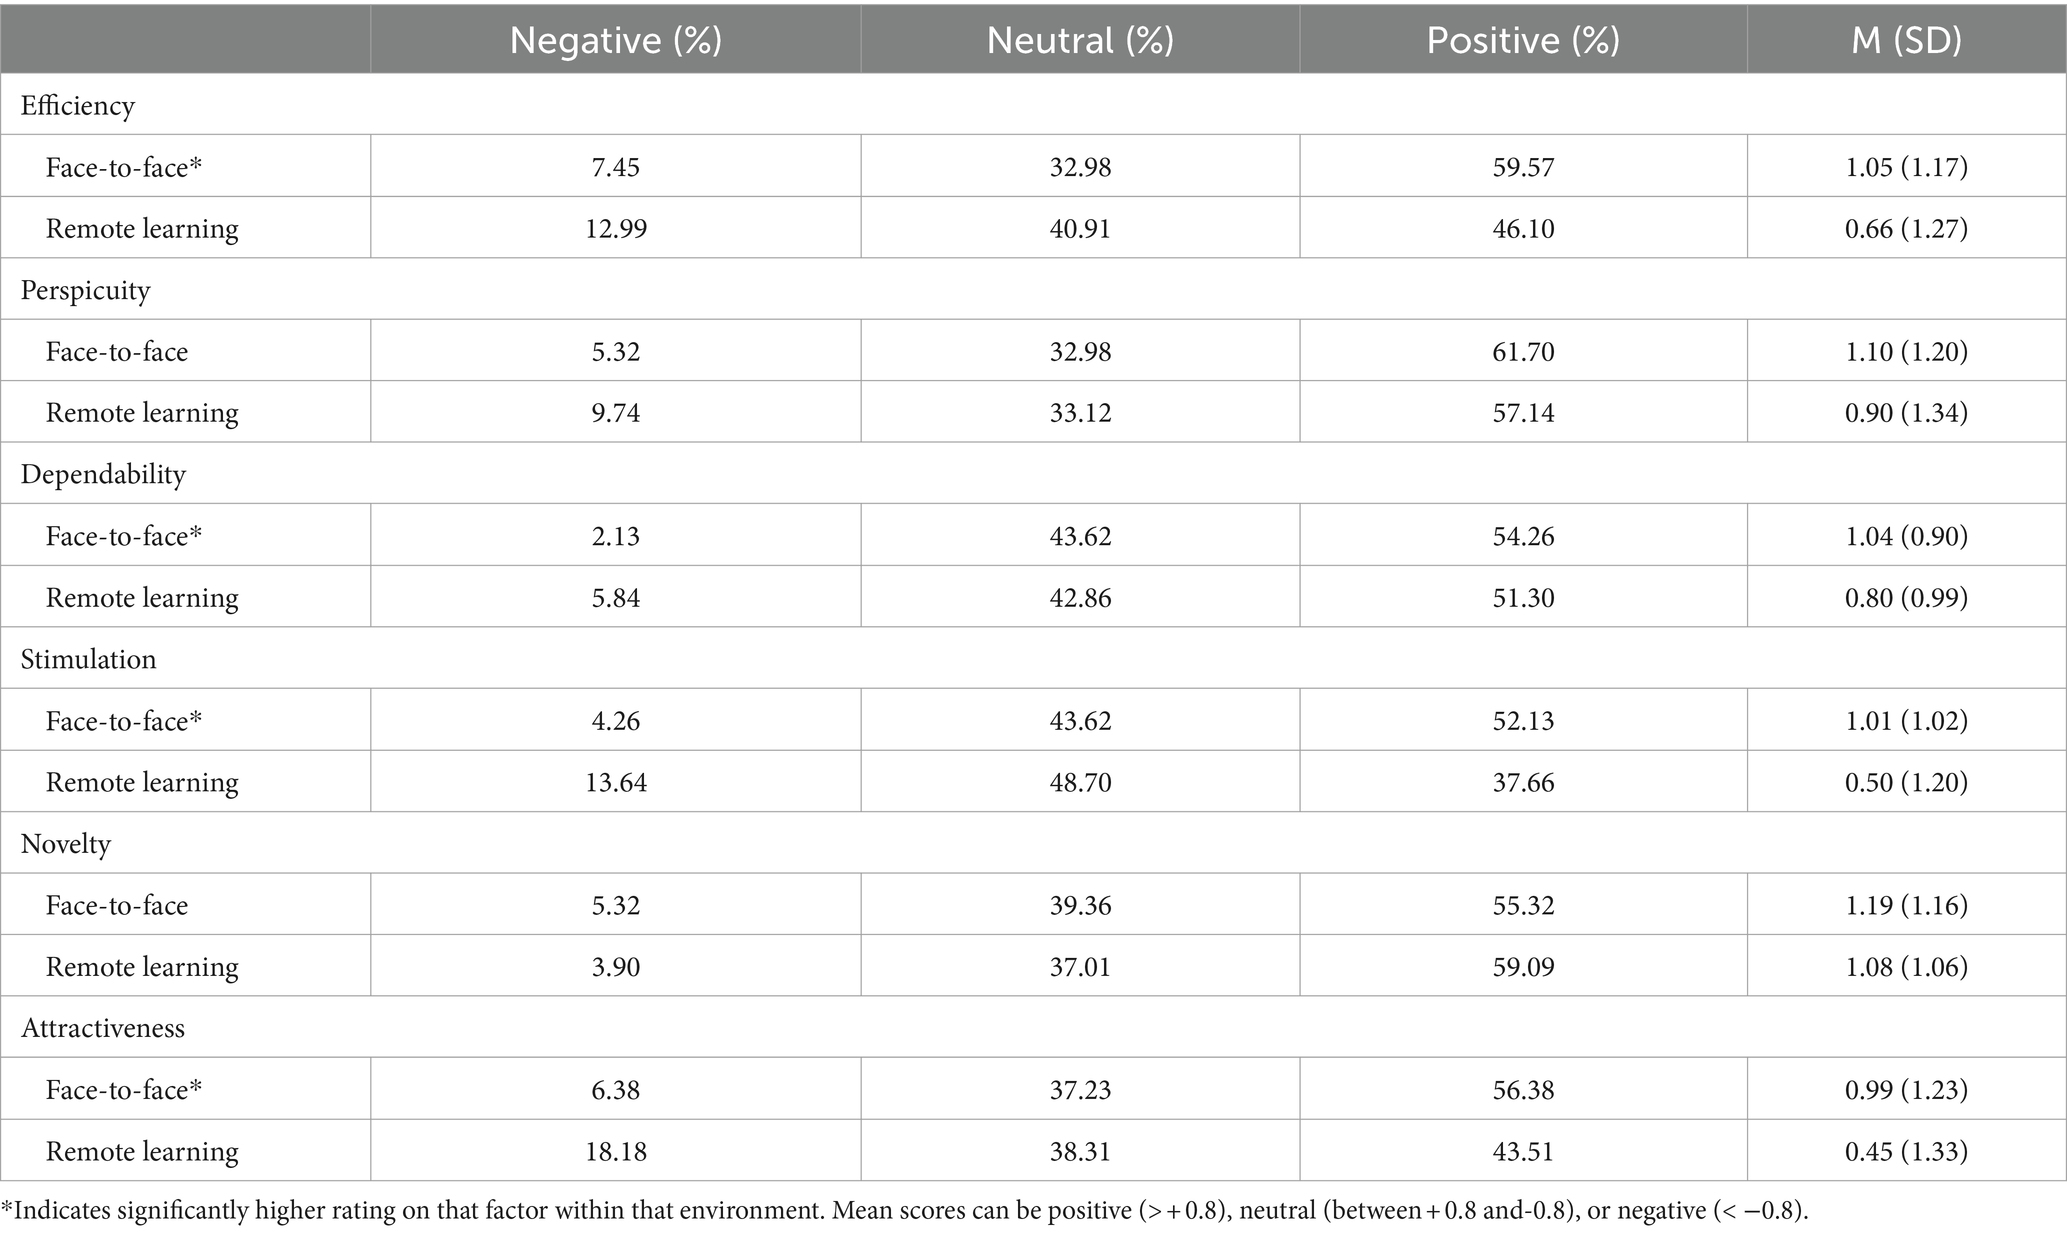
Table 2. Distributions of student responses for UEQ scales.
5.2 RQ2 – How do students perceive the activity in each setting?
5.2.1 Face-to-face
Student responses were largely positive (Table 3), with ~70% of students agreeing that they found the lab structure more engaging than previous labs (69.15%) or would use the App again (73.40%). Students also agreed that the App increased their engagement (80.85%) and helped them understand the content (78.72%). Further, students said the worksheet increased their engagement (76.60%) and helped them understand the content (73.40%). Students reported encountering challenges or difficulties with the worksheet (54%) and App (44%).
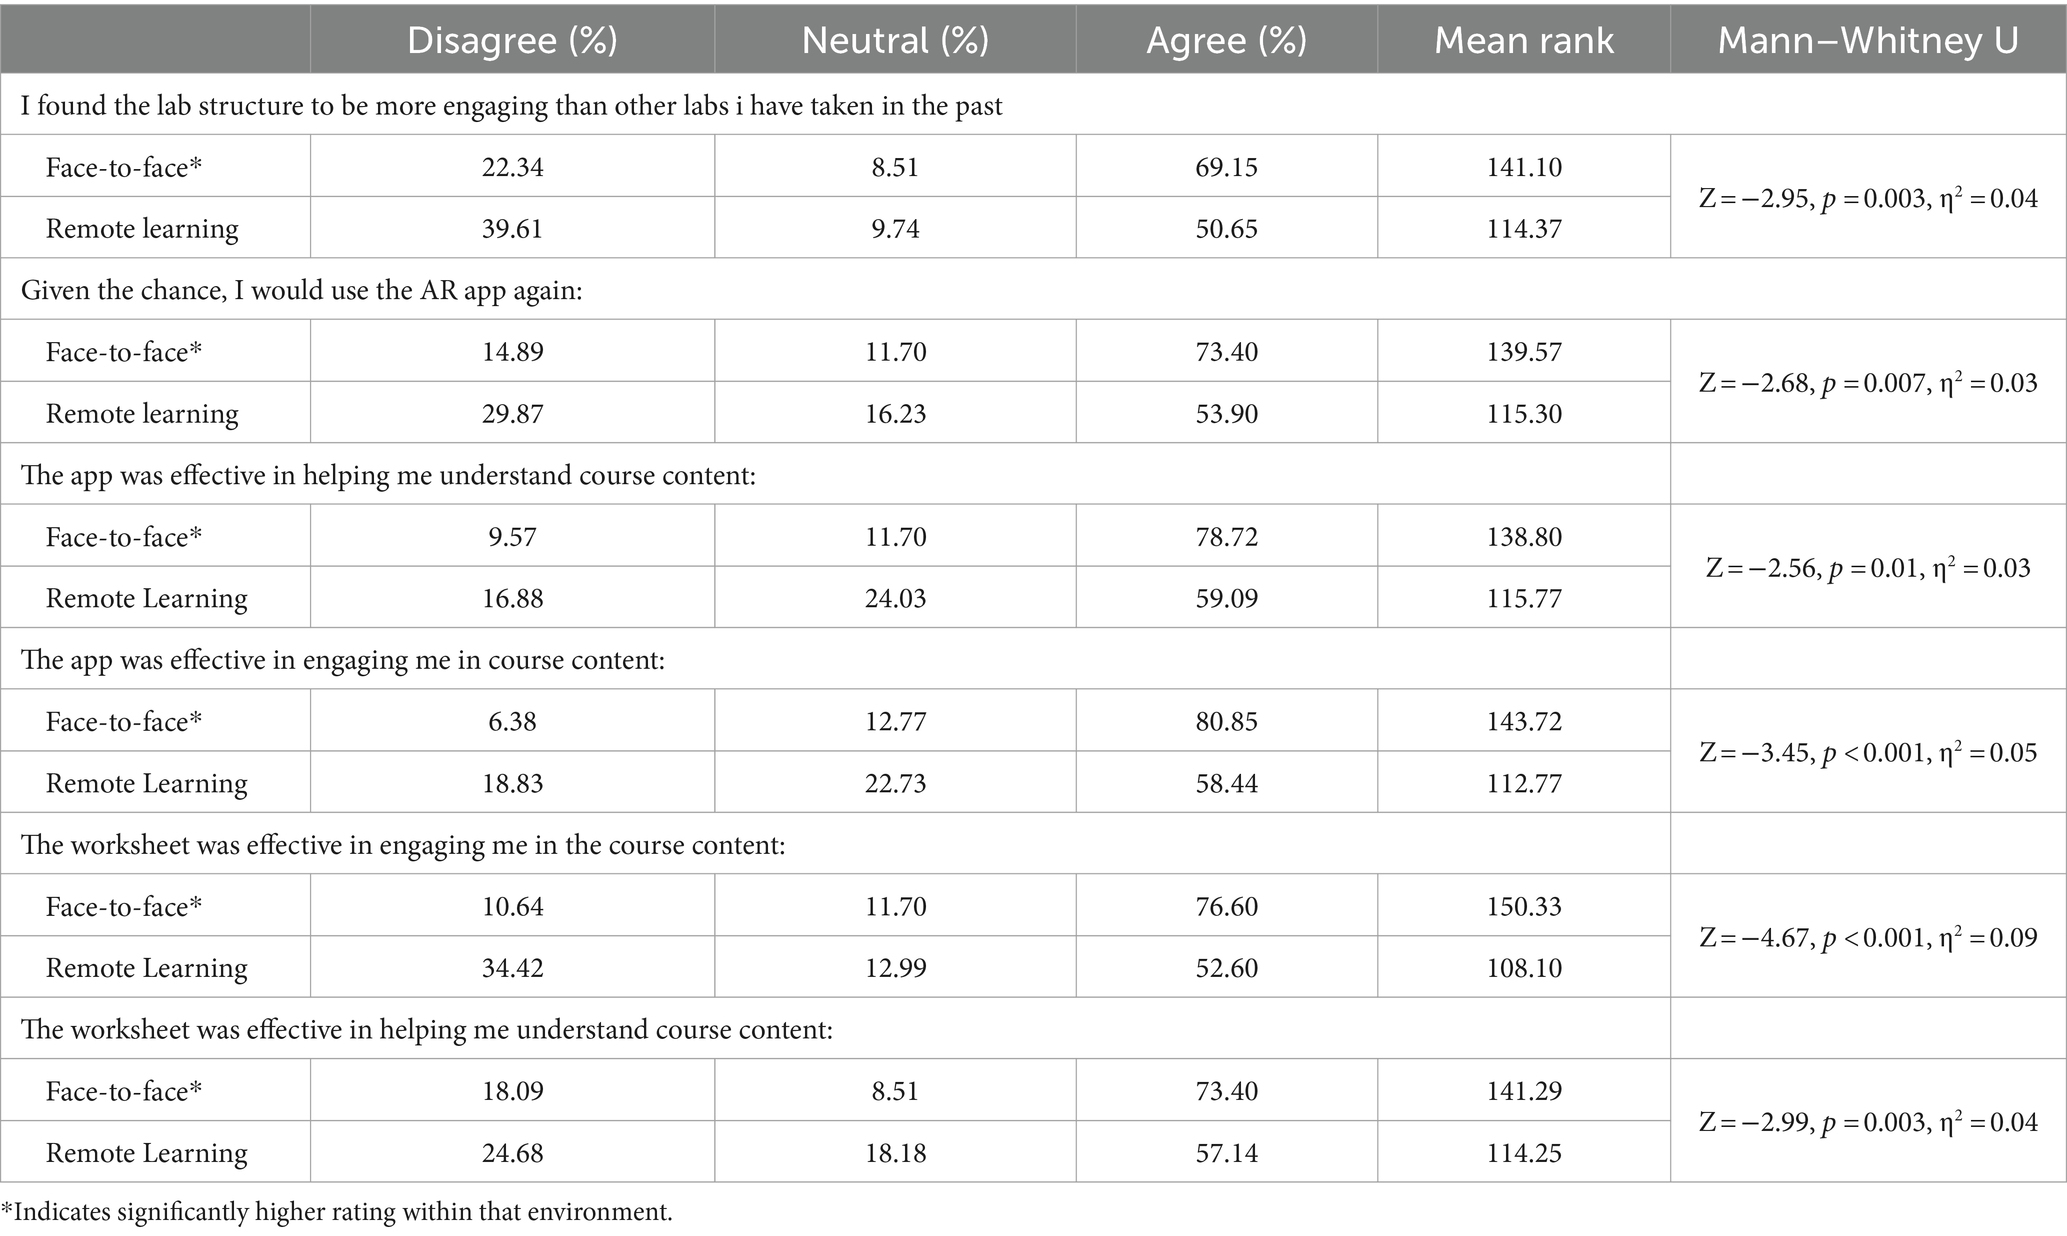
Table 3. Distributions of student responses for the UEQ scales.
5.2.2 Remote learning
Student responses during remote learning were less positive (Table 3), with a slight majority agreeing that they found the lab structure more engaging than previous labs (50.65%) or would use the App again (53.90%). Students also agreed that the App increased their engagement (58.44%) and helped them understand the content (59.09%). A slight majority said the worksheet increased their engagement (52.60%) and helped them understand the content (57.14%). Students reported encountering challenges or difficulties with the worksheet (51%) and App (36%).
5.2.3 Environment comparison
Students in the face-to-face were significantly more positive than those in remote learning about using the App and worksheet, as well as their impact on their engagement/learning (Table 3). There were neither significant differences in students who reported challenges or difficulties with the worksheet (χ2 (1) =3.72, p = 0.054) nor the App within either environment (test was significant, χ2 (1) =8.20, p = 0.005, however, standardized residuals did not meet significance). The open-ended responses about the worksheet were split among students as what some considered the most challenging others considered the most helpful (see example quotes in Table 4). The main worksheet challenges and desires for improvement concerned the length and the lack of clear content explanations. Coincidentally, students also reported that the detailed content explanations and step-by-step content progression within the worksheet were most useful for learning. The main App challenges were scanning the target for the AR image to appear and moving/rotating the augmented molecules. Those challenges were described as the suggested improvements for the App. Students stated the most helpful things about the App were the 3D visualizations that explained the content and the ability to manipulate the molecules.
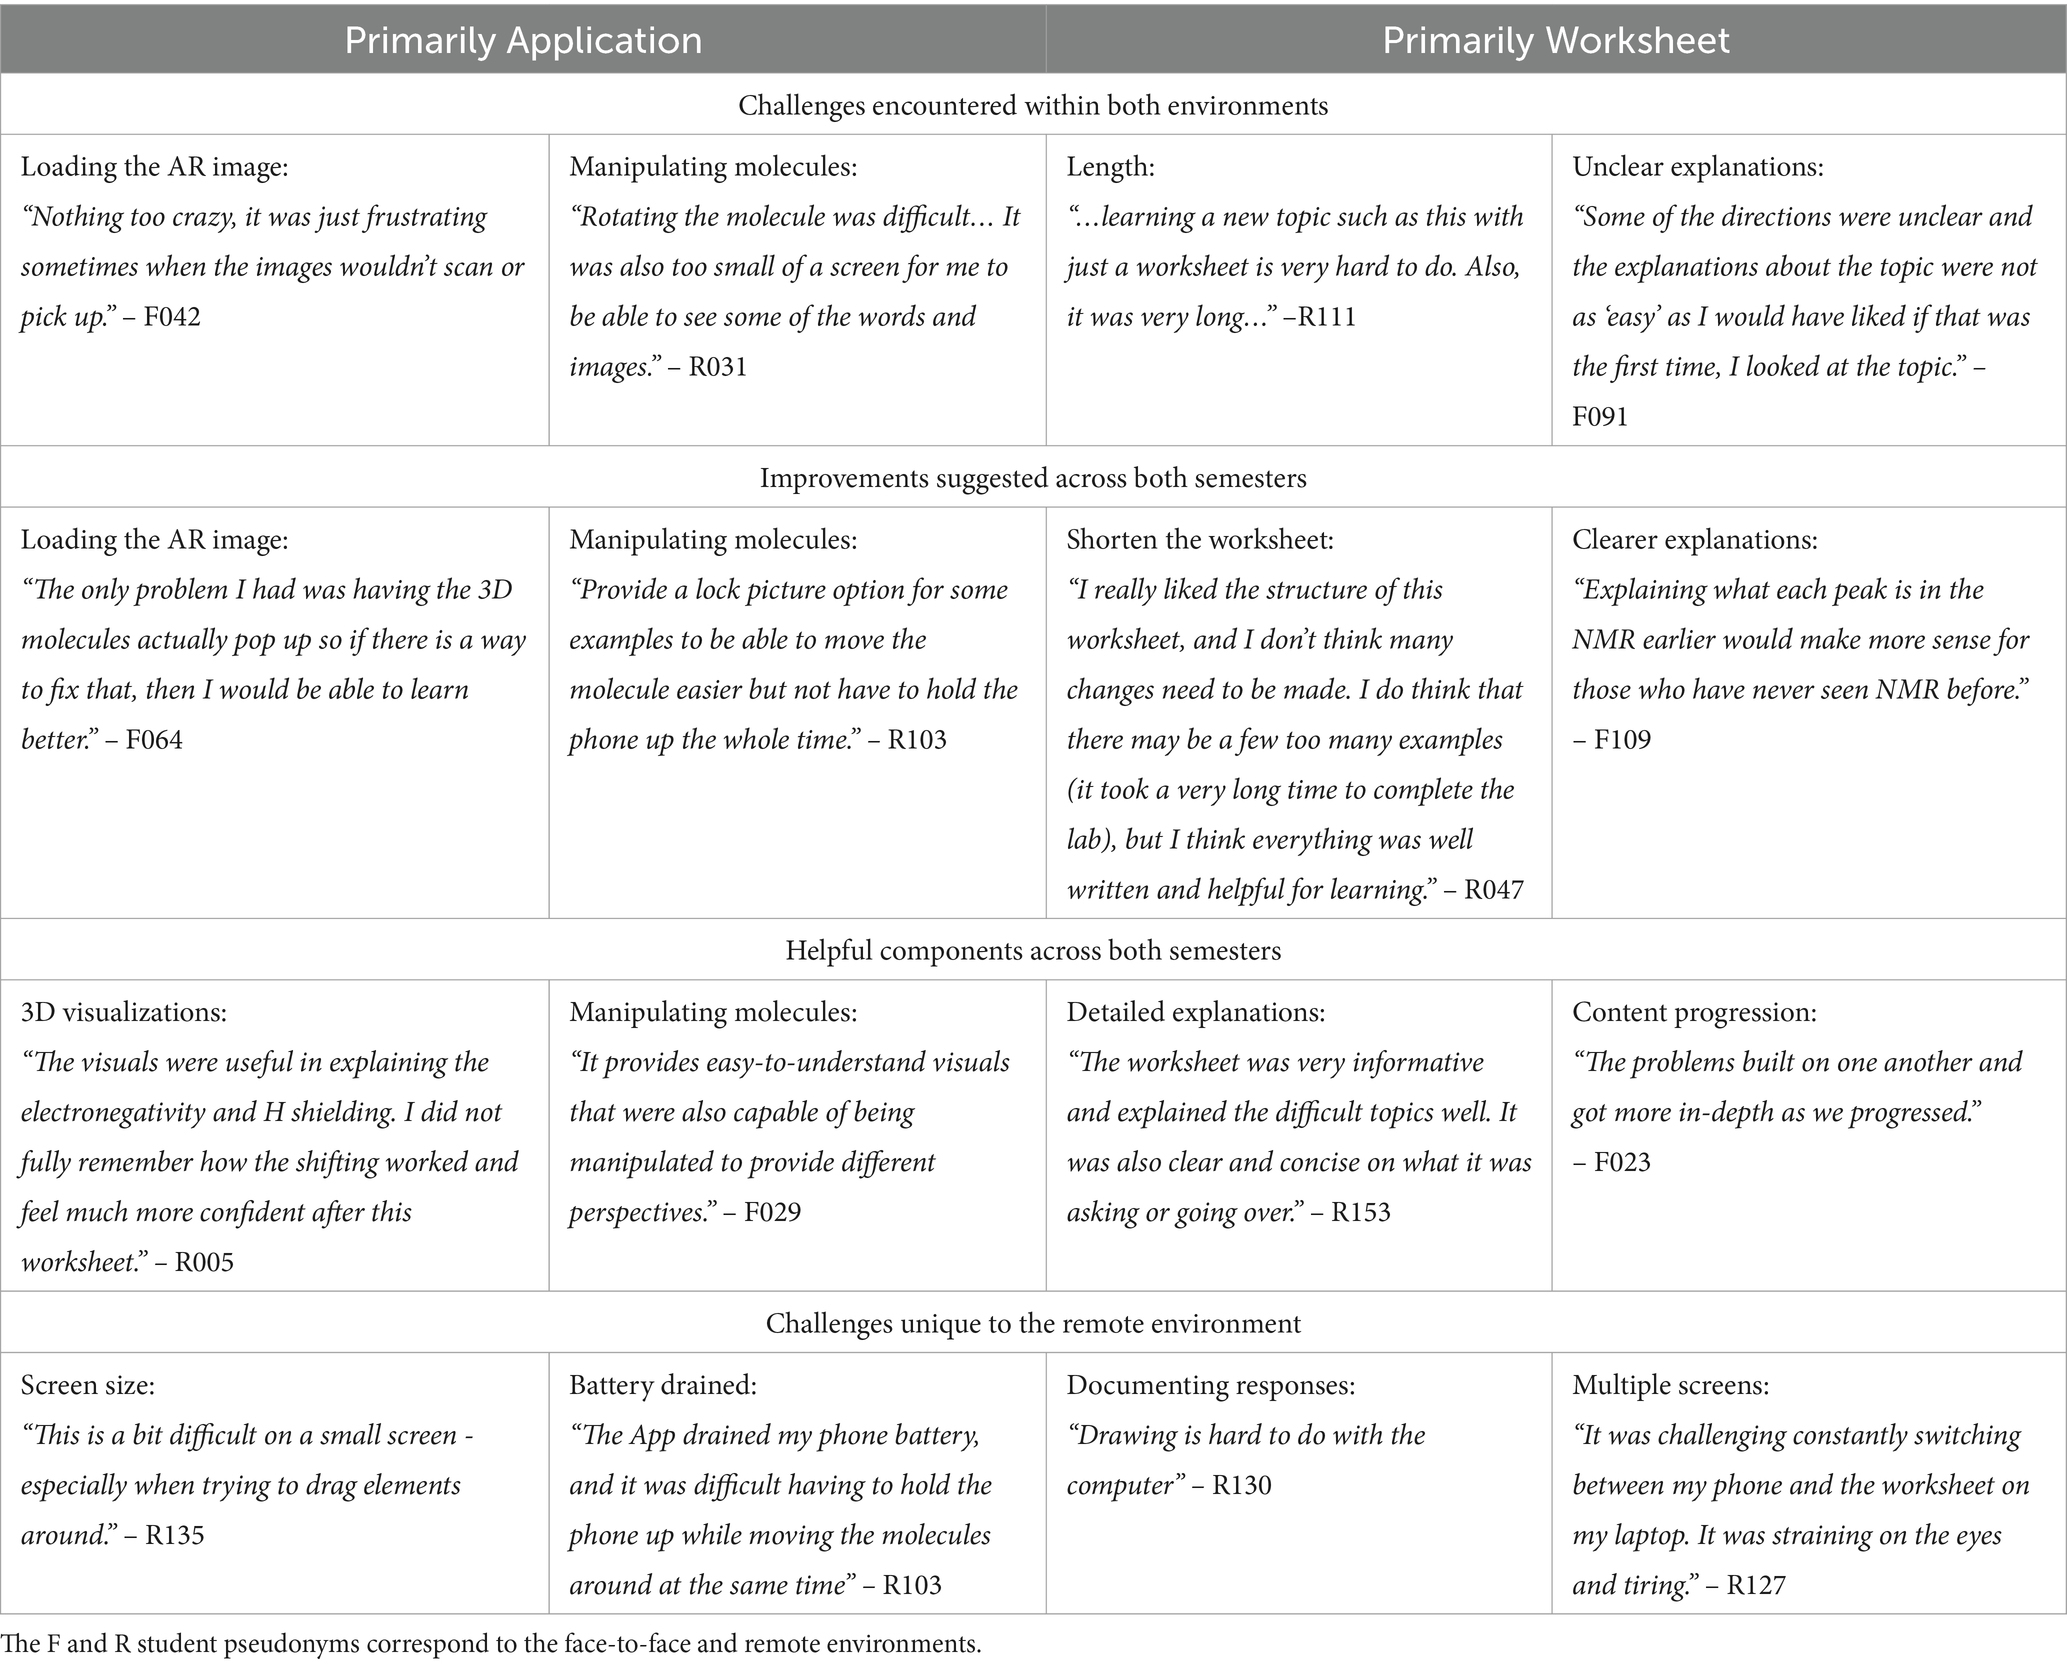
Table 4. Activity challenges supported by exemplary responses from students.
A few responses were unique to the remote environment (Table 4). Remote students had the option to print their worksheet or complete it online. Many students chose to complete it online; however, students said it was difficult to draw on the document via Word or Google Docs and that switching between multiple screens (i.e., their mobile device and the computer) was overwhelming. Students in remote learning were also challenged by the size and power limitations of their mobile devices. None of these challenges were evidenced in the Spring.
5.3 RQ3 – to what extent does the activity adjust students’ perceptions of the importance of visualizations for learning chemistry and their knowledge of 1H NMR?
5.3.1 Face-to-face
Students overwhelmingly agreed at pre-and post-survey with the perceptions about the importance of seeing a visual (97.3, 93.6%), physically manipulating objects (92.9, 92.5%), and analyzing 2D (77.5, 84%) and 3D (93.7 and 93.6%) images. A slight majority of students felt they understood the underlying concepts (59.5%) and were able to solve 1H NMR problems (53.2%) during the pre-survey, but this increased during the post-survey (88.3 and 87.2%, respectively).
5.3.2 Remote learning
Similarly, students overwhelmingly agreed at pre-and post-survey with the perceptions about the importance of seeing a visual (91.3, 91%), physically manipulating objects (86.5, 81.5%), and analyzing 2D (78.6, 85.7%) and 3D (87.3 and 92.2%) images. A slight majority of students felt they understood the underlying concepts (57.9%) and were able to solve 1H NMR problems (53.2%) during the pre-survey, but this increased during the post-survey (79.3 and 77.3%, respectively).
5.3.3 Environment comparison
All significant effects are described below; for an overview of non-significant effects, see the Supplementary Table S2. There were significant interaction effects for items about student ability to understand (F (1, 215) = 8.14, p = 0.005, eta = 0.04) and solve 1H NMR problems (F (1, 215) = 6.57, p = 0.011, eta = 0.03). Students in face-to-face and remote environments showed significant increases in items from pre-to post-survey (p < 0.001). No differences were found between environments at the pre-survey; however, at post-survey, those in the remote environment showed significantly lower ratings (p < 0.05) (Table 5).
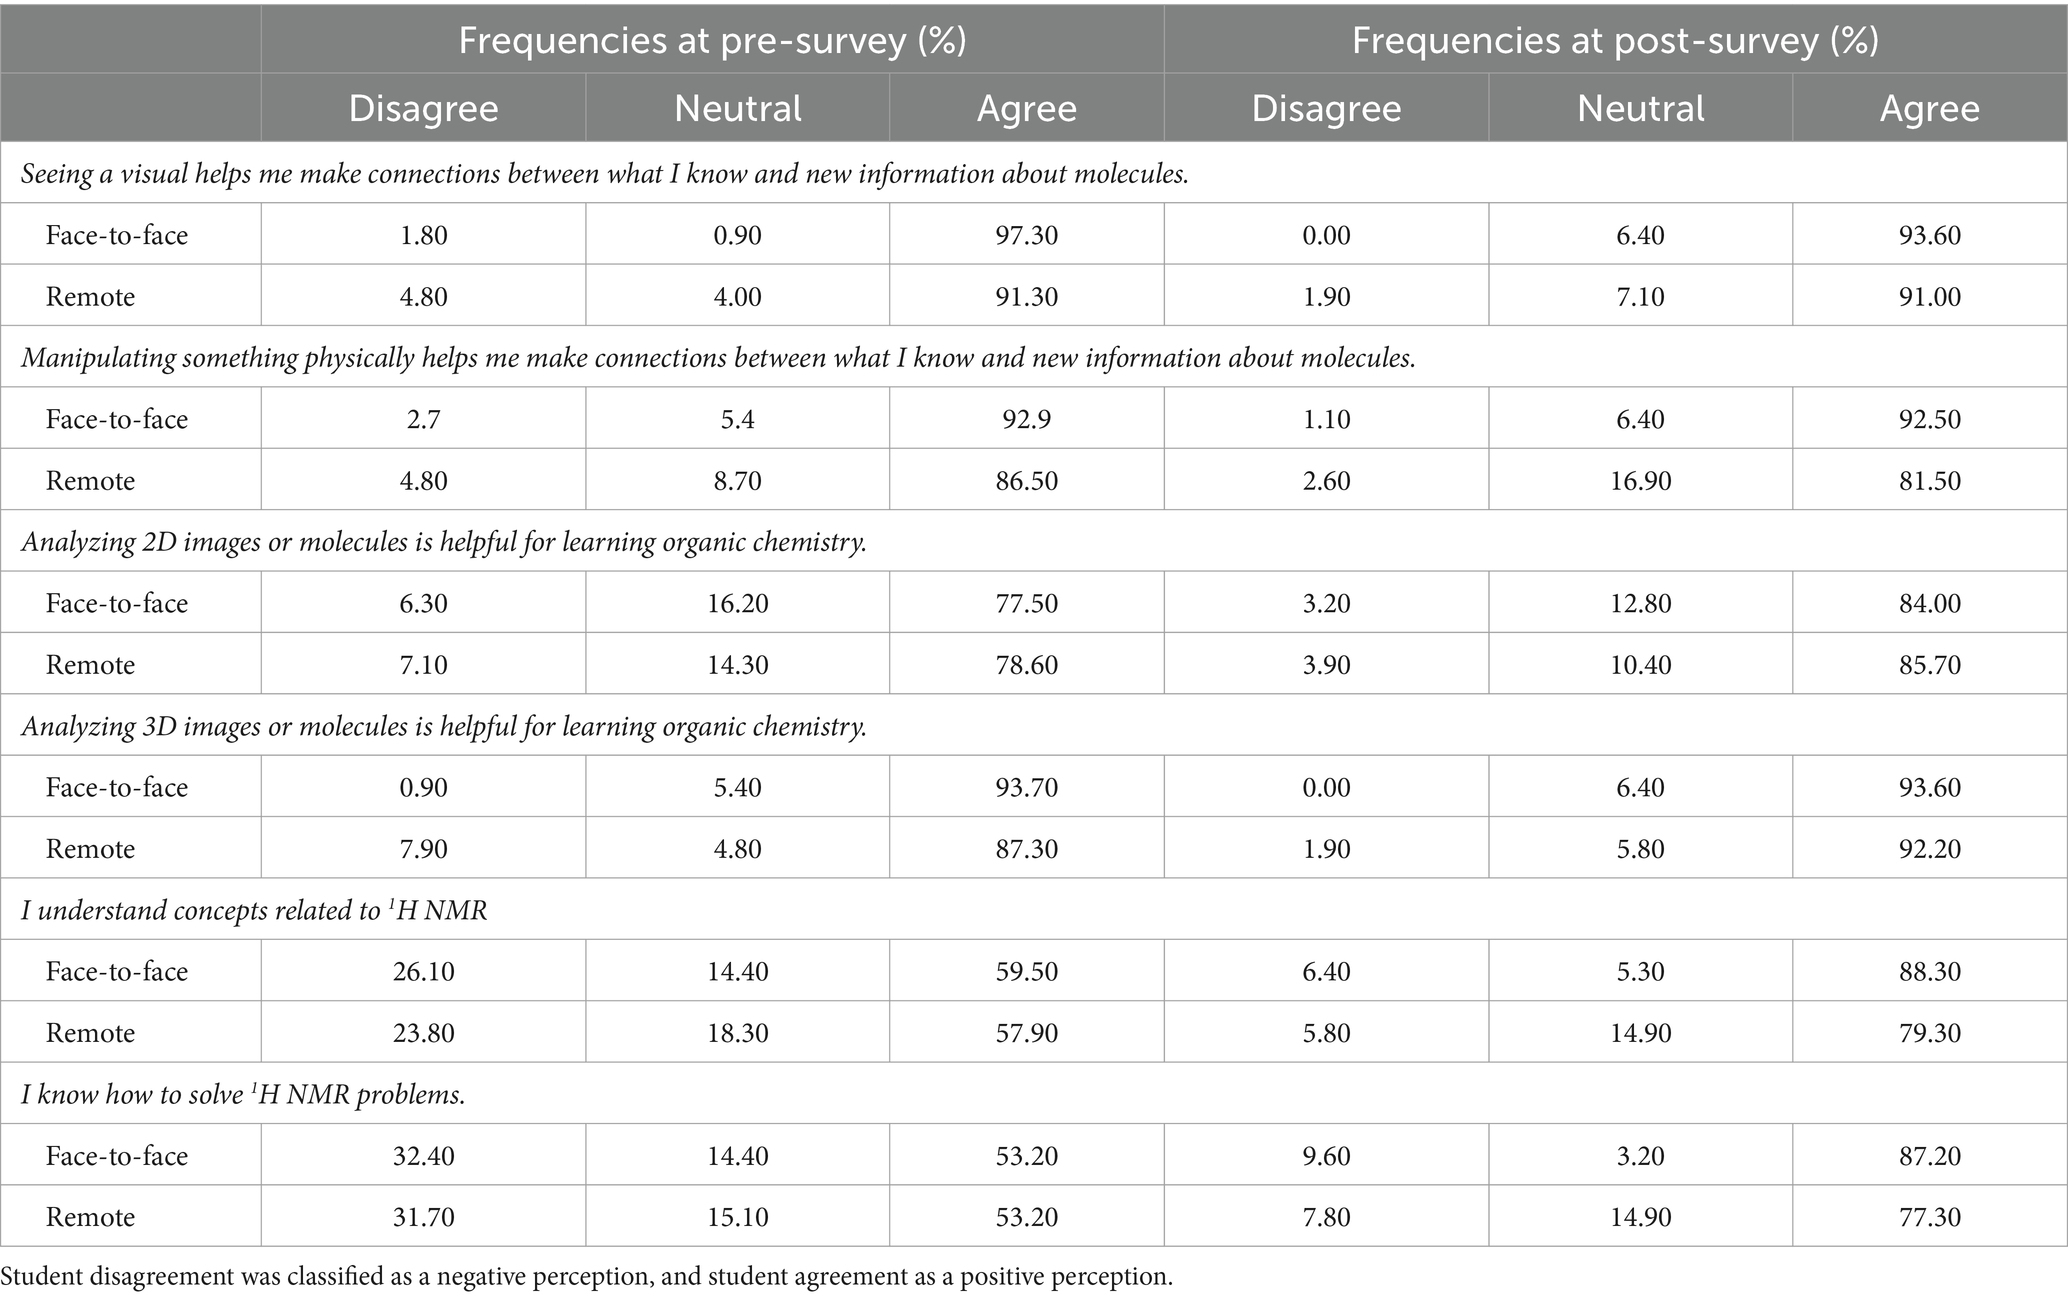
Table 5. Distributions of student rankings for each perception.
A main effect of environment was found for the importance of manipulating physical objects (F(1, 215) = 4.24, p = 0.04, eta = 0.02). Collapsed across time points, students in the remote environment indicated lower perceptions compared to those in face-to-face (p = 0.041). A main effect of time was also found for the importance of analyzing 2D images (F(1, 215) = 10.08, p = 0.002, eta = 0.05), with students in both environments showing a significant increase over time.
6 Discussion and implications
This paper describes using an AR application (H NMR MoleculAR) and accompanying worksheet to support undergraduate organic chemistry students in understanding 1H NMR spectroscopy in two different environments. Students in the spring semester completed the activity in a face-to-face laboratory (Context - formalized), working in pairs (Communication - tightly coupled). Students in the fall semester completed the activity independently (Communication - isolated learners) and remotely (Context - independent). Our findings indicated that students had a neutral to positive user experience and relatively positive perceptions of the chemistry activity. However, students who completed the activity remotely had significantly lower perceptions and a less positive user experience than students who completed the activity face-to-face. Delivering this activity in two different settings led to multiple lessons learned.
6.1 Lesson 1: augmented reality experiences support students in connecting content to visualizations
Across both settings, students overwhelmingly valued the 3D visualizations and how they helped them to understand the content (see R005, Table 4) and “make connections between the theory and the practice” – R084. Students discussed how the color coding helped them link the hydrogen atoms to specific chemical shifts, and the animations helped them visualize how electrons interact with magnetic fields. However, some students struggled with the fact it was augmented. Like R103 in Table 4, participant R078 stated, “I did not like how I could not “freeze” the screen and look at it while I was looking at the questions. It made it hard to hold my phone up and also read on my laptop.” Freezing the screen would make the image appear more like a 3D object on a screen than an augmented reality image. These sentiments lead to questions about the content and contexts in which AR affords more than non-augmented virtual representations on a desktop or website application when learning chemistry.
6.2 Lesson 2: augmented reality experiences may be more useful when reinforcing material than introducing new material
While the statistical analyses controlled for student exposure to AR and NMR, the open-ended survey responses revealed that students who had not covered 1H NMR in their lecture struggled with the activity. This sentiment was present regardless of environment and can be evidenced by participants R111, F091, and F109 in Table 4. As participant R082 stated, completing this activity without prior content exposure requires learning “new material and devices I was not familiar with.” This could potentially increase student cognitive load, a significant challenge in using AR in teaching chemistry (Cheng and Tsai, 2013). Students may perceive AR activities more positively if they have some experience with the content. Other studies have been designed in which the AR component was incorporated towards the end of the instructional unit (Behmke et al., 2018) or after foundational knowledge of the topic had been covered in the course (Cai et al., 2014; Sung et al., 2020). Educators could benefit from research that provides insight into how user prior knowledge, the amount of material, and task complexity impact chemistry learning with AR tools.
6.3 Lesson 3: collaborative environments may positively impact student perceptions of using AR for learning
Students’ perceptions scored higher in the face-to-face environment where students could communicate with a partner. However, most perceptions were still rated positively in the remote and independent environment. Students in the face-to-face environment gave significantly higher ratings for their willingness to reuse the App, the effectiveness of the App in helping them study the content, the worksheet’s effectiveness in assisting students with course content, and overall lab engagement. In both environments, students reported an increased understanding of 1H NMR concepts and problem-solving ability, but this increase was significantly lower in the remote learning environment. While we cannot disentangle the remote from the independent work or the in-person from the collaborative, studies show that interpersonal interactions influence students’ attitudes toward science (Wei et al., 2019), and when students collaborate with mobile learning activities, they perceive greater improvements in learning than without collaboration (Burke et al., 2021). Students who work collaboratively are more likely to discuss their reflections and ask one another questions than students who work independently (Chi and Wylie, 2014). Students in the remote environment echoed this point, as one stated they were challenged “without the feedback and engagement of a lab partner/table to do it with” (R060). Although mobile applications have the affordance of portability, there are other nuances to consider that can impact student learning and experience (Frohberg et al., 2009; Sung et al., 2020). Research around AR use in collaborative vs. independent chemistry learning environments, especially if some students are inexperienced with AR, would be beneficial to support educators in adapting these technologies in the classroom.
6.4 Lesson 4: overusing technology can reveal fewer positive perceptions and a lower user experience
Although the results show significantly lower ratings in user experience in the remote environment, student ratings still fell within the neutral zone of the scale. When face-to-face, students had paper copies of the worksheet and used the tablet and App to examine the worksheet. When remote, most students did not choose to print the worksheet. They reported using a mobile device to examine the worksheet projected on a laptop or desktop. This overuse of screens is not an efficient way to use AR and likely decreased student user experience and perceptions of the activity (R127, Table 4). Furthermore, though mobile devices are widely adopted, providing students with a device may be most beneficial, especially if using an app for the first time. Our data demonstrate that using personal devices made some students frustrated by the screen size or the battery’s strength (see R135 and R103 Table 4).
7 Limitations
Several methodological constraints in evaluating student perceptions and experiences must be acknowledged. First, all data collected were self-reported. Thus, we are not discussing whether the activity helped students learn 1H NMR but the extent to which they perceive the App impacted their learning. This distinction must be considered when interpreting the results and the lessons learned. Additionally, while we have qualitative evidence that the collaborative environment may positively impact students perceptions of AR, we cannot fully separate the collaborative from the in-person or the independent from the remote to quantify which had a more meaningful impact on students perceptions. Lastly, since the Fall semester occurred during the COVID-19 global pandemic, the context was not the standard online learning scenario where students opt into a remote learning environment. Students’ overall dissatisfaction with remote learning may have impacted their perceptions. Even within these confines, this manuscript provides insight into lessons learned and suggestions for research that will help educators implement novel technologies into the chemistry classroom in face-to-face and online settings.
Data availability statement
The datasets presented in this article are not readily available per our current Institutional Review Board guidelines. Requests to access the datasets should be directed to the corresponding author.
Ethics statement
The studies involving humans were approved by North Carolina State University Institutional Review Board. The studies were conducted in accordance with the local legislation and institutional requirements. The participants provided their written informed consent to participate in this study.
Author contributions
LW: Conceptualization, Data curation, Formal analysis, Writing – original draft. DS: Data curation, Formal analysis, Writing – review & editing. DC: Formal analysis, Writing – review & editing. MO-H: Supervision, Writing – review & editing.
Funding
The author(s) declare financial support was received for the research, authorship, and/or publication of this article. This work was made possible with support from North Carolina State University and Indiana University Indianapolis.
Acknowledgments
We’d like to acknowledge all participants for providing their honest feedback, the teaching assistants who helped facilitate the laboratory, and Maria Gallardo-Williams, the laboratory coordinator.
Conflict of interest
The authors declare that the research was conducted in the absence of any commercial or financial relationships that could be construed as a potential conflict of interest.
Publisher’s note
All claims expressed in this article are solely those of the authors and do not necessarily represent those of their affiliated organizations, or those of the publisher, the editors and the reviewers. Any product that may be evaluated in this article, or claim that may be made by its manufacturer, is not guaranteed or endorsed by the publisher.
Supplementary material
The Supplementary material for this article can be found online at: https://www.frontiersin.org/articles/10.3389/feduc.2024.1384129/full#supplementary-material
References
Abdinejad, M., Ferrag, C., Qorbani, H. S., and Dalili, S. (2021). Developing a simple and cost-effective Markerless augmented reality tool for chemistry education. J. Chem. Educ. 98, 1783–1788. doi: 10.1021/acs.jchemed.1c00173
Alfieri, L., Nokes-Malach, T. J., and Schunn, C. D. (2013). Learning through case comparisons: a meta-analytic review. Educ. Psychol. 48, 87–113. doi: 10.1080/00461520.2013.775712
Anderson, S. Y., Ong, W. S. Y., and Momsen, J. L. (2020). Support for instructional scaffolding with 1 H NMR spectroscopy spectral features in organic chemistry textbook problems. Chem. Educ. Res. Prac. 21, 749–764. doi: 10.1039/c9rp00252a
Behmke, D., Kerven, D., Lutz, R., Paredes, J., Pennington, R., Brannock, E., et al. (2018) ‘Augmented reality chemistry: transforming 2-D molecular representations into interactive 3-D structures’, Proceedings of the interdisciplinary STEM teaching and learning conference, 2, pp. 5–11.
Braithwaite, D. W., and Goldstone, R. L. (2015). Effects of variation and prior knowledge on abstract concept learning. Cogn. Instr. 33, 226–256. doi: 10.1080/07370008.2015.1067215
Burke, P. F., Kearney, M., Schuck, S., and Aubusson, P. (2021). Improving mobile learning in secondary mathematics and science: listening to students. J. Comput. Assist. Learn. 38, 1–15. doi: 10.1111/jcal.12596
Cai, S., Wang, X., and Chiang, F. K. (2014). A case study of augmented reality simulation system application in a chemistry course. Comput. Hum. Behav. 37, 31–40. doi: 10.1016/j.chb.2014.04.018
Campbell, J. L., Quincy, C., Osserman, J., and Pedersen, O. K. (2013). Coding in-depth Semistructured interviews: problems of unitization and Intercoder reliability and agreement. Sociol. Methods Res. 42, 294–320. doi: 10.1177/0049124113500475
Cheng, K. H., and Tsai, C. C. (2013). Affordances of augmented reality in science learning: suggestions for future research. J. Sci. Educ. Technol. 22, 449–462. doi: 10.1007/s10956-012-9405-9
Chi, M. T. H., and Wylie, R. (2014). The ICAP framework: linking cognitive engagement to active learning outcomes. Educ. Psychol. 49, 219–243. doi: 10.1080/00461520.2014.965823
Connor, M. C., and Shultz, G. V. (2018). Teaching assistants’ topic-specific pedagogical content knowledge in 1H NMR spectroscopy. Chem. Educ. Res. Pract. 19, 653–669. doi: 10.1039/C7RP00204A
De Lima, C. B., Walton, S., and Owen, T. (2022). A critical outlook at augmented reality and its adoption in education. Comput. Educ. Open 3:100103. doi: 10.1016/j.caeo.2022.100103
Frohberg, D., Göth, C., and Schwabe, G. (2009). Mobile learning projects - a critical analysis of the state of the art. J. Comput. Assist. Learn. 25, 307–331. doi: 10.1111/j.1365-2729.2009.00315.x
Glaser, B. G. (1965). The Constant Comparative Method of Qualitative Analysis. 12, 436–445. doi: 10.2307/798843
Goddard, T. D., Brilliant, A. A., Skillman, T. L., Vergenz, S., Tyrwhitt-Drake, J., Meng, E. C., et al. (2018). Molecular visualization on the holodeck. J. Mol. Biol. 430, 3982–3996. doi: 10.1016/j.jmb.2018.06.040
Graulich, N., and Schween, M. (2018). Concept-oriented task design: making purposeful case comparisons in organic chemistry. J. Chem. Educ. 95, 376–383. doi: 10.1021/acs.jchemed.7b00672
Huwer, J., Lauer, L., Seibert, J., Thyssen, C., Dörrenbächer-Ulrich, L., and Perels, F. (2018). Re-experiencing chemistry with augmented reality: new possibilities for individual support. World J. Chem. Educ. 6, 212–217. doi: 10.12691/wjce-6-5-2
Imtinan, U., Chang, V., and Issa, T. (2013). “Common Mobile learning characteristics - an analysis of three Mobile learning models and frameworks” in Proceedings of the international conference Mobile learning (Lisbon), 3–11.
Kohl, P. B., and Finkelstein, N. D. (2006). Effects of representation on students solving physics problems: a fine-grained characterization. Phys. Educ. Res. 2, 1–12. doi: 10.1103/PhysRevSTPER.2.010106
Laugwitz, B., Held, T., and Schrepp, M. (2008). “Construction and evaluation of a user experience questionnaire” in HCI and usability for education and work. USAB 2008 lecture notes in computer science. ed. A. Holzinger (Berlin, Heidelberg: Springer), 63–76.
Lincoln, Y. S., and Guba, E. G., (1985) Naturalistic inquiry. Thousand Oaks, CA: Sage Publications, 9, 438–439.
Mazzuco, A., Krassmann, A. L., Reategui, E., and Gomes, R. S. (2022). A systematic review of augmented reality in chemistry education. Review of Education 10:e3325. doi: 10.1002/rev3.3325
Patton, M. Q. (2002) Qualitative research and evaluation methods. 3rd. Thousand Oaks, CA: Sage Publications.
Rittle-Johnson, B., Star, J. R., and Durkin, K. (2009). The importance of prior knowledge when comparing examples: influences on conceptual and procedural knowledge of equation solving. J. Educ. Psychol. 101, 836–852. doi: 10.1037/a0016026
Saldaña, J. (2013). “The coding manual for qualitative researchers” in Qualitative research in organizations and management: an international journal, vol. 12. 3rd ed (Thousand Oaks, CA: Sage Publications), 169–170.
Santoso, H. B., Schrepp, M., Kartono Isal, R. Y., Yudha Utom, A., and Priyogi, B. (2016). Measuring the user experience. J. Educ. Online 13, 1–79. doi: 10.9743/JEO.2016.1.5
Schrepp, M., Hinderks, A., and Thomaschewski, J. (2014) ‘Applying the user experience questionnaire (UEQ) in different evaluation scenarios’, in A. Marcus (ed.) Design, user experience, and usability. Theories, methods, and tools for designing the user experience: Third international conference, DUXU 2014, Held as part of HCI international 2014. Heraklion, Crete, Greece. Proceedings, part I. Series: Lecture notes. Springer, pp. 383–392.
Sharples, M., Taylor, J., and Vavoula, G. (2007). “A theory of learning for the Mobile age” in The sage handbook of Elearning research. eds. R. Andrews and C. Haythornthwaite (London: Sage), 221–247.
Sung, R.-J., Wilson, A. T., Lo, S. M., Crowl, L. M., Nardi, J., St. Clair, K., et al. (2020). BiochemAR: an augmented reality educational tool for teaching macromolecular structure and function. J. Chem. Educ. 97, 147–153. doi: 10.1021/acs.jchemed.8b00691
Taber, K. S. (2018). The use of Cronbach’s alpha when developing and reporting research instruments in science education. Res. Sci. Educ. 48, 1273–1296. doi: 10.1007/s11165-016-9602-2
Taylor, J., Sharples, M., O’Malley, C., Vavoula, G., and Waycott, J. (2006). Towards a task model for mobile learning: a dialectical approach. Int. J. Learn. Technol. 2, 138–158. doi: 10.1504/ijlt.2006.010616
Tee, N. Y. K., Gan, H. S., Li, J., Cheong, B. H. P., Tan, H. Y., Liew, O. W., et al. (2018). Developing and demonstrating an augmented reality colorimetric titration tool. J. Chem. Educ. 95, 393–399. doi: 10.1021/acs.jchemed.7b00618
Wei, J., Treagust, D. F., Mocerino, M., Lucey, A. D., Zadnik, M. G., and Lindsay, E. D. (2019). Understanding interactions in face-to-face and remote undergraduate science laboratories: a literature review. Discip. Interdiscip. Sci. Educ. Res. 1, 1–16. doi: 10.1186/s43031-019-0015-8
Keywords: organic chemistry, augmented reality, laboratory learning, remote learning, proton nuclear magnetic resonance, chemistry education research
Citation: Ward LW, Spencer D, Chauhan D and Oliver-Hoyo M (2024) Lessons learned: the use of an augmented reality application in organic chemistry laboratories. Front. Educ. 9:1384129. doi: 10.3389/feduc.2024.1384129
Edited by:
Sarah Zingales, University of Saint Joseph, United StatesReviewed by:
Fun Man Fung, National University of Singapore, SingaporeJalisa Ferguson, Eckerd College, United States
Copyright © 2024 Ward, Spencer, Chauhan and Oliver-Hoyo. This is an open-access article distributed under the terms of the Creative Commons Attribution License (CC BY). The use, distribution or reproduction in other forums is permitted, provided the original author(s) and the copyright owner(s) are credited and that the original publication in this journal is cited, in accordance with accepted academic practice. No use, distribution or reproduction is permitted which does not comply with these terms.
*Correspondence: Lyniesha Wright Ward, d2FyZGx5bkBpdS5lZHU=