 Dirk Tempelaar
 Anikó Bátori
 Bas Giesbers
94% of researchers rate our articles as excellent or good
Learn more about the work of our research integrity team to safeguard the quality of each article we publish.
Find out more
ORIGINAL RESEARCH article
Front. Educ., 05 June 2024
Sec. Assessment, Testing and Applied Measurement
Volume 9 - 2024 | https://doi.org/10.3389/feduc.2024.1382771
This article is part of the Research TopicActionable Learning Analytics in Education: An opportunity to close the learning loopView all 7 articles
In the ongoing discussion about how learning analytics can effectively support self-regulated student learning and which types of data are most suitable for this purpose, this empirical study aligns with the framework who advocated the inclusion of both behavioral trace data and survey data in learning analytics studies. By incorporating learning dispositions in our learning analytics modeling, this research aims to investigate and understand how students engage with learning tasks, tools, and materials in their academic endeavors. This is achieved by analyzing trace data, which captures digital footprints of students’ interactions with digital tools, along with survey responses from the Study of Learning Questionnaire (SLQ), to comprehensively examine their preferred learning strategies. Additionally, the study explores the relationship between these strategies and students’ learning dispositions measured at the start of the course. An innovative aspect of this investigation lies in its emphasis on understanding how learning dispositions act as antecedents and potentially predict the utilization of specific learning strategies. The data is scrutinized to identify patterns and clusters of such patterns between students’ learning disposition and their preferred strategies. Data is gathered from two cohorts of students, comprising 2,400 first year students. This analytical approach aims to uncover predictive insights, offering potential indicators to predict and understand students’ learning strategy preferences, which holds value for teachers, educational scientists, and educational designers. Understanding students’ regulation of their own learning process holds promise to recognize students with less beneficial learning strategies and target interventions aimed to improve these. A crucial takeaway from our research underscores the significance of flexibility, which entails the ability to adjust preferred learning strategies according to the learning environment. While it is imperative to instruct our students in deep learning strategies and encourage autonomous regulation of learning, this should not come at the expense of acknowledging situations where surface strategies and controlled regulation may prove to be more effective.
Today’s technology-driven dynamic landscape necessitates acquiring skills that make it possible to flexibly deal with these changes, such as self-regulated learning (SRL), which are essential to continuously learn and develop to deal with the dynamic digital age (OECD, 2019; European Commission, 2020; Ciarli et al., 2021).
SRL refers to a set of skills which successfully facilitate the learning processes and lead to positive (academic) outcomes, such as increased performance, for example, progressing appropriately and continuously (Haron et al., 2014; Panadero and Alonso-Tapia, 2014). More specifically, SRL refers to (meta-) cognitive and motivational learning strategies, which shape a dynamic and cyclical process that defines the extent to which students can steer their own learning (Zimmerman, 1986). Though in general six different models of SRL can be discerned (Panadero, 2017), scholars generally agree that the cyclical process contains three phases in which skills are applied: a preparatory phase, a performance phase, and an appraisal phase. Although a wide variety of scientific papers is available about SRL and how to foster these skills in an educational context, teachers and students often still struggle to do so, even in pedagogical approaches such as PBL where self-regulation is more of an integral part compared to traditional (e.g., lecture-based) approaches (Loyens et al., 2013). That struggle can be partly explained on the basis of a recent discussion by Díaz et al. (2024), highlighting the challenge of context dependency as one of the barriers to promoting self-regulated student learning in Latin American applications of learning analytics.
Centered around solving meaningful problems, PBL encourages learners to actively engage in their learning journey, fostering critical thinking, sharing their understanding of the problems with peers, and self-directed learning skills (Hmelo-Silver, 2004; Schmidt et al., 2007). Self-directed learning (SDL) refers to a broader term than self-regulated learning, but SDL encompasses SRL. However, educational stakeholders often use both terms interchangeably. In the context of PBL, SDL is a more appropriate term, since it is more permissive about the selection and evaluation of learning materials (Loyens et al., 2008). In a program based on PBL principles, learners are constantly required to self-regulate as they collaboratively and individually navigate through problems, apply knowledge, and adapt strategies based on feedback and reflection. Nonetheless, research shows mixed results regarding student approaches to learning. An elaborate literature review on the adoption of deep versus surface learning approaches in PBL showed a small positive effect size regarding the adoption of deep learning approaches (Dolmans et al., 2016), yet there are studies reporting a tendency to adopt a surface approach to learning across the studied population (Loyens et al., 2013).
The role of educational technology in supporting SRL has been recognized (Persico and Steffens, 2017), particularly in light of the unprecedented shift to digital education driven by the COVID-19 pandemic (Mou, 2023). E-tutorials, designed around the principle of mastery learning, exemplify this transformative shift. They mirror the instructional style of PBL, where students are tasked with problem-solving challenges and receive varying levels of learning feedback (Tempelaar et al., 2020b). In the untutored problem solving mode, students tackle problems independently, with the e-tutorial primarily verifying answers. Transitioning to the tutored problem solving mode, students receive feedback in the form of hints and evaluations, both throughout and at the conclusion of their problem-solving process. The worked-out example mode offers comprehensive support, allowing students to request a complete demonstration of problem solutions from the e-tutorial. In the mastery learning framework, this phase of supported problem-solving always concludes with an unsupported attempt at problem-solving mastery.
Despite this transition to digital education, the efficacy of technology in both improving Self-Regulated Learning (SRL) and identifying critical phases of SRL remains constrained, as noted by Lodge et al. (2018). The enhancement of SRL varies significantly, influenced by factors such as educators’ attitudes toward technology and student engagement with digital platforms (Lawrence and Tar, 2018; Timotheou et al., 2023; Zamborova and Klimova, 2023). Lodge et al. (2018) argue that trace data possess limited utility in deducing high-level cognitive processes, suggesting that behavioral data such as mouse clicks need to be complemented with additional data. A parallel viewpoint is presented in the scoping review conducted by Viberg et al. (2020), who analyzed 54 papers on empirical research in Learning Analytics (LA) for SRL. Their conclusion indicates “that in general, there is limited support (based on LA) offered to students to foster their SRL in online learning settings …”.
In this context, dispositional factors have been identified as key determinants of student engagement in technology-enhanced learning environments that aim to scaffold SRL (Tempelaar et al., 2017, 2020a,b). Recent advancements in dispositional learning analytics underscore its potential in providing deeper insights into SRL within technology-enhanced learning contexts (Pardo et al., 2016, 2017; Tempelaar et al., 2017, 2020a,b), offering a pathway to more personalized and effective educational interventions.
In the evolving domain of educational research, Learning Analytics (LA) stands as a pivotal tool, offering a comprehensive analysis of educational data to derive actionable insights for learners, educators, and policymakers alike (Hwang et al., 2018). Initially, the focus of LA research was predominantly on constructing predictive models utilizing data from institutional and digital learning platforms. However, these early endeavors primarily illuminated the descriptive capabilities of LA, confined to aggregating and analyzing learner data within the constraints of existing educational infrastructures (Siemens and Gašević, 2012; Viberg et al., 2018). Recognizing the limitations imposed by the static nature of such data, Buckingham Shum and Deakin Crick (2012) introduced the concept of Dispositional Learning Analytics (DLA), proposing an innovative framework that intertwines traditional learning metrics with deeper insights into learners’ dispositions, attitudes, and values.
DLA, by integrating learner dispositions into the analytic process, promises to refine the granularity and applicability of feedback provided to educational stakeholders, thereby enhancing the precision of educational interventions (Gašević et al., 2015; Tempelaar et al., 2017). The notion of ‘actionable feedback,’ as conceptualized by Gašević et al. (2015), underscores the transformative potential of DLA not only helping to understand student behavior and learning strategies but also forming the basis to enable a more tailored and effective educational experience (Tempelaar et al., 2015, 2017, 2021b; Han et al., 2020).
Despite the recognized value of LA in identifying at-risk students, the challenge of translating analytic insights into effective pedagogical action remains significant, as evidenced by studies such as Herodotou et al. (2020). DLA seeks to address this gap by incorporating a multidimensional analysis of learning dispositions, thereby offering a richer, more holistic understanding of learners’ engagement and potential barriers to their success.
For example, the simplistic directive to ‘catch up’ may prove inadequate for students consistently lagging in their learning process. A deeper exploration into their learning dispositions through Dispositional Learning Analytics (DLA) might reveal specific barriers to their academic engagement, such as a lack of motivation or suboptimal self-regulation strategies, allowing for more precise interventions (Tempelaar et al., 2021a).
A prominent utility of DLA manifests in the nuanced integration of motivational elements and learning regulation tactics within the broader LA schema. Our previous studies indicate that, although a high degree of self-regulation is frequently commended, an equilibrium between self-directed and externally guided regulation is paramount (Tempelaar et al., 2021b, 2023). Distinguishing students predisposed to either excessive self-reliance or marked disengagement enables the design of tailored interventions that resonate with their unique learning paradigms. For individuals inclined toward overemphasis on self-regulation, the feedback might underscore the benefits of external inputs and compliance with the prescribed curriculum framework. Conversely, for those exhibiting disengagement, the focus of strategies could be to ignite intrinsic motivation and encourage active engagement in the learning process.
The current study addresses the learning strategies of first-year business and economics students enrolled in an introductory mathematics and statistics course. This demographic is interesting and relevant due to the challenges and opportunities presented by the subject matter, which requires both conceptual understanding and practical application, and often is perceived by students as a stumbling block. Our focus on this group aims to shed light on the dynamics of how students engage with complex quantitative content, providing a first step toward enhancing academic success of students, especially those at risk of failure. Our primary aim therefore is to explore and understand the variety of learning strategies employed by these students. To achieve this, we utilize a dual approach: analyzing trace data, which provides digital footprints of students’ interactions with learning tools and materials, combined with dispositional data such as motivation for learning and learning strategies. This analysis is designed to not only map out the prevalent learning strategies but also to find how these strategies correlate with students’ engagement with learning materials offered through digital learning tools. Drawing on multiple empirical studies exploring the significance of trace-based behavioral measures of learning strategies in both learning processes and its outcomes, our primary research question revolves around the necessity of these trace-based measures versus the adequacy of survey-based measures as substitutes. This understanding is important, as it has the potential to inform more effective pedagogical approaches and/or targeted interventions more timely, to enhance student learning outcomes (Han et al., 2020).
This study introduces several innovative aspects to the field of dispositional learning analytics. First, it underscores the importance of correlating learning dispositions, as measured at the onset of the course, with subsequent learning strategies (e.g., Tempelaar et al., 2023). By identifying clusters in this data, we aim to reveal how initial dispositions can serve as predictors for the adoption of specific learning strategies. This approach represents a significant shift from traditional methods, which often focus solely on outcomes, to a more nuanced understanding that encompasses the origins and evolution of learning behaviors.
Resulting insights offer potential benefits to multiple stakeholders in education. For educational scientists and designers, our findings provide critical data that can inform the development of more effective curriculum designs and learning tools. Teachers, on the other hand, can leverage this information to better understand their students’ learning processes, potentially recognizing those with less beneficial strategies. This understanding is crucial for developing targeted interventions that can significantly improve student learning outcomes and foster more effective self-regulation in learning processes.
This study was conducted in context of a mandatory introductory mathematics and statistics module designed for first-year undergraduate students. The module is an integral part of a business and economics program at a medium-sized university in The Netherlands, and data were collected during academic years 22/23 and 23/24. It spans 8 weeks, with a weekly commitment of 20 h. Many students, particularly those with limited math skills, view this module as a significant challenge.
The instructional approach employed is a flipped classroom design, with a primary focus on face-to face Problem-based Learning (PBL) sessions. In these sessions, conducted in tutorial groups of a maximum of 15 students, a content expert tutor guides the learning process. Students participate in two such tutorial groups per week, each lasting 2 h. Key weekly concepts were introduced through lectures. Additionally, students were expected to dedicate 14 h per week to self-study, using textbooks and engaging with two interactive online tutoring systems: Sowiso1 and MyStatLab (Tempelaar et al., 2015, 2017, 2020a,b; Nguyen et al., 2016; Rienties et al., 2019). Both e-tutorials adhere to the principles of mastery learning, presenting a series of problems for each topic to be learned. Students are tasked to build mastery by solving these problems, having access to varying levels of learning support, ranging from worked-out examples to untutored problem-solving.
A primary objective of the PBL approach is to foster Self-Regulated Learning (SRL) skills among students, emphasizing their responsibility for making informed learning choices (Schmidt et al., 2007). Another aim is to encourage collaborative learning through shared cognitions. To achieve this, feedback from the tutoring systems is shared with both students and tutors. Tutors use this information to prompt students when necessary, initiating discussions on feedback implications and suggesting improvement strategies. These interactions occurred within the tutorial sessions and remained unobserved.
The student learning process unfolds in three phases. The first involves preparation for the weekly tutorials, where students delve into ‘advanced’ mathematical and statistical problems through self-study. Although not formally assessed, this phase is crucial for active participation in the tutorials. The second phase revolves around quiz sessions held at the end of each week (excluding the first). These quizzes, designed to be formative in nature, offer feedback on students’ subject mastery. Encouraging participation, 12.5% of the total score is based on quiz performance. Quiz items are drawn from the same pools used in the practicing mode of the online tutoring systems, motivating students with limited prior knowledge to extensively utilize these resources.
The third and final phase is dedicated to exam preparation during the last week of the module, involving graded assessments. Students’ timing decisions in each phase are influenced by their level of preparation, creating a dynamic learning experience.
In total, observations from 2,406 first-year students from academic years 2022/2023 and 2023/2024 were used in in this study, of whom all had been active in at least one online learning platform. Of these students, 37% identified as female, 63% as male, 16% had a Dutch high school diploma, and 84% were international students. International students mainly had a background in European countries, with a large representation of German (33%) and Belgian (18%) nationalities. In addition, 7% of students were from outside Europe.
Teaching mathematics and statistics varies significantly across high school systems, with the Dutch system emphasizing statistics more than many other countries. However, all countries typically categorize math education into different levels based on its application in sciences, social sciences, or humanities. In our business program, a prerequisite for admission is prior mathematics education geared toward social sciences. In our study, 37% of students pursued the highest track in high school, contributing to a diverse range of prior knowledge. Hence, it was imperative that the module catered to these students, offering flexibility and accommodating individual learning paths, along with providing regular interactive feedback on their learning strategies and tasks.
In addition to a final written exam, student assessment included a project where students statistically analyzed personal learning disposition data. To facilitate this, students completed various individual disposition questionnaires to measure affective, behavioral and cognitive aspects of aptitudes including a learning strategies questionnaire at the module’s outset. They later received personal datasets for their project work.
In the introduction of dispositional learning analytics by Buckingham Shum and Deakin Crick (2012), dispositional learner data was gathered through a survey instrument designed to assess learning power. Learning power encompasses a range of factors, including dispositions, experiences, social interactions, values, and attitudes, all of which influence learner engagement. In our research, we have chosen to employ disposition instruments rooted in contemporary social-cognitive learning theories. We strive to cover a wide range of individual learner traits thought to influence self-regulated student learning in a PBL setting. These traits encompass affective, behavioral, and cognitive aspects. Achievement emotions are situated firmly on the affective end of the spectrum, while learning process and regulation strategies reside on the cognitive end. Measures of motivation and engagement encompass both cognitive and behavioral dimensions. In line with the interpretation of learning dispositions by Buckingham Shum and Deakin Crick (2012), our understanding is broad. It extends beyond personality traits and attitudes to include learning-related beliefs, such as the distinction between autonomous and controlled motivation.
The questionnaire measuring learning strategies (see Table 1) was based on the questionnaire used by Rovers et al. (2018), which in turn was adapted from Hartwig and Dunlosky (2012) to fit a PBL learning environment. To fit the course, items were included on the use of both online learning systems. All items used a 1 (never) – 7 (often) Likert scale. The instrument was administered halfway the course, to guarantee familiarity with the included learning strategies.
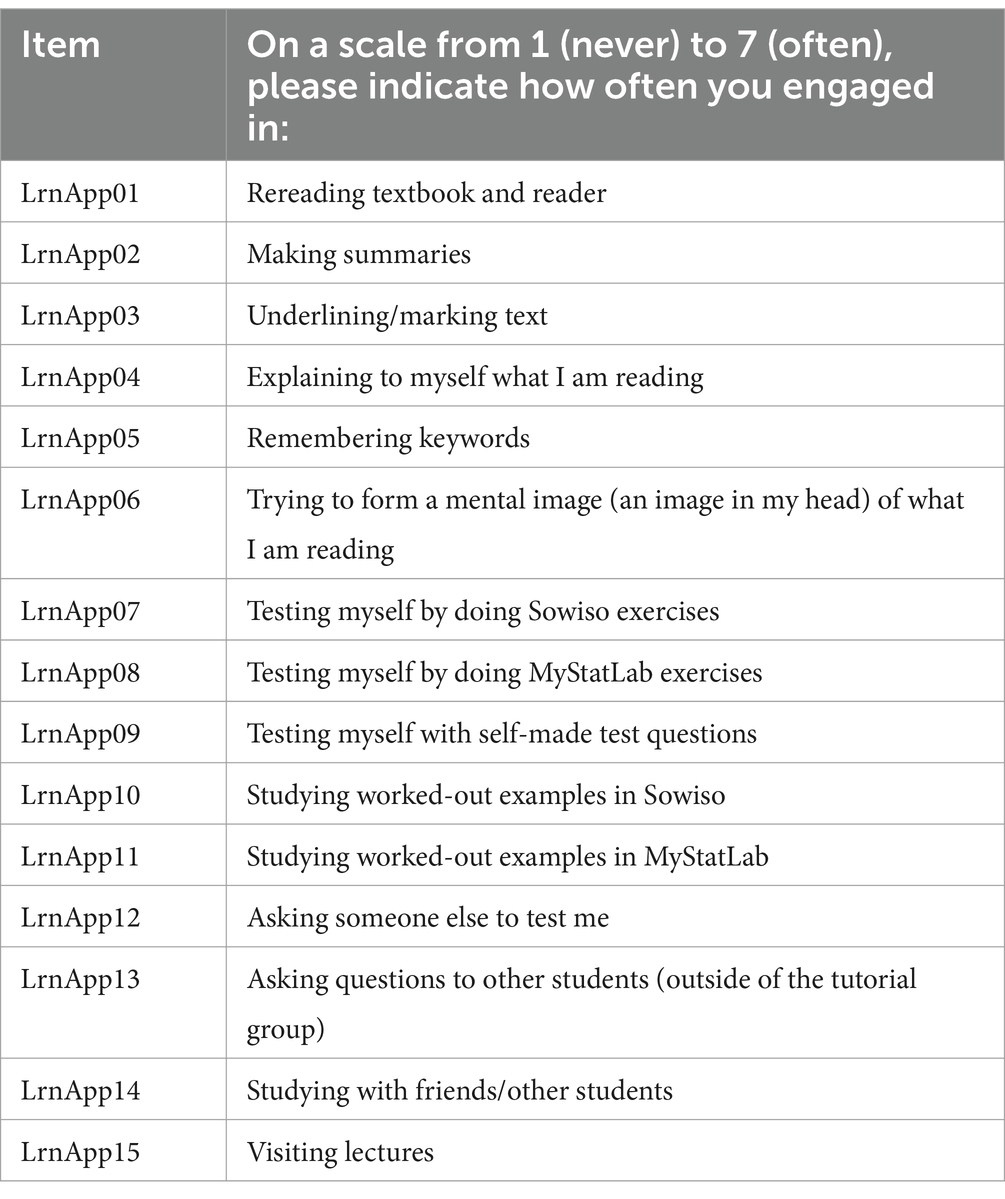
Table 1. Learning strategy questionnaire items.
It can be seen that the first items question learning strategies that have been identified as more passive and therefore less effective for learning in contrast to more active strategies like self-testing represented in later items (cf., Hartwig and Dunlosky, 2012; Dunlosky et al., 2013). Items assessing the extent of online learning usage through the e-tutorials Sowiso and MyStatLab, reveal variations in the type of learning feedback preferred by students: whether it be through worked-out examples or through tutored and untutored problem-solving methods.
This instrument was constructed upon the Motivation and Engagement Wheel framework (Martin, 2007), which categorizes learning cognitions and behaviors into four quadrants. These quadrants distinguish between adaptive and maladaptive types, as well as cognitive (motivational) and behavioral (engagement) aspects. Self-Belief, Learning Focus, and Valuing School constitute the adaptive, cognitive factors representing positive motivations. Persistence, Task Management, and Planning constitute the adaptive, behavioral factors embodying positive engagement. On the other hand, Uncertain Control, Failure Avoidance, and Anxiety represent maladaptive cognitive factors or negative motivations, while Self-sabotage and Disengagement embody maladaptive behavioral factors or negative engagement. The instrument was administered at the very start of the academic study.
Learning processing and regulation strategies, which contribute to Self-Regulated Learning (SRL), were assessed using Vermunt’s (1996) student’s learning pattern (ILS) instrument. Our study specifically examined cognitive processing strategies and metacognitive regulation strategies within two domains. Each of these components comprised five scales.
The five cognitive processing strategies align with the SAL research framework (refer to Han et al., 2020) and are organized along a continuum from deep to surface approaches to learning. In the deep approach, students aim for understanding, while in the surface approach, they focus on reproducing material for tests without necessarily grasping the concepts:
Critical Processing: Forming independent opinions during learning.
Relating and Structuring: Seeking connections and creating diagrams.
Concrete Processing: Focusing on making new knowledge concrete and applying it.
Analyzing: Investigating step by step.
Memorizing: Learning by rote.
The first two strategies contribute to the Deep Approach to learning, while the last two characterize the Stepwise Approach (or surface approach) to learning.
Similarly, the five metacognitive regulation strategies illustrate how students manage their learning processes and enable the positioning of students on a spectrum ranging from self-regulation as the primary mechanism to external regulation. The scales encompass:
SRL Process: Self-regulation of learning processes.
SRL Content: Self-regulation of learning content.
ERL Process: External regulation of learning processes.
ERL Content: External regulation of learning results.
Lack Regulation: Lack of regulation.
The first two regulation strategies shape Self-regulation, the next two shape External Regulation. The instrument was administered at the very start of the academic study, implying that typical learning patterns of students are those developed in high school education.
The Academic Motivation Scale (AMS, Vallerand et al., 1992) is based on the self-determination theory framework of autonomous and controlled motivation. The AMS consists of 28 items, to which students respond according to the question stem “Why are you going to college?” There are seven subscales on the AMS, of which four belong to the Autonomous motivation scale, the drive to learn is derived from the satisfaction and pleasure of the activity of learning itself, and two belong to the Controlled motivation scale, learning that is a means to some end, and therefore not engaged for its own sake. A final scale, A-motivation, constitutes the absence of regulation.
According to the Control-Value Theory of Achievement Emotions (CVTAE, Pekrun, 2006) both the emotions experienced during learning activities and those associated with outcomes are significant factors in any learning process and the subsequent achievement. Various learning emotions influence students’ motivation to learn, the strategies they employ, and their approach to self-regulating their learning. Utilizing the Achievement Emotions Questionnaire (AEQ, Pekrun et al., 2011), an instrument aligned with CVTAE, we specifically chose four emotion scales with the strongest associations to academic performance: positive activating Enjoyment, negative activating Anxiety, and negative deactivating Boredom and Hopelessness. Academic control is included as one of the proximal antecedents of all activity emotions. Academic control was measured with the perceived Academic control scale of Perry et al. (2001). The instrument was administered halfway the course, to guarantee familiarity with the typical learning activities.
Trace data were gathered from both online tutoring systems as well as from the LMS (Canvas LMS), that offered general course information and links to Sowiso and MyStatLab. Both Sowiso and MyStatLab follow the instructional method of mastery learning (Tempelaar et al., 2017). However, both differ significantly in terms of trace data collection capabilities. MyStatLab provides students and instructors with several dashboards summarizing student progress in terms of mastering individual exercises and chapters but lacks time-stamped usage data. On the other hand, Sowiso offers time-stamps for every individual event initiated by the student, along with mastery data, enabling the full integration of temporality in the design of learning models. In previous studies (Tempelaar et al., 2021a, 2023), we focused on the rich combination of process and product trace data of Sowiso only. In this study, we include the learning taking place in both of these e-tutorials. Consequently, our analysis is limited to product-type trace data: student performance in the e-tool through the mastery achieved by students in each week, as a preparation of their quiz sessions. Mastery data represent the proportion of assignments students are able to solve without using any digital help. Weekly mastery data are aggregated into MathMastery and StatsMastery, expressing mastery achieved in both topics over the full course period.
In both e-tutorials, students have access to two learning aids: solutions and hints. A solution presents a fully worked-out example of the assignment, offering no mastery but enabling students to retry solving an equivalent assignment after learning from the example. Hints provide support for a single solution step. Assignments are parameterized, meaning that repeating an assignment generates an equivalent problem with different parameters.
Figure 1 illustrates one such attempt in the Sowiso e-tutorial, focusing on an assignment related to multivariate functions. In the lower part of the graph, various follow-up steps are displayed, including Checking the provided solution, consulting a Theory page, calling a Solution, or requesting a Hint.
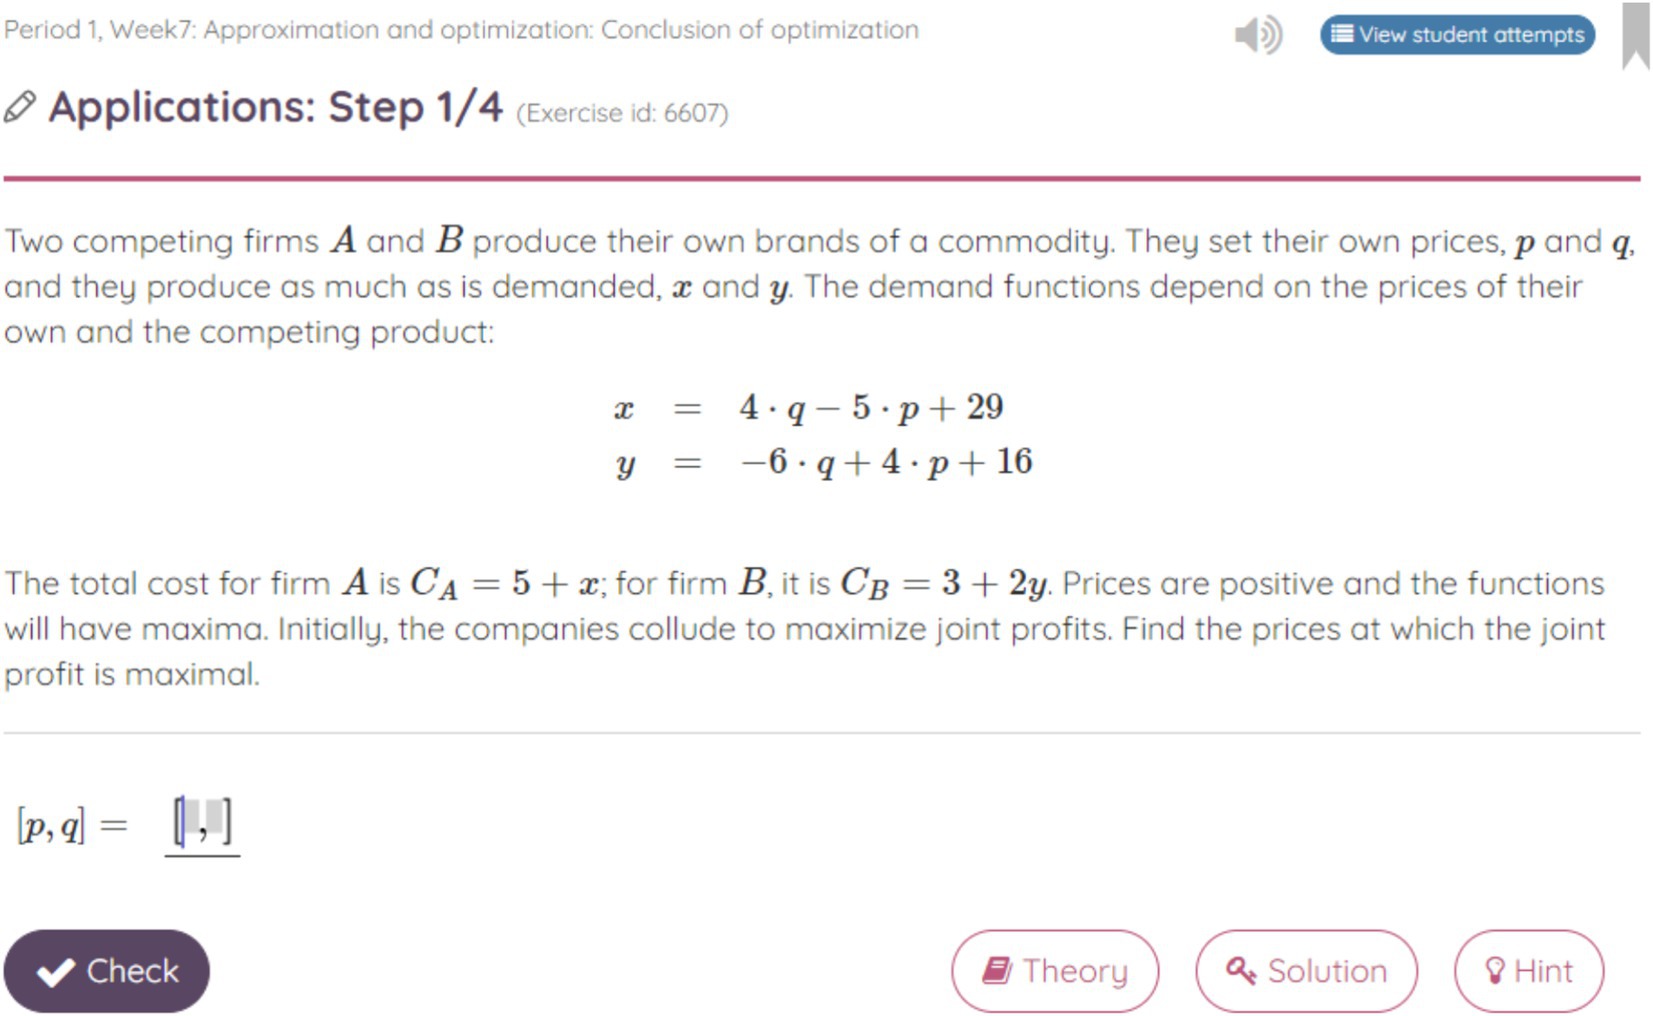
Figure 1. Example of an assignment in SOWISO, with feedback options Check, Theory, Solution and Hint.
Data from both modules were consolidated into a comprehensive dataset.
Building on the framework of person-centered modeling approaches (Malcom-Piqueux, 2015), and employing cluster analysis methodologies to discern both distinctive and shared learner profiles based on their learning strategy data, the study utilized k-means cluster analysis. K-means clustering is a commonly utilized statistical technique in learning analytics research for generating student profiles based on trace of disposition data (see, e.g., Ifenthaler et al., 2023; Villalobos Díaz et al., 2024). As highlighted in a recent review (Bharara et al., 2018), it stands out as the most prevalent method for student profiling based on educational data within the research community. Our decision to adopt this method was influenced not only by its widespread use but also by its numerical properties (Navarro and Moreno-Ger, 2018). Unlike alternatives such as two-step clustering, which rely on statistical criteria to determine cluster numbers, K-means offers flexibility in class specification, a crucial advantage in learning analytics applications. Typically, these alternative methods yield only a small number of clusters (also in our case), with limited potential to derive concrete learning feedback. The downside of this flexibility lies in the potential arbitrariness of determining cluster numbers. Our approach prioritized meaningful arguments, aiming for multiple clusters that are easily interpretable, while steering clear of creating overly small clusters (constituting less than 5% of students). We employed the elbow method, which involves identifying the point at which the curve representing the sum of squared errors flattens out as the number of clusters increases, as a rule-of-thumb validation measure.
The input for the cluster analysis comprised the 15 responses to the SRL instrument, excluding trace data and other disposition data. Although trace data and other disposition data could have been integrated into the cluster analysis, the decision was made to exclusively focus on profiles based on SRL data. Opting to categorize students into clusters based solely on perceived learning strategies offers the advantage of distinguishing and exploring the relationships between learning strategies stemming from self-reported aptitudes and those rooted in learning activities, as well as other aptitude measures (Han et al., 2020). An alternative approach would have been to combine behavioral and dispositional measures for clustering, as in previous studies by the authors (Tempelaar et al., 2020b). In such cases, student profiles resulting from clustering would represent a blend of actual learning activities and self-perceived learning dispositions. Alternatively, another approach could focus solely on trace data for clustering, exploring disparities in learning behaviors among clusters, as exemplified by Tempelaar et al. (2023); given the lack of trace data of process type for the MyStatLab e-tutorial, this would not have been an obvious approach in this study.
In the determination of the number of clustery, we arrived at a seven-cluster solution, demonstrating seven distinct profiles. Solutions with higher dimensions did not substantially alter the cluster characteristics and posed challenges in interpretation. Among the various solutions, including the three-cluster solution generated by the two-step clustering approach, those with fewer classes primarily delineated groups of students exhibiting quantitative disparities in their utilization of learning strategies (either at high or low levels), rather than qualitative disparities (favoring certain strategies over others). The six-cluster solution corresponded with the findings of the elbow method, which evaluates the reduction of the sum of squared errors, demonstrating flattening for cluster solutions in the range of five to seven clusters.
Subsequently, differences between profiles were explored through variable-centered analysis, employing ANOVA.
Ethics approval was obtained by the Ethical Review Committee Inner City faculties of Maastricht University (ERCIC_044_14_07_2017).
The optimal characterization of students’ learning strategy profiles emerged through a seven-cluster solution. This selection was predominantly driven by the preference for solutions that offer a straightforward and intuitive interpretation of the profiles, prioritizing parsimony. The seven-cluster solution proves to be the best fit, delineating distinct profiles of learning approaches within the clusters. The clusters are presented in Figure 2, the number of students per cluster and cluster centers in Table 2.
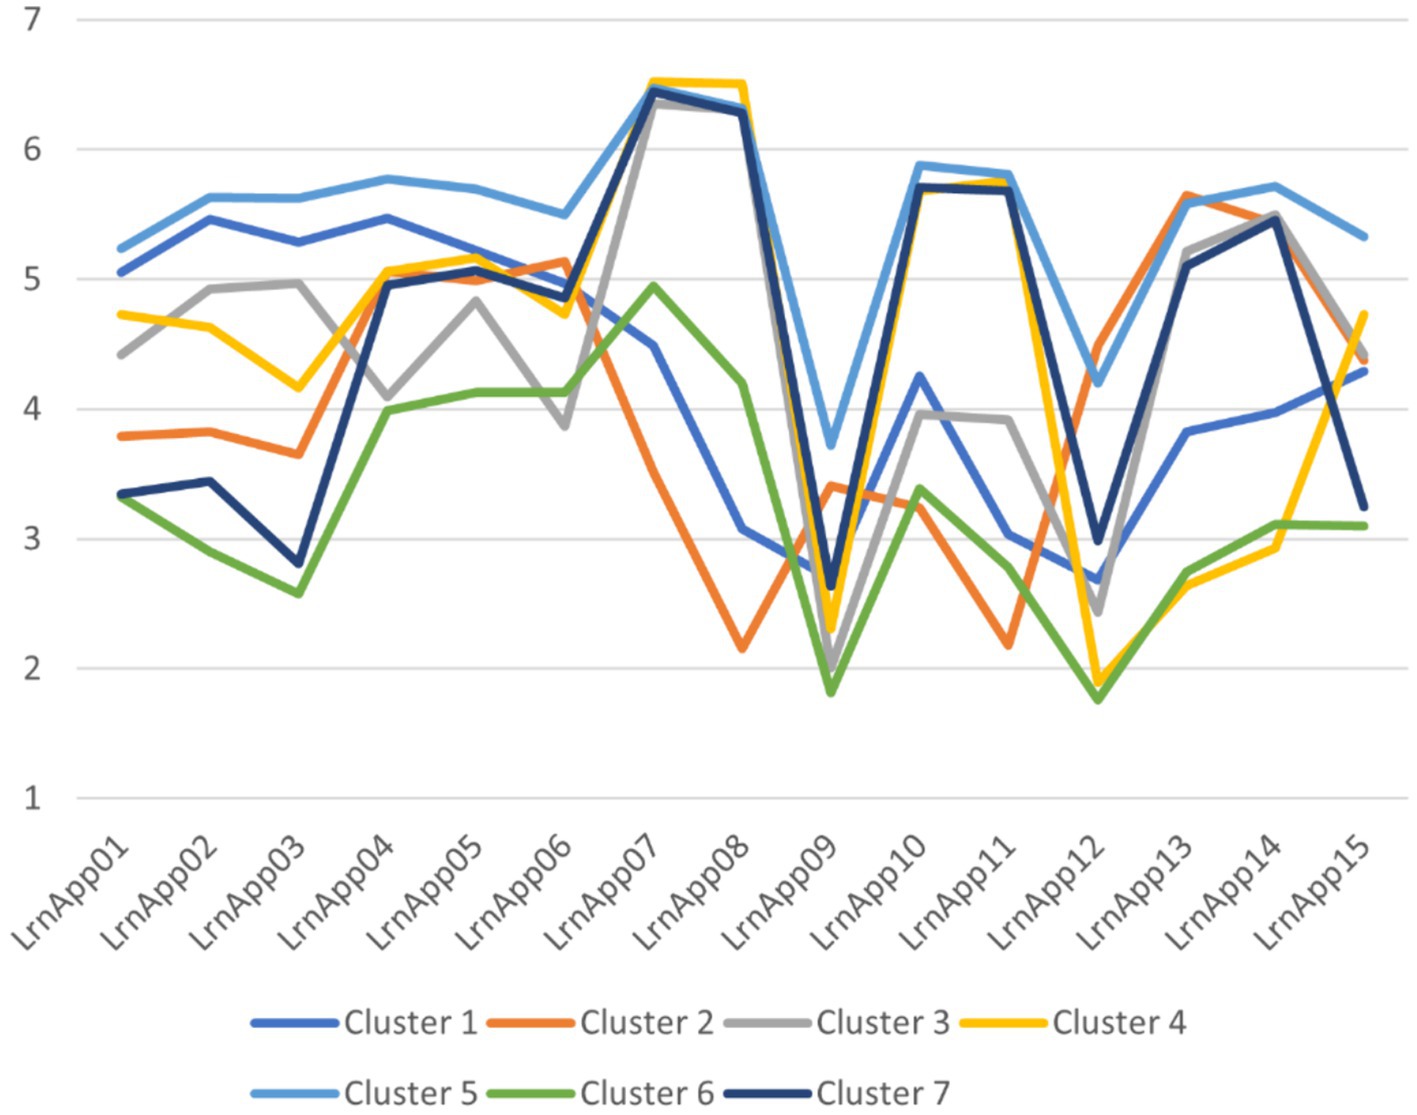
Figure 2. Student clusters based on learning strategy data.
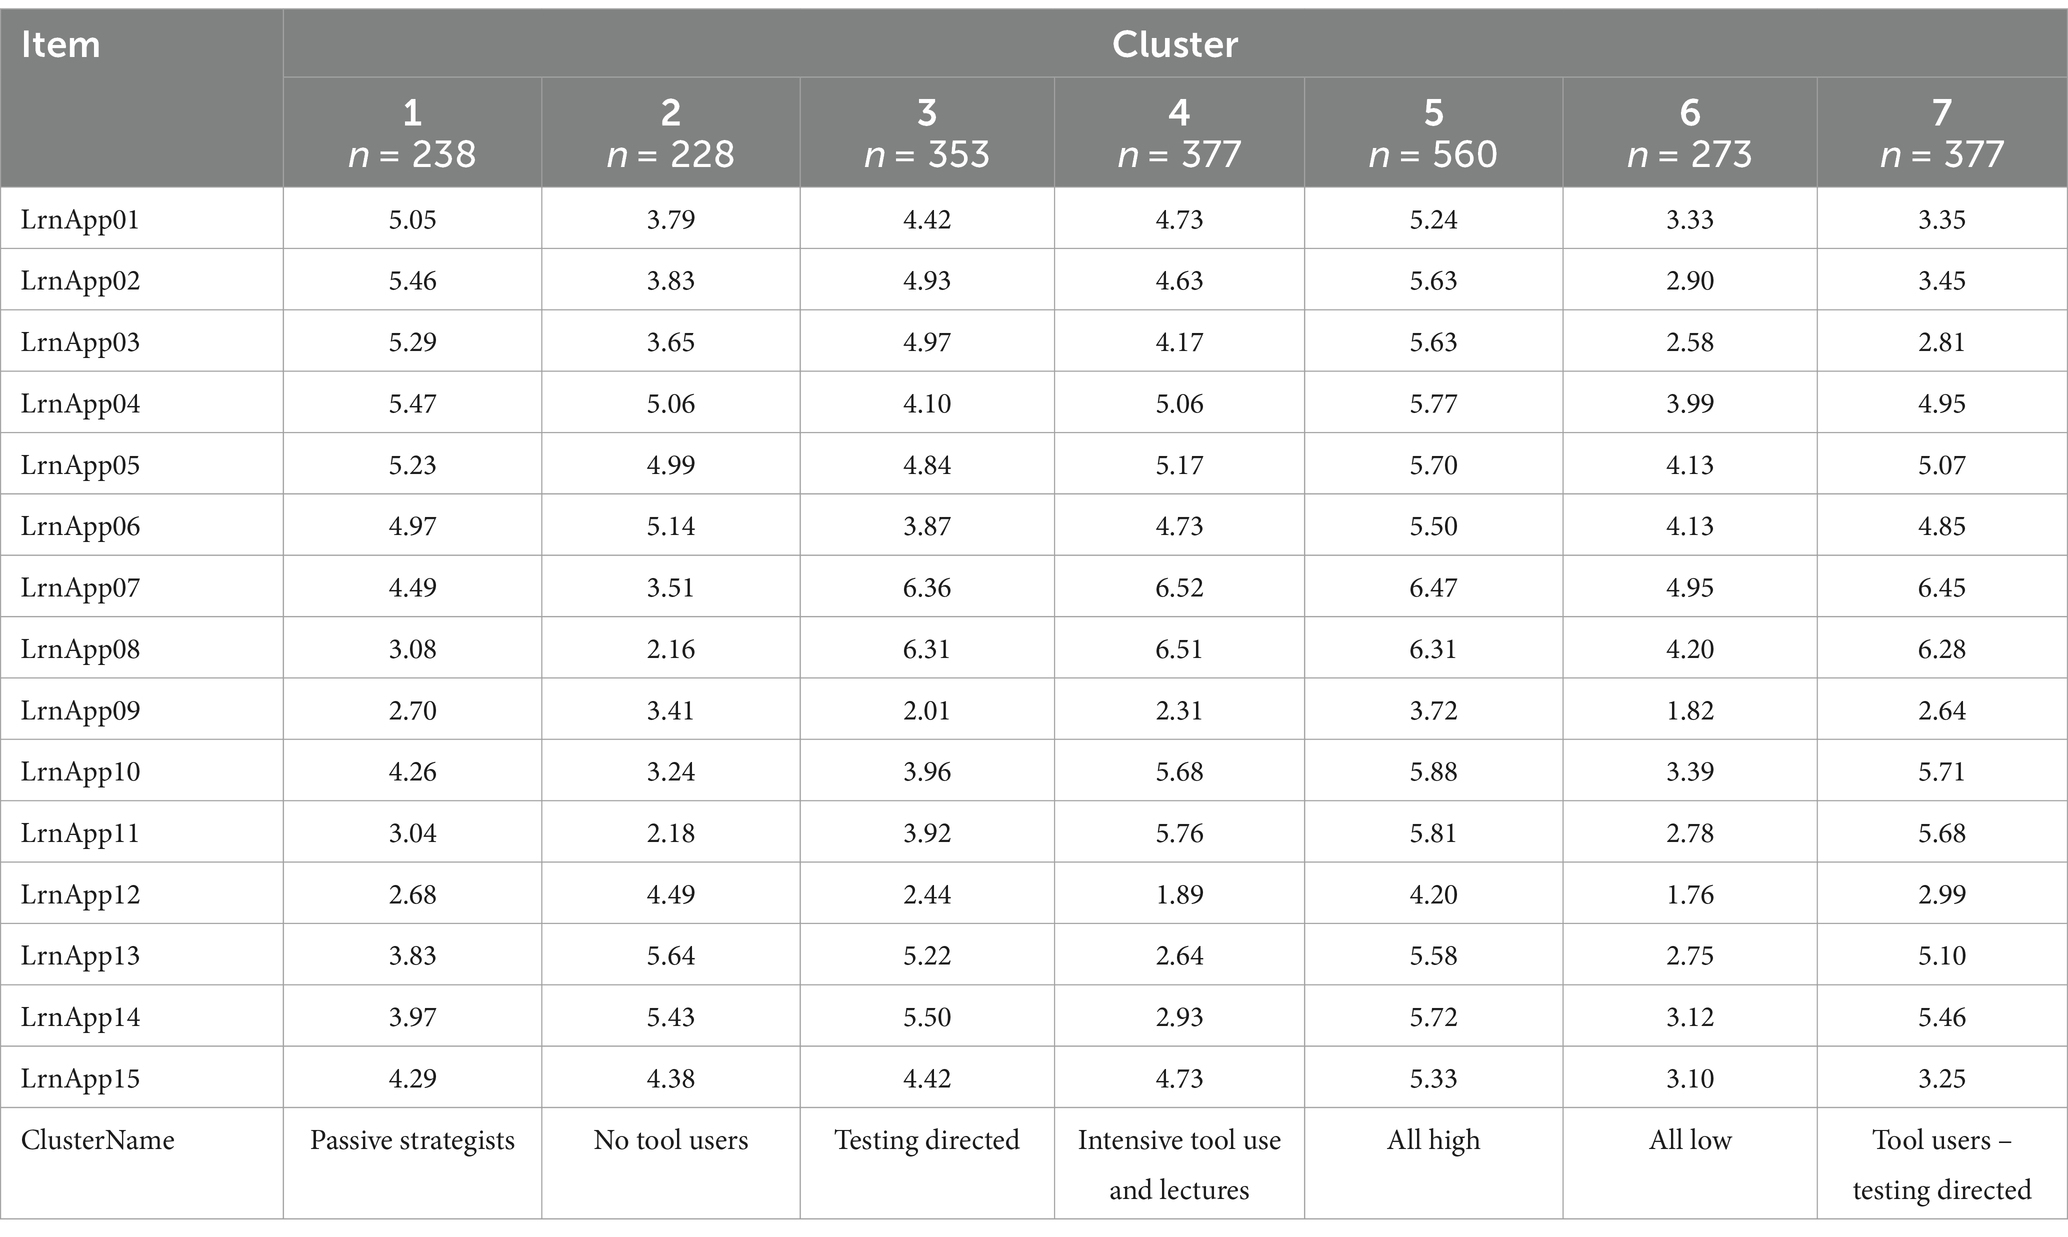
Table 2. Learning strategy cluster centers and number of students per cluster.
Cluster 5 represents students who scored overall high on all learning strategy items. The learning strategy pattern in this cluster is therefore quite uniform and less rich compared to the other clusters. Cluster 6 is in many respects the counterpart, with one exception: the low scores for nearly all learning strategies is disrupted for the seventh and eight learning strategies: testing oneself by doing exercises in the two e-tutorials. An even stronger e-tutorial oriented learning strategies profile is found amongst Cluster 4 and Cluster 7 students: they not only use the e-tutorials to test themselves (items 7, 8), but also to view worked-out examples (items 10, 11). Clusters 4 and 7 differ in that Cluster 4 students combine the use of e-tutorials with more passive learning strategies as rereading, marking and visiting lectures (items 1–3, 15; cf., Dunlosky et al., 2013), whereas Cluster 7 students have a preference for collaborative learning strategies (items 13, 14).
A focus on passive learning strategies is also visible amongst Cluster 1 students, scoring relatively high on items 1–6 and 15, relative low on other items, including the items addressing the use of both online learning platforms (items 7–8, and 10–11). This cluster can be characterized as “no tool users,” together with Cluster 2 students. However, Cluster 2 students distinguish from students in the first cluster students scoring high on items relating to strategies that involve social contact (items 12–14). Lastly, students in Cluster 3 show high scores on testing themselves, via the online learning platforms (items 7, 8) and by engaging with peers (items 13, 14); this cluster can be characterized as “tool users – testing directed.” A last observation is that testing through the e-tutorials apparently replaces other forms of testing, given the low scores in all clusters for items 9, addressing self-testing, and 12, addressing testing by someone else.
Investigating cluster differences in adaptive and maladaptive learning cognitions and behaviors from Martin’s (2007) Motivation and Engagement Wheel, we observe that all variables but one reach statistically strongly significant cluster differences (significance levels below 0.0005). The exception is the maladaptive cognition Failure Avoidance, reaching relatively low levels in all clusters. Shifting the focus from statistical significance to effect size, we observe that largest effect sizes are all amongst the behavioral aspects, rather than the cognitive aspects. Eta squared effect sizes reach values around 10% for the three adaptive behavioral engagements Persistence, Task Management, and Planning and values around 5% for the two maladaptive behavioral engagements Self-sabotage and Disengagement: see Figure 3 and Table 3.
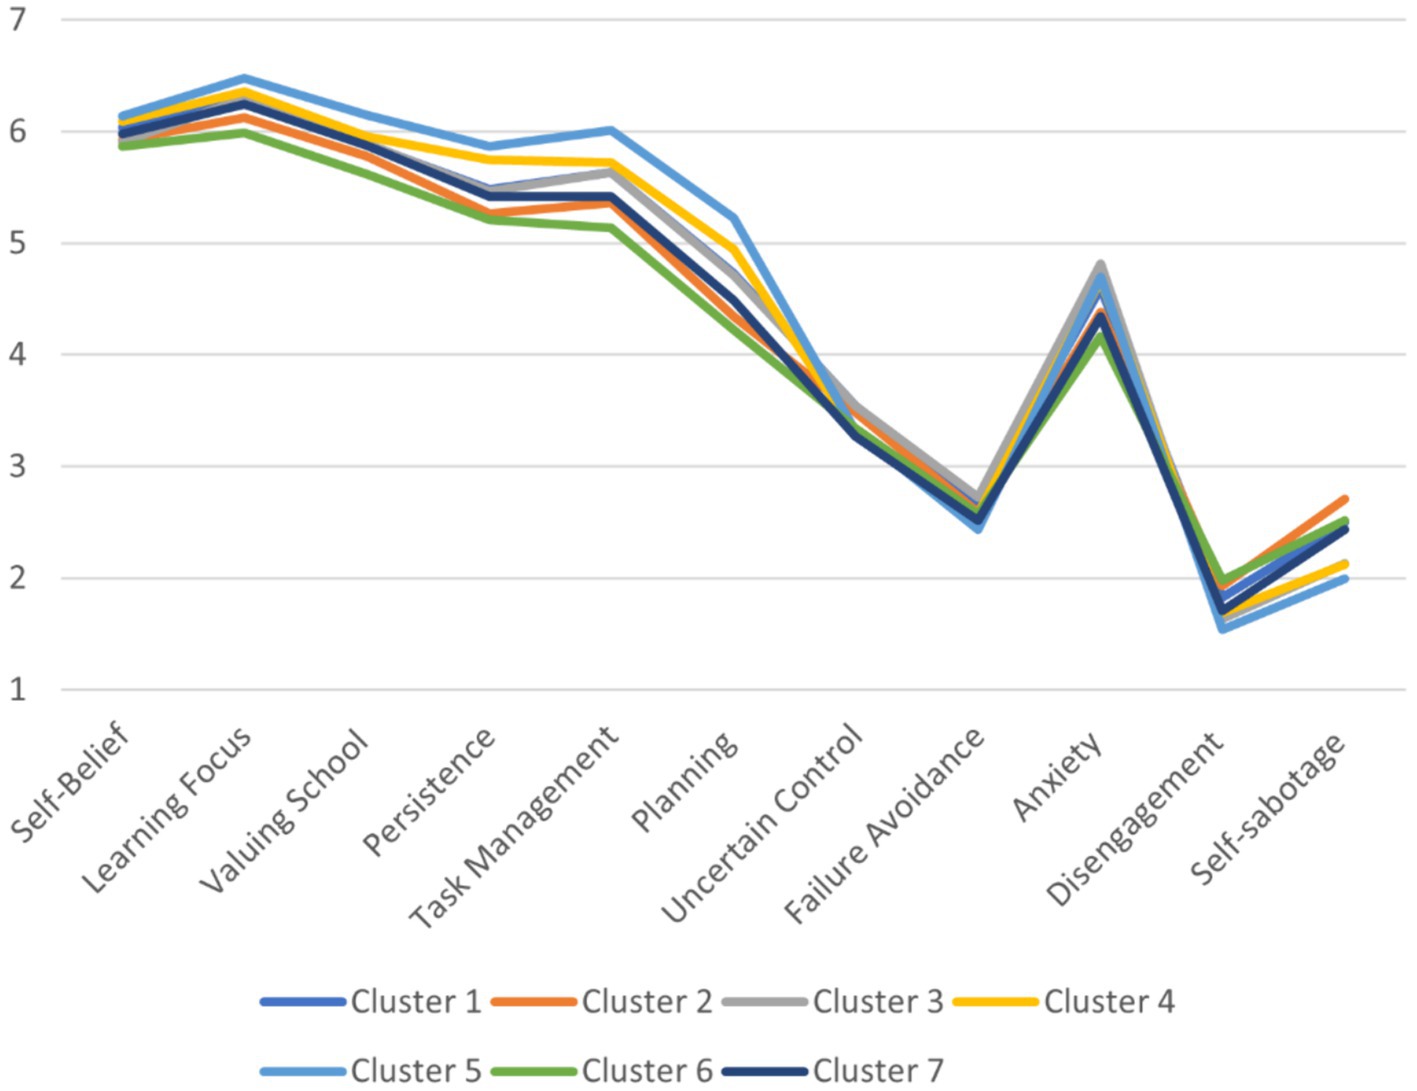
Figure 3. Motivation and engagement differences between learning strategy profiles.

Table 3. Motivation and engagement scores for learning strategy profiles.
Cluster 5 students, with their “all-high” profile of learning strategies use, appear to be the most adaptive in their engagement scores, followed by Cluster 4 students. At the other side of the spectrum, we find the “all-low” Cluster 6 students, together with the “no tool users” of Cluster 2.
As in the analysis of the motivation and engagement data, statistically strongly significant cluster differences (significance levels below 0.0005) show up in learning pattern data based on the ILS instrument (Vermunt, 1996). With again one exception: the cluster differences in the scale representing a lack in any regulation of learning, are relatively small. Looking at effect sizes, we observe that the ANOVA analysis results in somewhat larger effects than in the previous subsection, with Eta squared effect sizes beyond 15% for the processing strategy Stepwise Approach to learning and the regulation strategies Self-regulation: see Figure 4 and Table 4.
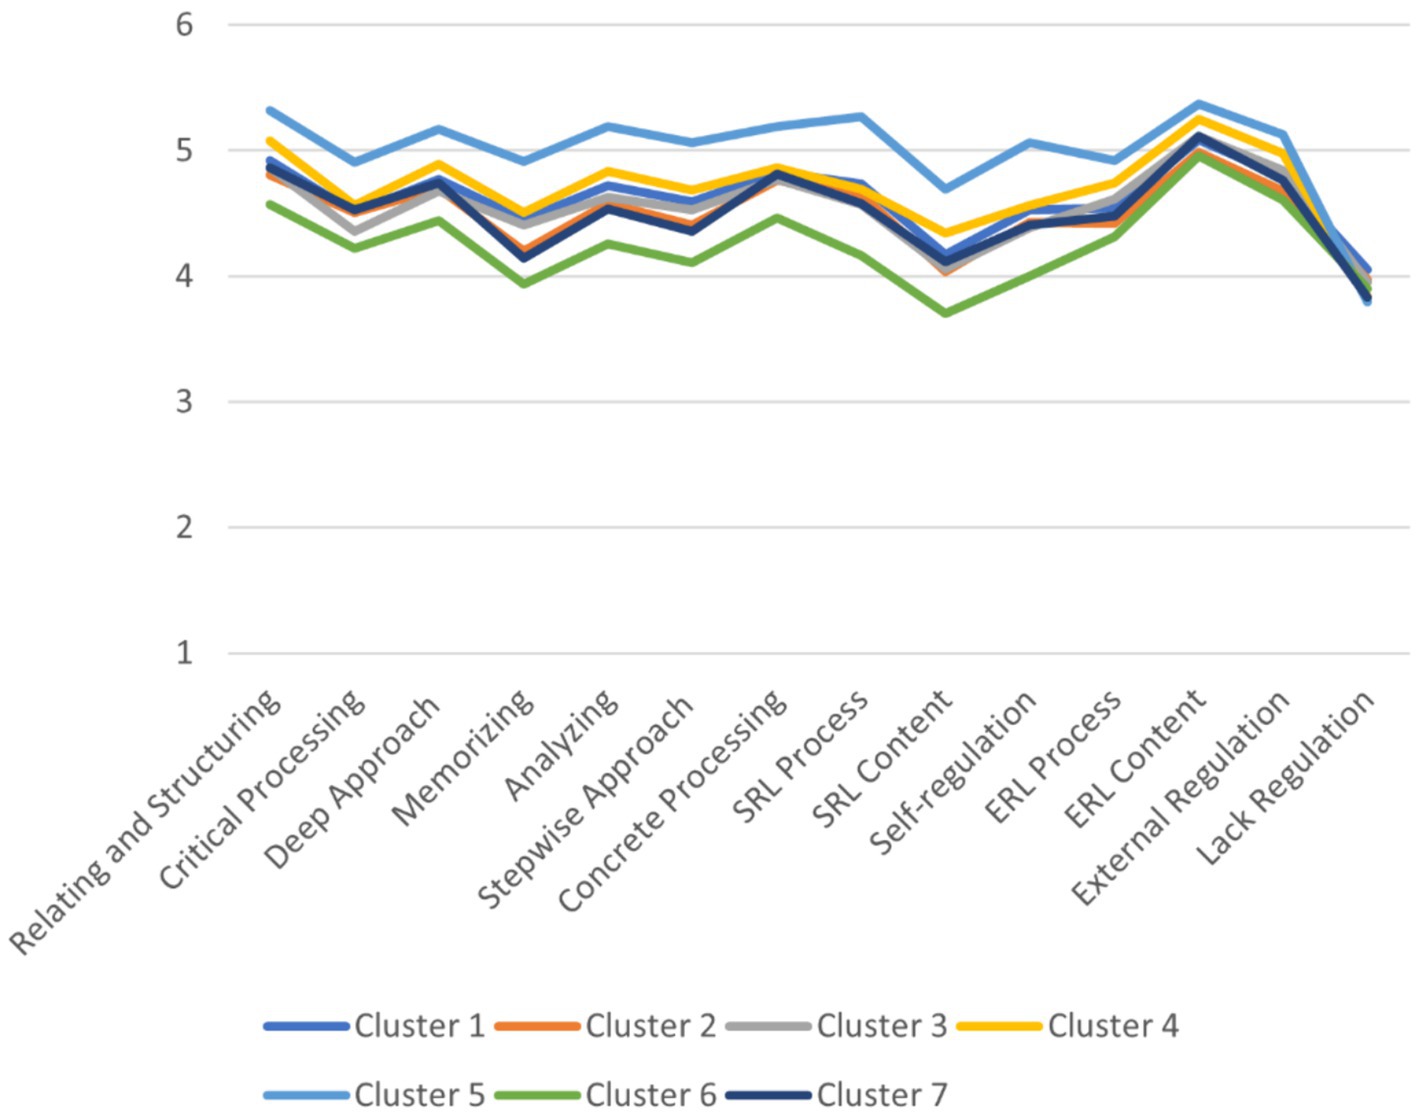
Figure 4. Learning pattern differences between learning strategy profiles.
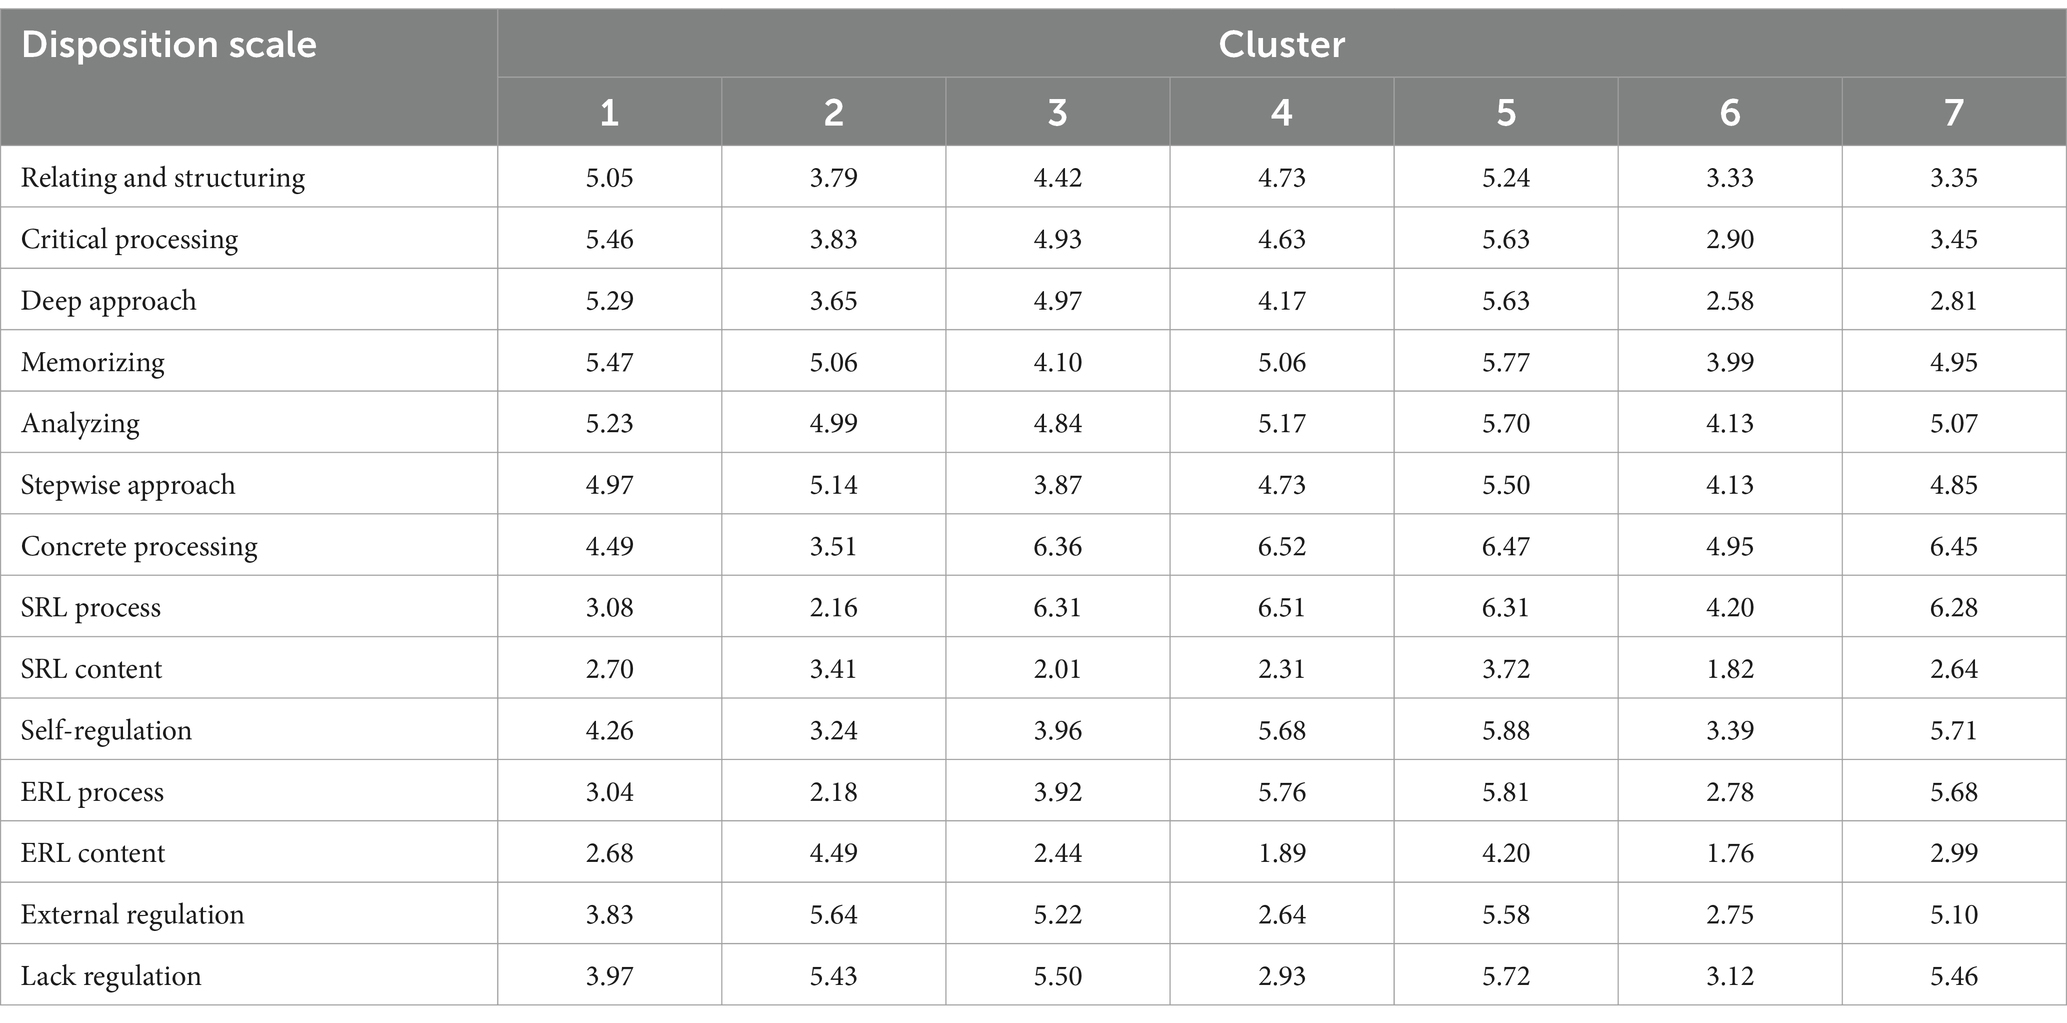
Table 4. Learning pattern scores for learning strategy profiles.
Remarkably, cluster differences are dominated by Clusters 5 and 6 deviating from the other five clusters, which follow a similar pattern. Cluster 5 students continue scoring “all-high,” contrasting the “all-low” scores of Cluster 6 students. This implies that students who self-perceive to intensively (Cluster 5) or extensively (Cluster 6) apply a wide range of learning strategies, also self-perceive to apply, intensively versus extensively, a wide range of learning patterns. The prominent aspect of this observation is that learning patterns are often supposed to be exclusive: one has a preference for a deep learning pattern, or a surface learning pattern, but not both. The patterns arising from the clusters analysis suggest a different reality: learners differ primarily in the intensity they apply processing and regulation strategies, of whatever kind, rather than in the preference for a specific processing or regulation strategy.
Repeating the purport of the previous subsection, cluster differences in Autonomous and Controlled Motivation and A-Motivation are statistically strongly significant (significance below 0.005), but the only noteworthy effect size is that of Autonomous Motivation: 15%. Cluster 5 students are characterized by the highest motivation levels, both autonomous and controlled, whereas Cluster 6 are characterized by the lowest motivation levels, both autonomous and controlled: see Figure 5 and Table 5. This observation of high and low motivation levels for both motivation facets is at odds with self-determination theory that presumes the dominance of one above the other. It may be the case that Cluster 5 students demonstrate greater adaptivity toward the type of motivation the learning activity asks for.

Figure 5. Academic motivation differences between learning strategy profiles.
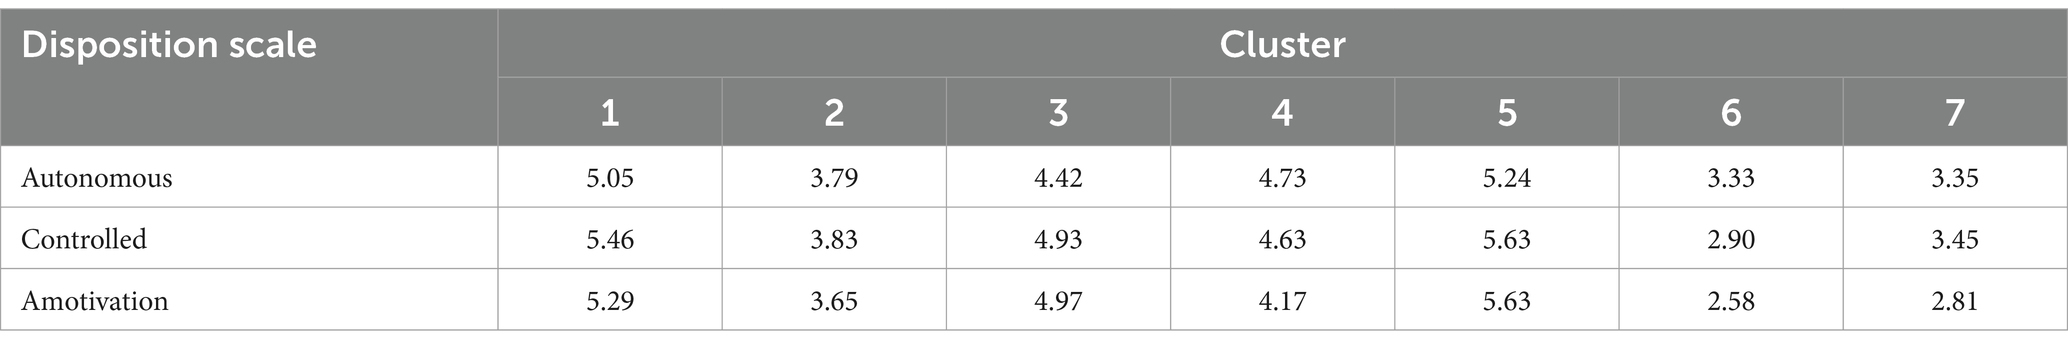
Table 5. Academic motivation scores for learning strategy profiles.
The four achievement emotions adopted in this study, positive activating, negative activating Anxiety, and negative deactivating Boredom and Hopelessness, and the direct antecedent of these emotions, Academic Control, exhibit strongly significant cluster differences, significance below 0.005. However, only Boredom and Enjoyment reach effect sizes of around 10%. Cluster 5 students exhibit again the most adaptive pattern: low on Boredom, high on Enjoyment. Cluster 6 students position at the other side of the spectrum, and are accompanied by Cluster 2 students with regard their Boredom scores: see Figure 6 and Table 6.
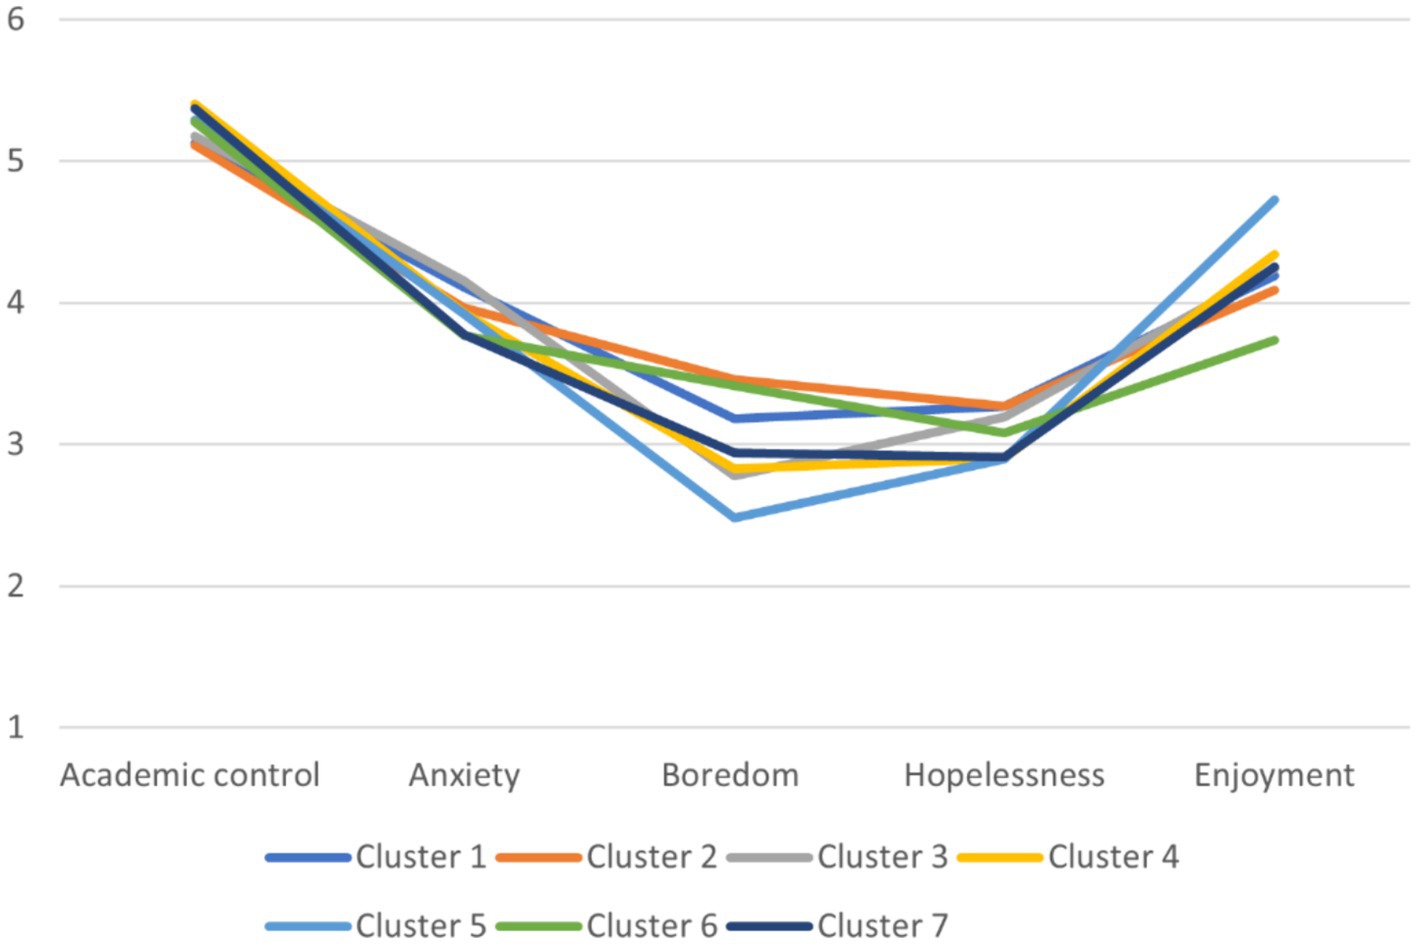
Figure 6. Achievement emotions differences between learning strategy profiles.
Table 6. Achievement emotions scores for learning strategy profiles.
The next cluster difference analysis comprises two cluster composition descriptives, Gender: Female and MathMajor, and two trace variables of outcome type: MathMastery and StatsMastery, the average weekly mastery in the two e-tutorials, expressed as proportion of successfully solved exercises. Although prior knowledge hugely differs between students of the different tracks for prior education in mathematics, those differences do not impact the preference for learning strategies. Clusters do however differ with regard to gender composition, with female students being overrepresented in Clusters 5 and 3, the two clusters representing “all-high” and “test-directed” preferences for learning strategies, and female students being underrepresented in Cluster 2.
In terms of outcome based trace variables, Cluster 3, 4, and 5 students do about equally well, and distinguish themselves especially from Cluster 2 students, scoring lowest. Effect sizes fluctuate around 8%; see Figure 7 and Table 7.
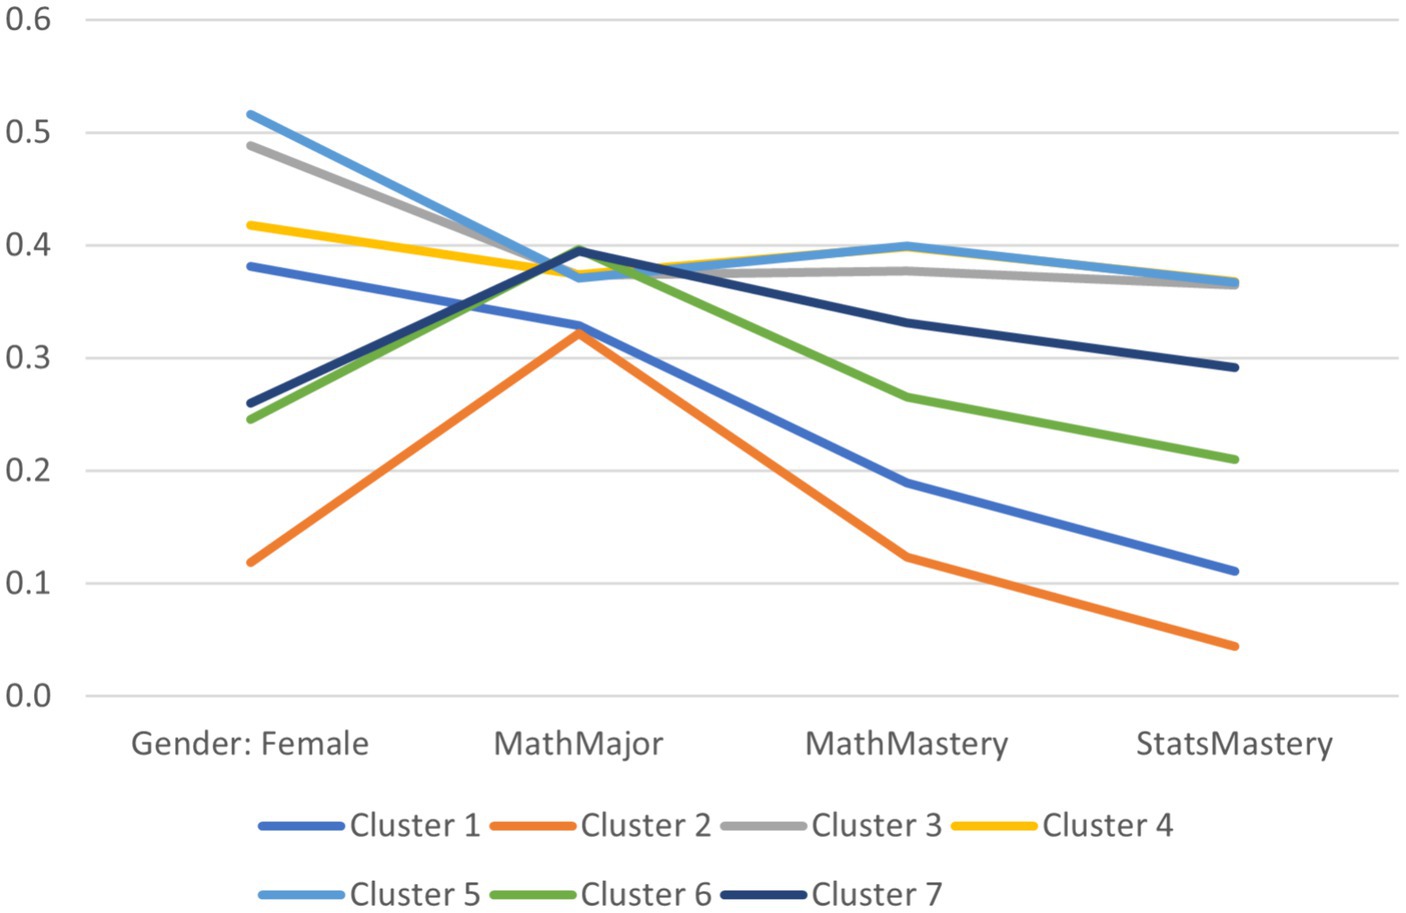
Figure 7. Composition and trace differences between learning strategy profiles.
Table 7. Composition statistics and trace scores for learning strategy profiles.
The proof of the pudding is in the eating, or in our case, in performing in the course. Course performance indicators Grade, MathExam, StatsExam and Quizzes exhibit statistically strongly significant differences having significance below 0.0005, in combination with effect sizes ranging from 5 to 15%. The largest effect size in the quiz score. The clusters with a focus on using the e-tutorials and being test-directed, Clusters 3, 4, 5, and 7, achieve highest scores in the quizzes. Hardly surprising, since quiz items are strongly linked with the content of the e-tutorials. Preparation of the two exam components allows for more diversity in learning strategies, and therefore, we find smaller effect sizes, in the order of 5%, for cluster differences in the mathematics and statistics scores in the final exam and the overall course grade. Clusters 1 and 2 are still outperformed by the other clusters. It is important to realize that 5.5 is the benchmark score for a pass, indicating that students from both “no tool use” clusters score on average below the benchmark. However, differences are modest: see Figure 8 and Table 8.
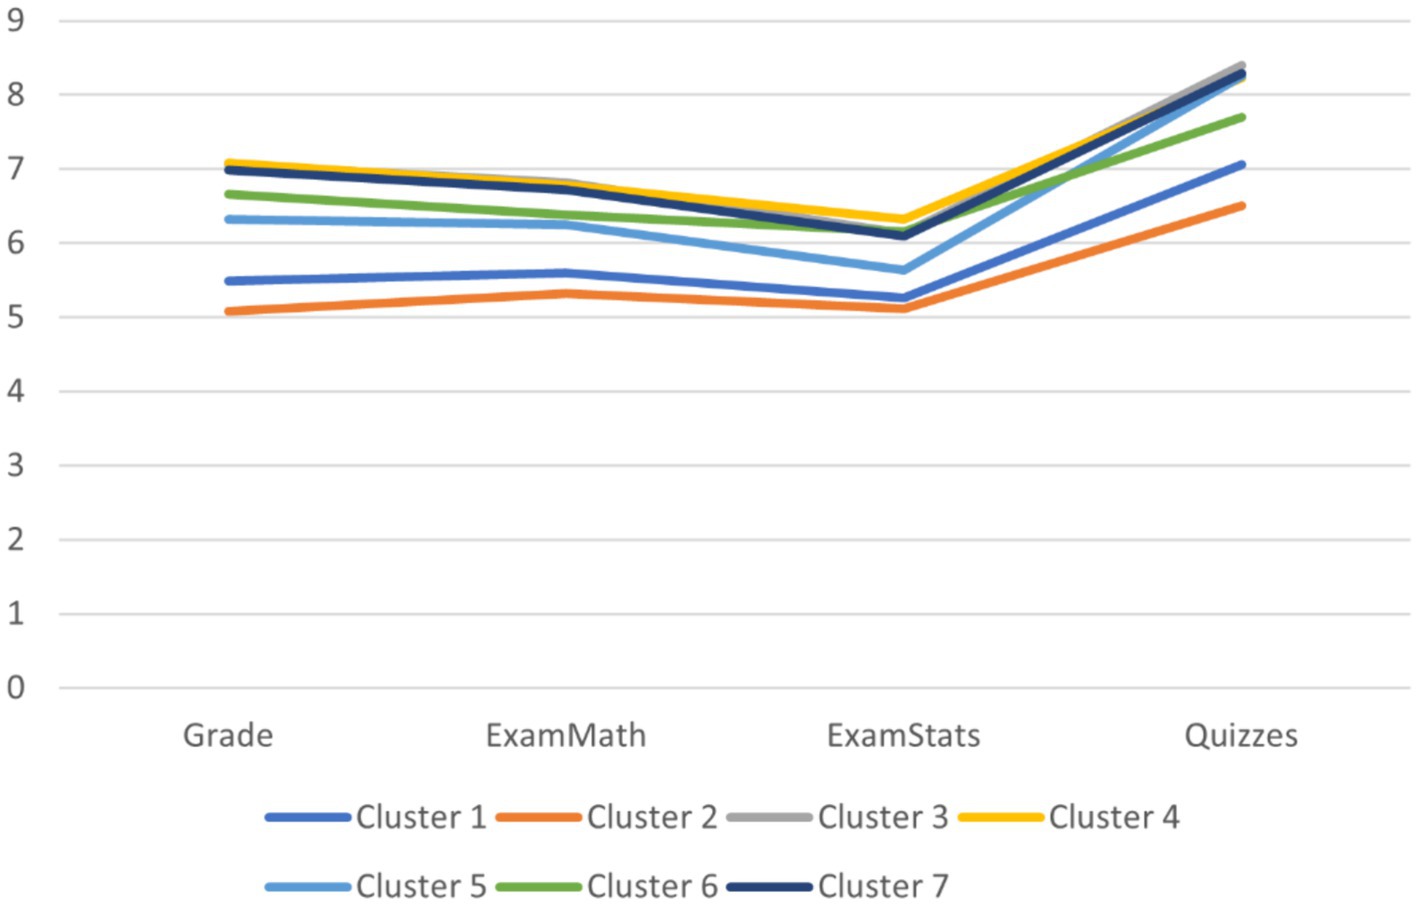
Figure 8. Course performance between learning strategy profiles.

Table 8. Course performance scores for learning strategy profiles.
The primary finding of Rovers et al.’s (2018) investigation into the efficacy of various learning strategies within a PBL-based program suggests that students who employ a diverse range of learning approaches tend to perform better. This diversity encompasses strategies that are typically considered to be suboptimal, such as surface-level learning methods. The key factor for effective learning appears to be flexibility. They conclude that: “Indeed, students reported using several strategies, some of which are traditionally regarded as “ineffective” (highlighting, rereading etc.). However, they used them in a way that fit their learning situation.” (Rovers et al., 2018, p. 1).
Our study significantly expands the utilization of diverse instructional methods. Even within a standard PBL curriculum, students have access to a wealth of learning resources. By incorporating blended learning into our study, we further enhance the array of available resources, compelling students to select from an even wider range of learning strategies. Despite these substantial changes in learning environments, it is noteworthy that Rovers et al.’s (2018) primary finding remains consistent: the most effective approach to learning, as indicated by course performance, involves integrating all available learning strategies. This means employing deep learning whenever possible but switching to surface-level approaches when necessary. Students are encouraged to utilize autonomous regulation where appropriate but should not hesitate to employ controlled regulation in challenging situations.
Examining performance as a metric of learning effectiveness, we identify two learning strategy profiles that underperform relative to others, albeit with modest differences in performance. Students in Clusters 1 and 2 exhibit below-average scores, falling even below the passing threshold on average. Cluster 1students report to predominantly utilize non-digital resources and employ surface-level learning strategies such as highlighting, underlining, and rereading. Cluster 2 students also rely on non-digital resources, focus on memorizing keywords, utilize self-explanation, and heavily depend on peer collaboration for learning. The demanding nature of our course (mathematics and statistics, which may not align with the preferences of many business and economics students) could account for the limitations associated with these two learning strategy profiles. Conversely, students who incorporate testing as a significant component of their learning strategies demonstrate above-average performance, emphasizing its importance.
Interestingly, prior mathematics education fails to account for variations in learning strategy preferences, whereas gender does. Female students are disproportionately represented among those who adopt effective learning strategies compared to their male counterparts. Students who employ effective learning strategies also stand out in learning dispositions: they exhibit higher scores in adaptive behavioral engagement, engage more intensely in various learning processing and regulation strategies compared to other profiles, display high levels of both autonomous and controlled motivation, and manifest adaptive learning motivation. Given the timing of measurements, wherein all learning dispositions except emotions were assessed at the course’s outset, weeks prior to evaluating learning strategies, we can infer that these dispositions serve as precursors to learning strategy preferences. However, this inference does not extend to learning emotions, which were assessed midway through the course, coinciding with the administration of the SLQ. Therefore, it remains uncertain whether adaptive learning emotions lead to the adoption of more adaptive learning strategies, or vice versa, or if the association is bidirectional.
Remediating challenges regarding the fostering of SRL in higher education, and namely in student-centered approaches to learning like PBL, is not easy. The current study provides additional insight into how SRL can be understood by means of DLA, and results are in line with findings from previous research that utilizing DLA helps to gain insights into learners’ motivations, attitudes, and learning strategies, enabling the creation of more personalized and effective educational interventions (Tempelaar et al., 2015, 2017, 2020a,b; Pardo et al., 2016, 2017; Persico and Steffens, 2017). For practical implementation, DLA could for example be included in the development of learning analytics dashboards to inform students as well as instructors about the learning progress (e.g., Matcha et al., 2019). When doing so, it is important to keep into account that the interpretation of results would require some level of instruction to not only enhance their understanding and implementation of SRL strategies within various learning and teaching contexts, but also how to interpret DLA data in order to do so.
The datasets presented in this study can be found via DANS, the Data Archiving and Networked Services of the NOW, the Dutch organization of scientific research. Available online at: https://dans.knaw.nl/en/.
The studies involving humans were approved by Ethical Review Committee Inner City faculties of Maastricht University. The studies were conducted in accordance with the local legislation and institutional requirements. The participants provided their written informed consent to participate in this study. Written informed consent was obtained from the individual(s) for the publication of any potentially identifiable images or data included in this article.
DT: Conceptualization, Data curation, Formal analysis, Investigation, Methodology, Project administration, Software, Supervision, Validation, Visualization, Writing – original draft, Writing – review & editing. AB: Conceptualization, Writing – original draft, Writing – review & editing. BG: Conceptualization, Writing – original draft, Writing – review & editing.
The author(s) declare that no financial support was received for the research, authorship, and/or publication of this article.
The authors declare that the research was conducted in the absence of any commercial or financial relationships that could be construed as a potential conflict of interest.
All claims expressed in this article are solely those of the authors and do not necessarily represent those of their affiliated organizations, or those of the publisher, the editors and the reviewers. Any product that may be evaluated in this article, or claim that may be made by its manufacturer, is not guaranteed or endorsed by the publisher.
Bharara, S., Sabitha, S., and Bansal, A. (2018). Application of learning analytics using clustering data Mining for Students’ disposition analysis. Educ. Inf. Technol. 23, 957–984. doi: 10.1007/s10639-017-9645-7
Buckingham Shum, S., and Deakin Crick, R. (2012). “Learning dispositions and transferable competencies: pedagogy, modelling and learning analytics” in Proceedings of the 2nd international conference on learning analytics and knowledge. eds. S. Buckingham Shum, D. Gasevic, and R. Ferguson (New York, NY, USA: ACM), 92–101.
Ciarli, T., Kenney, M., Massini, S., and Piscitello, L. (2021). Digital technologies, innovation, and skills: emerging trajectories and challenges. Res. Policy 50:104289. doi: 10.1016/j.respol.2021.104289
Díaz, E. V., Hilliger, I., Gonzalez, C., Celis, S., Pérez-Sanagustín, M., and Broisin, J. (2024). The mediating role of learning analytics: insights into student approaches to learning and academic achievement in Latin America. J. Learn. Analytics 11, 6–20. doi: 10.18608/jla.2024.8149
Dolmans, D. H. J. M., Loyens, S. M. M., Marcq, H., and Gijbels, D. (2016). Deep and surface learning in problem-based learning: a review of the literature. Advances Health Sci. Educ. 21, 1087–1112. doi: 10.1007/s10459-015-9645-6
Dunlosky, J., Rawson, K. A., Marsh, E. J., Nathan, M. J., and Willingham, D. T. (2013). Improving Students' learning with effective learning techniques: promising directions from cognitive and Educational Psychology. Psychol. Sci. Public Interest 14, 4–58. doi: 10.1177/1529100612453266
European Commission. (2020). LifeComp: The European framework for personal, social and learning to learn key competence. Publications Office of the European Union. Available from: https://publications.jrc.ec.europa.eu/repository/handle/JRC120911
Gašević, D., Dawson, S., and Siemens, G. (2015). Let’s not forget: learning analytics are about learning. TechTrends 59, 64–71. doi: 10.1007/s11528-014-0822-x
Han, F., Pardo, A., and Ellis, R. A. (2020). Students' self-report and observed learning orientations in blended university course design: how are they related to each other and to academic performance? J. Comput. Assisted Learn. 36, 969–980. doi: 10.1111/jcal.12453
Haron, H.N., Harun, H., Ali, R., Salim, K. R., and Hussain, N. H. (2014). Self-regulated learning strategies between the performing and non-performing students in statics. 2014 international conference on interactive collaborative learning (ICL), Dubai, United Arab Emirates, 802–805.
Hartwig, M. K., and Dunlosky, J. (2012). Study strategies of college students: are self-testing and scheduling related to achievement? Psychon. Bull. Rev. 19, 126–134. doi: 10.3758/s13423-011-0181-y
Herodotou, C., Rienties, B., Hlosta, M., Boroowa, A., Mangafa, C., and Zdrahal, Z. (2020). The scalable implementation of predictive learning analytics at a distance learning university: insights from a longitudinal case study. Internet High. Educ. 45:100725. doi: 10.1016/j.iheduc.2020.100725
Hmelo-Silver, C. E. (2004). Problem-based learning: what and how do students learn? Educ. Psychol. Rev. 16, 235–266. doi: 10.1023/B:EDPR.0000034022.16470.f3
Hwang, G.-J., Spikol, D., and Li, K.-C. (2018). Guest editorial: trends and research issues of learning analytics and educational big data. Educ. Technol. Soc. 21, 134–136.
Ifenthaler, D., Schumacher, C., and Kuzilek, J. (2023). Investigating students' use of self-assessments in higher education using learning analytics. J. Comput. Assist. Learn. 39, 255–268. doi: 10.1111/jcal.12744
Lawrence, J. E., and Tar, U. A. (2018). Factors that influence teachers’ adoption and integration of ICT in teaching/learning process. Educ. Media Int. 55, 79–105. doi: 10.1080/09523987.2018.1439712
Lodge, J. M., Panadero, E., Broadbent, J., and de Barba, P. G. (2018). “Supporting self-regulated learning with learning analytics” in Learning analytics in the classroom: Translating learning analytics research for teachers. eds. J. Lodge, J. Horvath, and L. Corrin. 1st ed (Milton Park, Abingdon, Oxon; New York, NY: Routledge).
Loyens, S. M. M., Gijbels, D., Coertjens, L., and Coté, D. J. (2013). Students’ approaches to learning in problem-based learning: taking into account professional behavior in the tutorial groups, self-study time, and different assessment aspects. Stud. Educ. Eval. 39, 23–32. doi: 10.1016/j.stueduc.2012.10.004
Loyens, S. M., Magda, J., and Rikers, R. M. (2008). Self-directed learning in problem-based learning and its relationships with self-regulated learning. Educ. Psychol. Rev. 20, 411–427. doi: 10.1007/s10648-008-9082-7
Malcom-Piqueux, L. (2015). Application of person-centered approaches to critical quantitative research: exploring inequities in college financing strategies. New Dir. Inst. Res. 2014, 59–73. doi: 10.1002/ir.20086
Martin, A. J. (2007). Examining a multidimensional model of student motivation and engagement using a construct validation approach. Br. J. Educ. Psychol. 77, 413–440. doi: 10.1348/000709906X118036
Matcha, W., Uzir, N. A., Gašević, D., and Pardo, A. (2019). A systematic review of empirical studies on learning analytics dashboards: a self-regulated learning perspective. IEEE Trans. Learn. Technol. 13, 226–245. doi: 10.1109/TLT.2019.2916802
Mou, T.-Y. (2023). Online learning in the time of the COVID-19 crisis: implications for the self-regulated learning of university design students. Act. Learn. High. Educ. 24, 185–205. doi: 10.1177/14697874211051226
Navarro, M., and Moreno-Ger, Á. P. (2018). Comparison of clustering algorithms for learning analytics with educational datasets. Int. J. Interact. Multimedia Artificial Intelligence 5, 9–16. doi: 10.9781/ijimai.2018.02.003
Nguyen, Q., Tempelaar, D. T., Rienties, B., and Giesbers, B. (2016). What learning analytics based prediction models tell us about feedback preferences of students. Q. Rev. Distance Educ. 17, 13–33.
Panadero, E. (2017). A review of self-regulated learning: six models and four directions for research. Front. Psychol. 8:422. doi: 10.3389/fpsyg.2017.00422
Panadero, E., and Alonso-Tapia, J. (2014). How do students self-regulate? Review of Zimmerman's cyclical model of self-regulated learning. Anales Psicol. 30, 450–462. doi: 10.6018/analesps.30.2.167221
Pardo, A., Han, F., and Ellis, R. (2016). Exploring the relation between self-regulation, online activities, and academic performance: A case study. In Proceedings of the 6th International Learning Analytics and Knowledge Conference 422–429). Edinburgh, UK
Pardo, A., Han, F., and Ellis, R. (2017). Combining university student self-regulated learning indicators and engagement with online learning events to predict academic performance. IEEE Trans. Learn. Technol. 10, 82–92. doi: 10.1109/TLT.2016.2639508
Pekrun, R. (2006). The control-value theory of achievement emotions: assumptions, corollaries, and implications for educational research and practice. Educ. Psychol. Rev. 18, 315–341. doi: 10.1007/s10648-006-9029-9
Pekrun, R., Goetz, T., Frenzel, A. C., Barchfeld, P., and Perry, R. P. (2011). Measuring emotions in students’ learning and performance: The Achievement Emotions Questionnaire (AEQ). Contemporary Educational Psychology, 36, 36–48. doi: 10.1016/j.cedpsych.2010.10.002
Perry, R. P., Hladkyj, S., Pekrun, R. H., and Pelletier, S. T. (2001). Academic control and action control in the achievement of college students: a longitudinal field study. J. Educ. Psychol. 93, 776–789. doi: 10.1037/0022-0663.93.4.776
Persico, D., and Steffens, K. (2017). “Self-regulated learning in technology enhanced learning environments” in Technology enhanced learning. eds. E. Duval, M. Sharples, and R. Sutherland (Cham, Switzerland: Springer), 115–126.
Rienties, B., Tempelaar, D., Nguyen, Q., and Littlejohn, A. (2019). Unpacking the intertemporal impact of self-regulation in a blended mathematics environment. Comput. Hum. Behav. 100, 345–357. doi: 10.1016/j.chb.2019.07.007
Rovers, S. F. E., Stalmeijer, R. E., van Merriënboer, J. J. G., Savelberg, H. H. C. M., and de Bruin, A. B. H. (2018). How and why do students use learning strategies? A mixed methods study on learning strategies and desirable difficulties with effective strategy users. Front. Psychol. 9:2501. doi: 10.3389/fpsyg.2018.02501
Schmidt, H. G., Loyens, S. M. M., van Gog, T., and Paas, F. (2007). Problem-based learning is compatible with human cognitive architecture: commentary on Kirschner, Sweller, and Clark (2006). Educ. Psychol. 42, 91–97. doi: 10.1080/00461520701263350
Siemens, G., and Gašević, D. (2012). Guest editorial - learning and knowledge analytics. Educ. Technol. Soc. 15, 1–2.
Tempelaar, D., Nguyen, Q., and Rienties, B. (2020a). “Learning analytics and the measurement of learning engagement” in Adoption of data analytics in higher education learning and teaching. eds. D. Ifenthaler and D. Gibson (Cham: Springer), 159–176.
Tempelaar, D. T., Rienties, B., and Giesbers, B. (2015). In search for the most informative data for feedback generation: learning analytics in a data-rich context. Comput. Hum. Behav. 47, 157–167. doi: 10.1016/j.chb.2014.05.038
Tempelaar, D., Rienties, B., Giesbers, B., and Nguyen, Q. (2023). Modelling temporality in person- and variable-centred approaches. J. Learn. Analytics 10, 51–67. doi: 10.18608/jla.2023.7841
Tempelaar, D. T., Rienties, B., and Nguyen, Q. (2017). Achieving actionable learning analytics using dispositions. IEEE Trans. Learn. Technol. 10, 6–16. doi: 10.1109/TLT.2017.2662679
Tempelaar, D., Rienties, B., and Nguyen, Q. (2020b). Individual differences in the preference for worked examples: lessons from an application of dispositional learning analytics. Appl. Cogn. Psychol. 34, 890–905. doi: 10.1002/acp.3652
Tempelaar, D., Rienties, B., and Nguyen, Q. (2021a). The contribution of dispositional learning analytics to precision education. Educ. Technol. Soc. 24, 109–122.
Tempelaar, D., Rienties, B., and Nguyen, Q. (2021b). Dispositional learning analytics for supporting individualized learning feedback. Front. Educ. 6:703773. doi: 10.3389/feduc.2021.703773
Timotheou, S., Miliou, O., Dimitriadis, Y., Sobrino, S. V., Giannoutsou, N., Cachia, R., et al. (2023). Impacts of digital technologies on education and factors influencing schools’ digital capacity and transformation: a literature review. Educ. Inf. Technol. 28, 6695–6726. doi: 10.1007/s10639-022-11431-8
Vallerand, R. J., Pelletier, L. G., Blais, M. R., Brière, N. M., Senécal, C., and Vallières, E. F. (1992). The academic motivation scale: a measure of intrinsic, extrinsic, and amotivation in education. Educ. Psychol. Meas. 52, 1003–1017. doi: 10.1177/0013164492052004025
Vermunt, J. D. (1996). Metacognitive, cognitive and affective aspects of learning styles and strategies: a phenomenographic analysis. High. Educ. 31, 25–50. doi: 10.1007/BF00129106
Viberg, O., Hatakka, M., Bälter, O., and Mavroudi, A. (2018). The current landscape of learning analytics in higher education. Comput. Hum. Behav. 89, 98–110. doi: 10.1016/j.chb.2018.07.027
Viberg, O., Khalil, M., and Baars, M. (2020). Self-regulated learning and learning analytics in online learning environments: a review of empirical research. In Proceedings of the Tenth International Conference on Learning Analytics & Knowledge 524–533.
Villalobos Díaz, E., Hilliger, I., Gonzalez, C., Celis, S., Pérez-Sanagustín, M., and Broisin, J. (2024). The Mediating Role of Learning Analytics: Insights into Student Approaches to Learning and Academic Achievement in Latin America. Journal of Learning Analytics, 11, 6–20.
Zamborova, K., and Klimova, B. (2023). The utilization of a reading app in business English classes in higher education. Contemp. Educ. Technol. 15:ep445. doi: 10.30935/cedtech/13364
Keywords: dispositional learning analytics, learning strategies, self-regulated learning, self-directed learning, problem-based learning, higher education
Citation: Tempelaar D, Bátori A and Giesbers B (2024) Understanding self-regulation strategies in problem-based learning through dispositional learning analytics. Front. Educ. 9:1382771. doi: 10.3389/feduc.2024.1382771
Edited by:
Malgorzata Korolkiewicz, University of South Australia, AustraliaReviewed by:
Srecko Joksimovic, University of South Australia, AustraliaCopyright © 2024 Tempelaar, Bátori and Giesbers. This is an open-access article distributed under the terms of the Creative Commons Attribution License (CC BY). The use, distribution or reproduction in other forums is permitted, provided the original author(s) and the copyright owner(s) are credited and that the original publication in this journal is cited, in accordance with accepted academic practice. No use, distribution or reproduction is permitted which does not comply with these terms.
*Correspondence: Dirk Tempelaar, RC5UZW1wZWxhYXJATWFhc3RyaWNodFVuaXZlcnNpdHkubmw=
Disclaimer: All claims expressed in this article are solely those of the authors and do not necessarily represent those of their affiliated organizations, or those of the publisher, the editors and the reviewers. Any product that may be evaluated in this article or claim that may be made by its manufacturer is not guaranteed or endorsed by the publisher.
Research integrity at Frontiers
Learn more about the work of our research integrity team to safeguard the quality of each article we publish.