- 1Center for Cognitive and Brain Sciences, Indian Institute of Technology Gandhinagar, Gandhinagar, India
- 2B.M. Institute of Mental Health, Ahmedabad, India
- 3Discipline of Electrical Engineering, Indian Institute of Technology Gandhinagar, Gandhinagar, India
Individuals with autism (ASD) often face difficulty in executing graphic tasks. This can be related to how one uses a graphic tool (e.g., pen) and plans ahead the graphic execution. Use of graphic tool can be captured using attributes, e.g., pen-tip pressure, number of pen lifts, etc. One’s ability to plan a graphic execution can be quantified using the total duration of pen lifts (i.e., air time). Though pen-and-paper-based Trail Making Test-Part A (TMT-A) can estimate planning of graphic execution, yet it cannot capture other attributes, e.g., pen-tip pressure, pen lift, etc. This can be possible if TMT-A is administered on a pressure-sensitive tablet as seen from existing studies with typically developing (TD) individuals. However, quantification of such attributes using TMT-A administered on a pressure-sensitive tablet remains unexplored for individuals with ASD. In addition, such objective measures can help to understand variations in the use of graphic tool and ability to plan graphic execution even outside the TMT-A task, e.g., while drawing shapes which is important to the development of children’s graphic skills. Here, we conducted a study with 12 pairs of TD children and those with ASD who executed TMT-A (in Phase-I) and shape drawing (in Phase-II) on a pressure-sensitive tablet. Results of our study show differences in the use of graphic tool and planning ahead the graphic execution between two participant groups in both the Phases. Such insights can offer clinical inputs that can be helpful in designing individualized intervention paradigms for children facing difficulties in graphic execution.
1 Introduction
One’s ability to successfully execute graphic activities might depend on how one uses a graphic tool (Kushki et al., 2011) and how one plans ahead the execution of the graphic task (Kushki et al., 2011). One’s use of a graphic tool can be captured in terms of pen-tip pressure used (Harris and Rarick, 1957), number of pen lifts (Paz-Villagrán et al., 2014), active time (Rosenblum et al., 2003) and pen-tip speed (Zham et al., 2017). Again, one’s ability to plan ahead before executing the graphic task can be captured in terms of air time (Rosenblum et al., 2001, 2003). Specifically, the pressure exerted using the pen-tip on a surface affects the intensity of the imprint (Sousa and Buchanan, 1999) that in turn can affect the visual representation of the graphic output (Nishitsuji et al., 2022). Further, lifting of a pen from the surface (during graphic execution) reflects discontinuity and irregularity in one’s graphic execution (Paz-Villagrán et al., 2014), which can lead to a reduction of the active time [i.e., the duration for which the pen-tip touches the surface (Rosenblum et al., 2003)] that in turn is related to the speed of the pen-tip being used (Zham et al., 2017). In fact, speed of the pen-tip (on the surface) used can affect the graphic output, since this is related to one’s ability to control the pen during the graphic execution (Grace et al., 2017). Higher air time used during graphic execution can be indicative of one having difficulty in planning ahead (Rosenblum et al., 2013) and thereby adopting a sequential preparation and execution approach in which one will formulate a short-term plan, execute it, then pause (while the pen-tip might be away from the surface) to update the plan and then carry on with the execution of the updated plan (Rosenblum et al., 2003). In contrast, shorter air time might be demonstrated by one having good ability to plan ahead the graphic execution (Rosenblum et al., 2013), since he/she will create a plan of how to complete the task before starting the task execution and in turn be able to update/modify the plan simultaneously during the graphic execution (Rosenblum et al., 2003).
Past studies have shown that one’s graphic execution ability can affect his/her academic performance thereby affecting the overall academic success (Feder and Majnemer, 2007). In addition, researchers have shown the importance of graphic execution in allowing one to express his/her thoughts and communicate with others (Kushki et al., 2011). In fact, researchers have shown that use of graphic execution as a medium to express oneself is especially helpful for children with neurodevelopmental disorders such as those with autism spectrum disorder (ASD henceforth) (Emery, 2004) who are often reported to have difficulty in social reciprocity (Mundy and Markus, 1997), and communicating with others (Mundy and Markus, 1997) when it comes to oral communication. Given the importance of graphic execution especially for individuals with ASD, past studies have investigated the differences in the quality of the graphic output among typically developing (TD henceforth) children and those with ASD (Henderson and Green, 2001; Cartmill et al., 2009). The differences in the quality of the graphic output of the two groups can be possibly attributed to the use of graphic tool (Kushki et al., 2011) and one’s ability to plan the execution of a task (Kushki et al., 2011). This necessitates quantifying one’s use of the graphic tool and ability to plan the graphic execution. Such quantification can be helpful in identifying the specific reasons leading to difficulties in one’s graphic execution thereby helping in design of individualized intervention routines to improve one’s graphic skill. For instance, if a child is demonstrating greater number of pen lifts indicating a greater discontinuity leading to greater lack of fluency in one’s graphic execution, then the caregiver/therapist/interventionist can identify the possible reason behind a graphic output having inferior quality and in turn intervene to help the child create a graphic output of superior quality. Likewise, if the graphic output created by a child has feeble intensity of imprint, then quantification on the pen-tip pressure might help an interventionist to suggest the child to increase the pen-tip pressure [while not exceeding normal limits (Horie and Shibata, 2018)] and in turn help the child to create a superior quality of graphic output. Given the importance of exploring the attributes related to the use of graphic tool and planning with regard to quantifying one’s graphic execution ability, past studies have investigated such attributes (Rosenblum et al., 2003; Grace et al., 2017). For instance, in one of the studies, (Yamaguchi et al., 2019) have investigated the pen-tip pressure exerted by a group of TD children and those with ASD during a graphic task (such as a line drawing task) and found that children with ASD exerted lesser pen-tip pressure than their TD counterparts that in turn led to poorer graphic output of children with ASD. As far as the speed of the pen-tip used during graphic execution is concerned, researchers found that children with ASD exhibited a greater pen-tip speed (quantified by a pressure-sensitive tablet) than the TD children (Grace et al., 2017) possibly leading them to deviate from their comfortable speed of graphic execution due to reduced ability to control the pen (Grace et al., 2017). Such deviation from one’s comfortable speed can adversely affect the graphic execution (Harris and Rarick, 1957). Again, with regard to investigating the attributes related to planning, past studies have reported that often children with ASD exhibit a larger time than their TD counterparts (Henderson and Green, 2001; Cartmill et al., 2009) that in turn might be due to a higher air time, thereby inferring that children with ASD have difficulty in planning ahead the graphic execution. While differences in the number of pen lifts affecting the fluency of one’s graphic execution between individuals with ASD and their age-matched TD counterparts have not been explored extensively in literature, the above-mentioned studies have shown differences in the use of pen-tip pressure, pen-tip speed and ability to plan between the two groups for text handwriting task. The Table 1 summarizes the nature of the differences in these attributes between the two groups. However, such graphic tasks involving handwriting of text requires one to be familiar with the language in which the text is to be written thereby confounding the quality of the graphic output. This emphasizes the need to quantify such attributes using language-agnostic graphic tasks such as drawing of shapes.

Table 1. Summary of nature of the differences in the use of graphic tool and planning for TD individuals and individuals with ASD (as reported in literature).
In fact, such ability to plan ahead the graphic execution can be captured using standardized tests such as the Trail Making Test-Part A (TMT-A henceforth) (Armitage, 1946). There have been studies which have shown that individuals with ASD took more time to complete the TMT-A (using the pen-and-paper based approach) than their TD counterparts (Goldstein et al., 2001) thereby indicating a reduced ability to plan ahead the execution of the task among individuals with ASD than their TD counterparts. Though insightful, none of the studies (to the best of our knowledge) have compared the use of graphic tool and the ability to plan ahead the graphic execution between group comprising of individuals with ASD and group of TD individuals for the TMT-A task while quantifying any possible differences (between the two groups) using a pressure-sensitive tablet. Again, appropriate use of graphic tool and ability to plan ahead a graphic execution being important for execution of graphic tasks (Kushki et al., 2011) such as, drawing of shapes and drawing of shapes being an important precursor in the development of one’s graphic skills (Feder and Majnemer, 2007), we wanted to investigate whether differences in the use of graphic tool and ability to plan ahead exist between a group comprising of individuals with ASD and a group of TD individuals for drawing of shapes.
Motivated by this need, in our present work, we have conducted a study in two phases (Phase-I and Phase-II) wherein the TMT-A was executed (in Phase-I) followed by drawing of shapes (in Phase-II) on a pressure-sensitive tablet. While this approach of executing TMT-A on a pressure-sensitive tablet for quantifying one’s graphic ability have been explored for TD individuals (Fellows et al., 2017) and individuals with neurodegenerative disorders (Lara-Garduno et al., 2022), this has remained as largely unexplored for children with ASD, leaving room for further exploration for this target population. This is important since children with ASD often face difficulties in graphic execution (Batchelder et al., 2009; Kushki et al., 2011; Moore et al., 2013), thereby necessitating use of a standardized test (i.e., TMT-A) executed on a pressure-sensitive tablet to identify specific attributes related to both the use of the graphic tool and one’s planning ahead the graphic execution that can help understand the underlying factors associated with such difficulties thereby providing critical inputs for individualized intervention. In addition, we wanted to explore these attributes while executing shape drawing task by children with ASD. This is because, drawing of shapes is an important step in the process of development of graphic skills in children (Feder and Majnemer, 2007). The objectives of our study were to understand whether there exists any difference in the attributes (related to the use of the graphic tool and planning) while a group of TD children and those with ASD took part in (i) executing TMT-A task and (ii) shape drawing task administered on a pressure-sensitive tablet.
The rest of the paper is organized as follows: section 2 describes the system design. The experiment and the methodology used are discussed in section 3. Section 4 discusses our findings. The conclusion along with the limitations and future scope of our work are discussed in Section 5.
2 System design
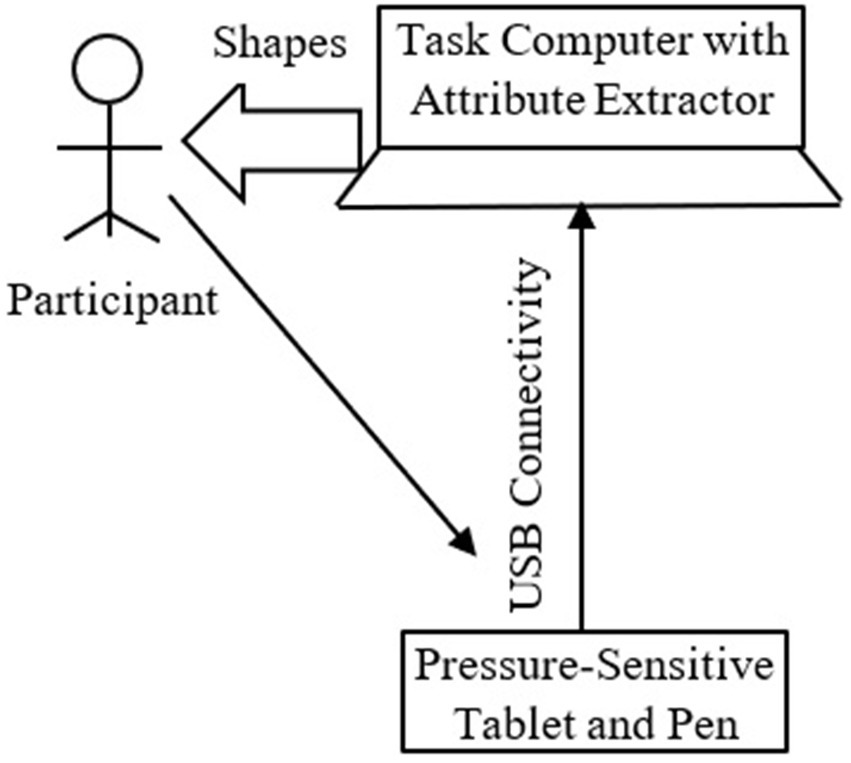
The Figure 1 shows a bird’s eye view of our system comprising of a pressure-sensitive tablet that was connected to a Task Computer via a USB cable. Our study conducted in two phases (Phase-I and Phase-II) involved Trail Making using Trail Making Test-Part A (TMT-A) (Phase-I) and drawing of shapes (Phase-II) using a pressure-sensitive tablet.
The Task Computer was used to store the data and extract the attributes related to the use of the pressure-sensitive pen (i.e., graphic tool) and planning while taking part in Phase-I and Phase-II using an Attribute Extractor.
3 Experiment and methods
3.1 Participants
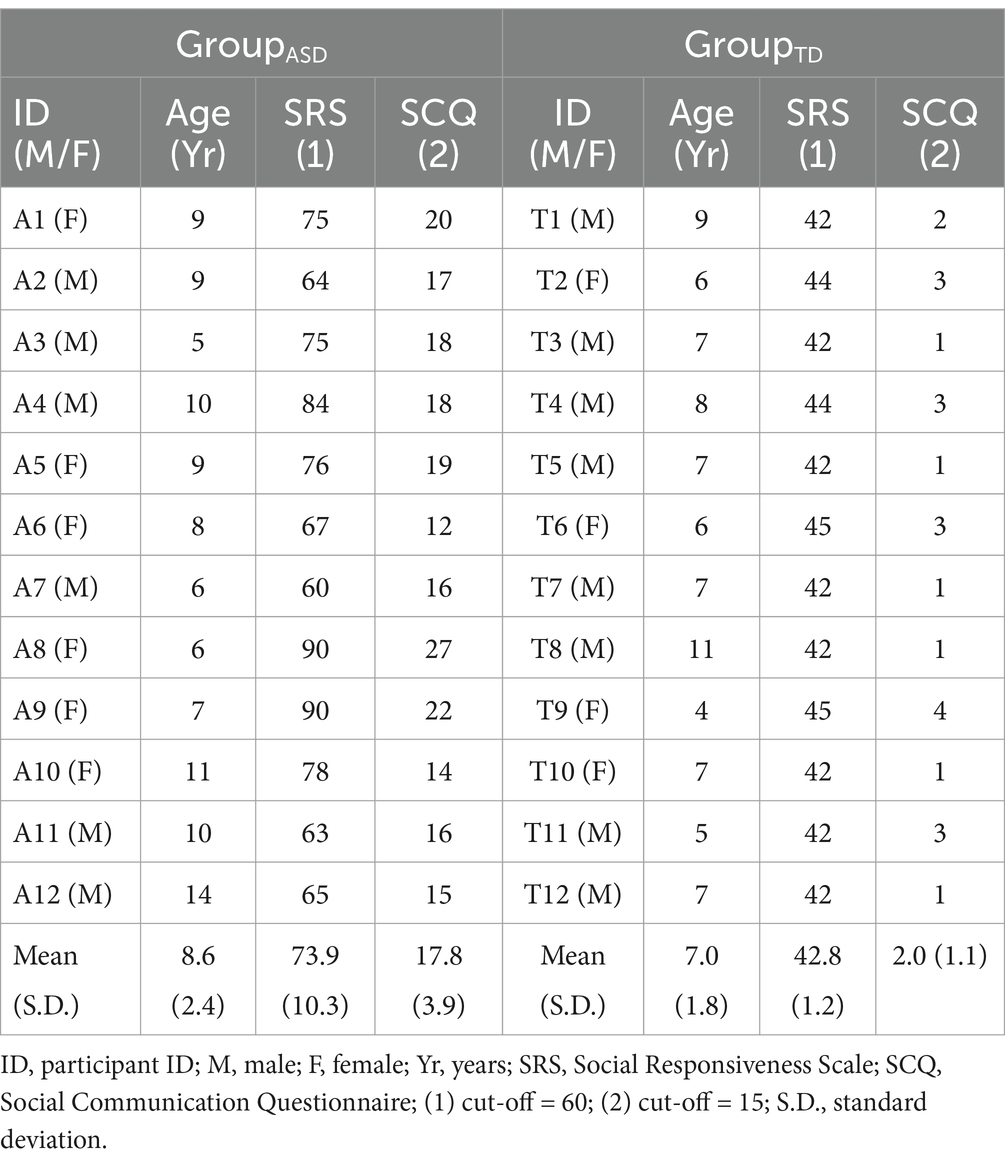
In our current study, a total of 19 participants with high functioning ASD volunteered. However, out of these 19 participants, only 12 participants (GroupASD henceforth) who were familiar with numbers [e.g., “1,” “2” and so on; that is an integral part of the Trail Making Test-Part A (Armitage, 1946)] were recruited based on the therapist’s recommendation from a nearby mental health institute. Subsequently, we recruited 12 age-matched typically developing children (GroupTD henceforth; while ensuring that the children were familiar with the number system) from nearby regular schools. Thus, in our current study, a total of 24 participants took part (Table 2).
To know the level of autism of all the participants, we administered the Social Responsiveness Scale (SRS) (Coon et al., 2010) and the Social Communication Questionnaire (SCQ) (Chandler et al., 2007). All the participants in GroupASD were above the clinical threshold for SRS and/or SCQ scores. Whereas, both SRS and SCQ measures were found to be below the clinical threshold for all the participants belonging to GroupTD. All the participants had intact visual and motor abilities.
3.2 Study design and ethics approval
Both the Phase-I and Phase-II of the study were designed as single session studies. The Phase-I of the study was designed in which the participants were expected to complete the execution of the Trail Making Test-Part A (section 3.3.1). The detailed procedure of Phase-I of the study is given in section 3.4.1. The Phase-II of the study was designed in which the participants were expected to complete the drawing of two shapes having edges (section 3.3.2). The detailed procedure for Phase-II of the study is given in section 3.4.2. The procedure for both the Phases of the study was conducted in accordance with the approval and recommendations from the Institutional Ethics Committee, IIT Gandhinagar. The Approval Number is IEC/UL/2021/001.
3.3 Tasks involved in Phase-I and Phase-II
The Phase-I involved executing the Trail Making Test-Part A (TMT-A) and the Phase-II involved drawing of shapes using the pressure-sensitive tablet.
3.3.1 Trail Making Test-Part A in Phase-I
The TMT-A consists of encircled numbers ranging from 1–25 (Armitage, 1946). The execution of the TMT-A includes making a trail by connecting the encircled numbers 1–25 in an ascending order (i.e., from 1 to 2 to 3 and so on) with lines. The time taken to make a trail while connecting the numbers is noted and this performance is often considered as an indicator of one’s ability to plan ahead (Armitage, 1946).
3.3.2 Shape drawing in Phase-II
Out of various possible shapes, in Phase-II of our study, we considered basic shapes, such as triangle, square and line presented on the monitor of the Task Computer as ShapeT and ShapeR (Figures 2A,B). The ShapeT (Figure 2A) resembled a triangle. The ShapeR (Figure 2B) consisted of two squares connected with a horizontal line. We chose these shapes, since a child’s daily academic routine often has elementary geometry in which triangles and squares are shapes that a child is often acquainted with (Santos et al., 2005).
3.4 Procedure
The procedure used in Phase-I and Phase-II (with Phase-I followed by Phase-II) is described below. Our study was conducted following the Institute ethics.
3.4.1 Procedure for Phase-I
The Phase-I of the study required a commitment of ~25 min from each participant. When the participant with his/her caregiver entered the study room, the experimenter introduced herself and interacted with the participant to make him/her comfortable. This was followed by explaining and giving a short demonstration of the TMT-A task to the participant using a sample template. Further, the experimenter mentioned that the participant was free to ask for breaks, if needed. Each participant was told that he/she was free to withdraw from the study in case of any discomfort. Then, the experimenter handed over the pressure-sensitive pen to the participant and told the participant that he/she was free to write/draw anything that they wished to on the tablet. This was done to make the participants comfortable in using the pressure-sensitive pen. This introductory session took ~15 min. Signing of the consent form by the participant’s caregiver was administered. Once the participant mentioned that he/she was ready to start the task, the tablet with the TMT-A printed on a white A4 size paper (pasted on it) was handed over to him/her. After the participant completed the TMT-A task, he/she was given a break of ~5 min. This was followed by Phase-II of the study.
3.4.2 Procedure for Phase-II
The Phase-II of the study required a commitment of ~10 min from each participant. First, the experimenter explained the task to the participant using a visual schedule which took ~5 min. Once the participant expressed that he/she has understood the task and was ready to start the task, the pressure-sensitive tablet with white A4 size paper (pasted on it) was handed over to him/her. This was followed by the shapes (ShapeT and ShapeR) being presented one at a time on the monitor of the Task Computer (section 3.3.2). A rest break of ~1 min was given between the tasks of drawing of the two shapes. The study concluded by the experimenter thanking the participant followed by conducting an informal verbal feedback session in the presence of the therapist. The feedback session was intended to understand the participant’s impression of the graphic tasks in both the phases of the study.
3.5 Experimental setup
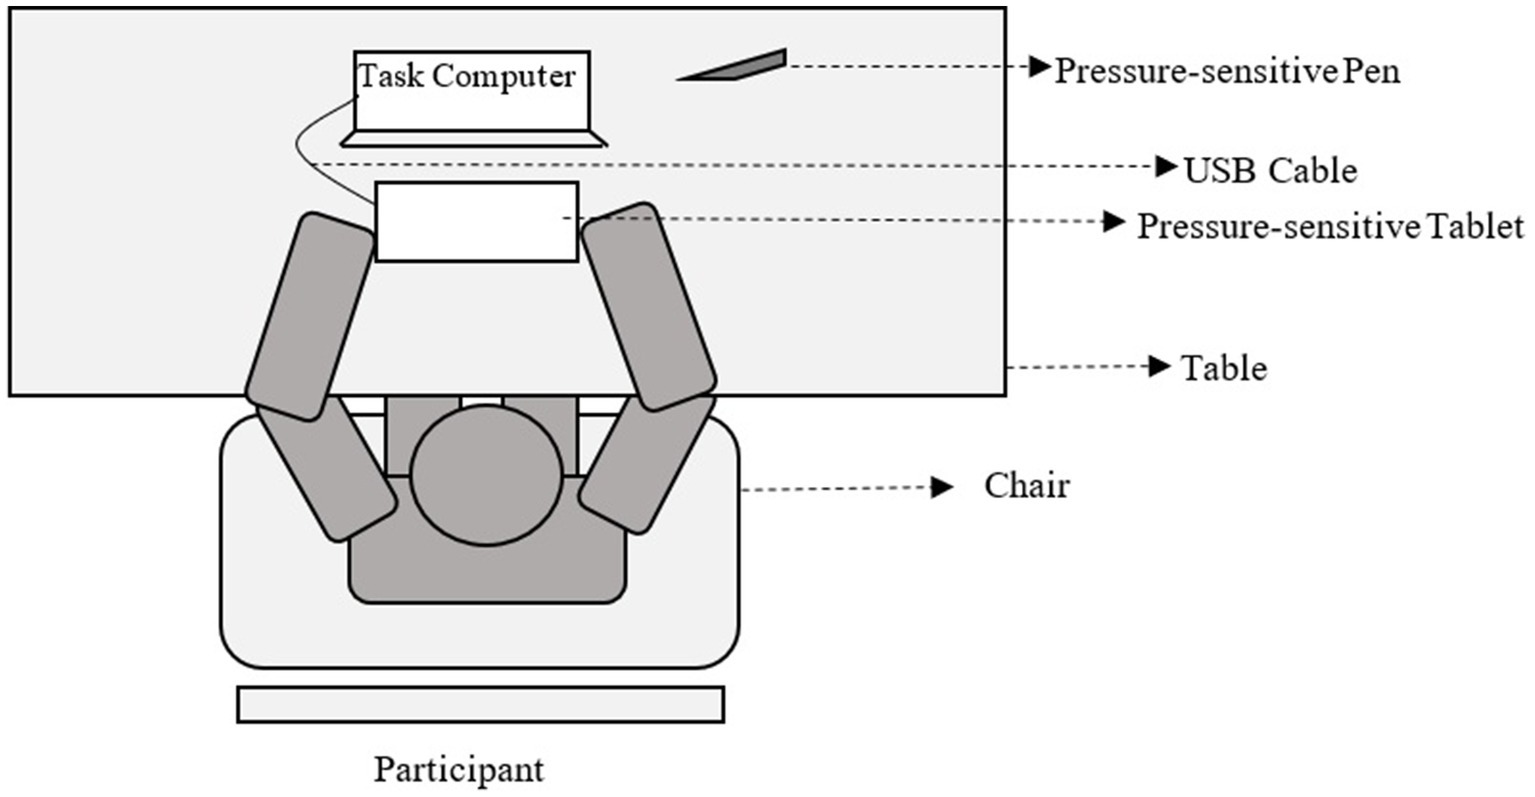
The experimental setup (Figure 3) for both the phases (Phase-I and Phase-II) of the study consisted of a (i) pressure-sensitive tablet with a pen, (ii) Task Computer, (iii) table and (iv) chair. The Task Computer placed in front of the participant at a distance of ~50 cm was used to store the data acquired from the pressure-sensitive tablet [WACOM CTL-672 (One by Wacom, Wacom, 2022)] and extract the attributes (section 3.6) related to the use of the graphic tool (i.e., the pressure-sensitive pen) and one’s planning associated with the execution of a task.
For Phase-I of the study, the template of the Trail Making Test-Part A (TMT-A) (Armitage, 1946) was printed on a white A4 size paper and pasted on the pressure-sensitive tablet. For Phase-II of the study, the Task Computer was used to present two shapes (i.e., ShapeT and ShapeR; described in section 3.3.2) and store the digital copies of the shapes being drawn by a participant. In Phase-II, a white A4 size paper was pasted on the pressure-sensitive tablet for drawing of the two shapes. The experimental room was uniformly lit.
3.6 Attribute extraction
While one took part in Phase-I and Phase-II of the study, we investigated the attributes related to the use of the graphic tool and one’s planning involved while executing the graphic tasks. For this, we acquired the data on the 2D (x, y) coordinates of the pressure-sensitive tablet touched by one’s graphic tool (i.e., the pen-tip) and the graphic pressure (on a 0 to 100 scale; where 0 indicated that the pen-tip was in air and 100 indicated the maximum permissible pen-tip pressure while the pen-tip was in contact with the tablet surface) along with time-stamping for subsequent analysis. The stored data was processed to extract four attributes, namely active time (Rosenblum et al., 2003), mean speed of pen-tip (Zham et al., 2017), number of pen lifts (Paz-Villagrán et al., 2014), and weighted graphic pressure (Zham et al., 2017) related to the use of the graphic tool and one attribute, namely air time (Rosenblum et al., 2003) related to one’s planning (Rosenblum et al., 2013).
3.6.1 Extraction of active time
We chose to include the active time [i.e., the amount of time one’s pen-tip is in contact with the surface during the execution of a graphic task; (Rosenblum et al., 2003)] that can be related to one’s execution of the graphic movement (Gerth et al., 2016). Lower active time might infer higher speed of the pen-tip (during a graphic task) which if goes beyond one’s comfortable speed limit can lead to a deteriorated graphic output (Harris and Rarick, 1957). The active time ( ) was computed using Eq. 1.
where, j = instance when the pen-tip is in contact with the surface and Δt = duration for which the pen-tip touches the surface.
The extracted for each participant was normalized across the participant groups (i.e., GroupASD and GroupTD) using Max Normalization technique (Liu, 2011) to compute .
3.6.2 Extraction of mean speed of pen-tip
We chose to include mean speed of pen-tip (Zham et al., 2017), since it can be related to one’s execution and control of the pen movement (Grace et al., 2017) that can affect the representation of the graphic output. The mean speed of pen-tip (MeanSpeed) was computed using Eq. 2.
where, N = total number of data points and (xn, yn) and (xn + 1, yn + 1) are the 2D (x, y) coordinates of the nth and (n + 1)th data point, respectively. The factor “133” was the sampling rate of the tablet.
The MeanSpeed extracted for each participant was normalized across the participant groups (i.e., GroupASD and GroupTD) using Max Normalization technique (Liu, 2011) to compute .
3.6.3 Extraction of number of pen lifts
We chose to include number of pen lifts as one of the attributes related to the use of the graphic tool, since a pen lift can reflect discontinuity in graphic execution (Paz-Villagrán et al., 2014). Each pen lift was identified using the 0 normalized value of the pen-tip pressure. The last pen lift was excluded from this count as this indicated lifting of the pen due to the completion of the task. The Number of Pen Lifts extracted for each participant was normalized across the participant groups (i.e., GroupASD and GroupTD) using Max Normalization technique (Liu, 2011) to compute .
3.6.4 Extraction of weighted graphic pressure
We chose to include graphic pressure as one of the attributes related to the use of the graphic tool, since the amount of pressure exerted by one using the pen tip (during a graphic task) affects the intensity of the imprint. Again, since the imprints (i.e., the trail or the shapes) created by the participants (during Phase-I and Phase-II) could vary in terms of the length of the lines drawn, we normalized the weighted graphic pressure for the length of the lines drawn using Eq. 3.
where, GPrw = weighted graphic pressure, Di = length of the ith segment and MPr i = mean pen-tip pressure of the ith segment.
Further, the GPr w extracted for each participant was normalized across the participant groups (i.e., GroupASD and GroupTD) using Max Normalization technique (Liu, 2011) to compute .
3.6.5 Extraction of air time
We chose to include the air time as one of the attributes related to one’s planning since the amount of time one’s pen-tip is not in contact with a surface during the execution of a graphic task might reflect the amount of time spent in planning the execution of the task (Rosenblum et al., 2013). A lower air time might reflect nearly simultaneous preparation and execution of the graphic movement (Rosenblum et al., 2003) possibly indicating improved ability to plan ahead the graphic execution. The air time was computed using Eq. 4.
where, k = instances when the pen-tip is away from the surface and Δt = duration for which the pen-tip is in air.
The TAir extracted for each participant was normalized across the participant groups (i.e., GroupASD and GroupTD) using Max Normalization technique (Liu, 2011) to compute .
3.7 Statistical techniques used
While we extracted the attributes related to the use of the graphic tool as well as those related to planning for both Phase-I (section 3.3.1) and Phase-II (section 3.3.2) of the study, we wanted to investigate the statistical relevance of each of these extracted attributes. For the same, we first normalized the extracted attributes using Max Normalization (Liu, 2011) technique. Subsequently, we carried out Shapiro–Wilk test (Hanusz et al., 2016) of normality on each of the extracted attributes to test the assumption of normality for the extracted data. The results of the Shapiro–Wilk test of normality indicated that the attributes were not normally distributed thereby violating the assumption of normality. Also, we were interested in carrying out comparative group analysis between two independent participant groups, thereby taking into account the independency assumption. Thus, we used the non-parametric test such as the Mann Whitney U test (McKnight and Najab, 2010) to compare the attributes between the two independent participant groups. Further, we computed the Cohen’s d (Becker, 2000) to get an understanding of the effect size. In addition, to investigate the sample power we used the G*Power tool (Faul et al., 2009) for post-hoc estimation of sample strength.
4 Results and discussion
Given the importance of having the ability to plan ahead a graphic execution coupled with meticulous use of the graphic tool during the execution of a graphic task (Kushki et al., 2011), we wanted to understand whether there exists any difference in the attributes related to the use of the graphic tool and those related to planning associated with the execution of the Trail Making Test-Part A (TMT-A) on a pressure-sensitive tablet among GroupASD and GroupTD. In addition, we wanted to understand whether the two groups of participants differ in terms of the attributes related to the use of the graphic tool as well as those related to planning during shape drawing tasks administered on a pressure-sensitive tablet.
4.1 Comparative analysis of attributes related to the use of graphic tool and planning among GroupASD and GroupTD for Phase-I (i.e., TMT-A)
For understanding whether the attributes related to the use of the graphic tool and those related to planning associated with the execution of the TMT-A are differentiated among GroupASD and GroupTD, we carried out a comparative analysis of the extracted attributes (section 3.6) associated with one’s trail making performance administered on a pressure-sensitive tablet.
4.1.1 Comparative analysis of attributes related to the use of the graphic tool
With regard to the attributes related to the use of the graphic tool, we analysed active time, mean speed of pen-tip, number of pen lifts, and the weighted graphic pressure (section 3.6.1 to section 3.6.4) while the participants executed the TMT-A task.
4.1.1.1 Comparative analysis of normalized active time
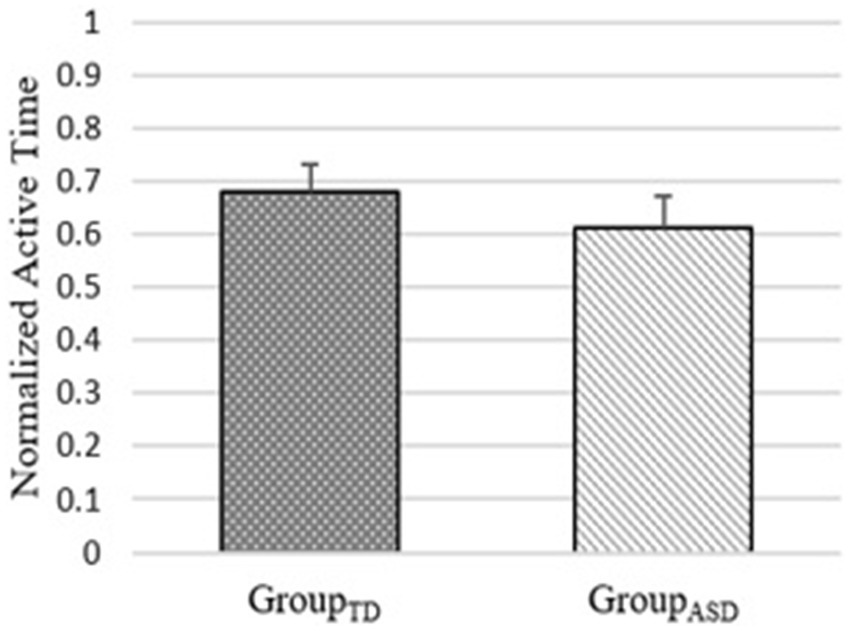
Since the active time ( ; section 3.6.1) i.e., the amount of time the tip of a graphic tool remains in contact with the drawing surface (during the graphic execution) can be related to one’s execution of the graphic movement (Gerth et al., 2016), we performed a comparative analysis of the normalized active time during the execution of the TMT-A for GroupASD and GroupTD. It can be seen from Figure 4 that both the GroupASD and GroupTD demonstrated nearly similar active time with the difference being not statistically significant inferring nearly similar time spent in executing the TMT-A task.
4.1.1.2 Comparative analysis of normalized mean speed of pen-tip
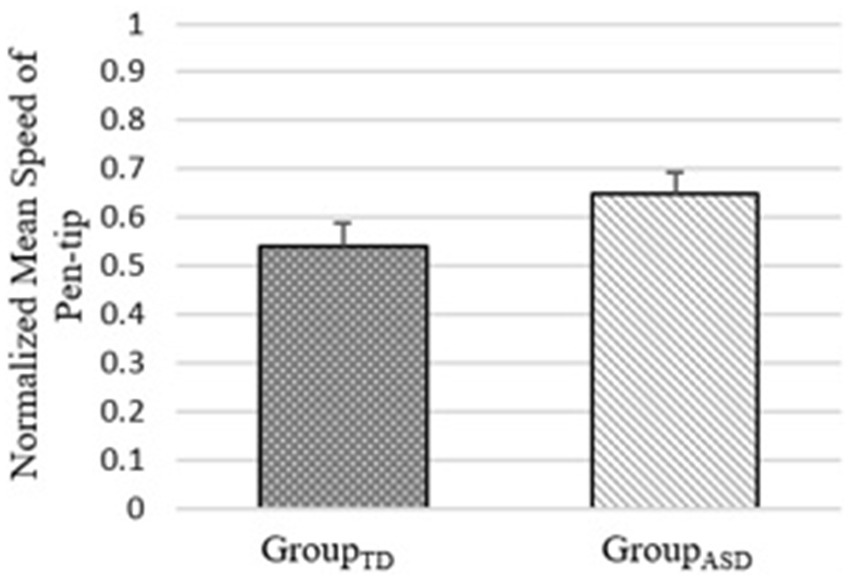
Since the speed of one’s pen-tip (Zham et al., 2017) on the writing surface during the graphic execution can affect the graphic output (Grace et al., 2017), we carried out a comparative group analysis of the normalized mean speed of pen-tip (MeanSpeed_Norm; section 3.6.2) used by the two participant groups during the execution of the TMT-A task. It can be seen from Figure 5 that GroupASD demonstrated nearly similar (not statistically different) mean speed of pen-tip as that of GroupTD inferring similar control on using the pen by both the groups.
4.1.1.3 Comparative analysis of normalized number of pen lifts
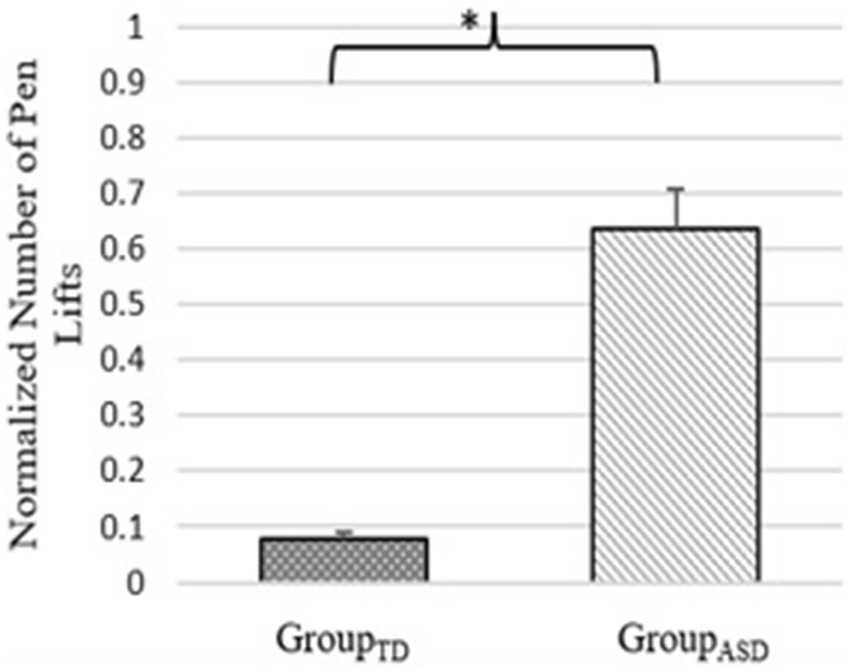
Since the number of pen lifts can be an indicator to the discontinuities in the graphic execution (Paz-Villagrán et al., 2014), we wanted to understand whether there existed any difference in the number of pen lifts (Number of Pen Lifts_Norm; section 3.6.3) exhibited by both the groups during the execution of the TMT-A task.
It can be seen from Figure 6 that GroupTD demonstrated significantly (p-value <0.05, Cohen’s d = 3.10) lower (Δ% = ~88%) number of pen lifts (normalized) than GroupASD.
4.1.1.4 Comparative analysis of normalized weighted graphic pressure
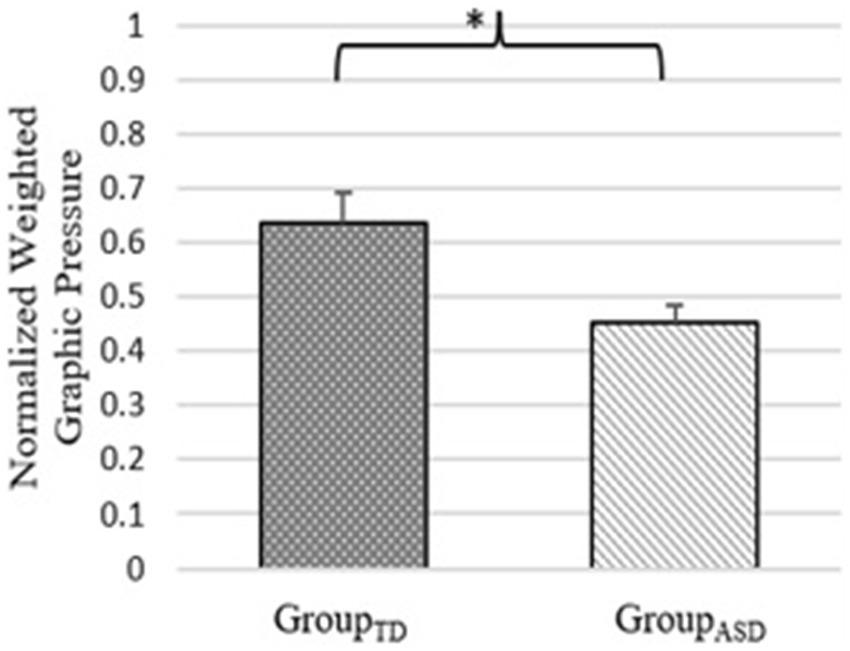
Since the amount of pressure exerted by one’s pen-tip on a surface can affect the intensity of the imprint, i.e., the graphic output (Sousa and Buchanan, 1999), we performed a comparative group analysis of the normalized weighted graphic pressure ( for the TMT-A task; section 3.6.4) used by GroupTD and GroupASD.
The Figure 7 shows that the GroupTD exerted statistically (p-value <0.05, Cohen’s d = 1.17) higher (Δ% = ~40%) normalized weighted graphic pressure than GroupASD.
4.1.2 Comparative analysis of attributes related to planning
With regard to one’s planning ahead (in executing a task), we analysed air time that has been reported to be associated with one’s graphic skill (Rosenblum et al., 2001, 2013 and explained in section 3.6.5) while the participants executed the TMT-A task.
4.1.2.1 Comparative analysis of normalized air time
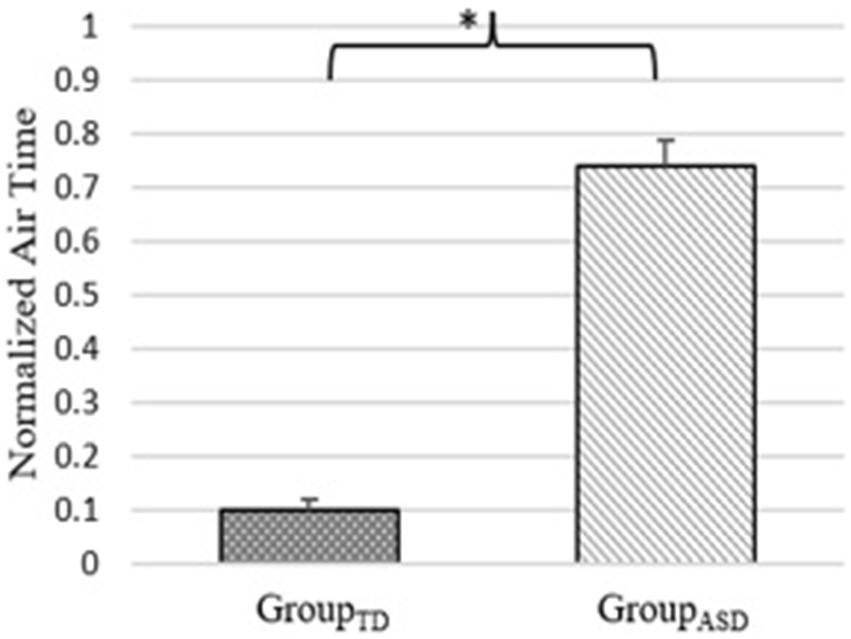
Having seen that the number of pen lifts of GroupTD was lesser than the GroupASD (Figure 6), we wanted to explore the cumulative sum of the time interval between the successive pen lifts i.e., the air time. Also, given that the air time during the execution of a graphic task might reflect the time spent in planning the graphic execution (Rosenblum et al., 2013) along with individuals with ASD characterized by deficits in planning ahead a task (Goldstein et al., 2001; Booth et al., 2003), we carried out a comparative analysis of the air time (TAir_Norm) taken while completing the TMT-A task (section 3.6.5) among both the participant groups.
It can be seen from Figure 8 that GroupTD exhibited statistically (p-value <0.05, Cohen’s d = 4.89) lower (Δ% = ~87%) normalized air time than the GroupASD.
A lower air time might indicate one’s ability to plan and execute a graphic movement simultaneously (Rosenblum et al., 2003). In contrast, a higher air time might reflect sequential preparation and execution of the graphic movement associated with discontinuities [Paz-Villagrán et al., 2014; represented by increased number of pen lifts of GroupASD (Figure 6)] that in turn can be associated with their reduced ability to plan ahead the graphic execution (Rosenblum et al., 2003).
4.2 Comparative analysis of attributes related to the use of graphic tool between GroupTD and GroupASD for Phase-II (i.e., shape drawing)
With appropriate use of the graphic tool and ability to plan ahead a graphic execution being important for execution of graphic tasks (Kushki et al., 2011) such as, drawing of shapes and statistical differences in the number of pen lifts and the weighted graphic pressure (related to the use of graphic tool) and air time (related to the planning) existing between the GroupASD and GroupTD (as evident from Phase-I of our study; section 4.1), we wanted to investigate whether such differences also existed between the GroupASD and GroupTD for shape drawing. For this, we carried out comparative group analysis of three of the attributes, namely number of pen lifts, weighted graphic pressure and air time while GroupASD and GroupTD drew shapes i.e., ShapeT and ShapeR (section 3.3.2) during Phase-II of our study.
4.2.1 Comparative analysis of normalized number of pen lifts
As can be seen from Figure 9, irrespective of ShapeT and ShapeR, the GroupTD showed lesser number of pen lifts than the GroupASD. In fact, similar to our observations on the difference in the number of pen lifts between the GroupASD and GroupTD during the execution of the TMT-A task (section 4.1.1), in the case of shape drawing, the GroupTD demonstrated significantly (p-value <0.05, Cohen’s d = 0.68 and 1.11, respectively for ShapeT and ShapeR) lower (Δ% = ~46% and ~75%, respectively for ShapeT and ShapeR) number of pen lifts (Number of Pen Lifts_Norm; section 3.6.3) than GroupASD thereby indicating lesser discontinuity during drawing of both the shapes.
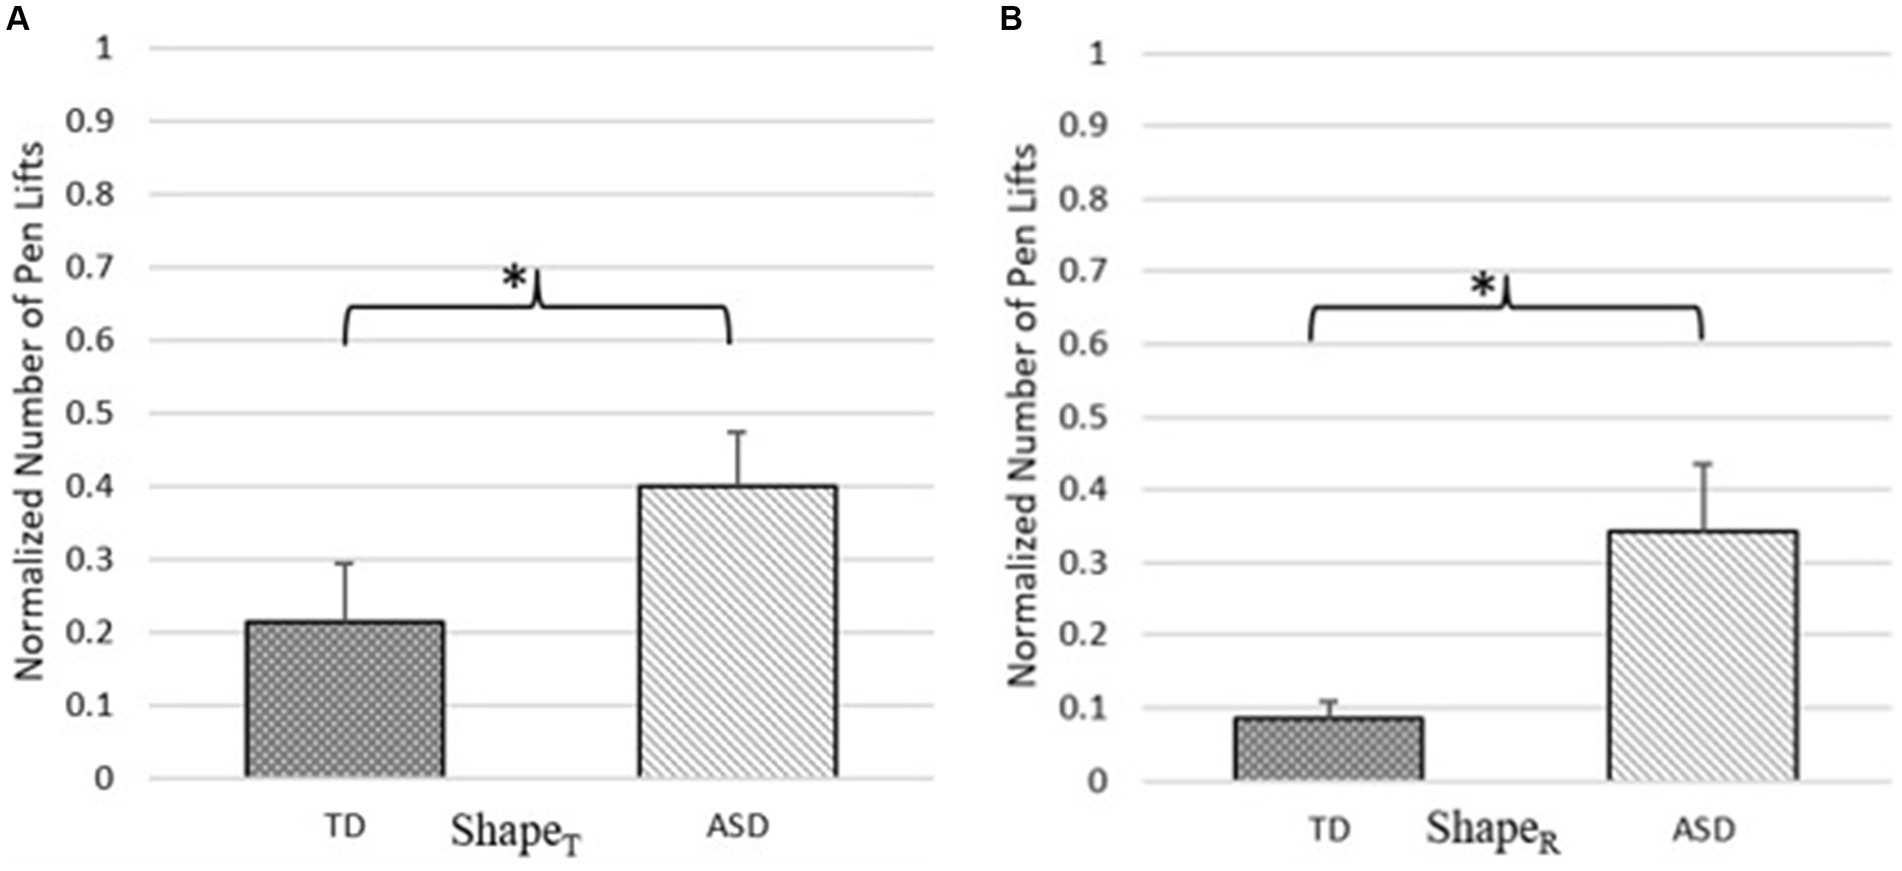
Figure 9. Comparative analysis of normalized number of pen lifts for (A) ShapeT and (B) ShapeR. *Indicates p-value <0.05.
4.2.2 Comparative analysis of normalized weighted graphic pressure
The Figure 10 shows the comparative group analysis of normalized weighted graphic pressure ( ; section 3.6.4) for GroupTD and GroupASD.
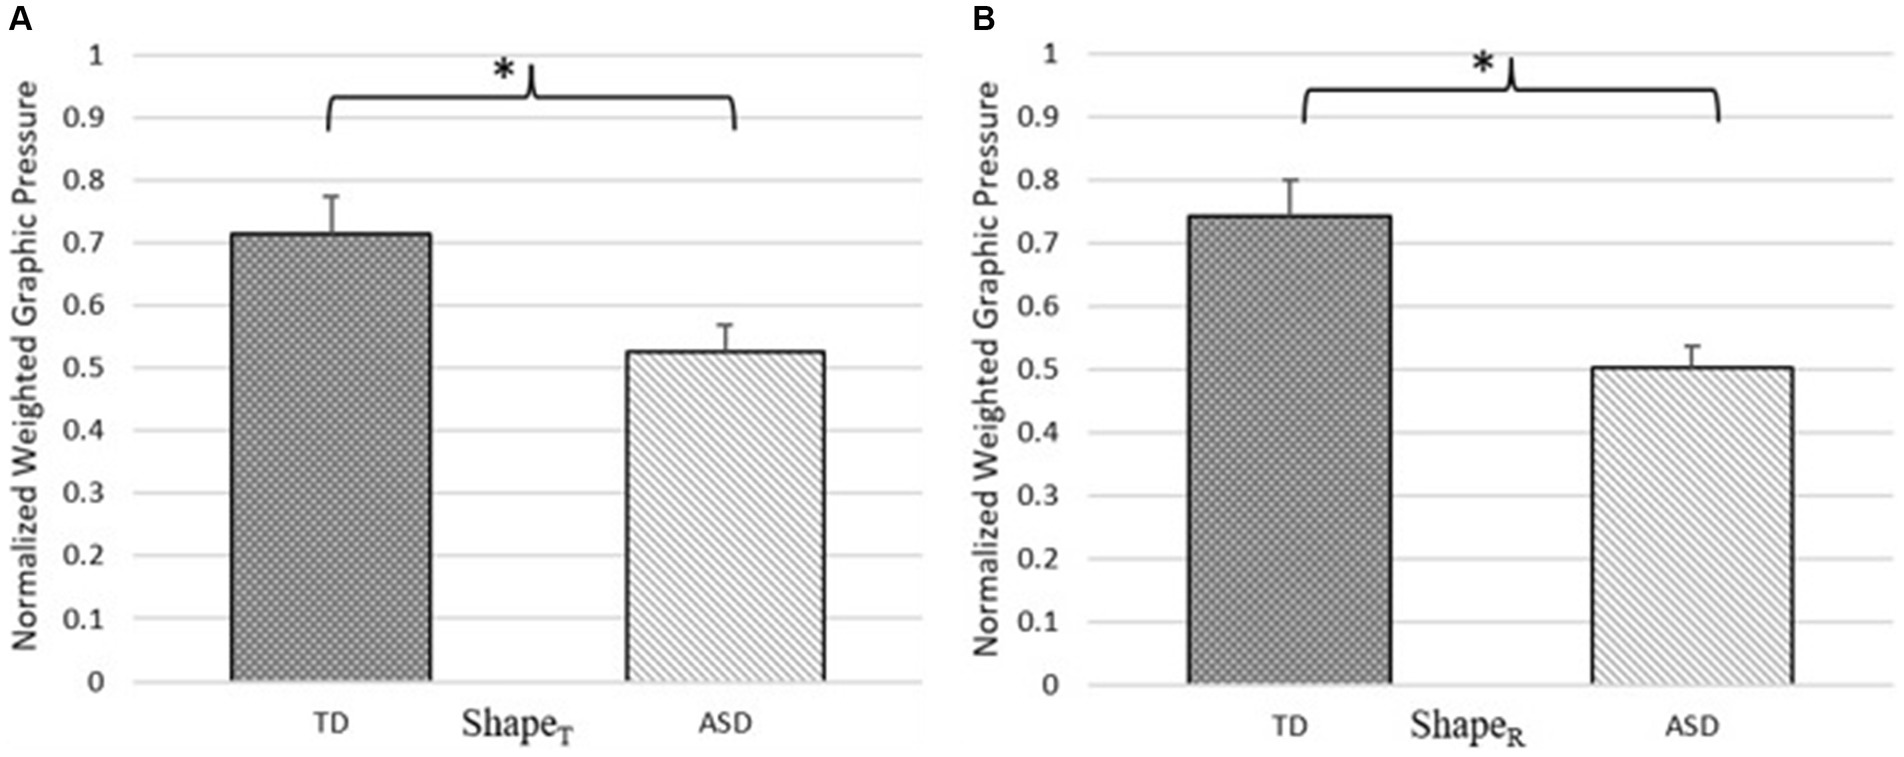
Figure 10. Comparative analysis of normalized weighted graphic pressure for (A) ShapeT and (B) ShapeR. *Indicates p-value <0.05.
It can be seen from Figure 10, that irrespective of the shape being drawn, GroupTD exhibited statistically (p-value <0.05, Cohen’s d = 1.05 and 1.44, respectively for ShapeT and ShapeR) higher (Δ% = ~36% and ~48%, respectively for ShapeT and ShapeR) weighted graphic pressure than GroupASD, similar to our observations on the difference in the weighted graphic pressure between the GroupASD and GroupTD during the execution of the TMT-A task (section 4.1.1).
4.2.3 Comparative analysis of normalized air time
As can be seen from Figure 11, irrespective of the ShapeT or ShapeR being drawn, the GroupASD spent more normalized air time ( ; section 3.6.5) than GroupTD (possibly inferring greater planning time required by the GroupASD than GroupTD), though the difference in the air time between the two participant groups was statistical (p-value <0.05, Cohen’s d = 0.88) for ShapeR (Δ% = ~134%) unlike ShapeT (Δ% = ~13%). The reason behind such differences warrants deeper investigation in future.
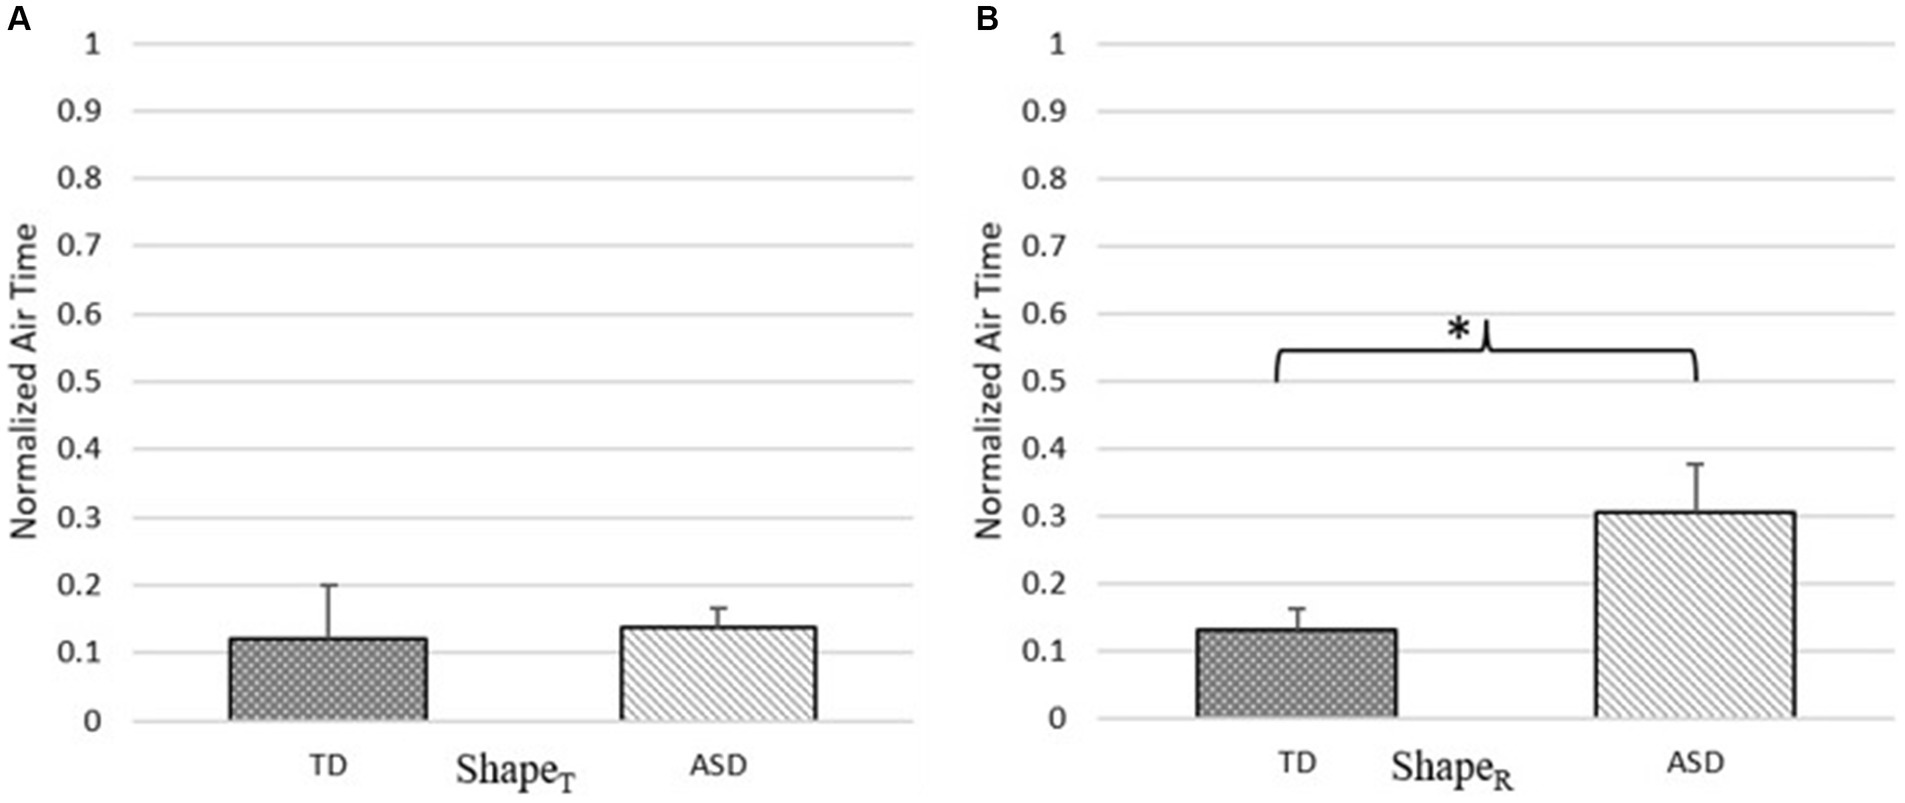
Figure 11. Comparative analysis of normalized air time for (A) ShapeT and (B) ShapeR. *Indicates p-value <0.05.
5 Conclusion and future work
In our present research, we wanted to understand whether there exists any difference in the attributes related to the use of the graphic tool and those related to planning while executing the Trail Making Test-Part A (TMT-A) and drawing of basic shapes on a pressure-sensitive tablet between a group of TD children (GroupTD) and those with ASD (GroupASD). Results of our study with 12 pairs of children with Autism and age-matched TD children indicate that GroupASD demonstrated statistically greater number of pen lifts and lower weighted graphic pressure (two of the attributes related to the use of the graphic tool) during the execution of the TMT-A on a pressure-sensitive tablet than GroupTD. Again, GroupASD demonstrated statistically higher air time (an attribute related to planning) during the execution of the TMT-A on the pressure-sensitive tablet than their TD counterparts. Subsequently, we investigated these three statistically discriminative attributes to understand the differences in the graphic skills of the two groups (if any) during drawing of shapes, such as ShapeT and ShapeR. We observed that GroupTD demonstrated lesser number of pen lifts, higher weighted graphic pressure (attributes related to the use of graphic tool), lower air time (an attribute related to planning) than those belonging to GroupASD during shape drawing task. To summarize, the number of pen lifts, the pressure exerted using the pen-tip and the ability to plan the graphic execution can possibly help explain the difficulties faced by individuals with ASD in creating a good graphic output. Though we had a limited sample size (12 pairs of participants), we believe that our results are promising given that we had a large Cohen’s d inferring a large effect size (Goulet-Pelletier and Cousineau, 2018). Using this Cohen’s d value, we computed the sample power strength employing the G*Power tool for post-hoc analysis. We found the sample power ~0.7 (on an average; thereby indicating nearly strong sample strength).
Though the results of our study are promising, yet our study had certain limitations. Currently, we had a limited sample size of 12 pairs of TD individuals and those with ASD and thus we do not intend to generalize our findings. In future, extended studies with large sample size can be conducted to generalize the differences in the use of the graphic tool and planning between individuals with ASD and their age-matched TD counterparts. Again, though our aim of this study was to understand differences in the attributes during shape drawing and not specifically across various shapes, yet our observations can be extended to the study of attributes corresponding to various shapes in future. In future, we plan to extend our study while including more basic shapes and shapes of objects (that one comes across in daily life). Again, our current study assessed one’s graphic ability in terms of some of the attributes related to the use of the graphic tool and those related to planning. Other attributes such as one’s visuo-motor integration capability, an essential component of graphic execution (Feder and Majnemer, 2007) has not been explored in our current study. This would need integration of our system with an eye tracker that we plan to do in future.
Notwithstanding the limitations, our current study has offered insights into the differences in the use of the graphic tool and planning ahead of graphic execution between individuals Autism and their TD counterparts. Such insights can be helpful in designing individualized intervention paradigms for children facing difficulties in graphic execution.
Data availability statement
The raw data supporting the conclusions of this article will be made available by the authors, without undue reservation.
Ethics statement
The studies involving humans were approved by the Institutional Ethics Committee (IEC), IIT Gandhinagar—Approval No. IEC/UL/2021/001. The studies were conducted in accordance with the local legislation and institutional requirements. Written informed consent was obtained from the minors’ legal guardians/next of kin for participation in the study and for the publication of any potentially identifiable images or data included in this article.
Author contributions
PV: Conceptualization, Formal analysis, Investigation, Methodology, Writing – original draft, Writing – review & editing, Data curation. MS: Writing – review & editing. UL: Conceptualization, Formal analysis, Investigation, Methodology, Supervision, Writing – original draft, Writing – review & editing.
Funding
The author(s) declare that no financial support was received for the research, authorship, and/or publication of this article.
Acknowledgments
The authors are thankful to B.M. Institute of Mental Health Ahmedabad and Palaj Primary School Gandhinagar, for helping us enroll the participants for our study. The authors would also like to thank all the participants and their families for their participation in our study. The authors would also like to thank IIT Gandhinagar and TCS Research Scholar Program for supporting this research.
Conflict of interest
The authors declare that the research was conducted in the absence of any commercial or financial relationships that could be construed as a potential conflict of interest.
Publisher’s note
All claims expressed in this article are solely those of the authors and do not necessarily represent those of their affiliated organizations, or those of the publisher, the editors and the reviewers. Any product that may be evaluated in this article, or claim that may be made by its manufacturer, is not guaranteed or endorsed by the publisher.
References
Armitage, S. G. (1946). An analysis of certain psychological tests used for the evaluation of brain injury. Psychol. Monogr. 60, i–48. doi: 10.1037/h0093567
Batchelder, A., McLaughlin, T. F., Weber, K. P., Derby, K. M., and Gow, T. (2009). The effects of hand-over-hand and a dot-to-dot tracing procedure on teaching an autistic student to write his name. J. Dev. Phys. Disabil. 21, 131–138. doi: 10.1007/s10882-009-9131-2
Becker, L. A. (2000). Effect size (ES). Available at: https://www.uv.es/friasnav/EffectSizeBecker.pdf (Accessed July 2, 2024).
Booth, R., Charlton, R., Hughes, C., and Happé, F. (2003). Disentangling weak coherence and executive dysfunction: planning drawing in autism and attention-deficit/hyperactivity disorder. Philos. Trans. R. Soc. B 358, 387–392. doi: 10.1098/rstb.2002.1204
Cartmill, L., Rodger, S., and Ziviani, J. (2009). Handwriting of eight-year-old children with autistic spectrum disorder: an exploration. J. Occup. Ther. Sch. Early Interv. 2, 103–118. doi: 10.1080/19411240903146426
Chandler, S., Charman, T., Baird, G., Simonoff, E., Loucas, T. O. M., Meldrum, D., et al. (2007). Validation of the social communication questionnaire in a population cohort of children with autism spectrum disorders. J. Am. Acad. Child Adolesc. Psychiatry 46, 1324–1332. doi: 10.1097/chi.0b013e31812f7d8d
Coon, H., Villalobos, M. E., Robison, R. J., Camp, N. J., Cannon, D. S., Allen-Brady, K., et al. (2010). Genome-wide linkage using the Social Responsiveness Scale in Utah autism pedigrees. Mol. Autism. 1, 8–14. doi: 10.1186/2040-2392-1-8
Emery, M. J. (2004). Art therapy as an intervention for autism. Art Ther. 21, 143–147. doi: 10.1080/07421656.2004.10129500
Faul, F., Erdfelder, E., Buchner, A., and Lang, A. G. (2009). Statistical power analyses using G* Power 3.1: tests for correlation and regression analyses. Behav. Res. Methods 41, 1149–1160. doi: 10.3758/BRM.41.4.1149
Feder, K. P., and Majnemer, A. (2007). Handwriting development, competency, and intervention. Dev. Med. Child Neurol. 49, 312–317. doi: 10.1111/j.1469-8749.2007.00312.x
Fellows, R. P., Dahmen, J., Cook, D., and Schmitter-Edgecombe, M. (2017). Multicomponent analysis of a digital trail making test. Clin. Neuropsychol. 31, 154–167. doi: 10.1080/13854046.2016.1238510
Gerth, S., Klassert, A., Dolk, T., Fliesser, M., Fischer, M. H., Nottbusch, G., et al. (2016). Is handwriting performance affected by the writing surface? Comparing preschoolers’, second graders’, and adults’ writing performance on a tablet vs. paper. Front. Psychol. 7:1308. doi: 10.3389/fpsyg.2016.01308
Goldstein, G., Johnson, C. R., and Minshew, N. J. (2001). Attentional processes in autism. J. Autism Dev. Disord. 31, 433–440. doi: 10.1023/A:1010620820786
Goulet-Pelletier, J. C., and Cousineau, D. (2018). A review of effect sizes and their confidence intervals, part I: the Cohen’s d family. Quant. Methods Psychol. 14, 242–265. doi: 10.20982/tqmp.14.4.p242
Grace, N., Enticott, P. G., Johnson, B. P., and Rinehart, N. J. (2017). Do handwriting difficulties correlate with core symptomology, motor proficiency and attentional behaviours? J. Autism Dev. Disord. 47, 1006–1017. doi: 10.1007/s10803-016-3019-7
Hanusz, Z., Tarasinska, J., and Zielinski, W. (2016). Shapiro–Wilk test with known mean. Revstat Stat. J. 14, 89–100. doi: 10.57805/revstat.v14i1.180
Harris, T. L., and Rarick, G. L. (1957). The problem of pressure in handwriting. J. Exp. Educ. 26, 151–178. doi: 10.1080/00220973.1957.11010592
Henderson, S. E., and Green, D. (2001). Handwriting problems in children with Asperger syndrome. Handwriting Today, 2, 65–79.
Horie, S., and Shibata, K. (2018). Quantitative evaluation of handwriting: factors that affect pen operating skills. J. Phys. Ther. Sci. 30, 971–975. doi: 10.1589/jpts.30.971
Kushki, A., Chau, T., and Anagnostou, E. (2011). Handwriting difficulties in children with autism spectrum disorders: a scoping review. J. Autism Dev. Disord. 41, 1706–1716. doi: 10.1007/s10803-011-1206-0
Lara-Garduno, R. A., Jia, Y., Deutz, N. E., Engelen, M., Leslie, N., and Hammond, T. (2022). “Detecting mild cognitive impairment through digitized trail-making test interface” in Graphics interface 2022.
Liu, Z. (2011). A method of SVM with normalization in intrusion detection. Procedia Environ. Sci. 11, 256–262. doi: 10.1016/j.proenv.2011.12.040
McKnight, P. E., and Najab, J. (2010). Mann-Whitney U test. The Corsini encyclopedia of psychology. Wiley Online Library, 1.
Moore, D. W., Anderson, A., Treccase, F., Deppeler, J., Furlonger, B., and Didden, R. (2013). A video-based package to teach a child with autism spectrum disorder to write her name. J. Dev. Phys. Disabil. 25, 493–503. doi: 10.1007/s10882-012-9325-x
Mundy, P., and Markus, J. (1997). On the nature of communication and language impairment in autism. Ment. Retard. Dev. Disabil. Res. Rev. 3, 343–349. doi: 10.1002/(SICI)1098-2779(1997)3:4<343::AID-MRDD9>3.0.CO;2-O
Nishitsuji, T., Shiina, N., Blinder, D., Shimobaba, T., Kakue, T., Schelkens, P., et al. (2022). Variable-intensity line 3D images drawn using kinoform-type electroholography superimposed with phase error. Opt. Express 30, 27884–27902. doi: 10.1364/OE.461187
Paz-Villagrán, V., Danna, J., and Velay, J. L. (2014). Lifts and stops in proficient and dysgraphic handwriting. Hum. Mov. Sci. 33, 381–394. doi: 10.1016/j.humov.2013.11.005
Rosenblum, S., Parush, S., and Weiss, P. (2001). Temporal measures of poor and proficient handwriters. Proceedings of the 10th Biennial Conference of the International Graphonomics Society. 119–125). IGS Pub.
Rosenblum, S., Parush, S., and Weiss, P. L. (2003). The in air phenomenon: temporal and spatial correlates of the handwriting process. Percept. Mot. Skills 96, 933–954. doi: 10.2466/pms.2003.96.3.933
Rosenblum, S., Samuel, M., Zlotnik, S., Erikh, I., and Schlesinger, I. (2013). Handwriting as an objective tool for Parkinson’s disease diagnosis. J. Neurol. 260, 2357–2361. doi: 10.1007/s00415-013-6996-x
Santos, F. H., Mello, C. B. D., Bueno, O. F., and Dellatolas, G. (2005). Cross-cultural differences for three visual memory tasks in Brazilian children. Percept. Mot. Skills 101, 421–433. doi: 10.2466/pms.101.2.421-433
Sousa, M. C., and Buchanan, J. W. (1999). “Computer-generated graphite pencil rendering of 3D polygonal models” in Computer graphics forum (Boston, NJ: Blackwell Publishers Ltd.), 195–208.
Wacom. (2022) One by Wacom: creative pen tablet. Available at: https://www.wacom.com/en-in/products/pen-tablets/one-by-wacom (Accessed December 12, 2022)
Yamaguchi, K., Sano, M., and Fukatsu, R. (2019). Hand and finger functions and characteristics of line drawing movement in preschool children with autism spectrum disorder: preliminary study. Asian J. Occup. Ther. 15, 77–83. doi: 10.11596/asiajot.15.77
Keywords: autism, graphic execution, pressure tablet, shape drawing, trail making
Citation: Verma P, Singh M and Lahiri U (2024) Understanding the differences in the use of graphic tool and planning during graphic execution between individuals with autism and typically developing individuals. Front. Educ. 9:1358024. doi: 10.3389/feduc.2024.1358024
Edited by:
Pamela Bryden, Wilfrid Laurier University, CanadaReviewed by:
Swati Jain, Nirma University, IndiaLuis Alex Alzamora De Los Godos Urcia, Cesar Vallejo University, Peru
Copyright © 2024 Verma, Singh and Lahiri. This is an open-access article distributed under the terms of the Creative Commons Attribution License (CC BY). The use, distribution or reproduction in other forums is permitted, provided the original author(s) and the copyright owner(s) are credited and that the original publication in this journal is cited, in accordance with accepted academic practice. No use, distribution or reproduction is permitted which does not comply with these terms.
*Correspondence: Pragya Verma, dmVybWFfcHJhZ3lhQGlpdGduLmFjLmlu
 Pragya Verma
 Madhu Singh2
 Uttama Lahiri