 Jorik Arts
 Wilco Emons
 Kim Dirkx
 Desirée Joosten-ten Brinke
 Halszka Jarodzka5
94% of researchers rate our articles as excellent or good
Learn more about the work of our research integrity team to safeguard the quality of each article we publish.
Find out more
ORIGINAL RESEARCH article
Front. Educ., 02 April 2024
Sec. Assessment, Testing and Applied Measurement
Volume 9 - 2024 | https://doi.org/10.3389/feduc.2024.1344012
Educational tests often combine text and images in items. Research shows that including images in test items can influence response accuracy, termed the Multimedia Effect in Testing. This effect suggests that using pictures in tests can enhance student performance and reduce the perception of item difficulty. As such, the Multimedia Effect in Testing could influence test validity. However, research in this area has produced varied and conflicting results, which may be partly attributed to the functionality of the images used. Besides, many studies only offer test-level data, making it challenging to determine whether the outcomes represent a generic phenomenon or result from averaging mixed outcomes in individual test items. This present study examined whether coherency of pictures in tests influences response accuracy, mental effort and time-on-task at the test level and item level. Item-level analysis showed that the Multimedia Effect in Testing is not universal; only a small subset of items showed significant differences between text-only and text-picture items. The degree of coherence also did not give unambiguous results. In summary, the study highlights the complexity of the Multimedia Effect in Testing, suggesting it is context-dependent, with not all test items benefiting equally from multimedia elements. The findings emphasize the need for a nuanced understanding of how multimedia affects educational testing.
Educational tests often contain items with pictorial information such as pictures, illustrations, diagrams, photos, animations, and videos (based on OECD, 2007; Parshall et al., 2009; Wu et al., 2015). Testing with items that combine text with pictorial information is referred to as multimedia testing. It is becoming more and more clear that the use of multimedia in test items can influence the problem solving performance of participants (Elia et al., 2007; Jarodzka et al., 2015; Ögren et al., 2017; Lindner et al., 2017b). However, since it is still largely unknown what exactly determines the influence of pictorial information on performance, guidelines to optimally present multimedia content in test items are lacking. As long as the multimedia effect on performance is not fully understood, the presence of pictorial information in multimedia tests can affect validity of decisions based on multimedia tests (Kirschner et al., 2017; Lindner, 2020).
Currently, there are no specific theories that explain how pictures influence response accuracy (Lindner et al., 2017b; Hu et al., 2021). Instead, as problem-solving processes at least partly resemble the construction of mental models during learning, studies on multimedia testing currently make use of multimedia learning theories to formulate hypotheses and to explain outcomes (Jarodzka et al., 2015; Ögren et al., 2017; Lindner et al., 2018; Dirkx et al., 2021). Multimedia learning theories offer explanations to the question why combining text with multimedia can enhance learning in comparison to using text alone [the multimedia effect in learning (Mayer, 2021)]. Two different theories that are relevant in this context are the cognitive theory of multimedia learning (Mayer, 2005) and the cognitive load theory (Sweller et al., 2019). As both theories are based on the assumption that the human working memory is limited in terms of capacity and durability, they both recommend keeping the amount of information that needs to be processed as low as possible. Furthermore, both theories assume that multimedia can lower the chance of overload of the working memory and increase processes that foster learning. These effects of multimedia may be due to the so called dual-channel processing in which texts and pictures are processed in two separate systems (an auditory/verbal system and a visual/pictorial system) with each their own (limited) working memory capacity (Paivio, 1990; Baddeley, 1992; Baddeley et al., 2017). As these separate systems have their own working memory capacity and durability, they are proposed to function additive (Chandler and Sweller, 1991), thereby reducing the chance of overload.
Although insights from multimedia learning are valuable to better understand multimedia testing, learning and testing do require different cognitive processes. Where testing requires students to retrieve knowledge from memory, learning requires storing of information in memory, and as such testing is different from learning. However, the effects that multimedia in instructional materials have on the working memory may be (partly) equivalent during learning and during retrieval (Baddeley, 1992; Kirschner et al., 2017). During retrieval, information activated from long-term memory is probably also processed in working memory. Moreover, to understand the problem or the question, information intake is an essential first element. From this, it is suggested that the design of multimedia usage in test items can influence processing by participants (cf. Jarodzka et al., 2015; Ögren et al., 2017). If designed properly, multimedia may lower the chance of working memory overload, thereby reducing the mental effort needed to solve a problem and increasing the chance of successful retrieval (see Figure 1).
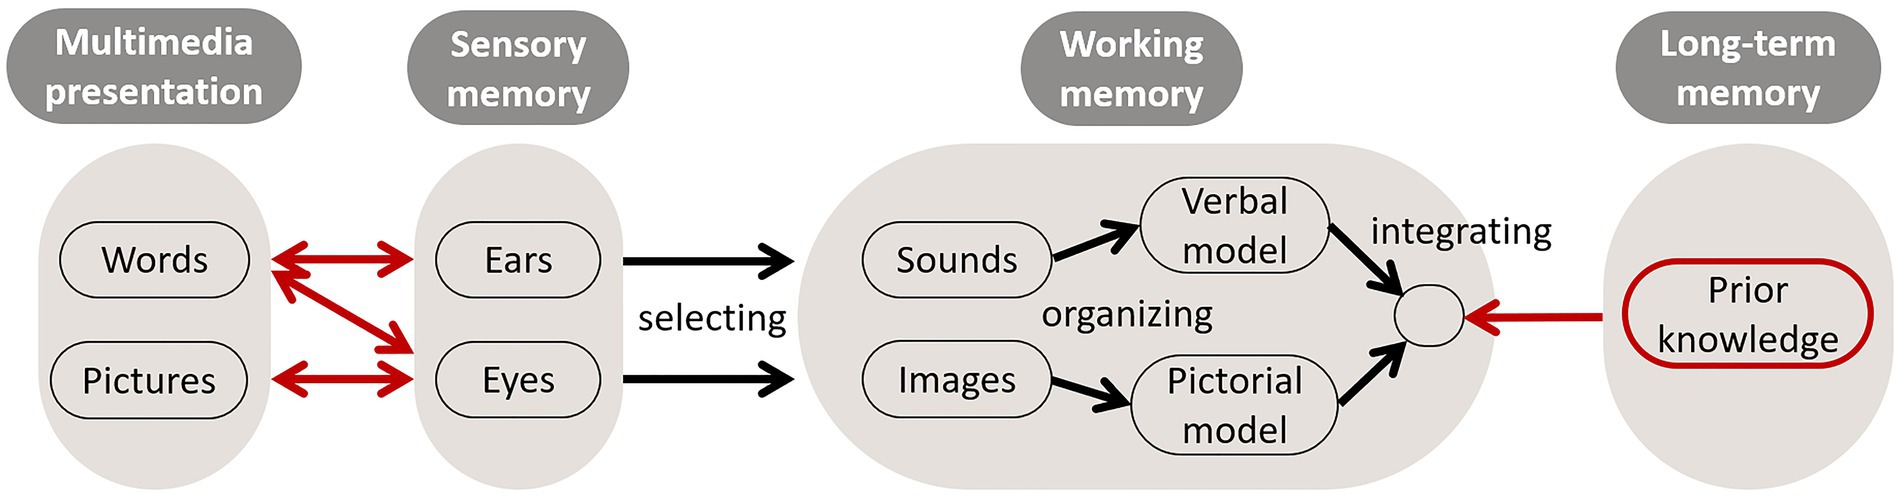
Figure 1. Proposed role of multimedia presentation and working memory in retrieval of knowledge during test taking (Jarodzka, 2022).
Based on (proposed) similarities between how multimedia supports learning and how multimedia affects performance in testing, the term Multimedia Effect in Testing was introduced, stating that (representational) pictures in test items have a positive effect on students’ performance (i.e., response accuracy) and decrease perceived item difficulty (i.e., mental effort) (Lindner et al., 2018). Several studies (Garcia-Retamero and Hoffrage, 2013; Lindner et al., 2021; e.g., Saß et al., 2012; Lindner et al., 2017b, 2018) and a subsequent meta-analysis (Hu et al., 2021) indeed showed that adding pictures to test items had a positive effect on response accuracy and on perceived difficulty or response certainty. The meta-analysis did not find a significant multimedia effect on response time. Therefore, it does not seem that analysis of pictorial information requires additional time investment of students.
The meta-analysis, however, also made clear that the use of multimedia in test items gives diverse and sometimes even contradictory effects, indicating that there are moderators at play (Hu et al., 2021). An important moderator may be the functionality of pictures. For instance, in a study by Lindner (2020) the use of pictures differing in functionality led to concomitant differences in their effect on response accuracy and perceived item difficulty without influencing time-on-task. Most common in multimedia testing is to categorize pictures into four functions (Saß et al., 2017; Hu et al., 2021): decorative, representational, organizational, and informational. Decorative pictures are hardly related to the test item and not necessary to solve the problem (Elia and Philippou, 2004; Lindner, 2020). Representational pictures mirror some or all of the text content. Such a picture makes textual information less abstract by presenting it in a visual mode, without giving additional solution-relevant cues (Elia and Philippou, 2004; Lindner, 2020). Organizational pictures provide a visual–spatial overview of the information structure in the text, and as such do not just represent the information but add structure to it (Elia and Philippou, 2004; Garcia-Retamero and Hoffrage, 2013). Informational pictures depict essential information that is needed to solve a problem (Elia and Philippou, 2004; Berends and Van Lieshout, 2009; Hoogland et al., 2018a).
Although the classification of pictures into the four functionalities might seem quite straight forward, differences in interpretation can lead to seemingly contradicting results. For instance, in the study of Dewolf et al. (2015) on effects of decorative and representational pictures, an approach was used in which functionality referred to whether there was a direct relation between picture and textual elements of the test item, irrespective of whether the picture makes the problem or task more concrete. When there was any direct relation between text and picture, the picture was labeled as being representational. Based on the examples shown in the article, all representational pictures visualize contextual information irrelevant for solving the problem. In this study, no effect on response accuracy was found for representational pictures. A result opposite to that, is the study of Lindner (2020) who did find a positive effect of representational pictures on response accuracy. However, in the latter study, the representational pictures from Dewolf et al. (2015) would probably be categorized as decorative, since Lindner (implicitly) couples functionality of the picture to the function it has in relation of the problem to be solved (does the picture represent relevant textual information?). This difference in interpretation of functionality is a problem caused by the fact that the used definitions either refer to objectively observable aspects (e.g., the picture visualizes textual information), or to less objectively observable aspects (e.g., the picture visualizes task-relevant textual information which supports the construction of a mental model) (Kerckhoffs et al., 2024).
The so-called coherence principle from the cognitive theory of multimedia learning (Mayer, 2005) might offer a guideline to distinguish these two different interpretations of a representational function of a picture in a test item. The coherence principle states that interesting, but irrelevant information (text, pictures, music) should be kept out of instructional material (Harp and Mayer, 1997, 1998; Mayer et al., 2008; Mayer, 2021). When the coherence principle is applied to representational pictures, this divides non-coherent representational pictures (i.e., pictures which mirror text that is not needed to understand or resolve the task) (Kerckhoffs et al., 2024) as depicted by Dewolf et al. (2015) from coherent representational pictures as described by Lindner (2020). One could say that non-coherent representational pictures are possible distractors, since they do not help to organize, or to interpret relevant textual information. Coherent representative pictures on the other hand do help to better understand relevant textual information (Levin, 1987; Carney and Levin, 2002; Kerckhoffs et al., 2024).
Although differences in interpretation of functionality can partly explain heterogeneity in the Multimedia Effect in Testing, there are clues that also other unknown variables seem to play a role. For instance, the beneficial effect of adding representational pictures to test items in Lindner’s (2020) study was not found in the study of Berends and Van Lieshout (2009). Since both studies involved children from primary education and both studies tested mathematical problems, comparable outcomes would be expected if the Multimedia Effect in Testing is a universal effect. Taken together, it is still hard to predict outcomes in the field of the Multimedia Effect in Testing because of heterogeneity, and lack of data.
Another problem in understanding the Multimedia Effect in Testing is that many studies only present data on test-level. If the overall performance for text-picture items in a test is similar to the overall performance for text-only items in a test, this may be the result of the absence of a Multimedia Effect in Testing, but it may as well be the result of opposing results for individual items. When some test items include pictures that increase response accuracy and other items include pictures that hamper response accuracy, the overall effect will be that there is no multimedia effect. From this, one could argue that part of the divergent outcomes for multimedia testing might be influenced by using a too generic approach in testing the Multimedia Effect in Testing by suggesting that individual test items and individual test takers all function in a similar way. In one of the few studies that gives an analysis of individual items, Hoogland et al. (2018a,b) showed that within their study the multimedia effect on response accuracy varied between items from a significant negative impact to a significant positive impact. Other studies sometimes hint at varying results for text-picture items without presenting data from individual items. For instance, in the study of Lindner et al. (2018), the authors indicate that representational pictures enhanced performance, only when pictures visualized information mandatory for solving the task (mandatory-stem items), and not when they visualized optional context information (optional-stem items). How the authors decided which item belonged to which group can only implicitly be deduced from the paper, because only one example of both groups is presented (Lindner et al., 2018). Thus, a generic approach where only data on test-level are presented might hinder a better and deeper understanding of the Multimedia Effect in Testing.
Taken together, a better understanding of the multimedia testing effect is essential, since (1) it is clear that adding multimedia to test items influences response accuracy (Hu et al., 2021) and (2) that it can affect validity of decisions based on these test outcomes (Lindner, 2020). However, the number of studies thus far is rather scarce and the results show divergent and sometimes even opposite effects. Besides that, there is an emphasis on data from primary education, which may not be generalized to higher education students. To substantiate this, the meta-analysis by Hu et al. (2021) mentions only four studies focusing on representational pictures in a higher education context, one being a doctoral dissertation that does not seem to be published in a peer-reviewed journal. Lastly, as it seems that the Multimedia Effect in Testing can vary among individual items (Hoogland et al., 2018b), presenting data only at test-level may hinder a deeper understanding of results.
Based on the above, we state that it is necessary (i) to further investigate the Multimedia Effect in Testing in the context of higher education, (ii) to investigate whether the coherence principle moderates the Multimedia Effect in Testing; and (iii) to disentangle potential multimedia effects within individual test items as opposed to effects on test-level. With respect to the last element, the present study explores whether item-level analysis is a valuable addition to the (more) common test-level approach.
We formulated the following hypotheses:
H1: Response accuracy for items with multimedia is higher than for text only items (based on Lindner et al., 2018).
H2: Subjective mental effort for items with multimedia is lower than for text only items (based on Jarodzka et al., 2015; Ögren et al., 2017).
H3: Time on task is equal for items with multimedia and text only items (based on Lindner et al., 2018).
H4: Coherent representational pictures have more effect on response accuracy, subjective mental effort and time on task than non-coherent representational pictures (based on Levin, 1987; Carney and Levin, 2002; Kerckhoffs et al., 2024).
Apart from testing these hypotheses, an additional aim of this study is to explore whether an item-level analysis is of additional value to gain insight into the Multimedia Effect in Testing. As stated before, the most common approach of test-level analyses might lead to missing some effects. In line with this additional aim of the study, the following research question (RQ) is taken into account: What is the added value of item-level analyses over test-level analyses in learning to understand the Multimedia Effect in Testing? To test these hypotheses and to answer the research question, two experiments were carried out.
A within-subject experiment was carried out for which test items were developed in two versions: for each text-only item a text-wise identical text-picture item was constructed, resulting in a set of 12 individual test-items in two versions each.
The participants in experiment 1 were full-time students from two teacher-training institutes. Data were collected as part of a first-year course on enzymes. Ninety-three students participated, with a mean age of 20.8 years (SD = 4.5), including twenty-eight males.
For this study, the first author, expert teacher on the subject, developed an experimental multiple-choice test, consisting of item stems (approximately three sentences), a question, and four answer options with a single correct option. Two versions of each item were created: a text-only version and a multimedia version (text combined with a picture). The full-color pictures were taken from the textbook used during instruction (Reece et al., 2018) and represented (part of) the textual information of the item. All pictures mirror some or all of the text content, and did not provide additional solution-relevant cues. Therefore, these pictures are classified as representational pictures. Some pictures represented textual information that was useful, but not essential, for solving the problem (coherent representational pictures), other pictures represented contextual information that was not relevant for solving the problem (non-coherent representational pictures). Test items were presented in a split format, with the stem on the left, the picture on the right, the question below, and the answer options at the bottom (see Figure 2). Two item sets were constructed with a mixture of six text-only and six text-picture items so that each item was presented in one item set in the text-only version, and in the other item set as the text-picture version (Item Set 1: Cronbach’s α = 0.62; Lambda-2 = 0.65; SEM = 1.52; Item Set 2: Cronbach’s α = 0.51; Lambda-2 = 0.56; SEM = 1.50). Both Cronbach’s alpha and Lamba are lower bounds to the test-score reliability; that is, the true (unknown) reliability is in between the value of alpha or lambda and 1. It has been shown (mathematically) that coefficient Lambda-2 is equal to, or larger than alpha, and therefore closer to the true value of the reliability, giving more accurate estimates of the reliability (e.g., Sijtsma, 2009). However, because Lamda-2 is less well known than alpha we report both for completeness. Test-score reliability, however, depends on the combination of the precision by which individuals are measured (on average) and inter-individual differences in the underlying trait (i.e., group heterogeneity) as expressed by interindividual differences in the true scores. As a result, when the reliability of two tests that were intended to be parallel differ, it may have different explanations. First, differences can be simply due sampling errors. Second, differences can also be caused by differences in the underlying true-score distributions. Therefore, to gain a more solid insight in the measurement quality of the test-score data used in terms of reliability and measurement precision, we also looked at the SEMs for both tests. The SEM is less sensitive to group-heterogeneity and also less sensitive to sampling errors. In our case the SEMs were highly similar for both tests from which we inferred that although the reliability for Item Set 2 is somewhat lower than for Item Set 1, there is no evidence of less precise measurements (i.e., larger measurement errors).
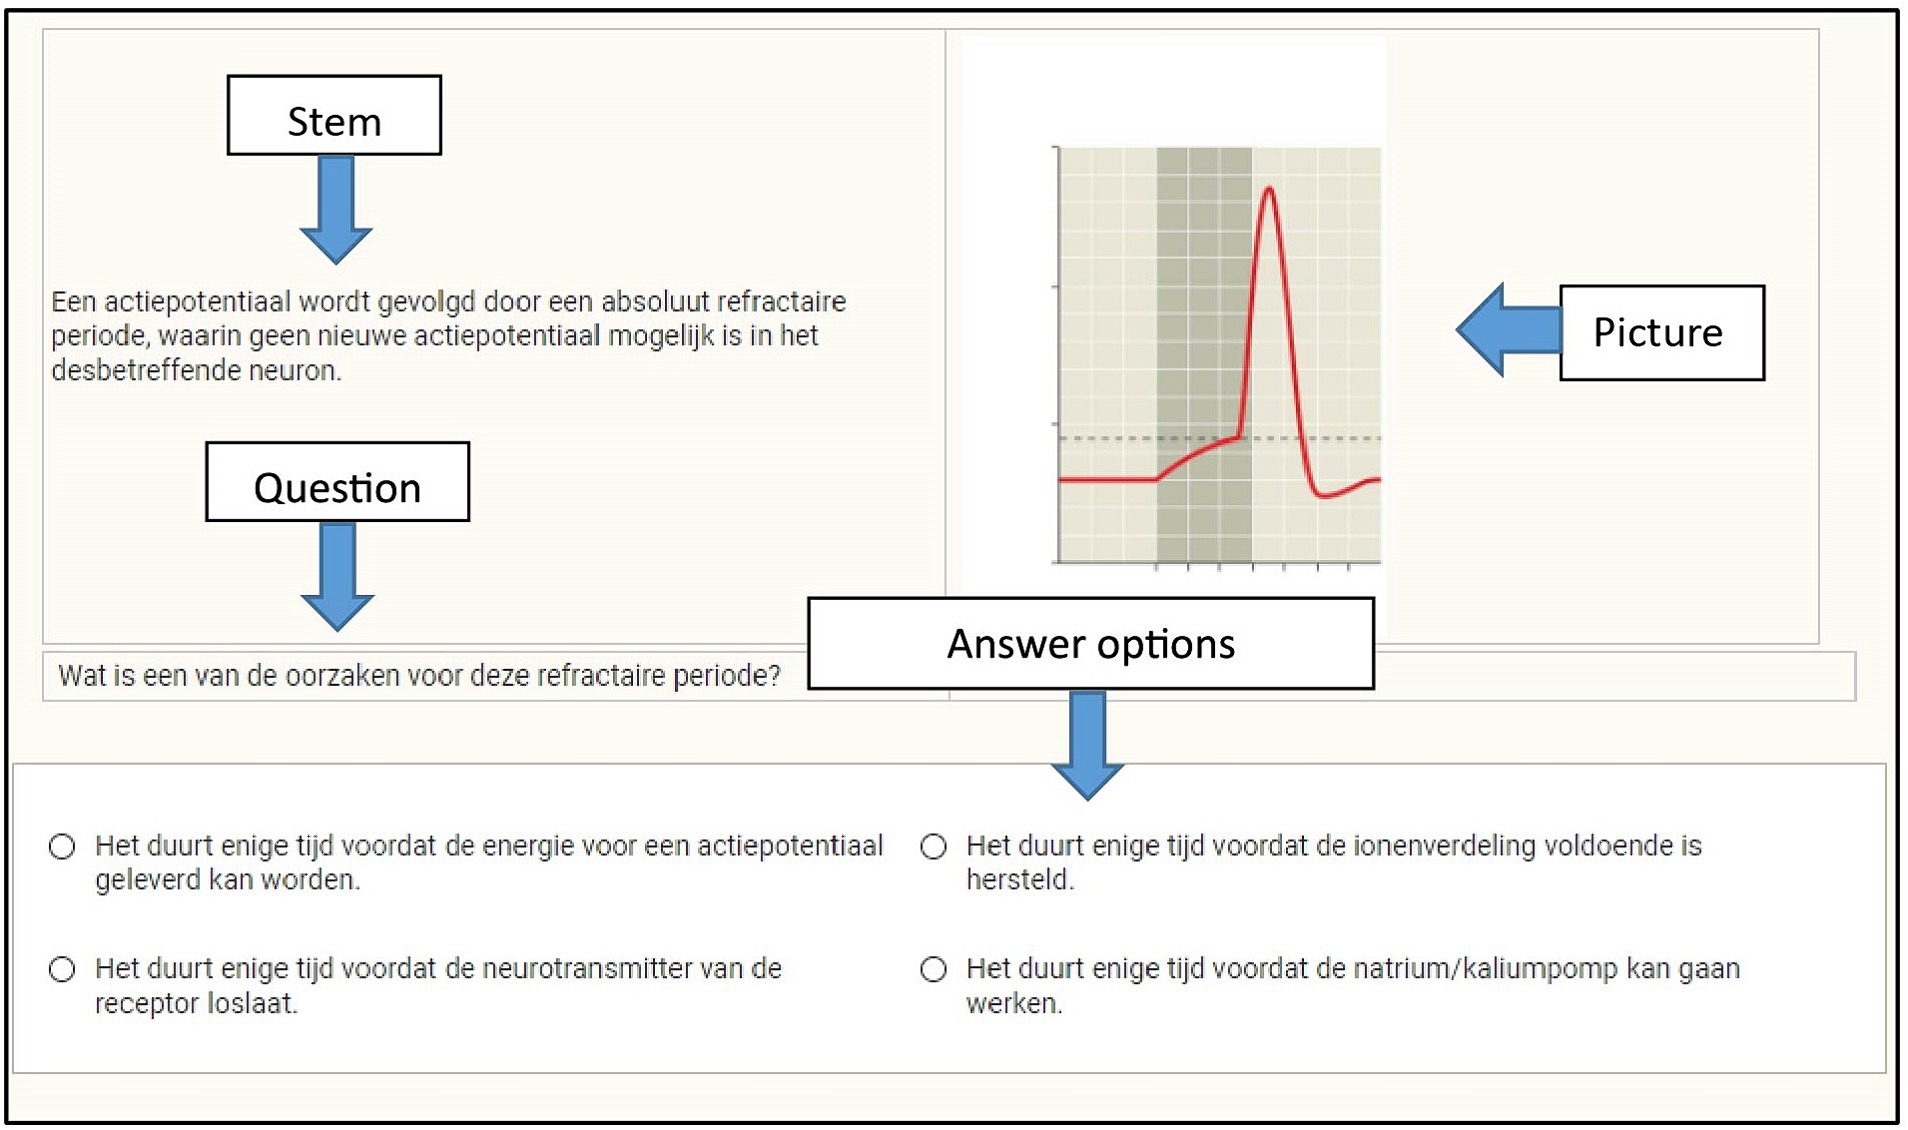
Figure 2. Example of a test item (in Dutch) with a representational picture, which was taken from instructional material (Reece et al., 2018).
Participants were assigned at random to either of these sets. Hence, participants completed a mixture of text-only and text-picture items, but they never received the same item twice. More detailed information about the test administration, like the order in which text-picture and text-only items were presented in each Item Set, item difficulty, and item discrimination is added as supplemental material (see Supplementary Table S1).Tests were provided via the software TestVision©.
Response accuracy on test-level refers to the proportion correct score on the test (i.e., number correct/number of items). Response accuracy on item-level refers to the absolute score on every item.
To measure perceived item difficulty, the single-item Likert rating scale for mental effort by Paas (1992) was used. Following each test item, students were asked to rate on a 9-point scale the amount of mental effort they exerted to answer it, ranging from (1) very, very low mental effort to (9) very, very high mental effort.
The TestVision application recorded the time (in seconds) taken by each student to answer each test item (time until first answer).
The study was conducted at the Biology department of two different universities of applied science for teacher training in the Netherlands. Participants received the experimental test as an integral part of a 10-week course. Students were informed about the aims and scope of the study and were subsequently invited to participate. During an in-class meeting, they worked individually on the computer-based test. Participation in this experiment was voluntary, and the test was used as a formative assessment. As a measure for test engagement, mean total time-on-task was determined, which was 26 min (SD = 9.1).
The complete data set comprised 93 participants. Of the 93 participants, seven were removed, because these students had worked on a smartphone as a test-taking device. Missing data were handled as follows. We removed eight cases who had a missing score on one or more items (the mean number of missing items for these cases was 7.6 with only one student missing 1 score). This sample of 78 is used to study multimedia effects for response accuracy. For the remaining analyses of mental effort and time on task, we excluded six cases who answered the Paas (1992) question without answering the item. This approach ensured that all subjective mental effort and time-on-task scores were accompanied with a valid item response.
A t-test was performed to test difference between the mean response accuracy for text-only items and mean response accuracy for text-picture items for significance. T-tests were performed for the complete data set and for each item set separately. The latter approach considers that the full data set has a nested structure because participants took different sets of items.
T-tests were performed, for the complete data set and for each item set separately, to test differences between subjective mental effort for text-only items and for text-picture items for significance.
A t-test was performed to test differences between the time-on-task for text-only items and for text-picture items for significance. T-tests were performed for the complete data set and for each item set separately.
To determine whether coherence of the representational picture influences the outcomes of the comparison between text-only and text-picture items, item sets were further divided into two groups. A t-test was performed to test differences between outcome variables of text-only items and respectively, coherent and non-coherent text-picture items for significance.
For all hypothesis, all tests were done at the 5% significance level (two-tailed).
To answer the research question whether analysis on item level provide more insight in the Multimedia Effect in Testing the following approach was used.
To compare the percentage of correct responses for each individual text-only item with the corresponding text-picture item, a χ2-test was performed. A χ2-test offers insight in whether the number of correct responses for each item is associated with the category text-only or text-picture or whether there is a random association. This test was chosen because of the binary data for each item (true or false). When choosing the nominal significance level, one must balance type I errors against type II errors, within the context of the study envisaged e.g., (see Abelson, 2012). Given the explorative nature of the study, a type 1 error deemed less problematic than a type 2 error (i.e., overlooking potentially important effects in a study that deals with relatively new phenomena). By setting the nominal significance level to 0.1 we maintain the type I error rate small enough to exclude too many false impressions of an effect purely due to chance, but we gain some power and thus lower the chance of committing a type 2 error. Hence, p ≤ 0.10 was considered significant.
To compare the subjective mental effort score for each text-only item with those of the accompanying text-picture item, a t-test was performed.
A t-test was conducted to determine whether any differences between individual text-only and text-picture items were significant.
Table 1 shows that participants scored on average lower on items in a text-picture format than on items in a text-only format. This difference was, however, non-significant. Statistical analysis considering that data is nested also did not show significant differences in response accuracy between text-only items and text-picture items for Item Set 1 and Item Set 2.
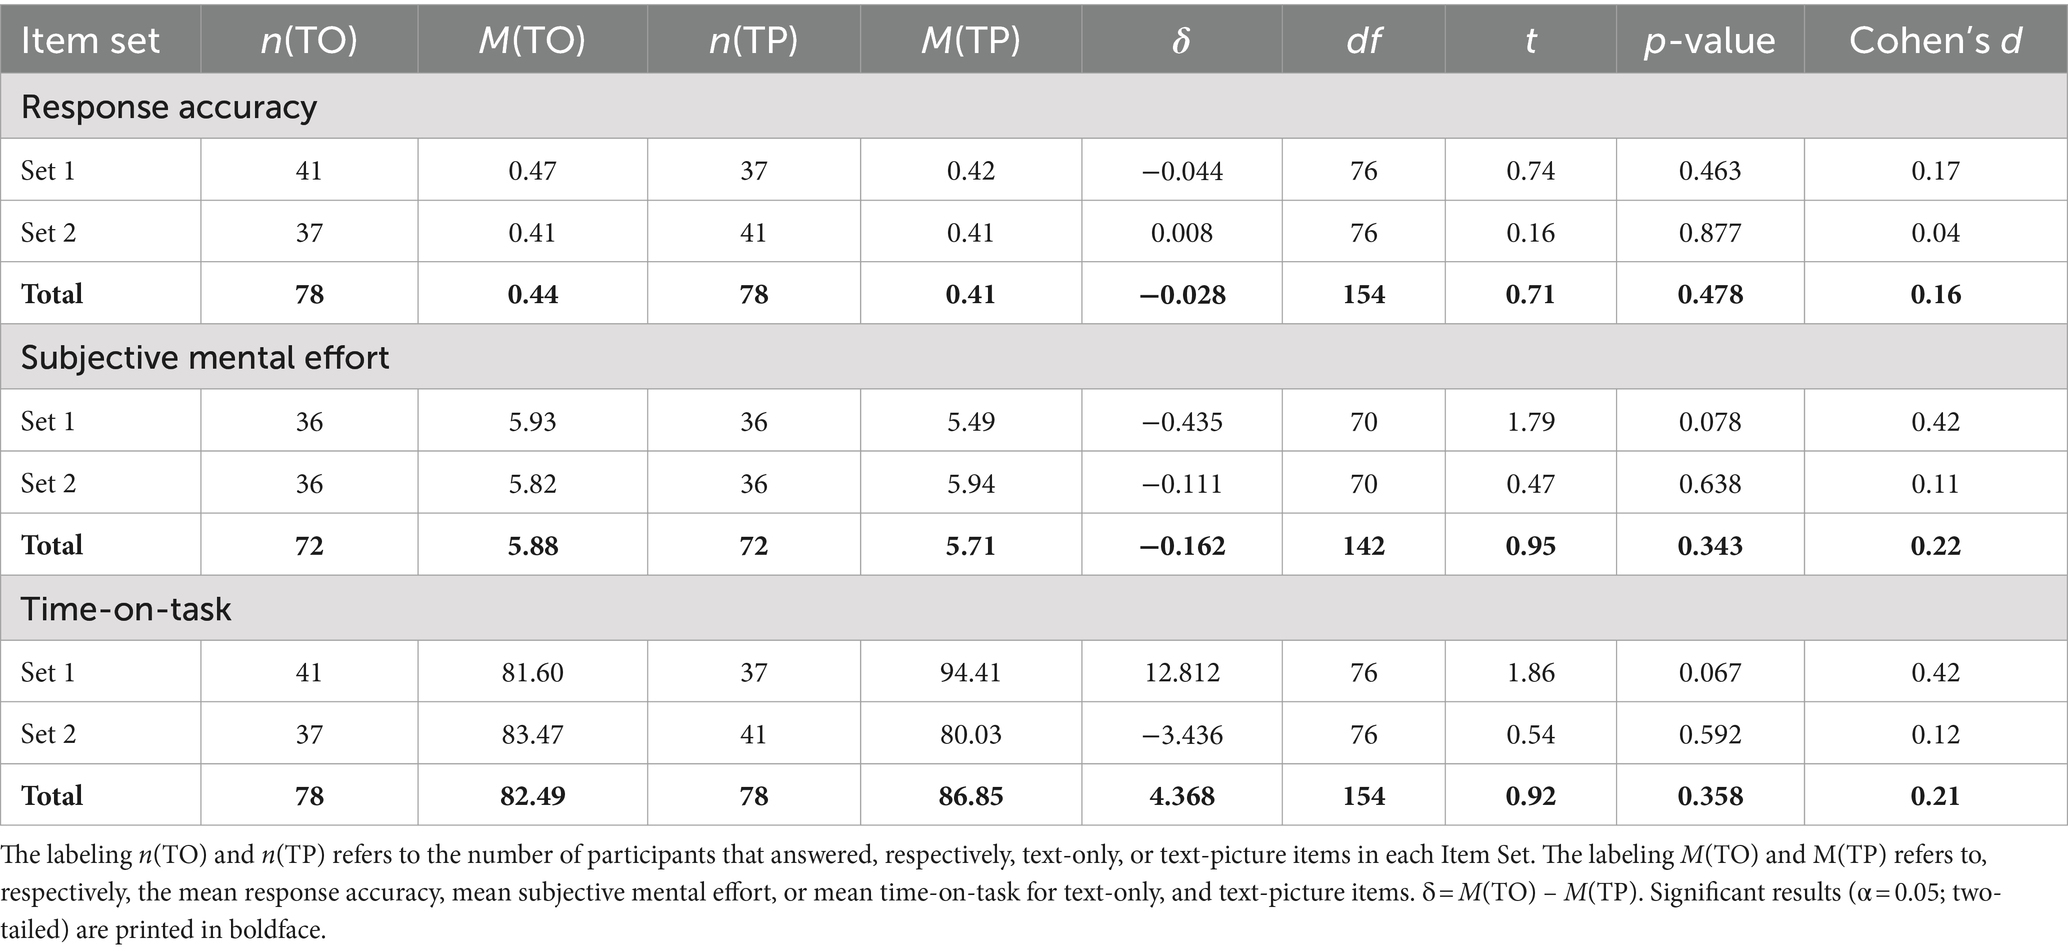
Table 1. Multimedia effects text-only and text-picture items: pooled data and data for each item set.
Subjective mental effort was somewhat lower for text-picture set, but this difference was small and non-significant (see Table 1). No significant differences in mental effort between text-only item set and text-picture item set for Item Set 1 and Item Set 2 were found either.
It took students slightly longer to answer text-picture items, but again, this difference was not significant and no significant differences between Item Set 1 and Item Set 2 were found either (see Table 1).
Table 2 depicts the data on coherent representational pictures in text-picture items. Response accuracy was slightly, but non-significantly, higher for text-picture items with coherent representational pictures. Subjective mental effort was somewhat lower for these text-picture items, and students spend slightly more time on these items. Differences were, however, non-significant, with the exception of subjective mental effort for Item Set 1, showing a significant lower mental effort for text-picture items.

Table 2. Multimedia effect coherent representational pictures: pooled data and data for individual sets.
The data on non-coherent representational pictures in text-picture items is shown in Table 3. Response accuracy was lower for text-picture items with non-coherent representational pictures, with the difference close to being significant. Subjective mental effort was slightly higher for these text-picture items, and students spend a little more time on these items. Differences were, however, non-significant, with the exception of time-on-task for Item Set 1, showing a significant longer response time for text-picture items.
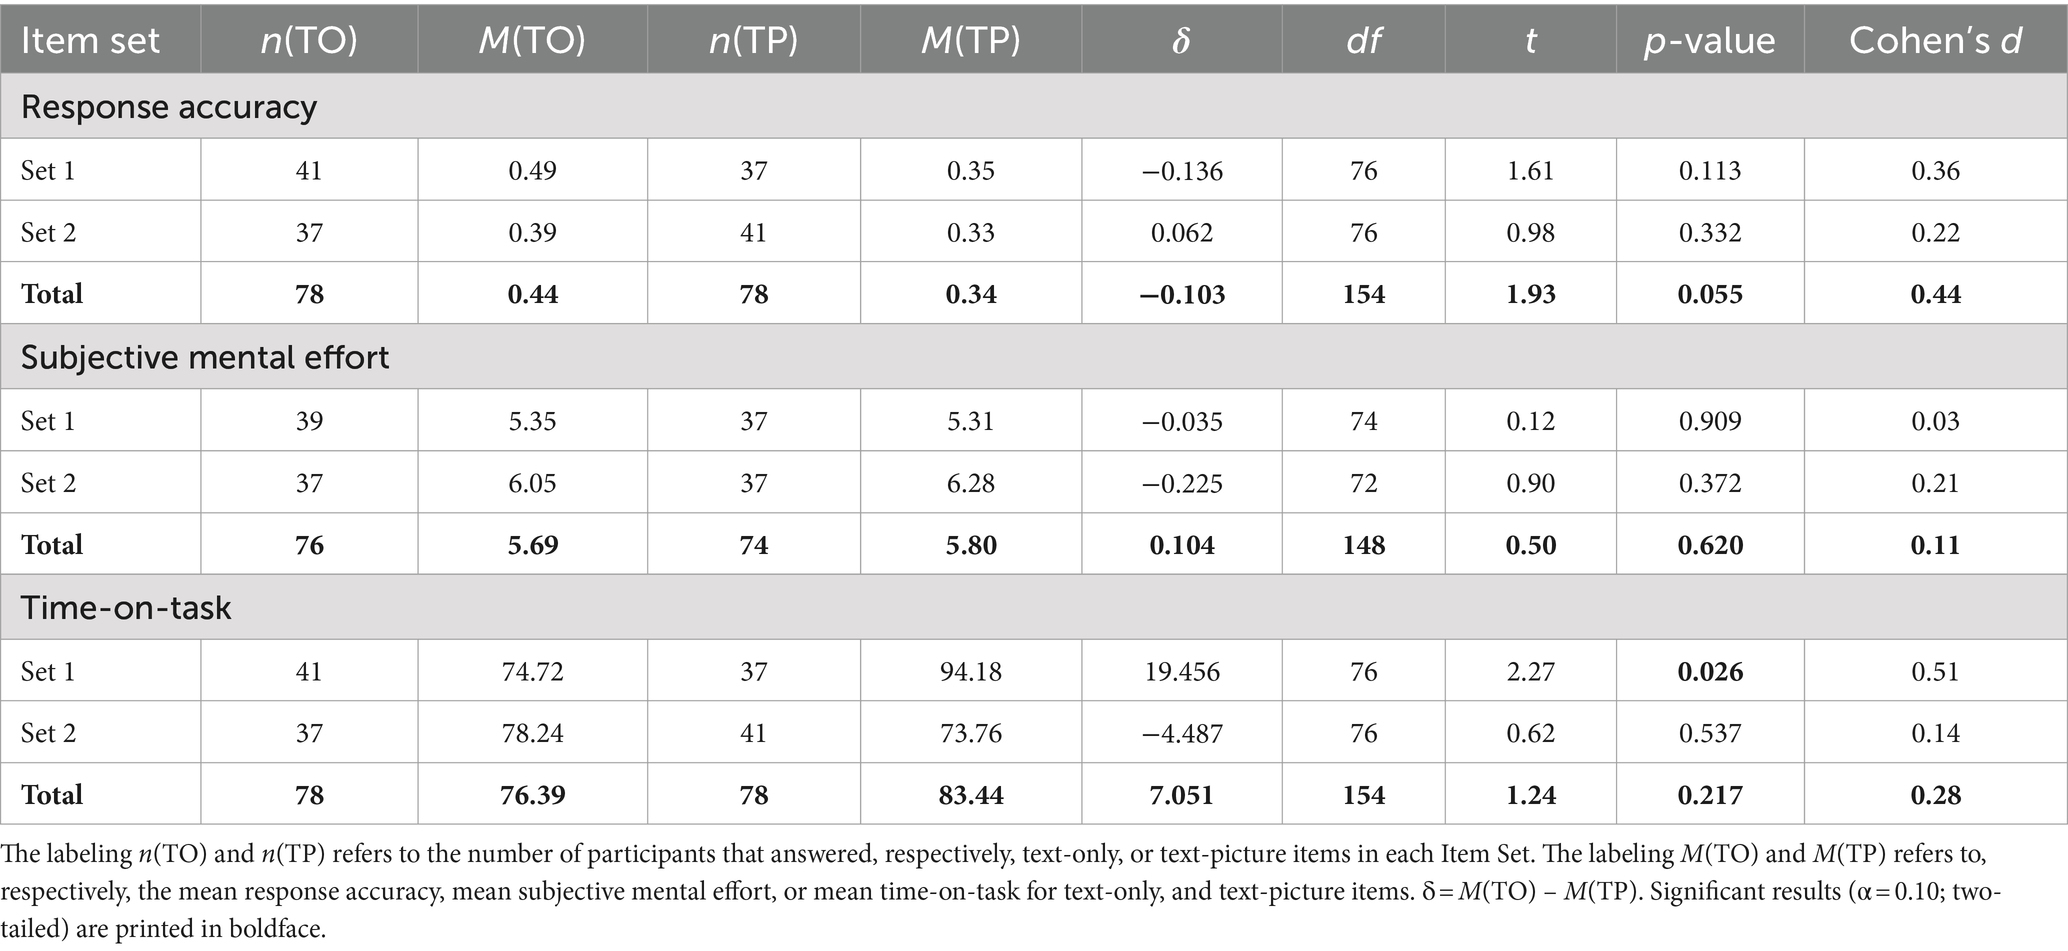
Table 3. Multimedia effect non-coherent representational pictures: pooled data and data for individual sets.
Since the data in Tables 2, 3 originate from different test items (i.e., Table 2 concerns coherent items and Table 3 concerns non-coherent items), it is important to note that a direct comparison between these tables may not be appropriate. However, it is worth highlighting that the response accuracy and mental effort outcomes for text-only items in both Tables 2, 3 are quite similar. Differences become evident when considering time-on-task, as the item sets in Table 2 appear to require more time compared to those in Table 3.
The use of coherent representational pictures yielded varied results. While some items had higher response accuracy for text-only than for text-picture items, others showed the opposite results. Nonetheless, the differences were all non-significant (see Table 4).
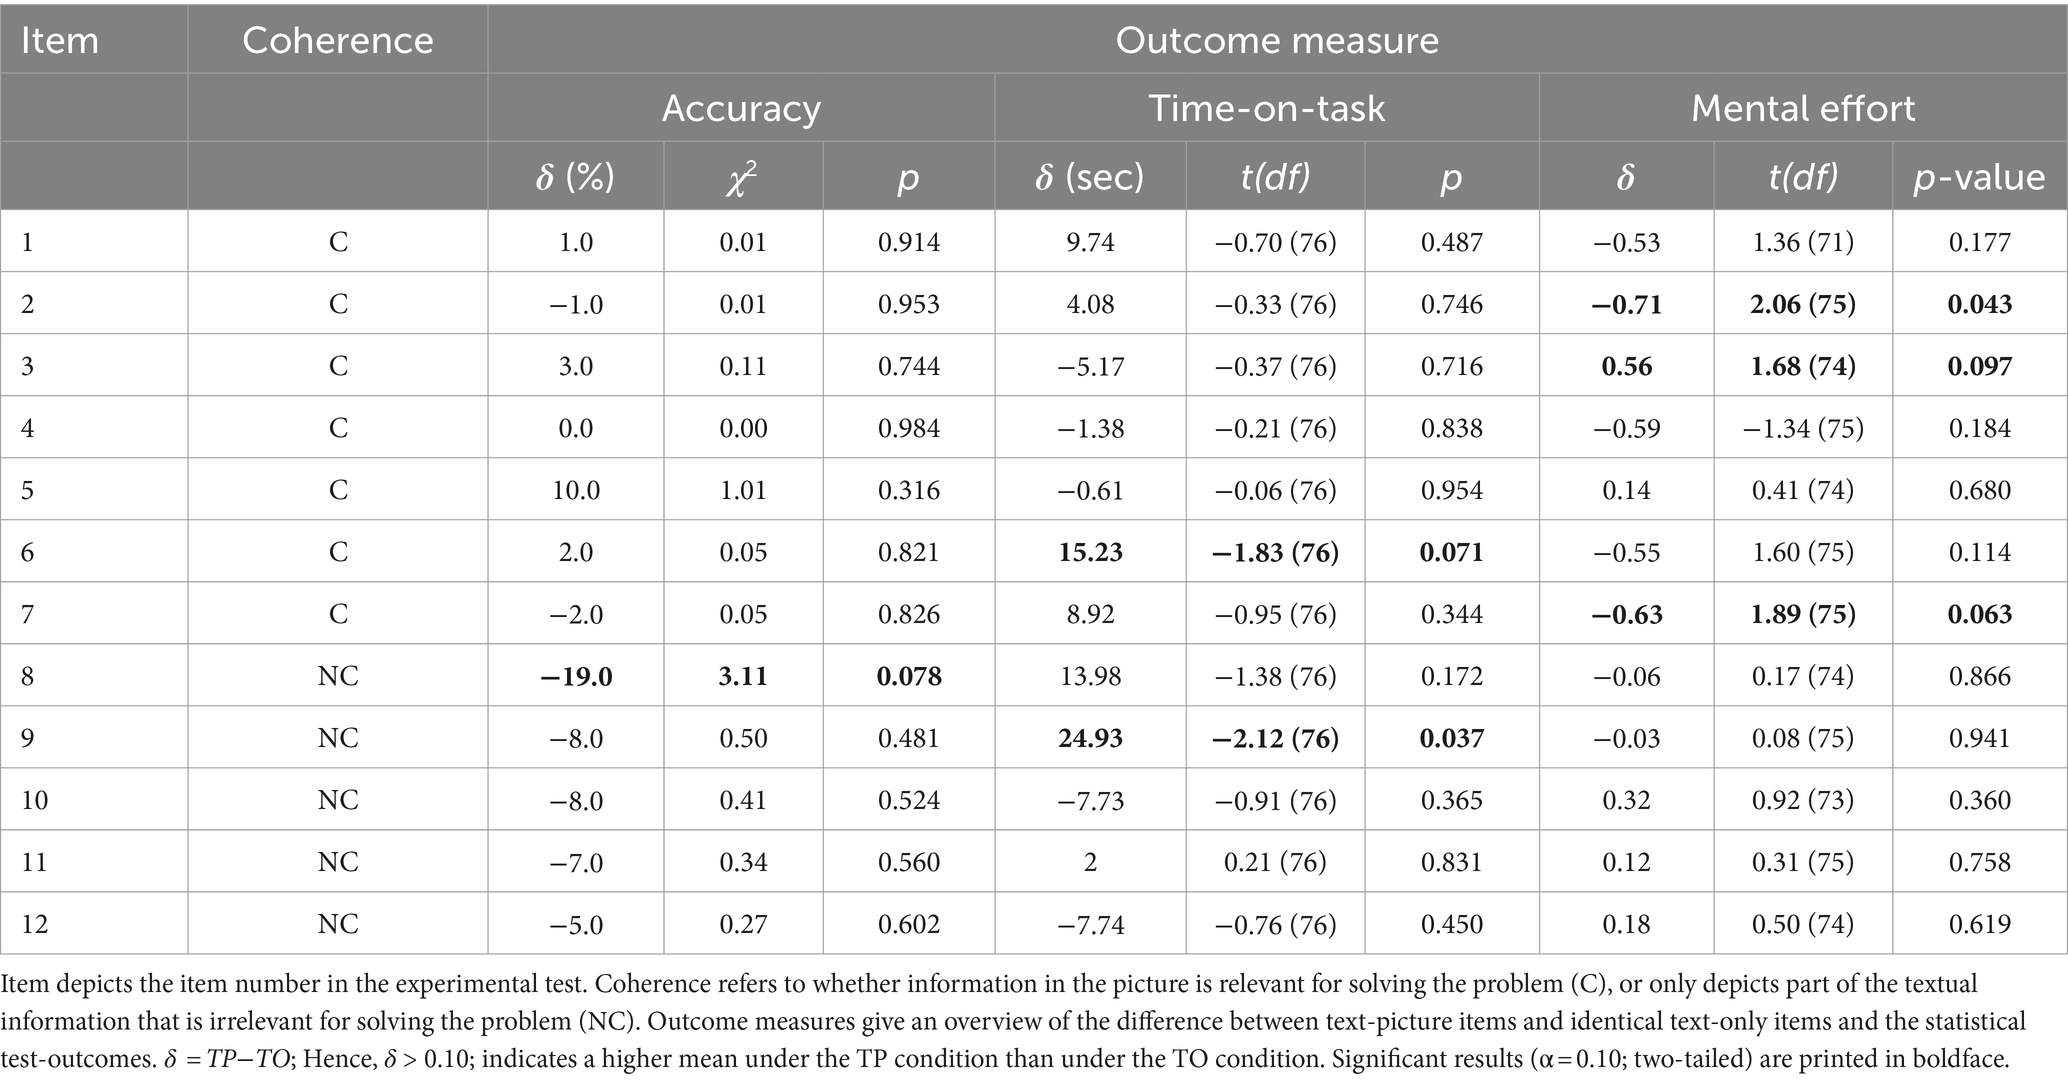
Table 4. Item-level statistics for experiment 1.
Non-coherent representational pictures resulted in lower response accuracy for test-items in comparison to text-only test items, as presented in Table 4. However, the differences were minor and only Item 8 showed a significant difference.
Regarding time on task, multimedia test-items took slightly longer to answer for seven out of twelve items (see Table 4). However, only results for Item 6 (coherent picture), and Item 9 (non-coherent picture), showed significant differences.
As presented in Table 4, subjective mental effort was somewhat lower for multimedia test-items in seven out of the twelve items (see Table 4). For Item 2 and Item 7, subjective mental effort was significantly lower for text-picture items. Both items had a coherent picture. On the other hand, for Item 3, the opposite result was obtained, and subjective mental effort was significantly higher for the text-picture item. This item also had a coherent picture.
The aim of this study was to analyze the Multimedia Effect in Testing by comparing data obtained for text-only items with data obtained for text-picture items that were text-wise identical. The variables studied were response accuracy (H1), subjective mental effort (H2), and time-on-task (H3). Contradictory to expectation, no evidence for a Multimedia Effect in Testing was found as the study failed to show significant effects on response accuracy, subjective mental effort, or time-on-task (see Table 1). Results are not completely in line with expectations, as it was anticipated to find higher response accuracy, lower mental effort and no effect on time-on-task (Hu et al., 2021).
As the pictures used in the experimental test differed in their functionality, being either coherent representational or non-coherent representational, data were further analyzed (H4). Applying the coherence principle to further specify the functionality of the picture did not provide definite insight into understanding the results at test-level, although the negative impact of non-coherent representational pictures on response accuracy was near-significant (see Table 3). The effects on subjective mental effort and time-on-task were all non-significant on test-level, but some significant differences were found for Item Set 1 (see Tables 2, 3), indicating that characteristics of specific items might influence the outcomes. It was anticipated that non-coherent representational pictures would neither harm or improve the performance of students, like in the studies of Dewolf et al. (2015) and of Berends and Van Lieshout (2009). Coherent representational pictures were anticipated to enhance performance (Lindner et al., 2018; Lindner, 2020).
Lastly, an analysis of data on item level was performed to answer the research question whether this approach would yield additional insights. At item level, a lower response accuracy was found for all items with non-coherent representational pictures. This effect was, however, only significant for one item. On average, students did not perform more accurate on items with coherent representational pictures than on text-only items. For time-on-task and subjective mental effort, results were mostly non-significant and no clear direction of effects were found (e.g., individual text-picture items score lower on subjective mental effort, or take longer to answer). The divergent findings for individual test items were anticipated based on earlier findings by Hoogland et al. (2018b), casting doubt on a universal effect sometimes mentioned in literature (Lindner et al., 2017b).
It is, however, of importance to bear in mind that a rather small number of test items was tested amongst a rather small group of participants. Hence, a second experiment was conducted to determine whether our results could be replicated.
To corroborate the findings from Experiment 1, we conducted an experiment similar in design, but with different items on a different biological topic and with different participants. By doing so, the scope of the study widens and possible unknown moderators coupled to the experimental test, test items, or the specific content of the course tested in Experiment 1 is avoided.
The participants in this study were full-time students from two teacher-training institutes. Data were collected as part of a second-year course on neurons. Seventy-three students participated with a mean age of 22.1 years (SD = 3.7), including twenty-nine males.
Materials, measures and procedure are the same as in experiment 1. A different experimental test developed and the experiment took place in a different course. In this experiment, a set of 15 items was used (Item Set 1: Cronbach’s α = 0.73; lambda-2 = 0.75; SEM = 1.61; Item Set 2: Cronbach’s α = 0.53; lambda-2 = 0.59; SEM = 1.63). More detailed information about the test administration, including the order in which text-picture and text-only items were presented in each Item Set, item difficulty, and item discrimination is added as supplemental material (see Supplementary Table S2). As a measure for engagement with the test, mean total time-on-task was determined, which was 27 min (SD = 7.7).
The complete data set comprised 73 participants. Of the 73 participants, three were removed because these students had worked on a smartphone as a test-taking device. Secondly, we removed eight cases who had a missing score on one or more items (the mean number of missing items for these cases was 10,9 with only one student missing 1 score). This sample is used to study multimedia effects for accuracy. For the remaining analyses of mental effort and time on task, we used the complete cases within this subset of 62. This approach ensured that all subjective mental effort and time-on-task scores were accompanied with a valid item response. Thus, we excluded cases who answered the Paas question without answering the item.
The data analysis is the same as in experiment 1.
Students scored somewhat, but non-significant, better for text-only items than for text-picture items (see Table 5). Statistical analysis considering that data is nested made clear that there is a significant difference in response accuracy for Item Set 3, where students perform worse for text-picture items than for text-only items.
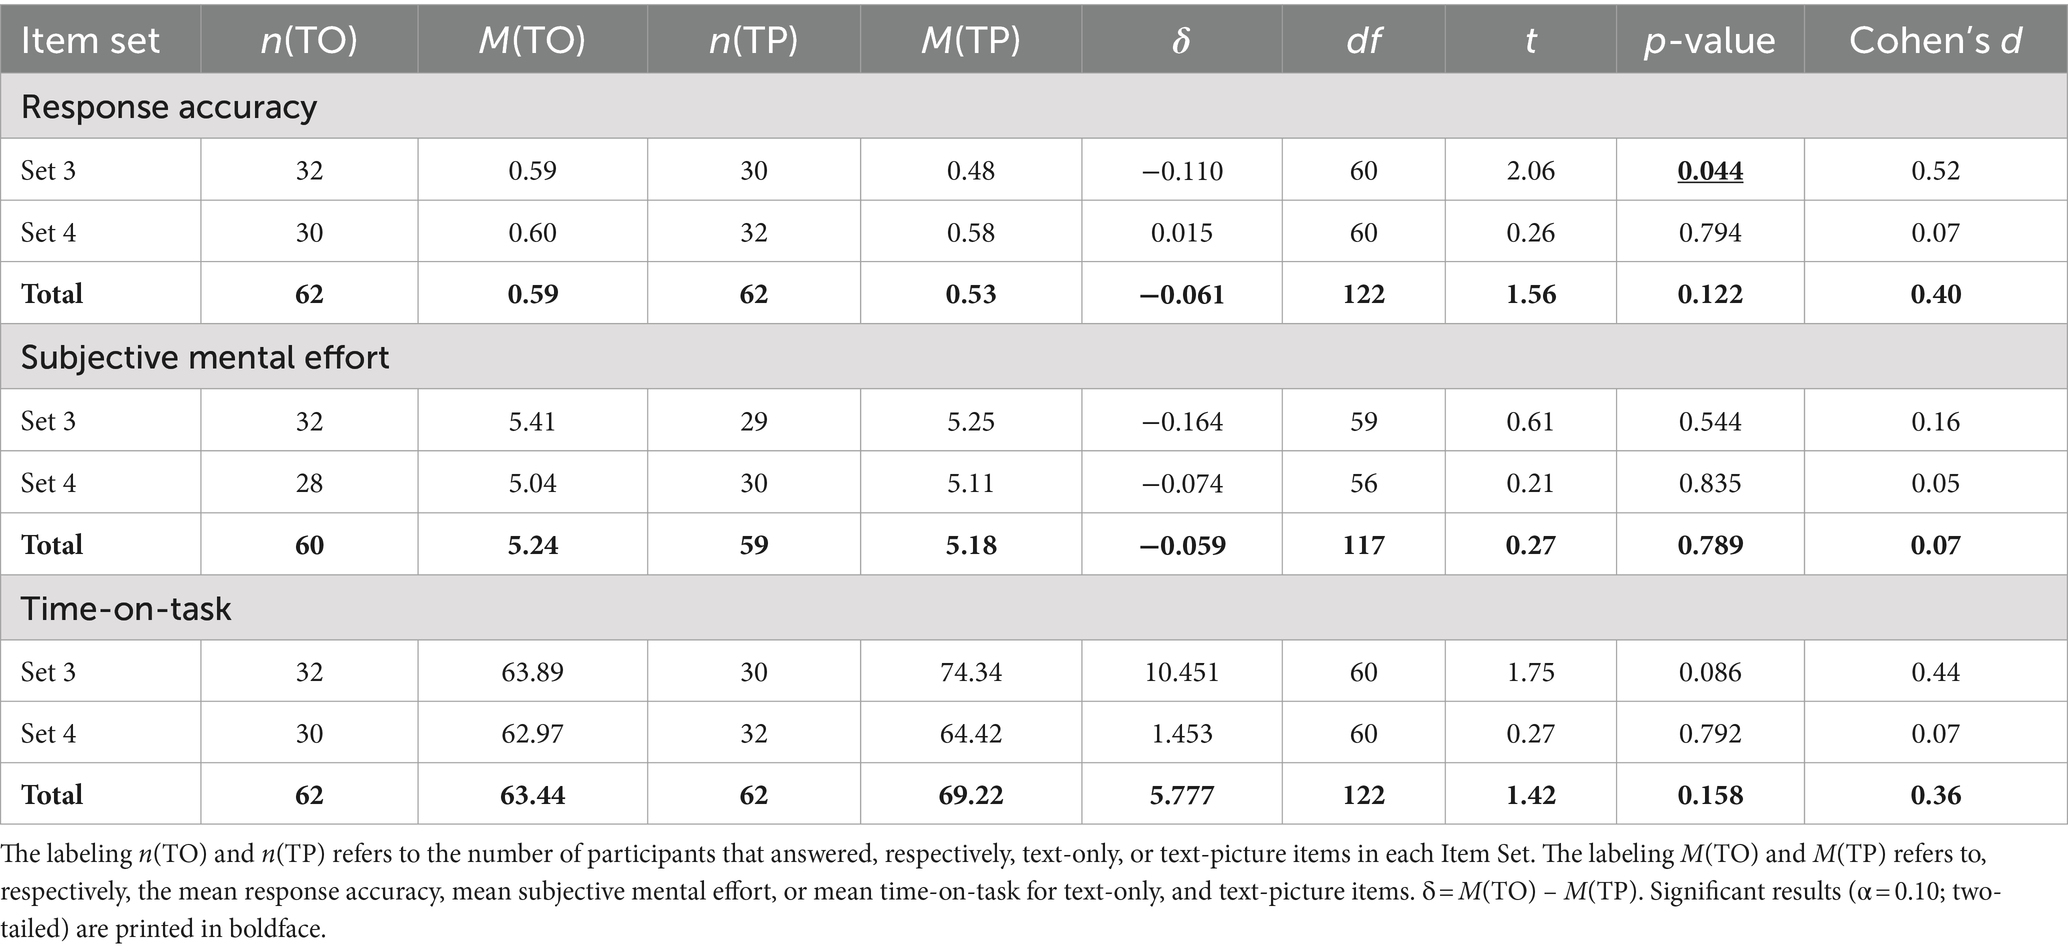
Table 5. Multimedia effects text-only and text-picture items: pooled data and data for each item set.
Subjective mental effort was slightly lower for text-picture items, but differences were non-significant (Table 5). No significant differences in mental effort between text-only items and text-picture items belonging to Item Set 3 or Item Set 4 were found either.
Time-on-task was somewhat longer for text-picture items, but differences were non-significant and no significant differences between text-only items and text-picture items belonging to Item Set 3 or Item Set 4 were found either (see Table 5).
Response accuracy was somewhat, but non-significantly, lower for text-picture items with coherent representational pictures. Subjective mental effort was lower, and time-on-task somewhat longer, but all differences were small and non-significant (see Table 6).

Table 6. Multimedia effect coherent representational pictures: pooled data and data for individual sets.
As presented in Table 7, performance was significantly lower for text-picture items with non-coherent representational pictures, and time-on-task was significantly longer. Subjective mental effort was somewhat higher, but this difference was non-significant.
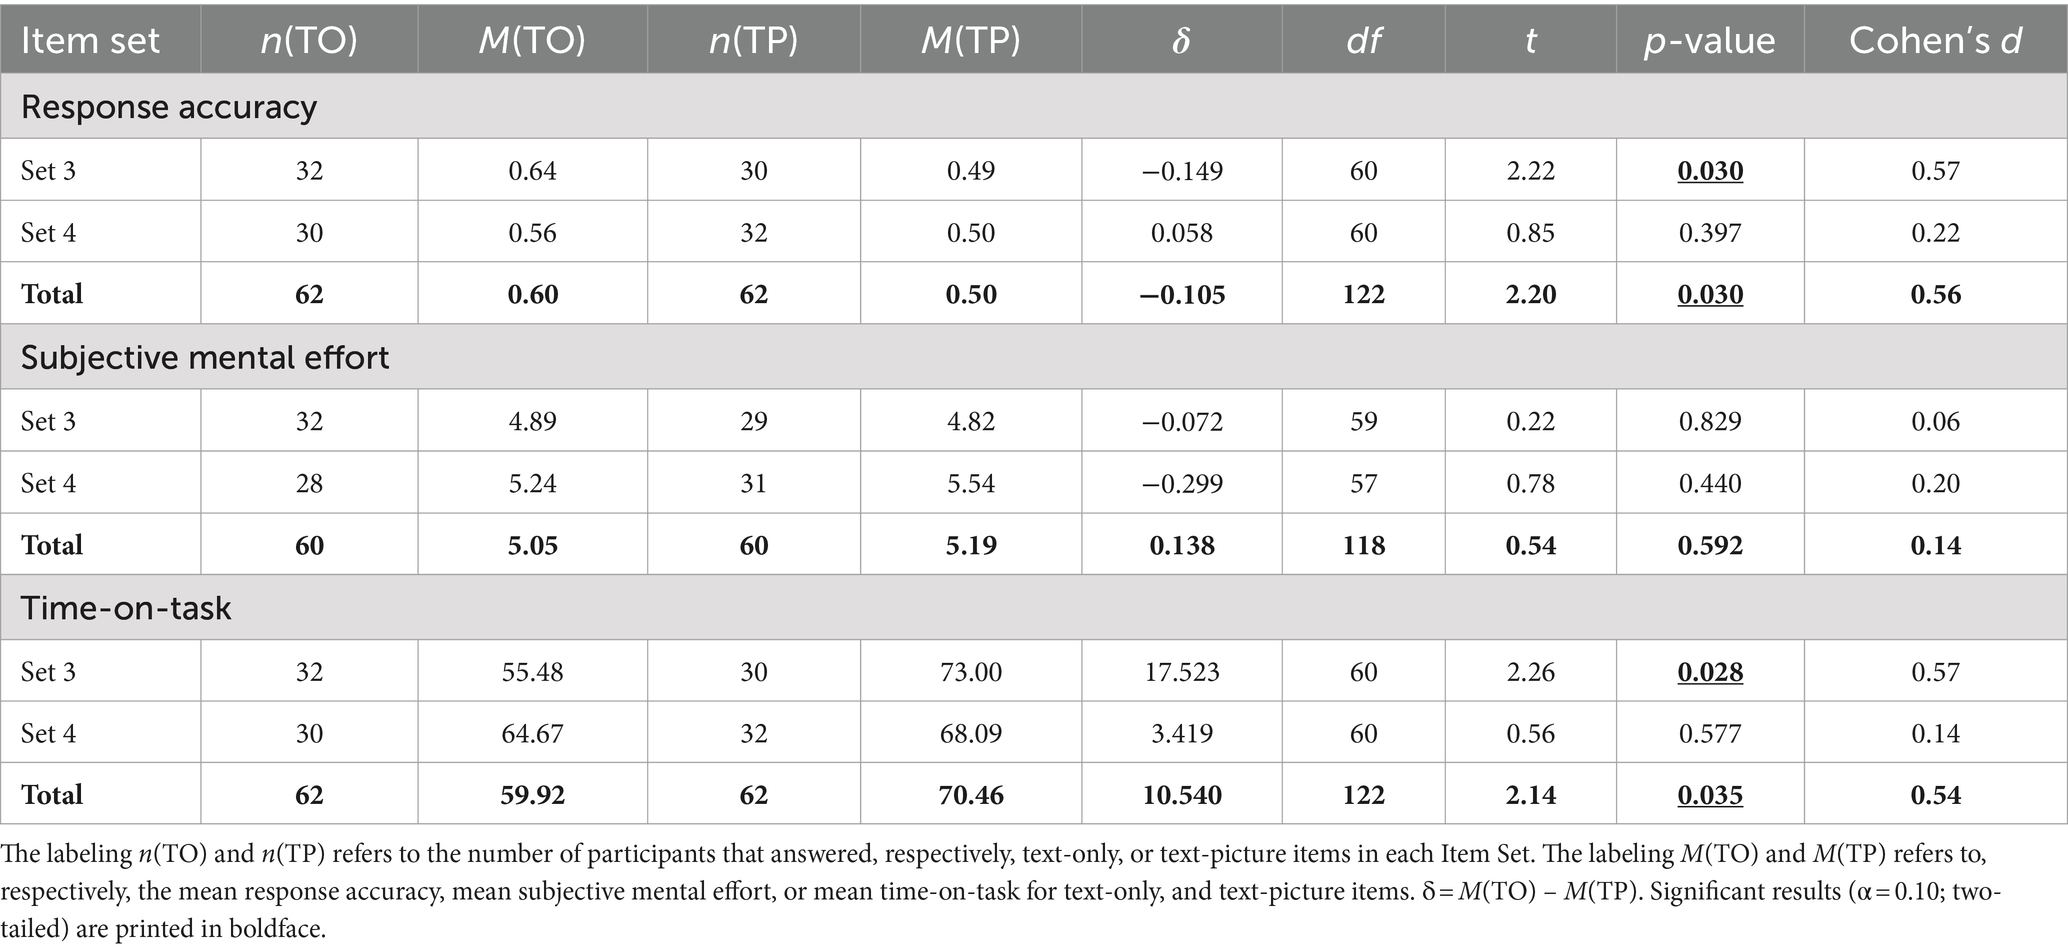
Table 7. Multimedia effect non-coherent representational pictures: pooled data and data for individual sets.
Since the data in Tables 6, 7 are derived from different test items, a direct comparison between the two tables is not valid. However, it is noteworthy that the response accuracy for the text-only items in both tables is quite similar. Differences emerge when considering mental effort and time-on-task, as the coherent sets in Table 6 appear to require more time and effort compared to the non-coherent item sets in Table 7.
As shown in Table 8, for the non-coherent set (item 8–15), response accuracy is lower for test-items with pictures than for text-only test items. One exception from this general finding was found for Item 9 with a higher response accuracy for the item with picture. The differences for individual items were, however, small and only significant for Items 12, and 13.
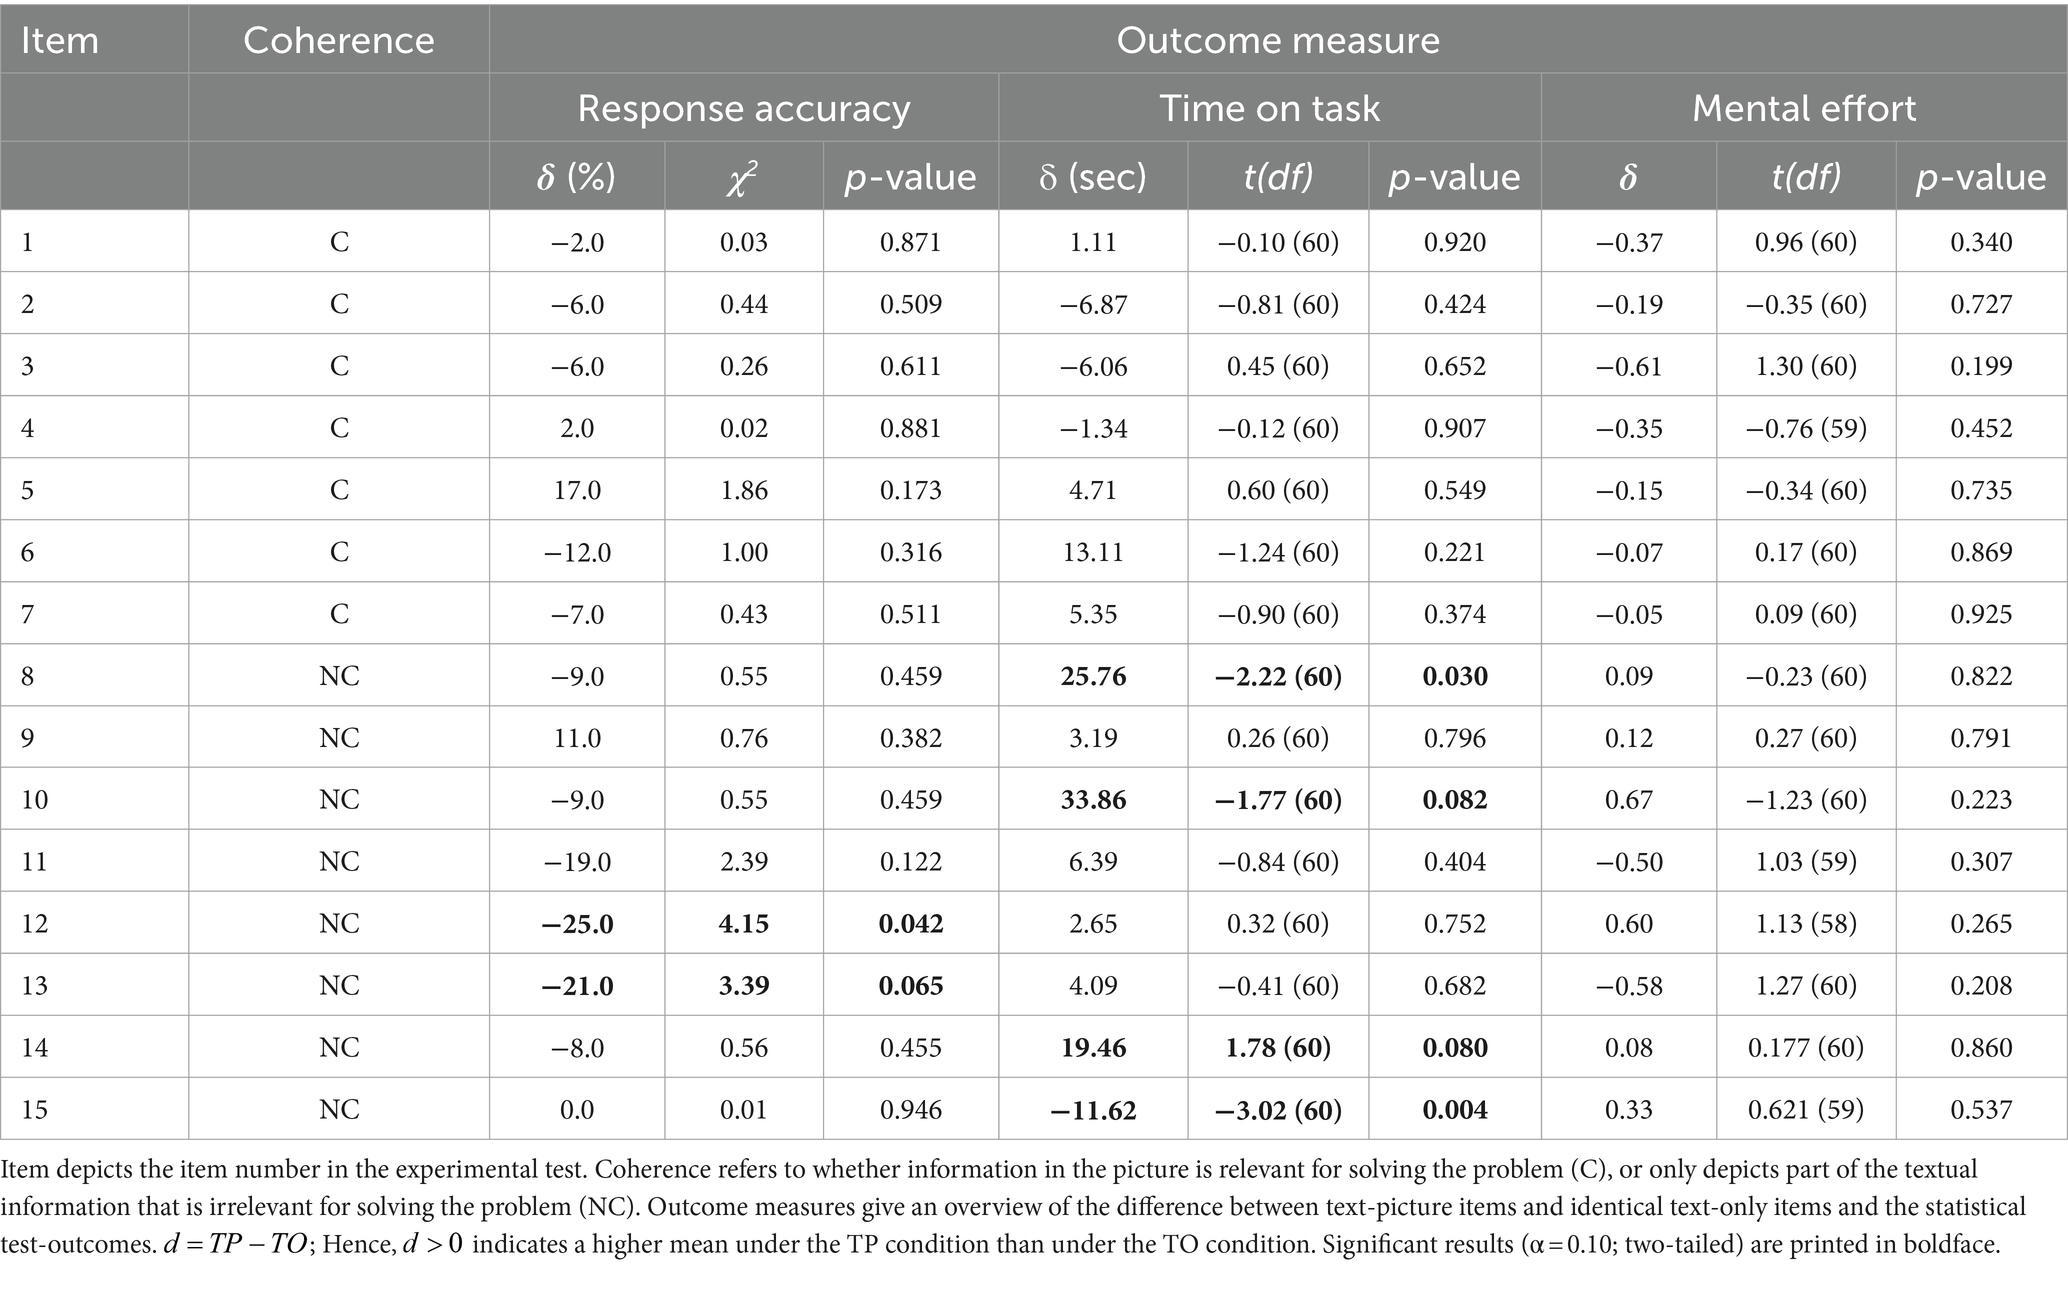
Table 8. Item-level statistics for experiment 2.
The use of coherent representational pictures led to diverse results. For some items, the response accuracy of text-only items was higher than for text-picture items, whereas for other items the opposite was true. The differences found were all non-significant (see Table 8).
For most of the items (eleven out of fifteen items), it took students somewhat more time to answer items with pictures than text-only items (see Table 8). For Item 8, 14 and 15 this difference was significant. These items included a non-coherent picture. Picture-item 8 and 14 took more time, while picture-item 15 took less time.
Subjective mental effort was for six out of the fifteen items somewhat lower for text-picture items than for text-only items (see Table 8). Differences were all non-significant.
Like experiment 1, experiment 2 did not find evidence for an enhancing effect of combining text and picture on response accuracy (H1). The current experiment did reveal significant differences in response accuracy for the items in Item Set 3, but contrary to expectation, this effect was a negative one: the presence of a picture in the item lowered response accuracy (see Table 4). The overall lowering effect on mental effort (H2), which is often described (Lindner et al., 2018; Lindner, 2020; Hu et al., 2021), was not found either (see Table 6). In line with previous studies (Saß et al., 2012; Ögren et al., 2017; Lindner et al., 2017a), no significant effect on time-on-task was found (H3).
As the pictures used in the experimental test were either coherent representational or non-coherent representational, data were further analyzed to determine whether this difference in functionality would help clarify results (H4). As mentioned, significant differences in response accuracy were found for Item Set 3. These significant effects were found only for the non-coherent representational pictures (see Table 5). As such, the coherence principle helps to explain part of the data gathered and, although not perfect, it seems useful to understand some effects of representational pictures on test outcomes. Surprisingly, items with coherent representational pictures did not show an overall improvement in response accuracy, instead showing only non-significant results. Therefore, the overall positive effect of representational pictures on response accuracy described in literature (Lindner et al., 2018; Lindner, 2020; Hu et al., 2021; Lindner et al., 2022) was not found, even when coherence was taken into account. Results for time-on-task showed an overall increase for text-picture items with non-coherent pictures (see Table 7).
Lastly, results were analyzed on item level to determine whether this approach would give more insight in the Multimedia Effect in Testing (RQ). On item level, outcomes were quite divers, with sometimes a (significant) higher response accuracy, or a shorter time-on-task for text-picture items, and sometimes a (significant) lower response accuracy, or a longer time-on-task (see Table 8). On item level, no significant effects were found for subjective mental effort. The item-level analysis of output variables does not support a universal effect, but instead point to currently unknown item characteristics apart from the functionality of the picture moderating the Multimedia Effects in Testing. Taken together, the results from experiment 2 are largely in line with those of experiment 1.
The present study, conducted in the context of higher education, failed to replicate the Multimedia Effect in Testing for representational pictures. In the present dataset, collected using a computer-based test in a formative setting, response accuracy was not enhanced (H1), and no significant effects on subjective mental effort were found (H2). In line with expectation, no overall effect on time-on-task was found (H3). Using the coherence principle to distinguish further between functionality of representational pictures (H4) led to the notion that only non-coherent representational pictures significantly affected some of the outcome measures on test-level: response accuracy and time-on-task. The effects of the non-coherent representational pictures were on test-level, however, not universal, differing between experiment 1 and experiment 2. Item-level analysis (RQ) further emphasized this notion: significant differences between text-only and text-picture items were found for only a small subset of items. Certain unknown characteristics of the test items, apart from functionality of the picture, may moderate the multimedia effects. One characteristic that might influence multimedia effects might relate to general makeup of pictures. To make sure that pictures were comparable with respect to pixel density, use of colors, etc., all pictures were taken from one and the same textbook. We are aware that the use of textbook pictures might influence performance (see for instance Schneider et al., 2020) and might influence the generalizability of the findings in comparison to studies which used test items from, for example, PISA, which includes pictures specifically developed for the test. However, in our study, we focus on multimedia effects in classroom testing.
On test-level, outcome measures for text-picture items did not significantly differ from text-only items with respect to response accuracy (H1), mental effort (H2), and time-on-task (H3) (see Tables 1, 5). Given the difference in coherence of the pictures tested, it was anticipated that possible effects would become more evident when analyzing the data for coherent representational pictures (H4). However, when focusing on items with this subset of pictures, no significant effects were found either, with the exception of coherent Item Set 1 in experiment 1, where students reported a significant lower mental effort (see Table 2). Although non-significant effects are in line with some other studies (Berends and Van Lieshout, 2009; Dewolf et al., 2015; Lindner et al., 2021), it was contrary to expectation for response accuracy and mental effort, as a majority of studies do report positive effects on these variables (Hu et al., 2021). The fact that no significant effect was found, does not seem to relate to the difficulty of the test. The mean overall response accuracy for text-only items in experiment 1 (0.45) and experiment 2 (0.59) closely matches the mean response accuracy reported in other studies that did find evidence for the Multimedia Effect in Testing [e.g., 0.52 in Lindner (2020), or 0.55 in Lindner et al. (2017a)]. Test-format, being multiple choice, is similar with previous studies that did find a Multimedia Effect in Testing as well (e.g., Saß et al., 2012; Lindner et al., 2017a,b; Lindner, 2020). Lastly, also from the perspective of sample size, the present study is not much different from many earlier studies on the Multimedia Effect in Testing. For instance, Ögren et al. (2017) studied results for 8 items answered by 36 participants, divided in an experimental and a control group, and Saß et al. (2012) studied results for 22 items answered by 184 participants, divided into six experimental conditions with groups of approximately 25 children. An explanation for not finding data supporting the Multimedia Effect in Testing might relate to the context of the study. Most other studies on representational pictures have been conducted in the context of primary education (Berends and Van Lieshout, 2009; Saß et al., 2017; Lindner et al., 2017a; Lindner, 2020). Studies done in the context of higher education, as is the case in this study, are scarcer, and often involve volunteers with little prior knowledge (e.g., Garcia-Retamero and Hoffrage, 2013; Dewolf et al., 2015). Therefore, maybe the fact that the data were gathered in the context of higher education in an (semi)authentic setting as part of a 10-week course, where only the test was manipulated for research purposes, moderated the outcomes. As such, prior knowledge, and/or prior experiences of participants might influence the Multimedia Effect in Testing. The notion that Ögren et al. (2017) did not find a multimedia effect on response accuracy either and a marginally significant increase in mental effort in a context resembling the present study might lend support to this idea. As mentioned, for Item Set 1 in experiment 1 with coherent representational pictures, a significant lowering in mental effort was found. As described below in the section on item-analysis, this result is largely the effect of mental effort reported for two specific items in Item Set 1. Finally, the use of coherent representational pictures in test items had no significant effects on time-on-task (see Tables 2, 6). This outcome of no overall effect on response time is in line with previous studies (Saß et al., 2012; Ögren et al., 2017; Lindner et al., 2017a).
The data on non-coherent representational pictures show a negative impact on response accuracy and on time-on-task, and no significant effect on mental effort (see Tables 3, 7). It was anticipated that non-coherent representational pictures would have no impact on response accuracy, similar to the results for so called optional-stem items in the study of Lindner et al. (2018) that would qualify as non-coherent in our study. For the impact on mental effort and time-on-task, we could compare only to the data on decorative pictures by Lindner (2020), since the decorative pictures in this study seem to be comparable with the non-coherent representational pictures in the present study. In the latter study no effect on response accuracy or perceived item difficulty was found, and a shortening of time-on-task. From this, it seems that our study shows divergent results. The impact of non-coherent representational pictures on the outcome measures was largely due to Item Set 1 and Item Set 3 (see Tables 3, 7), indicating that the effect is not a universal effect.
In line with the study by Hoogland et al. (2018a), comparing differences between outcome measures of text-only and text-picture items show variance between individual items (see Tables 4, 8). These differences were significant for only a few items. As such, the item-level analyses seem to indicate that the Multimedia Effect in Testing is not universal but restricted to a subset of items. Unfortunately, other studies present data only at test-level, so it is impossible to determine whether this finding is in line with expectance. The finding that only for a subset of items significant differences between text-only and text-picture items were found seems to point at additional characteristics of certain items apart from merely the presence of multimedia. The study of Hoogland et al. (2018a) mentions pictorial elements as such a characteristic. This probably refers to element interactivity: pictures can either consist of one or multiple elements that need to be simultaneously processed in the working memory because they interact on their own (Mayer, 2021). Pictures that were high in pictorial elements, and thus probably high in element interactivity, negatively influenced response accuracy in the study by Hoogland et al. (2018a). Apart from pictorial elements, one could think of many other characteristics, as the pictures used in the present study model biochemical and molecular concepts that require a substantial visual literacy of the participants. Moreover, there is also the problem to be solved and the response format (multiple choice) that can have some characteristics that may have influenced the outcome measures of the study. For instance, in the study by Saß et al. (2012) response accuracy was unaffected by text-picture format for low complexity test items, but significantly higher for high complexity test items. In the present study, all items were constructed to be as similar as possible. For instance, all items asked the participants to apply their knowledge (according to revised Bloom’s taxonomy, Krathwohl, 2002). However, the items tested several concepts rooted in molecular and cellular biology that require substantial abstract reasoning and/or basic understanding of biochemical concepts. So, apart from random sampling errors, differences in skills like abstraction or biochemical thinking, might have influenced outcomes as presented in Tables 4, 8 (and Supplementary Tables S1, S2). Taken together, the Multimedia Effect in Testing affects participants in complex (Lindner et al., 2021) and sometimes contra-intuitively ways (Jarodzka et al., 2015; Ögren et al., 2017).
The present study is a valuable addition to the field of research on the Multimedia Effect in Testing. It adds new data to the emerging field of research on multimedia testing, it explores a more comprehensive approach to categorize functionality, it explores a new approach with analyses on item-level, and it does this in the context of higher education for which there is an overall lack of data. The present study makes clear that item-level description of the Multimedia Effect in Testing has many advantages in comparison to a test-level description. Hopefully, other groups will embrace this approach. Lastly, it is of importance that more data is gathered in authentic educational setting, so that it will be clearer how the Multimedia Effect in Testing influences everyday practice in education. Based on the outcomes, it is safe to say that if there is a Multimedia Effect in Testing, it is a complex phenomenon.
The raw data supporting the conclusions of this article will be made available by the authors, without undue reservation.
JA: Funding acquisition, Investigation, Methodology, Writing – original draft, Writing – review & editing. WE: Data curation, Formal analysis, Methodology, Writing – review & editing. KD: Conceptualization, Formal analysis, Writing – review & editing. DJ-t: Conceptualization, Formal analysis, Methodology, Supervision, Writing – review & editing. HJ: Conceptualization, Methodology, Supervision, Writing – review & editing.
The author(s) declare financial support was received for the research, authorship, and/or publication of this article. This research was partly funded by Regieorgaan SIA (Grant number HBOPD.2018.04.008). Funding for open-access publication was granted by Fontys University of Applied Sciences.
The authors declare that the research was conducted in the absence of any commercial or financial relationships that could be construed as a potential conflict of interest.
All claims expressed in this article are solely those of the authors and do not necessarily represent those of their affiliated organizations, or those of the publisher, the editors and the reviewers. Any product that may be evaluated in this article, or claim that may be made by its manufacturer, is not guaranteed or endorsed by the publisher.
The Supplementary material for this article can be found online at: https://www.frontiersin.org/articles/10.3389/feduc.2024.1344012/full#supplementary-material
Baddeley, A. D., Allen, R. J., and Hitch, G. J. (2017). Binding in visual working memory: the role of the episodic buffer. Neuropsychol. 49, 1393–1400. doi: 10.4324/9781315111261-25
Berends, I. E., and Van Lieshout, E. C. D. M. (2009). The effect of illustrations in arithmetic problem-solving: effects of increased cognitive load. Learn. Instr. 19, 345–353. doi: 10.1016/j.neuropsychologia.2010.12.042
Carney, R. N., and Levin, J. R. (2002). Pictorial illustrations still improve Students' learning from text. Educ. Psychol. Rev. 14, 5–26. doi: 10.1023/A:1013176309260
Chandler, P., and Sweller, J. (1991). Cognitive load theory and the format of instruction. Cogn. Instr. 8, 293–332. doi: 10.1207/s1532690xci0804_2
Dewolf, T., Van Dooren, W., Hermens, F., and Verschaffel, L. (2015). Do students attend to representational illustrations of non-standard mathematical word problems, and, if so, how helpful are they? Instr. Sci. 43, 147–171. doi: 10.1007/s11251-014-9332-7
Dirkx, K. J. H., Skuballa, I., Manastirean-Zijlstra, C. S., and Jarodzka, H. (2021). Designing computer-based tests: design guidelines from multimedia learning studied with eye tracking. Instr. Sci. 49, 589–605. doi: 10.1007/s11251-021-09542-9
Elia, I., Gagatsis, A., and Demetriou, A. (2007). The effects of different modes of representation on the solution of one-step additive problems. Learn. Instr. 17, 658–672. doi: 10.1016/j.learninstruc.2007.09.011
Elia, I., and Philippou, G. (2004). The functions of pictures in problem solving. Bergen, Norway: International group for the psychology of mathematics education.
Garcia-Retamero, R., and Hoffrage, U. (2013). Visual representation of statistical information improves diagnostic inferences in doctors and their patients. Soc. Sci. Med. 83, 27–33. doi: 10.1016/j.socscimed.2013.01.034
Harp, S. F., and Mayer, R. E. (1997). The role of interest in learning from scientific text and illustrations: on the distinction between emotional interest and cognitive interest. J. Educ. Psychol. 89, 92–102. doi: 10.1037/0022-0663.89.1.92
Harp, S. F., and Mayer, R. E. (1998). How seductive details do their damage: a theory of cognitive interest in science learning. J. Educ. Psychol. 90, 414–434. doi: 10.1037/0022-0663.90.3.414
Hoogland, K., De Koning, J., Bakker, A., Pepin, B. E. U., and Gravemeijer, K. (2018a). Changing representation in contextual mathematical problems from descriptive to depictive: the effect on students’ performance. Stud. Educ. Eval. 58, 122–131. doi: 10.1016/j.stueduc.2018.06.004
Hoogland, K., Pepin, B., de Koning, J., Bakker, A., and Gravemeijer, K. (2018b). Word problems versus image-rich problems: an analysis of effects of task characteristics on students’ performance on contextual mathematics problems. Res. Math. Educ. 20, 37–52. doi: 10.1080/14794802.2017.1413414
Hu, L., Chen, G., and Li, P. (2021). Multimedia effect in problem solving: a meta-analysis. Educ. Psychol. Rev. 33, 1717–1747. doi: 10.1007/s10648-021-09610-z
Jarodzka, H. (2022). View on education: I see; therefore, I learn Trendsconferentie: Leren in beeld brengen.
Jarodzka, H., Janssen, N., Kirschner, P. A., and Erkens, G. (2015). Avoiding split attention in computer-based testing: is neglecting additional information facilitative? Br. J. Educ. Technol. 46, 803–817. doi: 10.1111/bjet.12174
Kerckhoffs, A. M. H., Janssen, J. P. W., Pat-El, R. J., and Jarodzka, H. (2024). LAMMP: A model for multimedia assessment [manuscript in preparation] Department of Online Learning and Instruction, Open Universiteit.
Kirschner, P. A., Park, B., Malone, S., and Jarodzka, H. (2017). “Toward a cognitive theory of multimedia assessment (CTMMA)” in Learning, design, and technology: An international compendium of theory, research, practice, and policy. eds. J. Michael Spector, B. B. Lockee, and M. D. Childress (Switzerland: Springer Nature Cham). doi: 10.1007/978-3-319-17727-4
Krathwohl, D. R. (2002). A revision of Bloom's taxonomy: an overview. Theory Pract. 41, 212–218. doi: 10.1207/s15430421tip4104_2
Levin, J. R. (1987). On empirically validating functions of pictures in prose. Psychol. Illus. 1, 51–86. doi: 10.1007/978-1-4612-4674-9_2
Lindner, M. A. (2020). Representational and decorative pictures in science and mathematics tests: do they make a difference? Learn. Instr. 68:101345. doi: 10.1016/j.learninstruc.2020.101345
Lindner, M. A., Eitel, A., Barenthien, J., and Köller, O. (2021). An integrative study on learning and testing with multimedia: effects on students’ performance and metacognition. Learn. Instr. 71:101100. doi: 10.1016/j.learninstruc.2018.01.002
Lindner, M. A., Eitel, A., Strobel, B., and Köller, O. (2017a). Identifying processes underlying the multimedia effect in testing: an eye-movement analysis. Learn. Instr. 47, 91–102. doi: 10.1016/j.learninstruc.2016.10.007
Lindner, M. A., Ihme, J. M., Saß, S., and Köller, O. (2018). How representational pictures enhance students’ performance and test-taking pleasure in low-stakes assessment. Eur. J. Psychol. Assess. 34, 376–385. doi: 10.1027/1015-5759/a000351
Lindner, M. A., Lüdtke, O., Grund, S., and Köller, O. (2017b). The merits of representational pictures in educational assessment: evidence for cognitive and motivational effects in a time-on-task analysis. Contemp. Educ. Psychol. 51, 482–492. doi: 10.1016/j.cedpsych.2017.09.009
Lindner, M. A., Schult, J., and Mayer, R. E. (2022). A multimedia effect for multiple-choice and constructed-response test items. J. Edu. Psychol. 114, 72–88. doi: 10.1037/edu0000646
Mayer, R. E. (2005). “Cognitive theory of multimedia learning” in The Cambridge handbook of multimedia learning. 41, 31–48. doi: 10.1017/CBO9780511816819.004
Mayer, R. E., Griffith, E., Jurkowitz, I. T. N., and Rothman, D. (2008). Increased interestingness of extraneous details in a multimedia science presentation leads to decreased learning. J. Exp. Psychol. Appl. 14, 329–339. doi: 10.1037/a0013835
Ögren, M., Nyström, M., and Jarodzka, H. (2017). There’s more to the multimedia effect than meets the eye: is seeing pictures believing? Instr. Sci. 45, 263–287. doi: 10.1007/s11251-016-9397-6
Paas, F. (1992). Training strategies for attaining transfer of problem-solving skill in statistics: a cognitive load approach. J. Educ. Psychol. 84, 429–434. doi: 10.1037/0022-0663.84.4.429
Parshall, C. G., Davey, T., and Pashley, P. J. (2009). “Innovative item types for computerized testing” in Computerized Adaptive Testing: Theory and Practice. eds. W. J. van der Linden and G. A. Glas (Dordrecht: Springer).
Reece, J. B., Urry, L. A., Cain, M. L., Wasserman, S. A., Minorsky, P. V., and Campbell, N. A. (2018). Campbell biology / a global approach. 11th Edn. Harlow, England: Pearson Education Limited.
Saß, S., Schütte, K., and Lindner, M. A. (2017). Test-takers’ eye movements: effects of integration aids and types of graphical representations. Comput. Educ. 109, 85–97. doi: 10.1016/j.compedu.2017.02.007
Saß, S., Wittwer, J., Senkbeil, M., and Köller, O. (2012). Pictures in test items: effects on response time and response correctness. Appl. Cogn. Psychol. 26, 70–81. doi: 10.1002/acp.1798
Schneider, S., Nebel, S., Beege, M., and Rey, G. D. (2020). The retrieval-enhancing effects of decorative pictures as memory cues in multimedia learning videos and subsequent performance tests. J. Educ. Psychol. 112, 1111–1127. doi: 10.1037/edu0000432
Sijtsma, K. (2009). On the use, the misuse, and the very limited usefulness of Cronbach’s alpha. Psychometrika 74, 107–120. doi: 10.1007/s11336-008-9101-0
Sweller, J., van Merriënboer, J. J., and Paas, F. (2019). Cognitive architecture and instructional design: 20 years later. Educ. Psychol. Rev. 31, 261–292. doi: 10.1007/s10648-019-09465-5
Keywords: computer-based testing, multimedia testing, multimedia effect, representational pictures, test design, multimedia assessment, item construction
Citation: Arts J, Emons W, Dirkx K, Joosten-ten Brinke D and Jarodzka H (2024) Exploring the multimedia effect in testing: the role of coherence and item-level analysis. Front. Educ. 9:1344012. doi: 10.3389/feduc.2024.1344012
Edited by:
Yong Luo, Pearson, United StatesReviewed by:
Yu Bao, James Madison University, United StatesCopyright © 2024 Arts, Emons, Dirkx, Joosten-ten Brinke and Jarodzka. This is an open-access article distributed under the terms of the Creative Commons Attribution License (CC BY). The use, distribution or reproduction in other forums is permitted, provided the original author(s) and the copyright owner(s) are credited and that the original publication in this journal is cited, in accordance with accepted academic practice. No use, distribution or reproduction is permitted which does not comply with these terms.
*Correspondence: Jorik Arts, Sm9yaWsuYXJ0c0Bmb250eXMubmw=
Disclaimer: All claims expressed in this article are solely those of the authors and do not necessarily represent those of their affiliated organizations, or those of the publisher, the editors and the reviewers. Any product that may be evaluated in this article or claim that may be made by its manufacturer is not guaranteed or endorsed by the publisher.
Research integrity at Frontiers
Learn more about the work of our research integrity team to safeguard the quality of each article we publish.