 Valentina Giaconi
 Manuela Mendoza
 Ngaire Honey
 Enoc Lemus-Cortez
- Instituto de Ciencias de la Educación, Universidad de O’Higgins, Rancagua, Chile
Educational inequalities in access to higher education are constituted by multiple intersecting factors that impact equity and the pursuit of tertiary studies. This study seeks to explore the disparities related to gender, socioeconomic level, rurality or urbanicity, and academic trajectory of 202,688 Chilean students who graduated from high school in 2016, to elucidate how these variables generate intersections that impact access to higher education. To carry out the analysis, an intersectionality approach was considered and an innovative quantitative model called the Multilevel Analysis of Individual Heterogeneity and Discriminant Accuracy (MAIHDA) model was applied, which allows for entering multiple variables to generate a complex analysis of their interactions. The results showed that a large amount of variance (20%) in math scores is explained by the aforementioned variables. These are socio-demographic variables, which ideally should not be indicative of one’s academic performance. It was also found that males, students of higher socioeconomic status, those from urban areas, and those with more favorable academic trajectories tend to have higher test scores. In addition, relevant interactions and mutual reinforcement between variables were identified. These results highlight the need to address the barriers and inequalities certain groups face in accessing higher education.
1 Introduction
The United Nations (UNESCO, 2022) declares that “Ensure[ing] inclusive and equitable quality education and promote[ing] lifelong learning opportunities for all” is crucial for sustainable development. Equity in access to higher education is a key aspect of this goal. Higher education has expanded during the last few decades worldwide, however, gaps in access to higher education continue to persist across multiple social groups (Valenzuela and Yáñez, 2022). This paper explores the continued differences in access across gender, socioeconomic levels, levels of rurality or urbanicity, and across school tracks and the ways in which these groupings intersect to shape the reality of educational access for individuals. The international evidence for countries in the Organization for Economic Cooperation and Development (OECD) shows that the historical gender gap in favor of men has reversed, as the number of women who access higher education has increased consistently over the last few decades (OECD, 2021). In 2019, an average of 51% of 25–34 year-old women across OECD countries held a higher education degree, compared to 39% of men. However, gender segregation in certain fields of study persists, with women being widely under-represented in STEM programs - usually associated with higher monetary returns (Arcidiacono, 2004) -, while they are over-represented in education, humanities, arts and health (OECD, 2017).
Socioeconomic gaps are present and well-established in the pathway to higher education. There is increasing evidence that they are large and widening in different national contexts (Haveman and Smeeding, 2006), such as South Korea, where access to higher education is a function of the student’s income level and/or family wealth (Lee and Vignoles, 2022).
Urban/rural gaps in access to higher education are under-researched (Trahar et al., 2020). Diagnostics identify disadvantages for students from rural sectors explained mainly by differences in socioeconomic status and access to services (Wells et al., 2019). Wells et al. (2019) show that in the United States, rurality gaps in access to postsecondary education have decreased, but persist in a changing rural context; while other studies have found persistent and significant gaps in access to higher education in other international contexts (Chankseliani et al., 2020). However, some studies find positive aspects of the rural context, as it may be associated with a protective context where students have more social resources and greater understanding, due to stronger connections within the community (Byun et al., 2012).
Regarding gaps in the schooling trajectory, studies show that this influences students’ access to post-secondary education (Frempong et al., 2012), with students from a general baccalaureate having a greater advantage over a technological baccalaureate (Duru-Bellat et al., 2008; Navarro-Cendejas, 2020). There is also evidence that the career and technical education (CTE) track may provide an opportunity to keep certain students engaged who may not be as inclined to perform well in traditional academic secondary schools and that CTE schools can lead to improved outcomes in terms of persistence and college enrollment rates (Brunner et al., 2021).
Chile is an interesting context to explore gaps in access to higher education because a series of reforms have been implemented over the last few decades to promote more inclusive and diverse student compositions. However, several educational gaps persist (Valenzuela and Yáñez, 2022). Currently, secondary education is primarily divided into two tracks: the Humanist-Scientific (H), focused on teaching traditional areas of knowledge for continuity to higher education, and the Technical-Professional (T), focused on teaching a specialty, for early access to the labor market (Sepúlveda and Valdebenito, 2019). Students from both tracks can access higher education through participation in a centralized admission system. The system selects students based on their academic performance in high school and the results achieved in a battery of standardized tests at the end of secondary education (language, math, natural sciences, and social sciences) (Santelices et al., 2018). After the tests, students can apply simultaneously to the main Chilean universities (in 2022 there were 45 universities) in a prioritized list according to their preferences and will be assigned optimally, in their best available option according to their scores.
Aligned with the international evidence, Chile shows that women are more likely to enter tertiary education before age 25 than men. At the same time, men are more likely to apply to and enter selective STEM programs (Bordón et al., 2020) and to have higher scores in science and mathematics admission tests (Alessandri and Peñafiel, 2022). Rurality status, socioeconomic status, and school track are important determinants of academic success in Chile. Regarding the impact of rurality on access to the tertiary system, the few existing studies show that students from rural secondary schools have lower scores on admission tests (Contreras et al., 2016). In turn, scholars have found that the results of the admission tests reproduce the socioeconomic inequalities carried over from previous formative levels, leading to gaps by socioeconomic status (Farías and Carrasco, 2012). Regarding the effect of school trajectory on continuity in higher education, studies indicate that students from T-mode schools obtain a lower performance in relation to their counterparts from H-mode schools (Farías and Carrasco, 2012).
Gender, urban/rural status, socioeconomic level, and school track have the potential to interact in complex ways (Byun et al., 2012; Wells et al., 2019; Brunner et al., 2021). For example, studies of student trajectories in CTE schools have found differences in the effect of enrollment across socioeconomic status and by gender, with lower-income and male students benefiting more from CTE programs for their educational trajectories than their higher-income female counterparts (Brunner et al., 2021). Therefore, it is necessary to consider an intersectionality approach to study the effects of these variables on access to higher education. The term intersectionality was first used to analyze the complex nature of black women’s marginalization (Crenshaw, 1989) to show how exclusion is not only shaped by social class, gender, race, or other social categories alone but is a situation of structural disadvantage that involves the overlapping of all of them. Usually, to study intersectionality, statistical models include interactions between the independent variables; however, this approach is not always useful because it is easy to have many combined categories, producing estimation and interpretation problems. Authors have raised concerns regarding intersectional analyses that fall into an ‘additive approach,’ which sees discrimination factors, such as class, gender, race, and others, as operating independently rather than being interrelated. For example, Yuval-Davis (2007) suggests that a better approach to understanding intersectionality is that of a “mutual constitution,” which does not seek the “union” of factors of discrimination and power, but argues that these factors of “triple oppression” are “mutually constitutive of each other” (Yuval-Davis, 2007, p. 565). Another example is the concept of “‘mutual shaping” (Walby et al., 2012), which attempts to maintain the “naming of each inequality while recognizing that it is affected by engagement with others” (Walby et al., 2012, p. 235). A novel approach to estimate intersectional effects is the Multilevel analysis of individual heterogeneity and discriminatory accuracy (MAIHDA) models (Evans et al., 2024). These models introduce random effects for modeling the social strata generated by the intersection of categories from the predictor variables. This strategy is useful for overcoming problems associated with the classical regression approach because they model the interactions with parsimony and has several statistical advantages, for example, it allows the researcher to consider the likelihood of finding individuals with the characteristics being examined. MAIHDA models have been used in several domains of health research (for example health inequalities research, precision medicine and public health) (Evans et al., 2024). There is a research call to use these models for explaining educational inequalities (Keller et al., 2023).
Based on the above, we aim to answer the following research questions:
• To what degree do complex interactions between gender, rurality, income, and track explain the differences in mathematics test scores for university entrance in Chile?
• Which interactions between these social categories are more salient to explain differences in mathematics test scores?
2 Method
2.1 Sample
The sample comprises 202,688 students who graduated from secondary school in 2016 and registered for the university selection test. We used databases from the Department of Educational Measurement and Registration (DEMRE), the agency in charge of the centralized access system (DEMRE, 2017a). In addition, we used data from the 2017 census provided by the National Institute of Statistics [INE] to characterize the districts where students live and estimate the rurality index (INE, 2017).
2.2 Variables
The selection of variables was made based on the literature review regarding relevant factors associated with access to university, and some methodological limitations were considered. First, despite the MAIHDA model’s advantages in dealing with several categorical variables, we limit the number of variables to obtain interpretable results. Also, our definition of rurality is a new proposal that needs further validation.
Standardized mathematics university admission test scores: this variable corresponds to the standardized scores from the mathematics test applied to enter the university. Psychometrics characteristics of the test can be found in (DEMRE, 2017b).
2.2.1 Gender
Gender came from administrative records and could have only two values, female or male, 52.6% of the sample was characterized as female.
2.2.2 Family income
This variable indicates the family income quintile according to the national income distribution. Originally, it was defined according to 10 decile levels, and it was recodified in 5 quintiles. The q1 corresponds to 31.6% of the sample, q2 to 30%, q3 to 17.5%, q4 to 10.3%, and q5 to 10.7%.
2.2.3 Academic track
This variable indicates the student’s school track followed in secondary education. The students from the academic track correspond to 71.3% of the sample, and those from the technical track to 28.7%.
2.2.4 Rurality
Rurality was defined using individual-level variables and information of the district of origin of the student to estimate the Students in the Access to Higher Education Rurality Index SAHE-RI (Giaconi and Varas, 2019). This index was designed in a previous study to have a multivariate view of rurality using confirmatory factor analysis models. The variables that define the index came from two sources. First, from records of the system that manages access to Chilean universities, we obtained the economic activity of the student’s parents’ occupation, these variables were coded as 1 if the parent worked in the agricultural area or 0 if not. The second source provided variables that characterize the district where the student resides and were obtained from the Census database. They include Population density, measured as people/km2; official rurality, the percentage of rural people as defined by the Chilean Census; access to services, the percentage of people with access to the public sewage network; university population, the percentage of people with a university degree; and economic activity as a percentage of the agricultural population. To use the MAIHDA model, we defined the following categories:
• R1: Students in an urban context or low rural level, corresponding to quartiles 1 and 2 of the SAHE-RI (51.4%). Quartiles 1 and 2 were collapsed into one category because the index is very asymmetric, with a large part of the population having urban characteristics.
• R2: Students in a medium rurality level, corresponding to being in the third quartile of the SAHE-RI (23.6%)
• R3: Students in a high rurality level corresponding to quartile 4 of the SAHE-RI (25%).
Strata variable: The categories from gender, family income, rurality, and school track were combined to generate a categorical variable indicating the intersected social categories. This variable had 2*5*3*2 = 60 possible values.
2.3 Analysis
We implemented the MAIHDA approach according to the guidelines of (Keller et al., 2023). First, we estimated the simple intersectional model (Model 1) defined as
Where is the standardized mathematics university admission test score of student i that belongs to strata j. With this model, we can calculate the variance partition coefficient (VPC) as
The VPC represents the percentage of the variance of that is explained by the strata. It is considered a global measure of intersectionality.
Then, we added additive effects of the explanatory variables ( , , , ), defining the intersectional interaction model (Model 2)
With this model, we can calculate the adjusted VPC ( ), which is also a global measure of intersectionality and provides information regarding the strata-level variance that is due only to complex interaction effects. Also, we can calculate the proportional change between strata variance after adding additive effects (PCV).
Finally, the random effects in Model 1 and Model 2 were estimated to measure the effect of each stratum (Figures 1, 2). These are precision-weighted estimates that consider the sample size of each stratum. The analyses were performed in R version 4.04, and the multilevel models were estimated with the lmer function of the lme4 package version 4.1.2 (Bates et al., 2015).
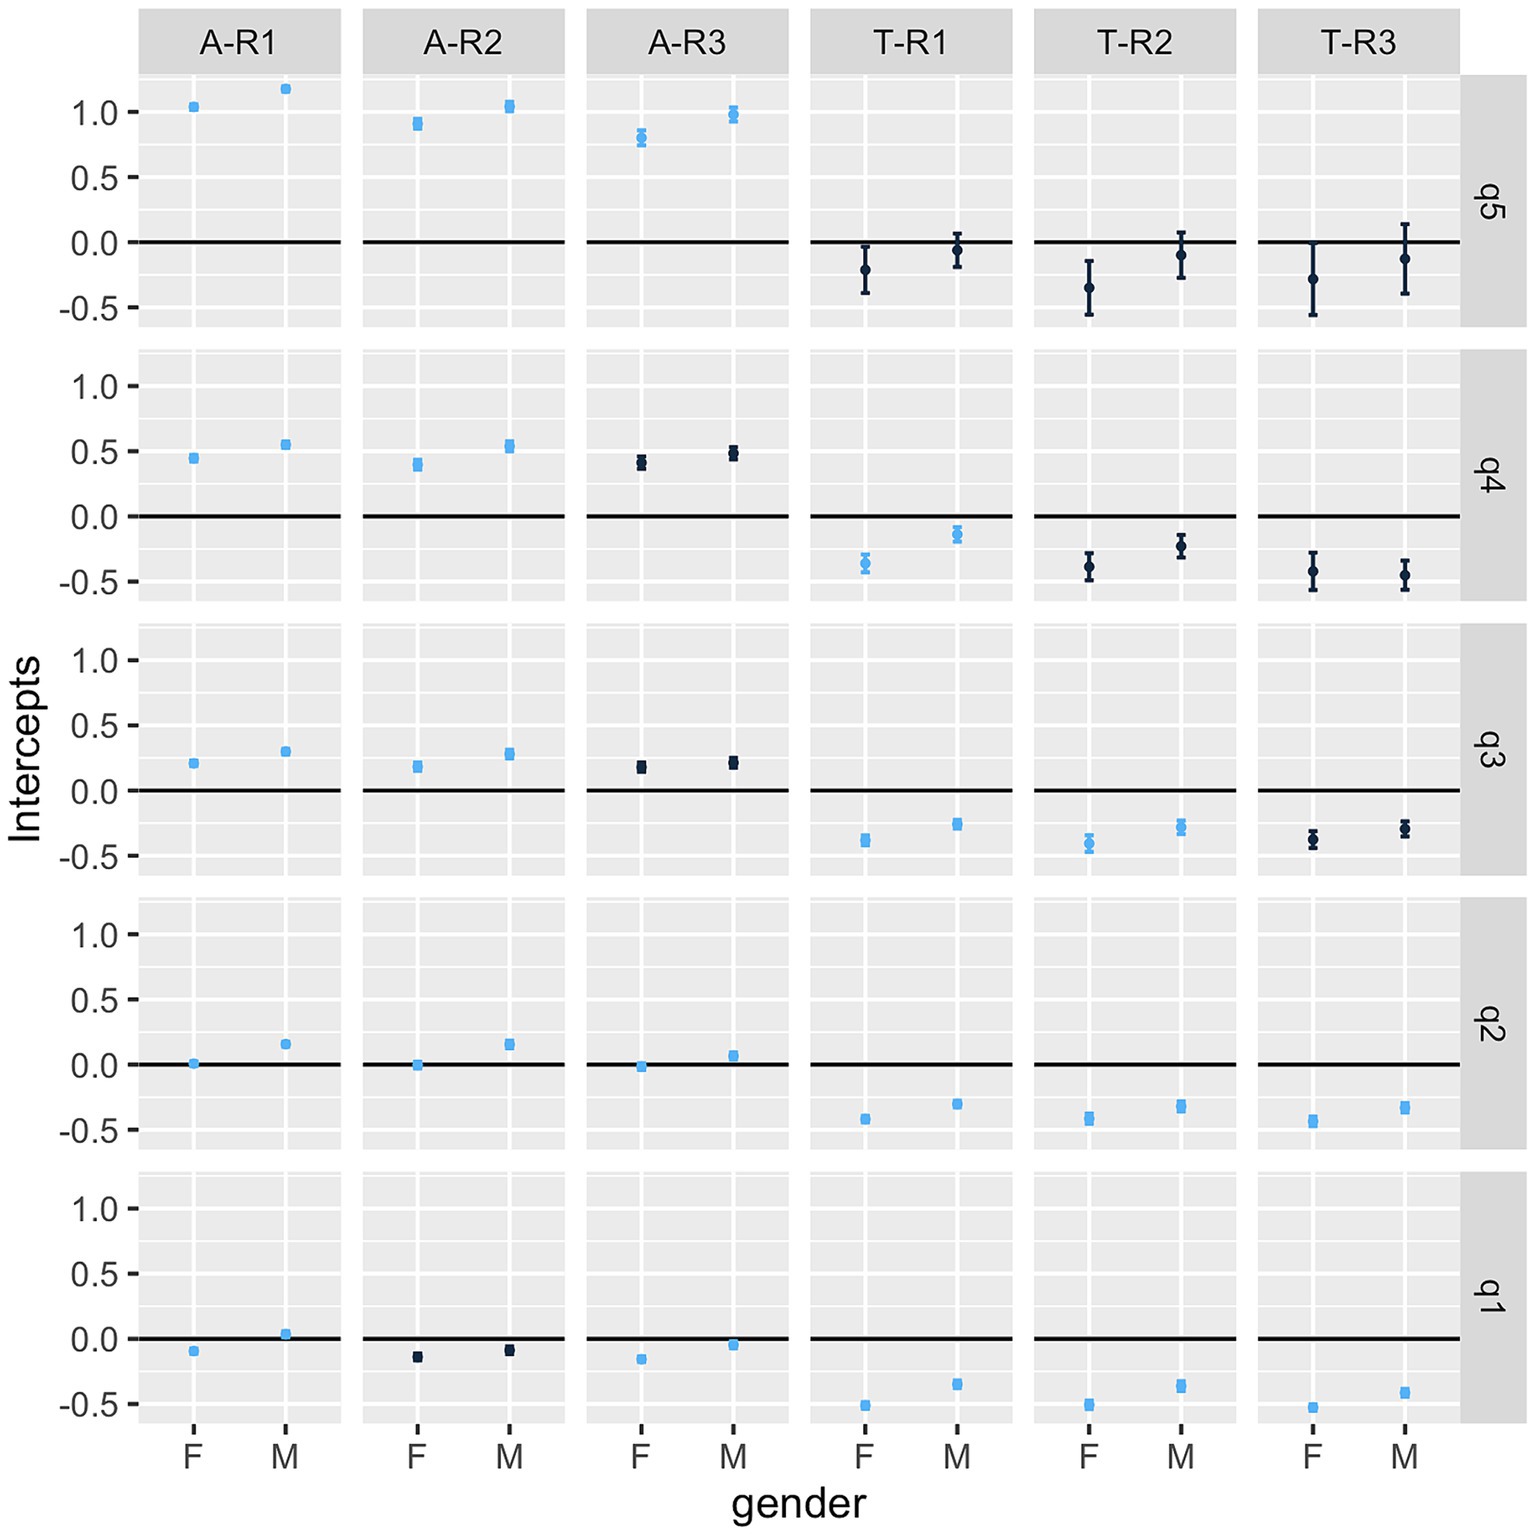
Figure 1. Precision weighted estimates of the standardized mathematics test scores residual for each stratum in Model 1 with 95% credible intervals. F, Female; M, Male; A, academic track; T, vocational track; R1-R3, Rurality groups (increasing rurality); q1-q5, income quintiles. Each marker is associated with one combined social category (for example, the first one A-R1-q5-F is the group of female urban students following an academic track and belonging to the fifth quintile of income). Significant differences between Females and Males are signaled by blue color. If a marker does not intersect with the y = 0 horizontal line, it implies that the estimate is significantly different than 0.
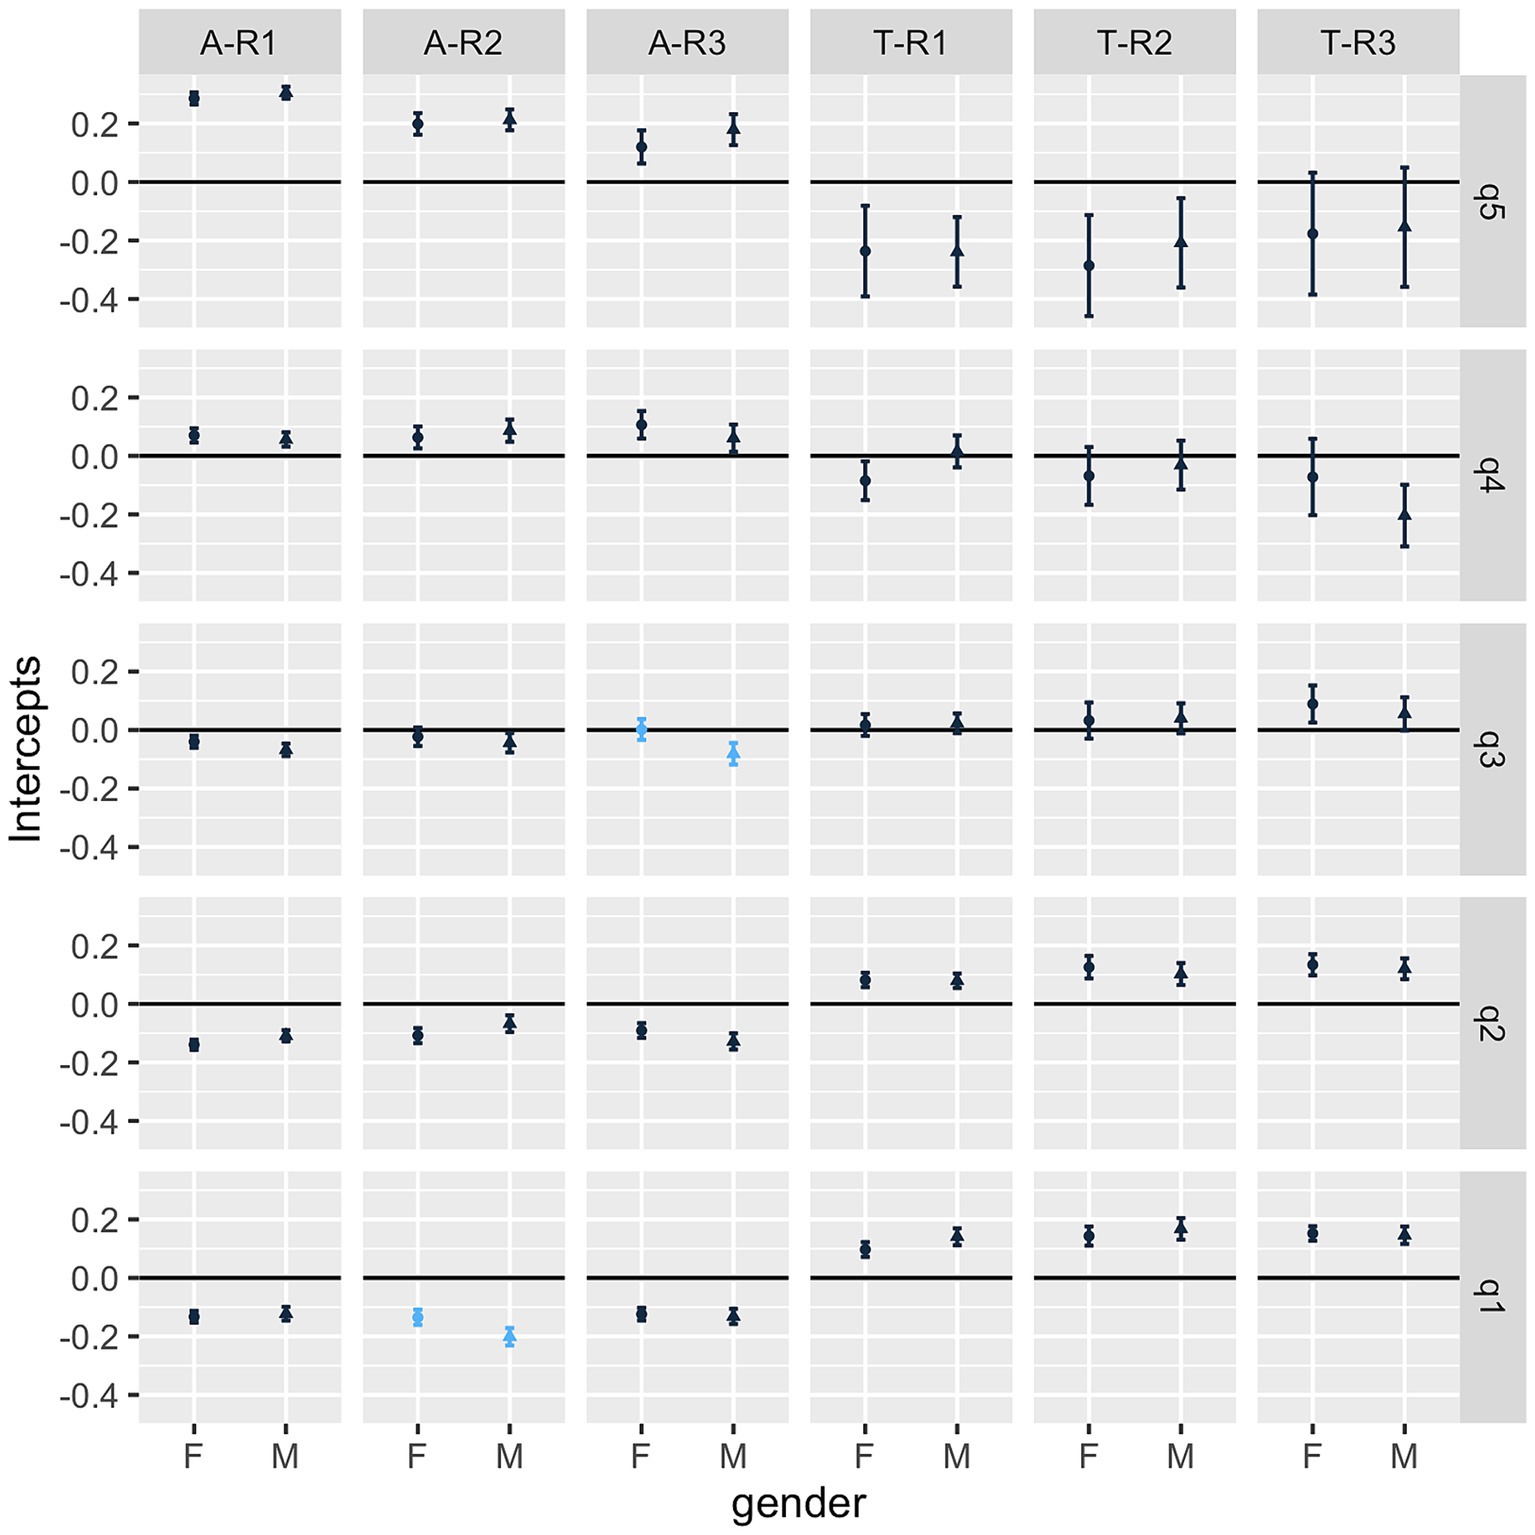
Figure 2. Precision weighted estimates of the standardized mathematics test scores residual for each stratum in Model 2 with 95% credible intervals. F, Female; M, Male; A, academic track; T, vocational track; R1-R3, Rurality groups (increasing rurality); q1-q5, income quintiles. Each marker is associated with one combined social category (for example, the first one A-R1-q5-F is the group of female urban students following an academic track and belonging to the fifth quintile of income). Significant differences between Females and Males are signaled by blue color. If a marker does not intersect with the y = 0 horizontal line, it implies that the estimate is significantly different than 0.
3 Results
Regarding the first research question, from the random effects of Model 1 (Table 1) we found that =19.8%; showing the large predicting capacity of the considered social categories on the mathematics test scores.
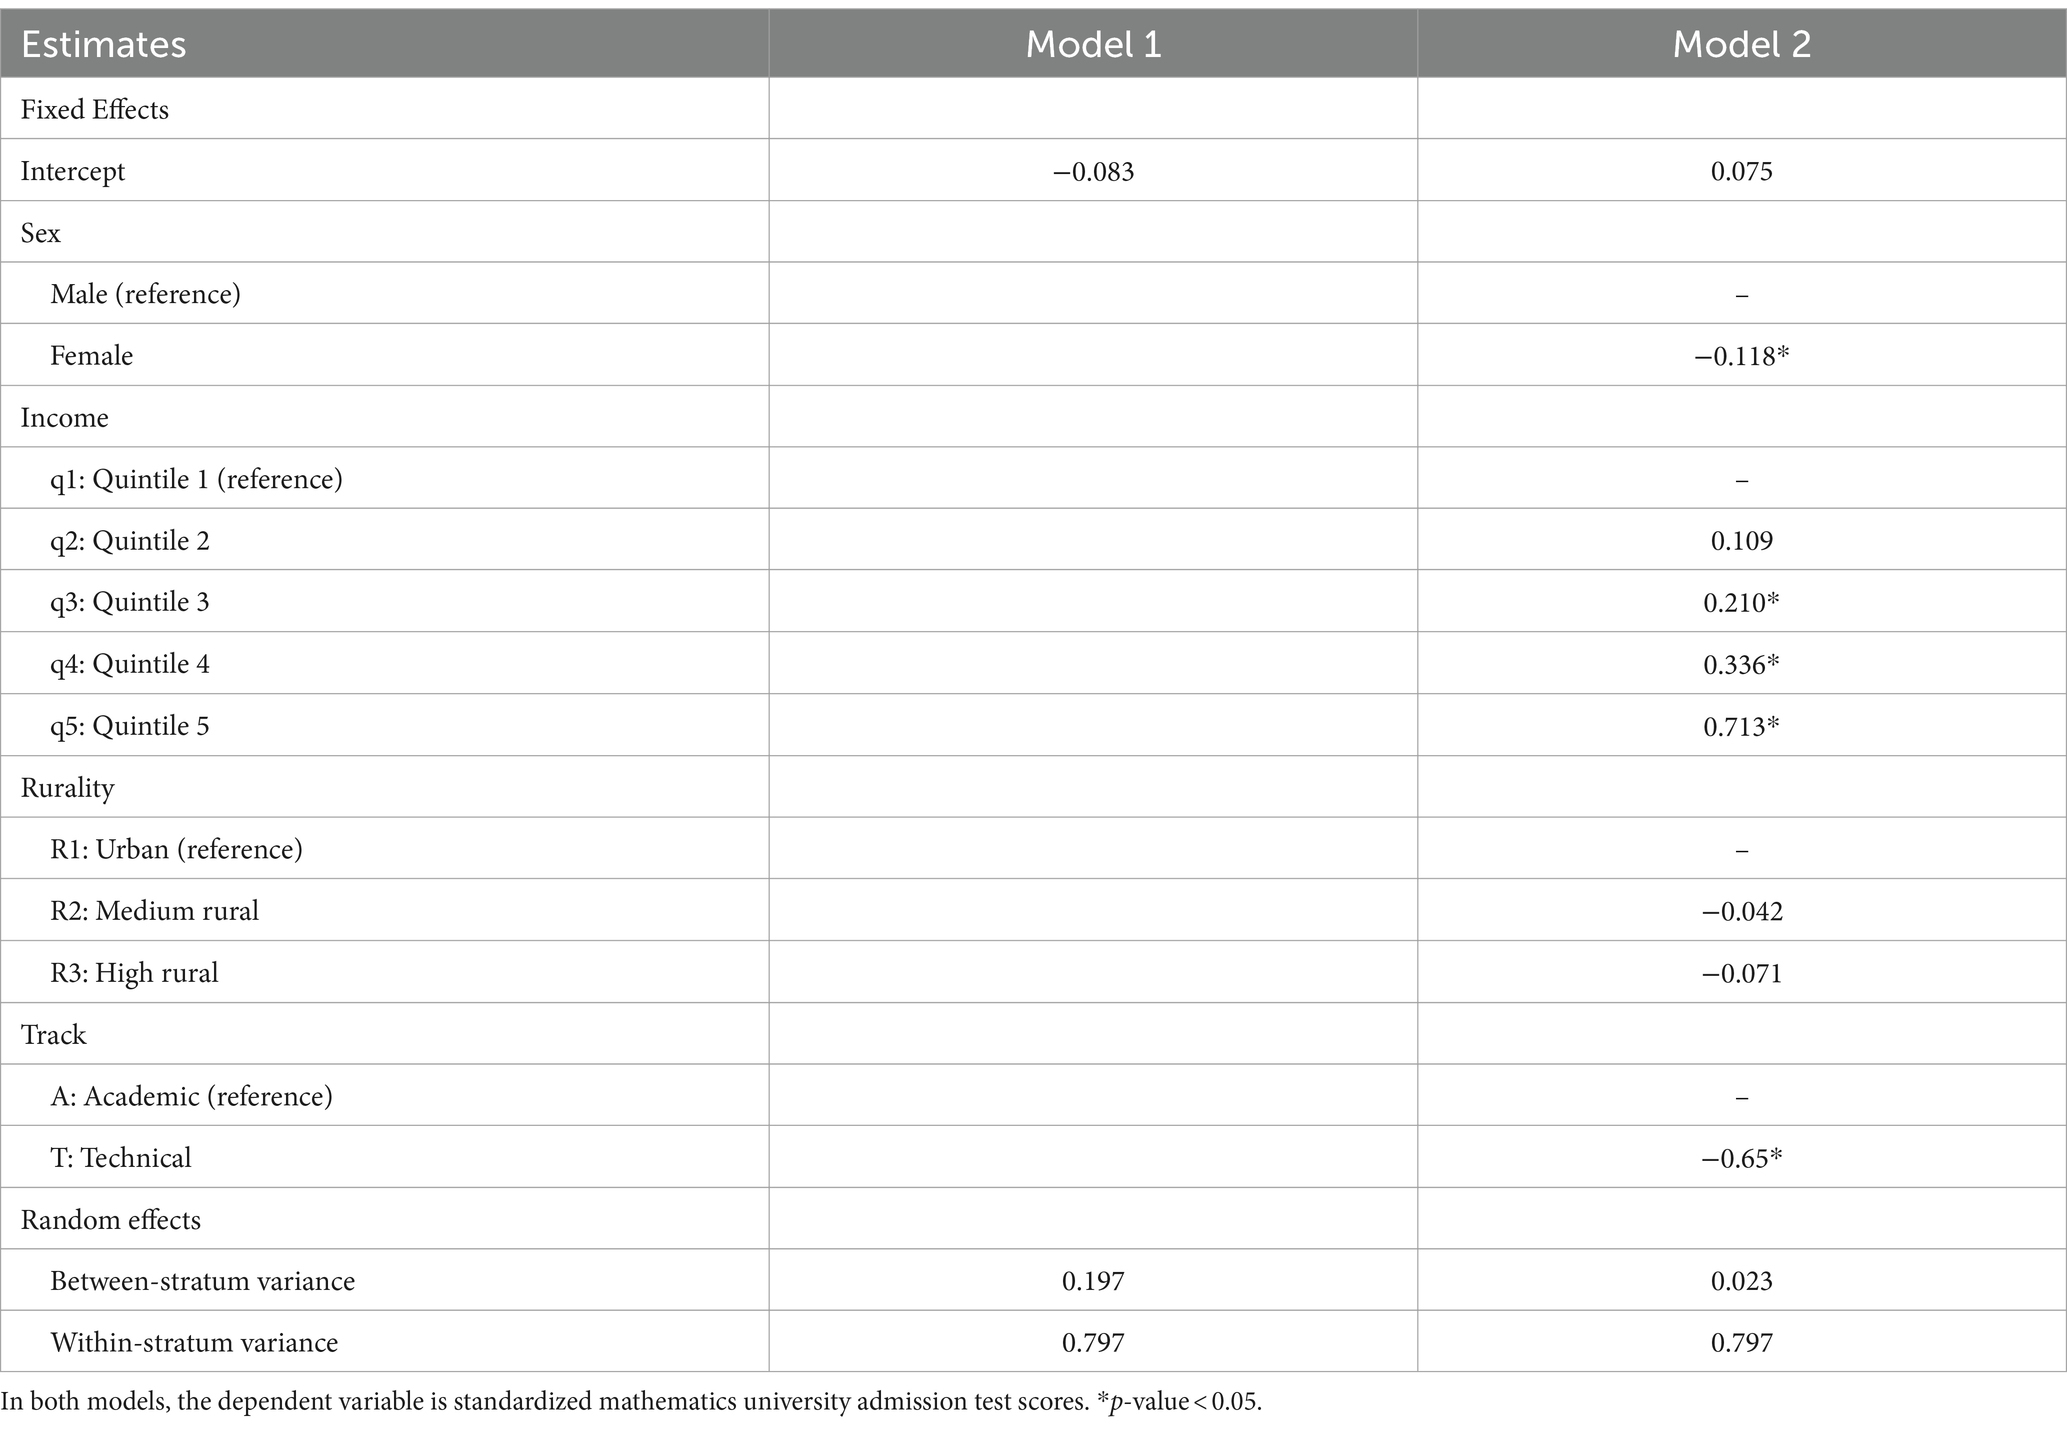
Table 1. Results for the simple intersectional model (Model 1) and the intersectional interaction model (Model 2).
To identify the variance explained by complex interactions between gender, rurality, income, and school track, we estimated Model 2, where the additive effects of these variables are modeled, therefore all the variance remaining in the random effects correspond to complex interactions. We see that in Model 2 the adjusted VPC is , showing that most of the between-stratum variation is explained by the additive effects of the variables. This percentage, which is related to the predictive power of the complex interactions, is nevertheless relevant considering the usual values of this coefficient found in the health sciences (Keller et al., 2023). The PCV shows that 88.3% of the variance at the strata level is explained by additive effects, showing that 11.7% of this variance is related to complex intersectional effects.
In Figure 1 we can see precision weighted estimates of outcomes for each stratum in model 1. They represent the expected mean in the mathematics test scores for each stratum with their 95% credible intervals.
The first thing to note is that in 20 of the 30 groups defined by the combination of academic track (A and T), rurality (R1, R2 and R3), and income quintile (q1, q2, q3, q4 and q5) there are significant differences between female and male students. The groups where there are no significant differences are the vocational tracks (T) in the higher incomes (q5 and q4). However, these combinations of characteristics (vocational tracks and higher incomes) are uncommon. This is shown by the large credible interval of their precision weighted estimates. The lack of significant differences is likely related to this scarcity rather than to actual gender equality.
Also, the students in the technical school tracks (T) have the lowest expected means for all the income and rurality levels in comparison with students from academic tracks (A). These differences are more pronounced in the higher quintiles. For instance, in the fifth quintile, most of the academic track estimates are over 1 and the technical tracks are below 0. In the fourth quintile, most of the academic track estimates are around 0.5 and the technical tracks are below 0.
Regarding the strata in the academic track (A), there is a clear order regarding income, with larger incomes having larger expected means in the standardized mathematics test scores. Then, inside each income group, there is a clear order regarding rurality, where larger levels of rurality are associated with lower test score means. In fact, the gaps increase with the increase in income quintiles.
In Figure 2, we see the estimation of the intercepts removing the additive effects, corresponding to the residuals from Model 2 ( ). We can observe complex interactions between the groups, with advantages associated with higher quintiles, academic tracks, and lower levels of rurality. In contrast, the gender effect seems to be well explained with the additive effects, since it is significant only in two groups, where it shows an advantage in favor of women.
4 Discussion
This paper has attempted to advance knowledge regarding how educational inequalities in access to higher education are constituted by individuals belonging to intersected socio-economic and educational categories. We used an innovative quantitative methodological approach called MAIHDA, a multilevel analysis that goes beyond the traditional interaction effects in regression analysis to intersectionality, and considers, in a parsimonious way, the people’s simultaneous membership in several social categories that can interact in complex ways.
With this background in mind, our research questions were: (a) To what degree do complex interactions between gender, rurality, income, and track explain the differences in mathematics test scores for university entrance in Chile? (b) Which interactions between these social categories are more salient to explain differences in mathematics test scores?
Regarding the first research question, our results show that a large amount of variance (19.8%) in the mathematics test scores is explained by gender, rurality, income, and track, considering their additive effects and all possible interactions. This is a concerning finding since none of these factors directly assess academic performance, such as grades or test scores. The mathematics tests should measure academic learning and competencies rather than be strongly related to socio-demographic variables. However, this is the case in Chile, and the MAIHDA model allows us to estimate the degree to which socio-demographic variables are related to existing measures of academic learning. The results show that, after controlling for additive effects, 2.8% of the variance in the test scores is explained by complex interactions between gender, rurality, income, and school track. This result shows that the additive effects of the three considered categories explain most of the variance in the mathematics test scores. However, after comparing this percentage (2.8%) with coefficients found in previous studies applying MAIHDA in health research (which, in general, are lower according to Keller et al., 2023), we can argue that the predictive power of the complex interactions, beyond the additive effects, is relevant, although more research using MAIHDA on education is necessary to contextualize these effects.
Concerning our second research question, the analyses confirm the presence of significant complex interactions, which show a synergy that favors male students in academic tracks, from families with higher incomes, and residing in the most urban contexts (Figure 1). In contrast, after controlling for additive effects, in most groups, there are no longer significant differences in terms of gender. However, in two groups women have a small advantage over men, although this is very slight (Figure 2, A-R2-q1: academic track, medium rurality level and first quintile of income, A-R3-q3: academic track, a large rurality level and third quintile of income). Interestingly, students who are most urban, have the highest socioeconomic level (quintile 5), and come from an academic school track maintain a large advantage for university entrance after controlling for additive effects. This finding shows that these social categories mutually reinforce each other’s effect, which is coherent with an understanding of intersectionality as “mutual shaping” (Walby et al., 2012). Along the same lines, we also identified a synergy against particular combinations of social categories, for example, for students from the academic track and the lowest quintile (e.g., A-R2-q1, A-R1-q1). Another relevant finding is that the effect of being in the vocational-technical track and in the high-income quintiles (T-R1-q5, T-R2-q5, T-R3-q5) is estimated with considerable error because they are composed of small populations. The proper estimation of this error is an advantage of the MAIHDA model, as it considers the stratum’s size when analyzing the associations between multiple variables.
Through our analyses, we wanted to explore the potential of MAIHDA as an innovative quantitative methodological approach, which has been scarcely used in the field of education so far. We argue that this is an approach with high potential for understanding the intersections shaping inequalities since it is better aligned with complex theoretical developments of the concept of intersectionality (e.g., Yuval-Davis, 2007; Walby et al., 2012) compared to the classical regression models with interaction effects, which have methodological disadvantages, such as having too many parameters when the number of categories grows, the estimations do not consider the sample size of each combination of categories, among others (Keller et al., 2023). In fact, MAIHDA may be helpful in understanding educational inequalities as shaped by interrelated (rather than independent) categories that are affected by their mutual engagement.
We identify at least three areas where future research on educational inequalities could benefit from using MAIHDA. First, it would be interesting to think of other combinations of variables to be included in the analyses, for example, ethnicity, to have a more thorough understanding of how intersections play a role in shaping social advantage and exclusion. In addition, we would encourage the use of MAIHDA to explore educational inequalities in a variety of national contexts since this would enable the identification of possible similarities and differences between countries regarding the intersection of factors that mold access to higher education. Finally, we strongly recommend complementing quantitative analyses guided by the MAIHDA approach with qualitative studies to favor a richer interpretation of the results and potential identification of mechanisms for understanding why particular combinations of categories are associated with particular educational outcomes.
Data availability statement
The original contributions presented in the study are included in the article/supplementary material, further inquiries can be directed to the corresponding author.
Author contributions
VG: Conceptualization, Data curation, Formal analysis, Funding acquisition, Methodology, Project administration, Resources, Supervision, Validation, Writing – original draft, Writing – review & editing. MM: Methodology, Writing – original draft, Writing – review & editing. NH: Writing – original draft, Writing – review & editing. EL-C: Writing – original draft, Writing – review & editing.
Funding
The author(s) declare that financial support was received for the research, authorship, and/or publication of this article. This work was supported by ANID CONICYT FONDECYT INICIACIÓN under Grant Folio 11180798, ANID/PIA/Basal Funds for Centres of Excellence FB210005 and FB0003.
Conflict of interest
The authors declare that the research was conducted in the absence of any commercial or financial relationships that could be construed as a potential conflict of interest.
Publisher’s note
All claims expressed in this article are solely those of the authors and do not necessarily represent those of their affiliated organizations, or those of the publisher, the editors and the reviewers. Any product that may be evaluated in this article, or claim that may be made by its manufacturer, is not guaranteed or endorsed by the publisher.
References
Alessandri, F., and Peñafiel, A. M. (2022). Análisis de brechas de puntajes en la PSU y prueba de transición. Available at: https://accioneducar.cl/analisis-de-brechas-en-puntajes-en-la-psu-y-prueba-de-transicion-pdt/
Arcidiacono, P. (2004). Ability sorting and the returns to college major. J. Econ. 121, 343–375. doi: 10.1016/j.jeconom.2003.10.010
Bates, D., Mächler, M., Bolker, B., and Walker, S. (2015). Fitting linear mixed-effects models using lme4. J. Stat. Softw. 67, 1–48. doi: 10.18637/jss.v067.i01
Bordón, P., Canals, C., and Mizala, A. (2020). The gender gap in college major choice in Chile. Econ. Educ. Rev. 77:102011. doi: 10.1016/j.econedurev.2020.102011
Brunner, E. J., Dougherty, S. M., and Ross, S. L. (2021). The effects of career and technical education: evidence from the Connecticut technical high school system. Rev. Econ. Stat. 105, 1–46. doi: 10.1162/rest_a_01098
Byun, S., Meece, J. L., and Irvin, M. J. (2012). Rural-nonrural disparities in postsecondary educational attainment revisited. Am. Educ. Res. J. 49, 412–437. doi: 10.3102/0002831211416344
Chankseliani, M., Gorgodze, S., Janashia, S., and Kurakbayev, K. (2020). Rural disadvantage in the context of centralised university admissions: a multiple case study of Georgia and Kazakhstan. Compare 50, 995–1013. doi: 10.1080/03057925.2020.1761294
Contreras, M. A., Corbalán, F., and Redondo, J. (2016). Cuando la Suerte está Echada: Estudio Cuantitativo de los Factores Asociados al Rendimiento en la PSU. REICE. Revista Iberoamericana Sobre Calidad, Eficacia Y Cambio En Educación, 5, 259–263. doi: 10.15366/reice2007.5.5.029
Crenshaw, K. W. (1989). Demarginalizing the Intersection of Race and Sex The University of Chicago Legal Forum. 139–167.
DEMRE (2017a). Data from: Datos de inscripción a la PSU del proceso de admisión 2017. Available at: https://demre.cl/portales/portal-bases-datos
DEMRE (2017b). PRUEBA DE SELECCIÓN UNIVERSITARIA Informe Técnico Admisión 2017. Available at: https://demre.cl/estadisticas/documentos/informes/2017-informe-tecnico-psu-p2017.pdf
Duru-Bellat, M., Kieffer, A., and Reimer, D. (2008). Patterns of social inequalities in access to higher education in France and Germany. Int. J. Comp. Sociol. 49, 347–368. doi: 10.1177/0020715208093081
Evans, C. R., Leckie, G., Subramanian, S. V., Bell, A., and Merlo, J. (2024). A tutorial for conducting intersectional multilevel analysis of individual heterogeneity and discriminatory accuracy (MAIHDA). SSM Populat. Health 26:101664. doi: 10.1016/j.ssmph.2024.101664
Farías, M., and Carrasco, R. (2012). Diferencias en resultados académicos entre educación técnico-profesional y humanista-científica en Chile. Calidad en Educación 87–121, 87–121. doi: 10.4067/S0718-45652012000100003
Frempong, G., Ma, X., and Mensah, J. (2012). Access to postsecondary education: can schools compensate for socioeconomic disadvantage? High. Educ. 63, 19–32. doi: 10.1007/s10734-011-9422-2
Giaconi, V., and Varas, L. (2019). Rurality gaps in the access to higher education: Initial estimations. Santiago: International Meeting of the Psychometric Society.
Haveman, R. H., and Smeeding, T. M. (2006). The role of higher education in social mobility. Futur. Child. 16, 125–150. doi: 10.1353/foc.2006.0015
INE (2017). Data from: Resultados CENSO 2017 Available at: http://resultados.censo2017.cl/Home/Download (Accessed January 1, 2020).
Keller, L., Luedtke, O., Preckel, F., and Brunner, M. (2023). Educational inequalities at the intersection of multiple social categories: a n introduction and systematic review of the multilevel analysis of individual heterogeneity and discriminatory accuracy (MAIHDA) approach. Educ. Psychol. Rev. 35:31. doi: 10.1007/s10648-023-09733-5
Lee, S., and Vignoles, A. (2022). Does college level the playing field? Socioeconomic gaps in the earnings of similar graduates: evidence from South Korea. High. Educ. 83, 1335–1354. doi: 10.1007/s10734-021-00745-0
Navarro-Cendejas, J. (2020). ¿Importa el tipo de bachillerato? Transiciones después de la educación media superior: Diferencias entre programas generales y tecnológicos. Rev. Mex. Investig. Educ. 25, 153–178.
Santelices, M. V., Horn, C., and Catalán, X. (2018). The quest for equity in Chile’s higher education: Decades of continued efforts. Washington, DC: Rowman & Littlefield.
Sepúlveda, L., and Valdebenito, M. J. (2019). ¿Estudiar para trabajar? Transición educativa-laboral de los egresados de la Educación Técnico Profesional en Chile. Psicoperspectivas 18, 1–14. doi: 10.5027/psicoperspectivas-Vol18-Issue3-fulltext-1661
Trahar, S., Timmis, S., Lucas, L., and Naidoo, K. (2020). Rurality and access to higher education. Compare 50, 929–942. doi: 10.1080/03057925.2020.1810895
UNESCO (2022). Education inequalities indicators (higher education attendance by location) [data set]. Available at: https://www.education-inequalities.org/indicators/higher_1822#ageGroup=%22attend_higher_1822%22&dimension=%7B%22id%22%3A%22community%22%2C%22filters%22%3A%5B%22Urban%22%2C%22Rural%22%5D%7D&countries=%5B%5D
Valenzuela, J. P., and Yáñez, N. (2022). Trajectory and policies for inclusion in higher education in Latin America and the Caribbean in the context of the pandemic: Two decades of progress and challenges. Available at: https://hdl.handle.net/11362/47979
Walby, S., Armstrong, J., and Strid, S. (2012). Intersectionality: multiple inequalities in social theory. Sociology 46, 224–240. doi: 10.1177/0038038511416164
Wells, R. S., Manly, C. A., Kommers, S., and Kimball, E. (2019). Narrowed gaps and persistent challenges: examining rural-nonrural disparities in postsecondary outcomes over time. Am. J. Educ. 126, 1–31. doi: 10.1086/705498
Keywords: academic/vocational gaps, access to higher education, gender gaps, intersectionality, socioeconomic gaps, urban/rural gaps
Citation: Giaconi V, Mendoza M, Honey N and Lemus-Cortez E (2024) The intersection of gender, rurality, income and school track in the university access mathematics tests scores. Front. Educ. 9:1306426. doi: 10.3389/feduc.2024.1306426
Edited by:
Noelia Morales-Romo, University of Salamanca, SpainReviewed by:
Silvia Moscatelli, University of Bologna, ItalyLongcun Sun, Jiangsu Normal University, China
Copyright © 2024 Giaconi, Mendoza, Honey and Lemus-Cortez. This is an open-access article distributed under the terms of the Creative Commons Attribution License (CC BY). The use, distribution or reproduction in other forums is permitted, provided the original author(s) and the copyright owner(s) are credited and that the original publication in this journal is cited, in accordance with accepted academic practice. No use, distribution or reproduction is permitted which does not comply with these terms.
*Correspondence: Valentina Giaconi, dmFsZW50aW5hLmdpYWNvbmlAdW9oLmNs
†ORCID: Manuela Mendoza, https://orcid.org/0000-0001-6043-4212
Ngaire Honey, https://orcid.org/0000-0001-8592-1148
Enoc Lemus-Cortez, https://orcid.org/0009-0009-0670-212X