- Loyola Behavioral Lab and Department of Economics, Universidad Loyola Andalucía, Seville, Spain
We propose an outdoor activity for game theory courses in which students are invited to fly self-made paper airplanes to earn points in three tests. The main goal of this outdoor classroom experiment is to help students learn by experiencing concepts of uncertainty in the domain of profit, specifically risk aversion. After the experiment, students are encouraged to reflect on decision making under uncertainty. We present a theoretical model to explain the decisions made by the participants, their optimal behavior and any deviations from it. Our activity aims to introduce the study of decision making under uncertainty through an experience.
1 Introduction
Decision-making under uncertainty and risk attitudes are central to the field of economics. However, understanding concepts related to uncertainty (and ambiguity) requires a grasp of probabilities and expected payoffs. Several authors have shown that participants struggle with computing probabilities (Delavande et al., 2011; Mkondiwa, 2020). It is unclear whether they also face learning difficulties with expected utility.
The literature on risk preference elicitation is extensive. The traditional method uses multiple price lists (Holt and Laury, 2002; Eckel et al., 2007), where participants face different pairs of lotteries with changing payoffs or probabilities. These experiments report a large number of inconsistent participants who state that they did not understand the task correctly (Pedroni et al., 2017; Amador-Hidalgo et al., 2021; Heimer et al., 2023). Risk preferences can be measured through auctions where participants can purchase insurance to mitigate risk (Charness et al., 2013).
Indeed, some experimental laboratory tasks have been shown to work well with students. For instance, the balloon analog risk task (BART) developed by Lejuez et al. (2002) and the bomb risk elicitation task developed by Crosetto and Filippin (2013) are considered friendly tasks because participants experience risk or at least anticipated risk in intuitive contexts. In the bomb task, students are given 100 objects and must decide how many objects to collect, one of which contains a bomb. The number of objects ordered positively correlates with students’ scores, but collecting the bomb results in zero points. In the BART task, students must inflate a balloon by clicking a button. Each click increases their score and inflates the balloon. However, if the balloon explodes, they lose all their points. These tasks require the use of a computer.
A range of non-digital, interactive methods have been proposed for teaching economic concepts to university students. Classroom experiments, such as those exploring speculation and multiple markets, have been found to be particularly effective (Holt, 1999). Thomas (2019) has developed a series of interactive lessons on economic freedom, which involve physical activity and collaborative group work. Reiley et al. (2008) describe ‘Stripped-Down Poker’, an exercise that teaches students to optimize mixed strategies. However, this approach involves the instructor playing one-on-one with each student, which may not effectively foster an engaging class dynamic. Similarly, Ball and Holt (1998) narrate ‘Classroom Games’, wherein students engage in completing tables and drawing graphs on the board to grasp the concepts of speculation and economic bubbles. These studies collectively highlight the value of non-digital, interactive methods in engaging students and enhancing their understanding of economic concepts.
This paper presents a simple, fun, and easy-to-understand task to measure individual attitudes toward risk. Our task allows students to experience the trade-off between risk and payoffs. Participants are asked to throw a paper airplane at a target and are paid based on the distance they choose and their outcome. Since students are not expected to know how to build and fly their airplanes or to compute expected payoffs, their decision problem and the observed choices entail ambiguity on top of uncertainty. Here, however, we concentrate on the issue of risk-taking in the gains domain (risk aversion) and leave the concept of ambiguity for further research. Interestingly, our task led students to discover different learning outcomes, such as prospect theory (Kahneman and Tversky, 1979) and expected utility theory (Schechter, 2007). Moreover, the students gained insight into their behavior, for instance, by self-identifying as risk or loss-averse. Thus, our task raises students’ awareness of their own and others’ behavioral types.
Several attempts have been made to encourage students to “play” with economics concepts such as risk attitudes and violations of the expected utility, topics they often find challenging. For instance, Johnson and Staveley-O’Carroll (2020) ran an experiment where risk arises from the exchange of multiple currencies. Servátka and Theocharides (2011) ran a game on credit risk. Other classroom experiments designed to improve students’ understanding of risk behavior and its effect on money demand were conducted by Ewing et al. (2010).
Introductory microeconomics courses increasingly use the learning to “learn by playing methodology” (see Korneychuk and Bylieva, 2018; Davis, 2019; Ng, 2019). For example, Mendez-Carbajo and Malakar (2020) use the video www.econlowdown.org to help students in an economics course.
The paper is structured as follows: Section 2 introduces the target audience and provides details on the task and instructions. Section 3 presents the theoretical model and explains the expected learning outcomes. Section 4 discusses the results obtained from a practical experiment conducted with students. Finally, Section 5 provides concluding remarks and discusses the implications of the study.
2 The outdoor activity
2.1 Participants
This activity is designed for university students enrolled in disciplines that include microeconomics courses or for MBA students. A target is set up for every 20 students and marked on the floor with masking tape. The activity takes 15 min initially to construct the planes and understand the instructions. The instructions are also emailed to the students (see Appendix I). The activity should take approximately 30 min to complete. It is suggested to allow an additional 30 min to discuss the experience and confirm the achievement of the intended learning outcome. The conversion of activity points to a class grade or monetary incentive is at the discretion of the experimenter. Holt (1999) argues that this is not essential, but can be motivating.
2.2 The task
The purpose of this task is to provide students with a teaching and learning experience on risky decision-making, specifically attitudes toward risk in a payoff environment.
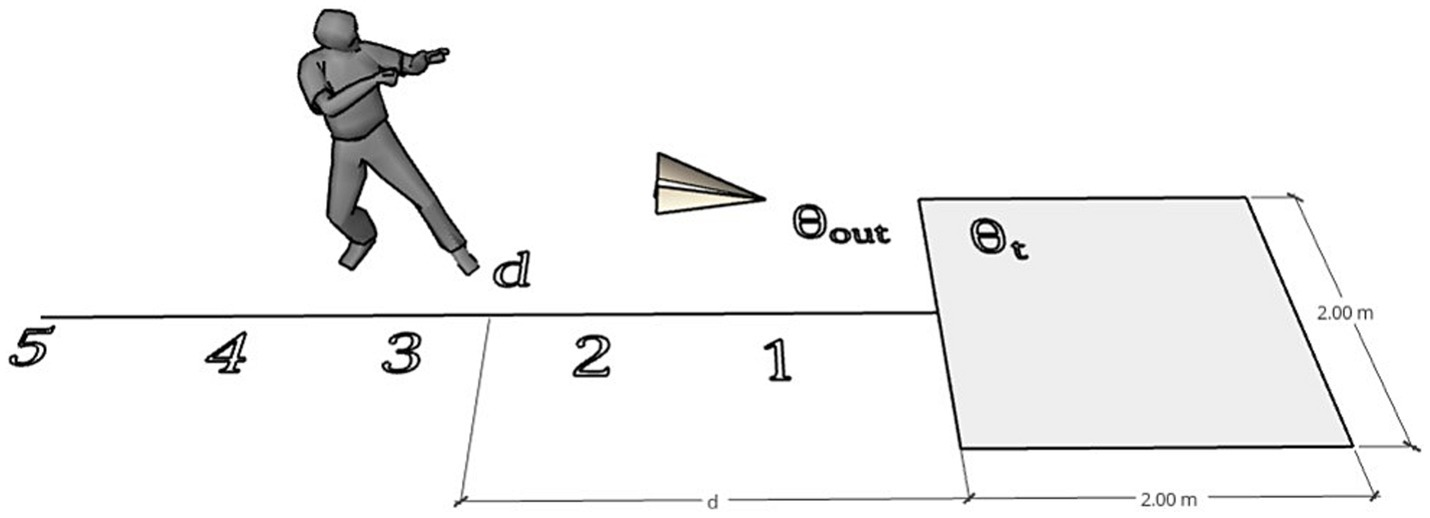
Each student’s main objective is to choose a distance to a target and throw a paper airplane to hit it. The target, which is a square marked out on the ground in advance by the experimenter, earns the participant a number of points equal to the chosen distance if hit. Figure 1 illustrates this concept.
The game is played over three trials, and subjects receive the maximum number of points derived from these trials.1
Our task has several features that should be emphasized. Firstly, we do not expect students to have prior experience with a similar task, such as throwing airplanes to hit a specific location. Therefore, we should ideally have students complete a few practice rounds to familiarize themselves with the difficulty of the task. Secondly, the task is simple, and we do not expect them to have any particular skill in this task. We expect the expectations to be fairly homogeneous. Therefore, if there are differences in individual skill, they cannot be anticipated before the first throw.
2.3 Instructions
The experiment took place at the sports field, where a landing area and a target were constructed. The target was a closed box measuring 2 × 2 meters, as shown in Figure 1.
Prior to the experiment, the students were instructed to create a paper airplane using recycled paper. They were given the option to refer to online instructions for assistance.
After building the airplanes, the students received instructions on the game’s rules. Each student had to decide the distance in meters to throw their airplane before their classmates threw theirs. The scorer recorded the distance (d), the result (t or out), and the points earned. After all the students had thrown their airplanes, they proceeded to the next trial. Each student marked their decision before the first student began throwing again. The students had three chances or trials to reach the goal, and the best result of the three throws was selected for the final payoff.
The participants were incentivized to choose an optimal distance based on their expected abilities, as the decision was made and marked before any planes were thrown in each trial. It is important to consider that landing the airplane on the target (t) will result in earning the same number of points as the distance, while landing outside (out) will result in zero points in the trial (see Appendix I).
3 Theory
3.1 General framework
A rational subject is often modeled by assuming perfect rationality, and it is assumed that students will always act in a way that maximizes their utility. In our setting, this means that each student calculates the distance (d) that will yield the highest expected payoff if she is risk neutral. The subject knows that moving farther away increases the number of points she will receive if the task is completed (i.e., the plane lands on the target). However, moving closer increases the probability of receiving a positive payoff. Therefore, the subject chooses the distance (in meters) at which she expects to earn maximum points.
Next, we consider a stylized model of individual rational choice with the following ingredients:
• Let λ be the maximum cumulative payoff in previous periods.2
• The payoffs associated with each distance are:
i. θt(d) = max(d, λ) is the payoff a student gets when landing her plane on the target,
ii. θout(d) = λ is the payoff that a student gets when landing her plane outside the target.
Note that payoffs are (weakly) increasing with distance ( (d) ≥ 0, and (d) = 0).
• Assume that the probability of hitting a target from a certain distance (d) is a linear approximation:
i. pt(d) = max(a−bd, 0) for landing on target t.
ii. pout(d) = 1-pt(d) for landing outside target t.
The probability function described by pt(d) is (weakly) decreasing in the distance (i.e., (d) ≤ 0) where, 0 ≤ a ≤ 1 and 0 < b.
We assume no ambiguity in the probability of success function (i.e., this function is independent of ability and common knowledge).
• The distance (d) has to be a value greater than 0, as the students could not throw the airplanes standing inside the targets. Additionally, a maximum distance is given by beyond which hitting the target is impossible. That is, d< and .
The previous assumptions determine an expected gains function in each trial as follows (given the distance chosen and conditional on the accumulated payoff):
G(d) = pt(d) · θt(d) + (1- pt(d)) · θout(λ).
Analogously, the expected gains can be expressed as:
G(d) = max(a-b·d, 0) · max(d, λ) + 1−(max(a−b·d, 0)) · λ.
The selected distance determines whether the subject reaches the target and scores points. If the chosen distance is greater than the points already earned and less than , the subject will achieve the chosen distance d with a probability of a-b·d. Otherwise, the subject keeps the points already earned. Alternatively, there is a trivial transformation:
G(d) = max(a−b·d, 0) · max(d−λ, 0) + λ.
A subject’s expected winnings (first term in the equation above) are determined by the increase in distance from the accumulated points (d-λ), conditional on reaching the target in the throw (something that occurs with probability a-b·d, if d < ).
The distance that optimizes the expected gains is:
which is the medium value between λ.
Assuming that the probability structure is common knowledge, this indicates that the optimum from which the agents must throw is when their cumulative gains are 0 ( = 0). The optimum is to throw from half the maximum distance. This distance is repeated on the next trial until the target is hit. If a subject throws at the optimum, they will be successful on their next trial, she must throw from distance That is, she must not throw from a distance less than because those points are already assured ( = , nor more than , because she cannot hit the target at such distance by definition. She must precisely throw from a distance in the middle between those extreme values, as deduced from the mathematical optimum. Reiterating this argument, in the third and final trial, the distance will be repeated as long as the target is not hit yet. Otherwise, which is the middle point between and .3
The utility function U(G(d)), widely used in rational choice, measures participants’ welfare as a function of their decision, which allows us to classify subjects into different risk attitudes. Applying the expected utility theory, we obtain that:
U(G(d)) = pt(d)·U(θt(d)) + (1− pt(d))·U(θout).
Based on this utility function, we might have different theoretical predicted behaviors, denoted by du:
• Risk neutral du = d*. Subjects choose the distance that maximizes their expected payoff. In other words, they choose the option that gives them the maximum gain if they throw a high number of times.
• Risk averse du < d*. Subjects choose a smaller distance than the one that maximizes expected payoffs, sacrificing a higher possible payoff to increase their probability of success. Students choose an option that may yield a lower payoff but is less risky. In other words, they give up points to increase their chances of gaining something.
• Risk lover du > d*. Subjects choose a greater distance than the one that maximizes expected gains because they prefer higher possible payoffs, even though they are riskier. Students choose an option where the best-case scenario is perfect, even if it is not the best option mathematically, because there is a higher probability of failure.
3.2 Learning outcomes
Given the success probability function shown above, we now describe the decision thresholds for a risk-neutral agent determined by her optimal choices (see Figure 2). The distance that optimizes the expected gain function (G(d)) on the first trial, where λ = 0 points, is equal to meters.4 Notice that, as predicted by our model, students who choose a distance of less than meters (when λ = 0) exhibit risk aversion, whereas longer distances would imply risk loving.5
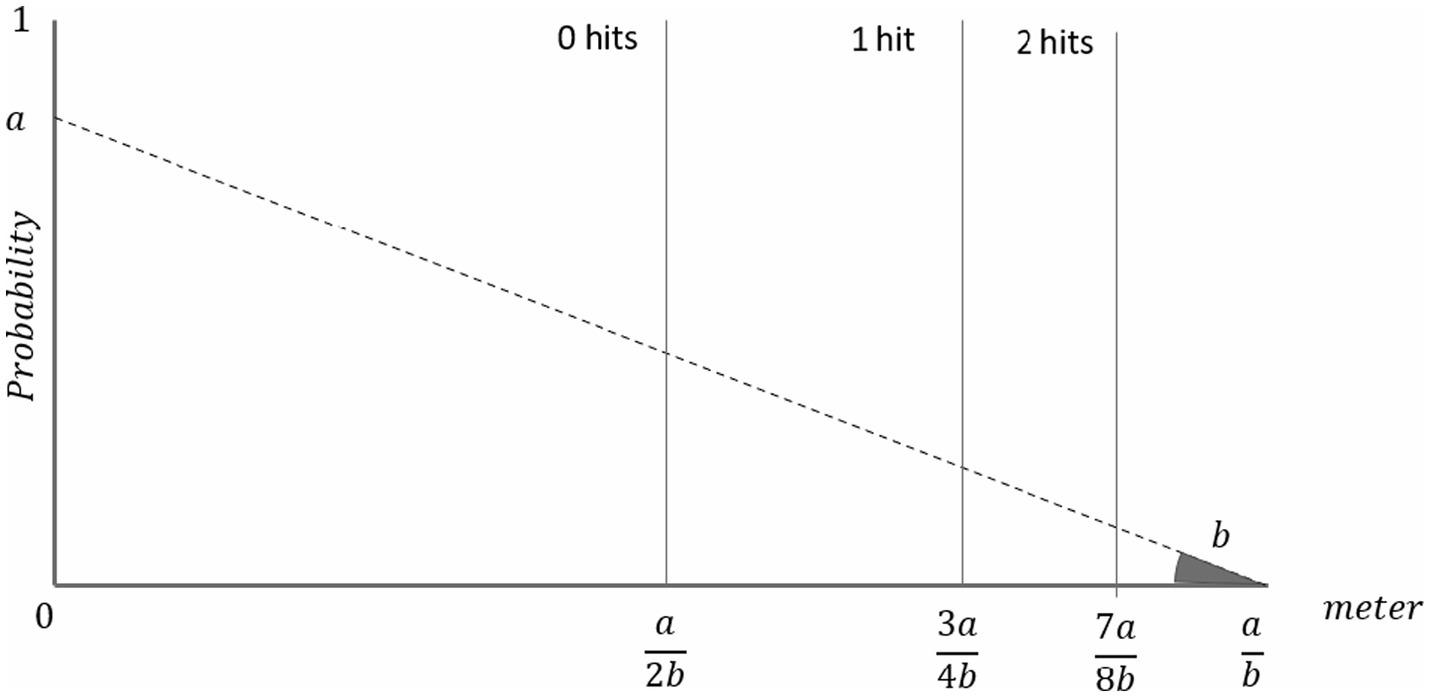
Figure 2. Linear approximation of the probabilities of hitting the target (t) by distance. The vertical lines represent the optimal distance if (i) the student had no accumulated points ( ), i.e., 0 hits, and would therefore choose a/2b; (ii) the optimal distance 3a/4b conditional on having 1 hit from the optimal distance a/2b; and (iii) the optimal distance 7a/8b conditional on having had two hits from the two previous optimal distances.
LO1 (Learning Outcome 1). If all subjects were risk-neutral, then they would all choose the same distance on the first trial.
Individually, the results may be affected by poor estimation of probabilities, but since the subjects have no prior information, overestimation and underestimation should cancel out. Thus, if there is an aggregate difference with respect to the theoretical value, it must be due to risk aversion or love of risk on the part of the subjects in the sample.
First, a student who failed (i.e., does not hit either of the targets) on the first trial begins the second trial with λ = 0 points. This happens with a probability pout( = 1- . These individuals face the same decision as in the first trial, and the rational choice remains the same. This means that they do not need to adjust (∆d = 0).
Subjects who did not hit the target have no reason to change their decision. If changes are observed, it is because the model does not include parameters they use in their analysis, such as the period they are in, and these are significant.
LO2. Subjects that do not succeed in one trial should not change their decision in the next trial.
The model described depends on the outcome of all previous trials, but not on the number of trials remaining. If the cumulative payoff does not increase, then the decision parameters have not changed and the same optimization should be repeated. If subjects empirically make different decisions between trials without hitting the target, one possible explanation would be that they change their risk attitude.
LO3. Subjects who successfully hit the target in the first or second trial should increase the distance in the next trial.
Assuming that subjects are profit maximizers, a student who hits the target and throws from the same position or a position closer to the target cannot increase her points; she keeps the points she has accumulated. In particular, the best response for a neutral risk subject who hits the target in trial 1 is to choose a d = meters (which implies an increase in the distance (Δd) by meters).
In the third and last trial, the possible scenarios are related to the cumulative payoffs λ = 0, λ = , or λ = points and the optimal adjustments of the distance are d* = 0, d*= , and d*= meters, respectively. We have shown that when subjects have earned a greater number of points, the adjustment they must make must be positive, but of a smaller magnitude.
LO4. The distance does not increase linearly; the higher the payments the smaller the distance increments.
In reality, the probability function is unknown to the participants, and therefore they have to make a guess to make the decision. In particular, the agents had no information about the values (a, b) of the function pt.
Indeed, many factors could influence participants’ success in the game: their ability to throw planes (since we do not believe that students have information about how to do this prior to the task), the technical performance of their plane, information about current weather conditions, their self-perception of their luck or confidence, their attitude toward ambiguity, and their attitude toward risk.
4 Experimental results
The data were collected for a slightly more complicated experiment in which there were two targets, t and T, consisting of two closed boxes (one inside the other). Hitting the smaller target T provided a payoff of twice the distance, while hitting the larger closed box provided a payoff of the distance (as in the benchmark framework described above). The theoretical predictions of this setup can be found in Appendix II.
We first classify subjects according to their choices in the first round of the experiment. We then report the behavior of students who failed the first and second trials (λ = 0), since their optimal behavior is not expected to change over the course of the game.
4.1 Sample
We invited 103 university students (85 Spanish and 18 international) from an Andalusian university (southern Spain) to participate in an outdoor activity. All participants were enrolled in the Game Theory for Social Sciences course, which is offered to communication, international relations, business, law and international students.
Participation was not compulsory (3 students, all Spanish nationals, did not participate). The students were not informed about the instructions before the experiment. The final sample consisted of 100 university students (62% female) with a mean age of 22.23 years (SD = 0.140). The experiment was conducted in two sessions: 49 students participated in the Cordoba campus and 51 in the Seville campus. Each student made 3 individual decisions, for a total of 300 decisions.
Students received 0–30 points for their results. Thirty points could have an impact of 0.10% on their final grade. Although the payments may seem small and the incentives insufficient, Brañas-Garza et al. (2021) have shown that in many contexts providing real (rather than hypothetical) incentives is not relevant for measuring risk preferences.
4.2 Empirical distribution of the probability of success
In what follows, we analyze the behavior of a risk-neutral individual, assuming that the probability of success (for T or t targets) is linear, known, and constant throughout the experiment. To calibrate the two linear probability functions (one for target T and the other for target t), we used the empirical observations of the 300 decisions made by the students in our experiment. We find that A = 0.13, B = 0.02, a = 0.52, and b = 0.05 (Figure 3).
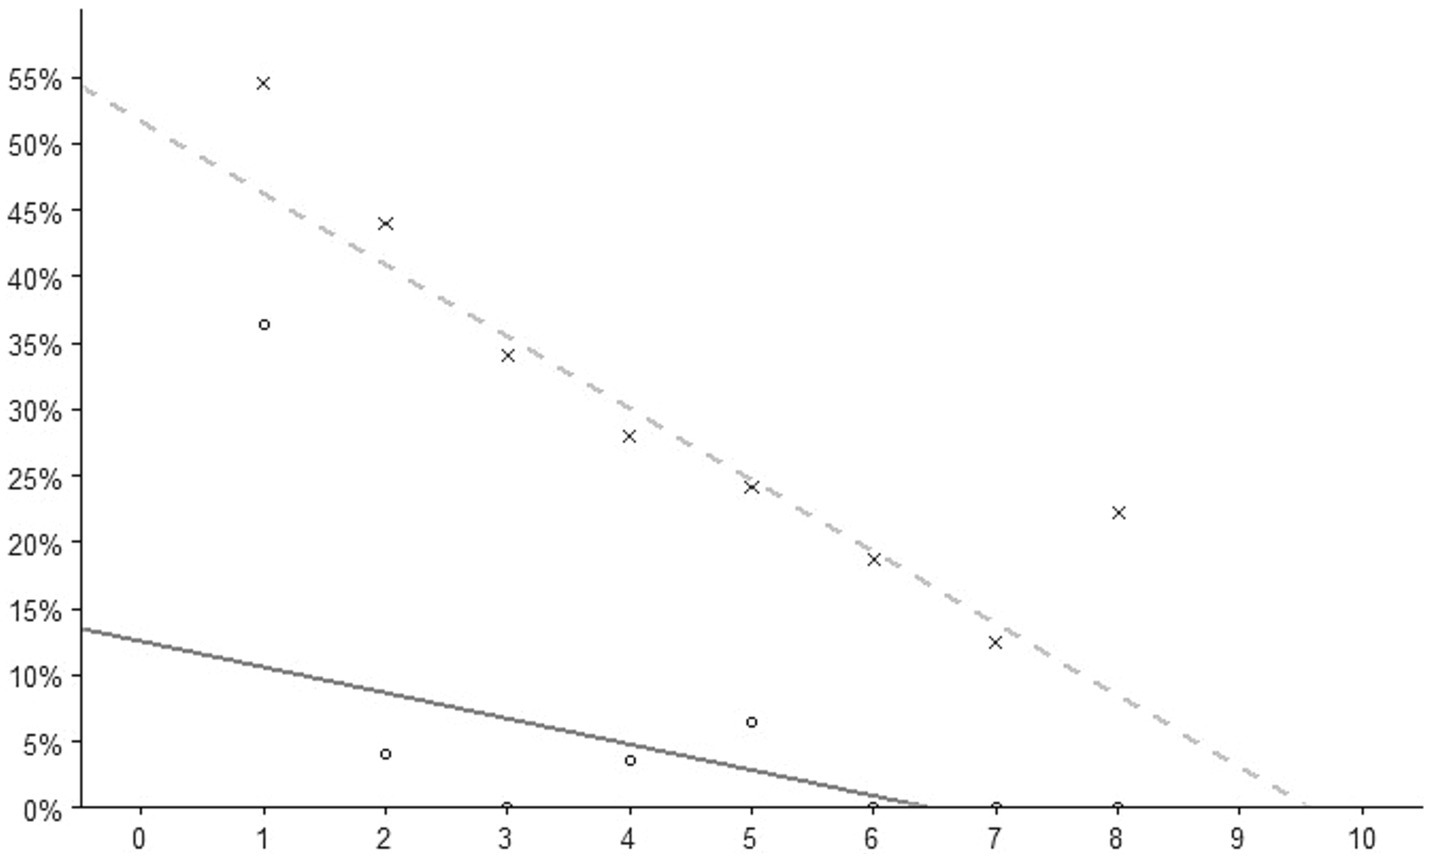
Figure 3. Linear approximation of the probabilities of hitting the target (t, dashed line or T, solid line) by distance. Empirical distribution: pT(d) = max(0.13–0.02 d,0) and pt(d) = max(0.52–0.05 d,0) represented by the solid line and the dashed line, respectively.
4.3 First trial
For the first trial, students decided from what distance (in meters) they wanted to throw their airplane. This decision was made without any additional information other than the instructions. All subjects wrote the meters individually, without observing their partners. It is important to note that the first decision was not correlated with gender (p = 0.899), so the task can be considered gender neutral.6 The first shot was also uncorrelated with participants’ age (p = 0.880). This result differs from those reported in the literature, where age has been found to have robust and consistent associations with risk preference (see Frey et al., 2021). However, it is important to note that our students had minimal age differences. Finally, we observe that the empirical probability of success did not change across trials, suggesting that subjects did not learn how to perform the task.7
In the following, we assume that subjects maximize their utility, U(G(d)), rather than their pure expected gains, G(d). We also assume that they know the probabilities of success; therefore, their choices reflect their behavioral type with respect to risk attitudes.
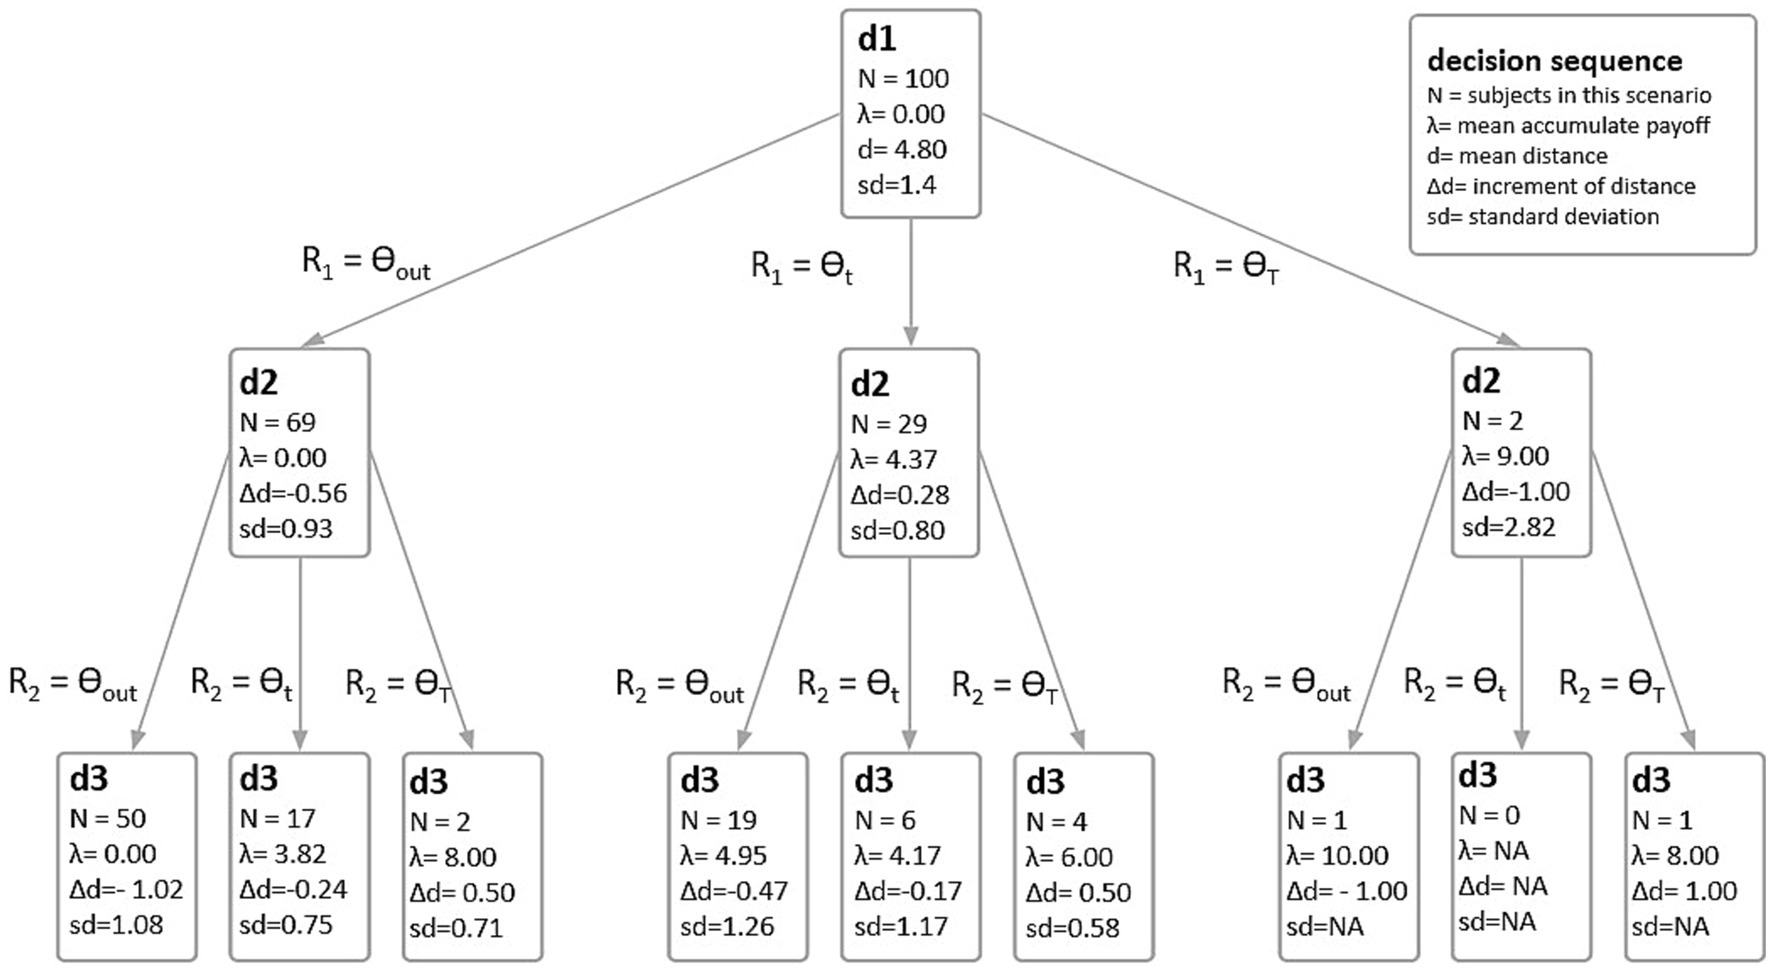
Looking at the results of the 300 decisions, we draw a decision tree (as in Appendix II) incorporating the empirical results. Note that this new tree includes standard deviations because there is heterogeneity in the distance adjustments; that is, not all individuals adjust similarly (see Figure 4).
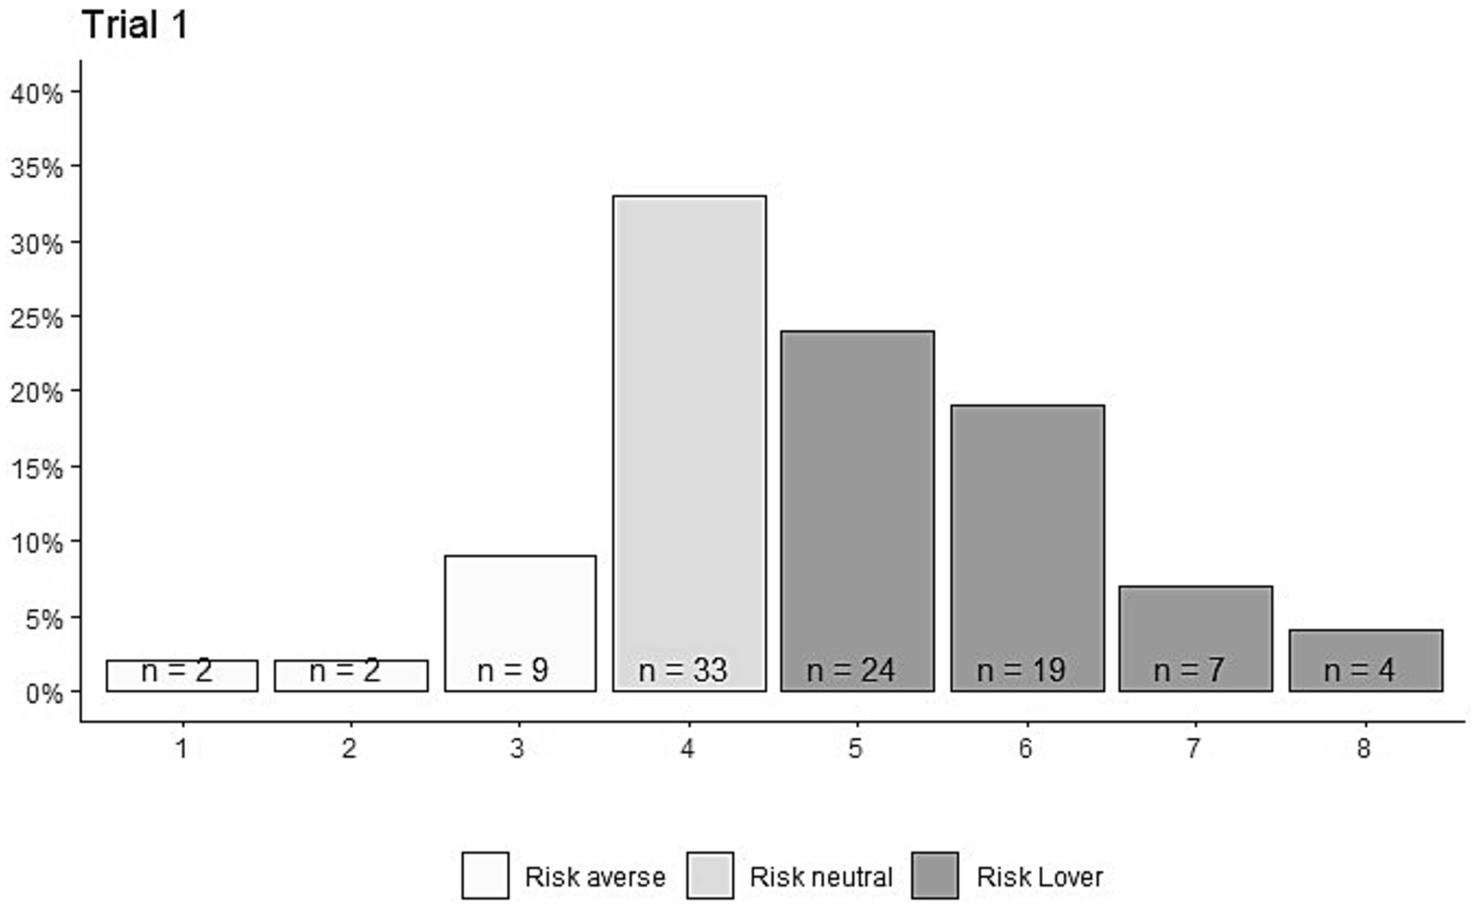
In the first trial, the theoretical model suggests that the distance with the highest expected value is 4.12 meters. We must assume that the subjects computed the probability function (and that the errors of those who overestimated were compensated by those who underestimated). As shown in Figure 5, the average distance was 4.8 meters (SD = 1.41). Specifically, 33 of the 100 participants threw the plane from a distance of 4 meters; 13 threw from a position closer to the target and can therefore be considered risk-averse (Kahneman and Tversky, 1979), and 54 chose a distance greater than 4.12 meters and can be considered risk-loving.8
LO1. If all subjects were risk-neutral, then they would all choose the same distance in the first trial. This is generally not true.
Students choose different distances in the first trial. Specifically, we found that the majority have a risk-loving attitude. Therefore, we can ask students if the payoff system determines the outcome. Moreover, we could open the debate about their strategies with other payoff systems.9
We also found that participants who hit the target and those who did not differed in the distance they chose. Those who hit the target (31 out of 100) threw from 4.39 meters
(SD = 1.358), while those who did not hit the target (69 out of 100) threw from 4.99 meters (SD = 1.409). This difference is significant (p = 0.08). Therefore, those who chose to throw farther were less likely to win.
Subjects with λ = 0 (cumulative payoffs = 0). We now examine the behavior of participants who faced exactly the same maximization problem three times. Fifty participants failed in the first and second trials, so their cumulative payoff in all decisions was zero (λ = 0). Recall that optimally they should not adjust the distance, but keep their original choice.
Figure 6 shows that these 50 participants (on average) reduced the distance across trials. Between the first and second trial, there was an adjustment of −0.52 meters (p = 0.002), while between the second and third trial, the adjustment was −1.02 meters (p = 0.001).10
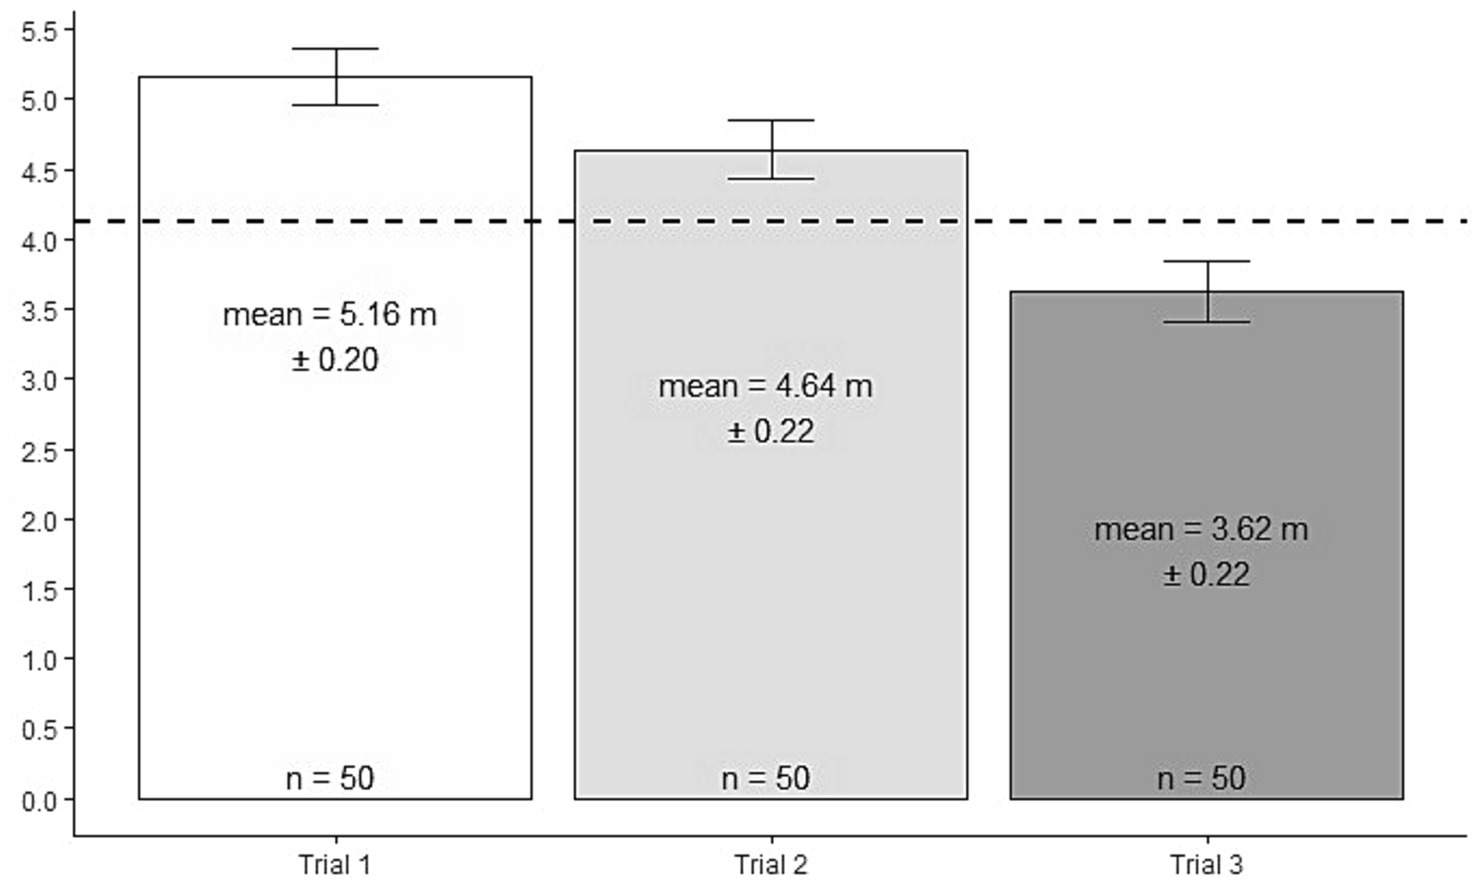
Figure 6. Average decisions by trial for the 50 subjects with . The dashed line shows the theoretical prediction for .
One way to explain these seemingly non-optimal choices is to assume that participants are trying to learn about their abilities, and thus the probabilities of success are ambiguous. When participants failed, they decreased the distance to improve their chances of hitting the target. However, this process proved unsuccessful because they failed again. Another explanation is that participants changed their preferences across trials, which means that participants were risk-loving when they had more opportunities and risk-averse (mean = 3.62) in the last trial. In addition, another plausible explanation is that subjects do not maximize utility, but instead take into account other considerations such as social reputation or self-respect (Bénabou and Tirole, 2006), and that, for example, hitting the target is their primary target, regardless of the payoff.
LO2. Subjects that do not succeed in one trial should not change their decision in the next trial. This is not generally true.
Typically, students who do not succeed in one trial choose a shorter distance in the next. We can ask the students to explain such behavior. There are many possible explanations, such as updating the success probability given past outcomes, changes in risk attitudes conditional on the trial, experience, etc.11 Finally, we could also use this experiment to ask students for the hypothetical distance they would have thrown the airplane in the last trial (trial 3) if they had failed in the previous two trials or if they had hit the target in one of the two previous trials, etc. This way, we can start a discussion to introduce them to the concept of backwards induction, in a natural way.
4.4 Econometric analysis
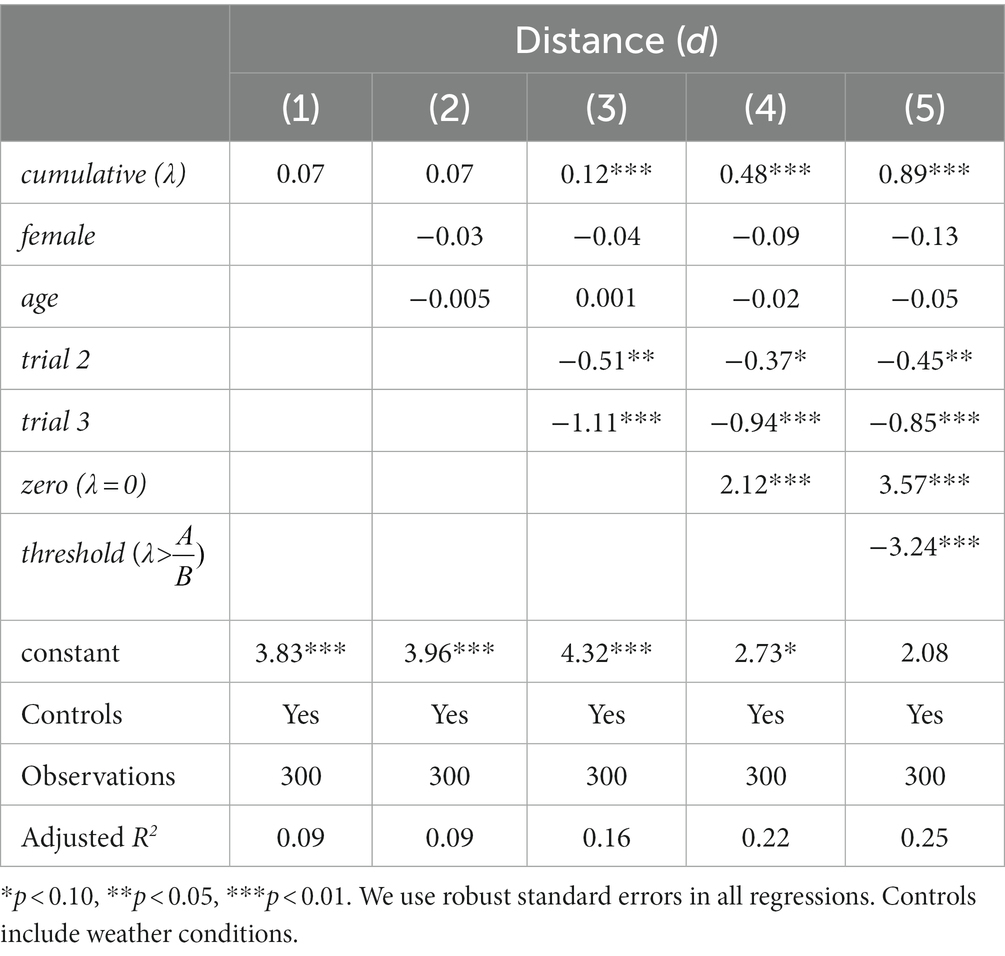
In this section, we examine participants’ choices (distance) using ordinary least squares (OLS). The list of independent variables includes (i) cumulative payoffs, λ; (ii) age and gender; (iii) learning (trial or round); (iv) a dummy variable equal to 0 if λ = 0 and 1 otherwise; (vi) the theoretical threshold: λ > points (1 and 0 otherwise).12 Finally, we use robust standard errors in all regressions (Table 1).
For the discussion of the results, we focus on the last model (5).
LO3. Subjects who successfully hit the target should increase the distance on the next trial. This is generally true.
We observe that (i) distance increases with λ (p < 0.001).
Other results that we observed was (ii) Gender (p = 0.428) and age (p = 0.362) are not correlated with decisions. (iii) Subjects reduce the distance across trials (trial 2, p = 0.028; trial 3, p < 0.001); in other words, subjects become more cautious as the game progresses, but do not learn to throw better.
LO4. The distance does not increase according to a linear model; the higher the payments, the smaller the distance increments. This is generally true.
(iv) Subjects with no successes (λ = 0 points) choose smaller distances (p < 0.001). (v) Those who pass the theoretical threshold (λ > = 6.43 points) chose smaller distances (p < 0.001) too. The behavioral are no lineal. In the version played by the students, there was a threshold in the gain functions (G) and the students intuitively recognized this discontinuity.
The study findings suggest that LO1 and LO2 are generally not met, while LO3 and LO4 are achieved satisfactorily. This indicates that commonly used simplifying assumptions in economics, such as the homogeneity of subjects and the ability to mathematically compute optimal values, might be overly restrictive. Therefore, the inclusion of additional assumptions, such as loss aversion, is crucial. These insights highlight the significance of taking psychological and behavioral factors into account in economic analysis. This approach can provide a more realistic and nuanced understanding of economic decision-making.
4.5 Reflections on methodological limitations
Conducting this pilot study allows us to identify certain limitations that we intend to actively address in future research. First, the reported experiences relate to a specific group of students, which limits the generalizability of our findings. It cannot be determined whether the results are representative of a broader population of students from diverse educational and cultural backgrounds.
Second, quantitative measures are lacking. The study’s findings are based primarily on qualitative observations. Although students claimed to have enjoyed the activity, there is insufficient quantitative data to support this claim. The lack of questionnaires or objective measures to assess student engagement and learning is a significant limitation, and studies such as Pyun et al. (2020) highlight the importance of measuring student satisfaction with specific educational experiences such as outdoor learning.
It is important to note that there is a potential for confirmation bias due to the direct involvement of the researchers in the delivery of the activity.
4.6 Future work
The aim of future work is to provide teachers with dynamic tools to introduce students to the concept of risk and to demonstrate how mathematical modeling of events can help make better decisions by explaining concepts such as expected value and risk aversion. In order to keep the project up to date, a website13 has been created that provides instructions for students in several languages and will be updated as the project grows.
We plan to overcome the limitations of qualitative measurement by including questionnaires, expanding the sample of participants, and conducting long-term follow-up evaluations. This approach will provide a more complete and objective understanding of the impact of our pedagogical methodology. The teacher section of our website will include a modified version of the Yin and Wang satisfaction survey, cf. Yin and Wang (2015).
We have also introduced an online version of the activity, an innovation that aims to promote inclusivity by enabling students with special needs or who are unable to attend face-to-face classes to participate and benefit from the experience.
5 Conclusion
This paper presents an outdoor activity that enables students to experience decision-making under uncertainty and introduces them to concepts such as payoffs, expected payoffs, and attitudes toward risk. In a more sophisticated setting, we could also introduce students to the issues of ambiguity and backward induction.
Participants were instructed to create a paper airplane and throw it at either a large or small target, with double points awarded for hitting the smaller target. Each participant had three attempts to hit the targets. The results indicate that participants who exhibited more caution were more likely to hit the target, and there was no significant gender bias (p = 0.428). On average, those who hit the target increased their throwing distance in the subsequent round, while those who missed the target decreased their distance.
A model is presented to explain the behavior of subjects and classify them as neutral, averse, or risk-loving based on their choices. The model predicts that successful participants will increase the distance, while those who do not hit the target will not decrease the distance. Participants’ choices across the outdoor activity are used to classify them according to the model and determine whether they play optimally or not. Our results provide information on behavior in relation to the proposed theory and any deviations from it. In summary, the experience enabled students to generate and qualitatively validate mathematical models, facilitating the practical application of theoretical game theory concepts.
Data availability statement
The datasets presented in this study can be found in online repositories. The names of the repository/repositories and accession number(s) can be found at Alfonso (2021).
Ethics statement
The studies involving humans were approved by Ethical Committee of Loyola Andalucía University code: 260920. The studies were conducted in accordance with the local legislation and institutional requirements. The participants provided their written informed consent to participate in this study. Written informed consent was obtained from the minor(s)' legal guardian/next of kin for the publication of any potentially identifiable images or data included in this article.
Author contributions
AA: Writing – original draft.
Funding
The author(s) declare financial support was received for the research, authorship, and/or publication of this article. This research was supported by the Spanish Ministry of Economy and Competitiveness (PID2021-126892NB-100), Excelencia-Junta (PY-18-FR-0007), Agencia Andaluza de Cooperación Internacional para el Desarrollo (AACID-0I008/2020), grant B-SEJ-280-UGR20 funded by Consejería de Universidad, Investigación e Innovación de la Junta de Andalucía and by "ERDF A way of making Europe" and Loyola 205,565 PID is also gratefully acknowledged.
Acknowledgments
We thank Pablo Brañas Garza, Ana Hernández Roldán, Sarah Jacobson, Diego Jorrat, Dunia López Pintado, and SEA 2020 for their helpful comments. I would also like to thank the students who participated in the experiment.
Conflict of interest
The author declares that the research was conducted in the absence of any commercial or financial relationships that could be construed as a potential conflict of interest.
Publisher’s note
All claims expressed in this article are solely those of the authors and do not necessarily represent those of their affiliated organizations, or those of the publisher, the editors and the reviewers. Any product that may be evaluated in this article, or claim that may be made by its manufacturer, is not guaranteed or endorsed by the publisher.
Supplementary material
The Supplementary material for this article can be found online at: https://www.frontiersin.org/articles/10.3389/feduc.2024.1301952/full#supplementary-material
Footnotes
1. ^This aspect of the experiment resembles the context of athletes competing in the Olympics with multiple possible trials.
2. ^If a subject is in Trial 1, then λ = 0; if a subject is in Trial 2, then λ is the payoff obtained in Trial 1, and if a subject is in Trial 3, then λ is the maximum payoff obtained in Trials 1 and 2.
3. ^In general, if the experiment were to consider a total number of R trials the process of optimization will indicate that the optimal distance after r hits would be d * = (2r-1)·a/2r·b.
4. ^Parameters a and b can be estimated by observing the results of the throws after they have been performed conditional on having observations from a wide variety of distances. We assume that students can calculate the probability of success as a function of the distance beforehand using the aggregate information (because some will overestimate, and others will underestimate).
5. ^Prospect theory states that in gain scenarios, subjects tend to choose risk-averse decisions in a higher proportion than risk-lover ones (Kahneman and Tversky, 1979).
6. ^This result coincides with Filippin and Crosetto (2016) meta-analysis of risk-taking including 54 published studies that found no gender differences.
7. ^The significance test of the difference in the probability of hitting the main target between Trial 1 and Trial 2 has a value of p of p = 0.252 (between Trial 1 and Trial 3, p = 0.502). In the case of the secondary target, the value of p for the comparison between Trial 1 and Trial 2 was p = 0.224 (between Trial 1 and Trial 3, p = 0.776).
8. ^Compared to the existing literature, this share of risk averse participants is low. A plausible explanation is that participants were aware of a second (and even third) opportunity to improve their outcomes. As Cox et al. (2015) showed, risky behavior is sensitive to the payment method.
9. ^The two main strategies that appear in this payment method are: secure points and then little by little, taking more risks in the first two trials and looking for a secure payoff in the last one.
10. ^Four participants went the opposite direction (trying a greater distance). This pattern might be consistent with a behavior referred to as “in for a penny, in for a pound” (Campbell-Meiklejohn et al., 2012).
11. ^In tennis, for instance, players do not take the same risks on the first service as they do on the second. We could use this example to foster debate.
12. ^As explained in the model (see Appendix II), the theoretical thresholds define the change in distance function to maximize expected payoffs. For the regression we use the highest threshold because they are too close, less than 1 meter.
13. ^https://sites.google.com/view/antonio-alfonso/airplanes
References
Alfonso, A. (2021). Taking risks by flying paper airplanes dataset. Mendeley Data V1. doi: 10.17632/yb9k42yxn6.1
Amador-Hidalgo, L., Brañas-Garza, P., Espín, A. M., García-Muñoz, T., and Hernández-Román, A. (2021). Cognitive abilities and risk-taking: errors, not preferences. Eur. Econ. Rev. 134:103694. doi: 10.1016/j.euroecorev.2021.103694
Ball, S. B., and Holt, C. A. (1998). Classroom games: speculation and bubbles in an asset market. J. Econ. Perspect. 12, 207–218. doi: 10.1257/jep.12.1.207
Bénabou, R., and Tirole, J. (2006). Incentives and prosocial behavior. Am. Econ. Rev. 96, 1652–1678. doi: 10.1257/aer.96.5.1652
Brañas-Garza, P., Estepa-Mohedano, L., Jorrat, D., Orozco, V., and Rascón-Ramírez, E. (2021). To pay or not to pay: measuring risk preferences in lab and field. Judgm. Decis. Mak. 16, 1290–1313. doi: 10.1017/S1930297500008433
Campbell-Meiklejohn, D., Simonsen, A., Scheel-Krüger, J., Wohlert, V., Gjerløff, T., Frith, C. D., et al. (2012). In for a penny, in for a pound: methylphenidate reduces the inhibitory effect of high stakes on persistent risky choice. J. Neurosci. 32, 13032–13038. doi: 10.1523/JNEUROSCI.0151-12.2012
Charness, G., Gneezy, U., and Imas, A. (2013). Experimental methods: eliciting risk preferences. J. Econ. Behav. Organ. 87, 43–51. doi: 10.1016/j.jebo.2012.12.023
Cox, J. C., Sadiraj, V., and Schmidt, U. (2015). Paradoxes and mechanisms for choice under risk. Exp. Econ. 18, 215–250. doi: 10.1007/s10683-014-9398-8
Crosetto, P., and Filippin, A. (2013). The “bomb” risk elicitation task. J. Risk Uncertain. 47, 31–65. doi: 10.1007/s11166-013-9170-z
Delavande, A., Giné, X., and McKenzie, D. (2011). Measuring subjective expectations in developing countries: a critical review and new evidence. J. Dev. Econ. 94, 151–163. doi: 10.1016/j.jdeveco.2010.01.008
Eckel, C., Grossman, P. J., and Milano, A. (2007). Is more information always better? An experimental study of charitable giving and hurricane Katrina. South. Econ. J. 74, 388–411. doi: 10.1002/j.2325-8012.2007.tb00845.x
Ewing, B. T., Kruse, J. B., and Thompson, M. A. (2010). Measuring the regional economic response to hurricane Katrina. CESifo Forum 11, 80–85.
Filippin, A., and Crosetto, P. (2016). A reconsideration of gender differences in risk attitudes. Manag. Sci. 62, 3138–3160. doi: 10.1287/mnsc.2015.2294
Frey, R., Richter, D., Schupp, J., Hertwig, R., and Mata, R. (2021). Identifying robust correlates of risk preference: a systematic approach using specification curve analysis. J. Pers. Soc. Psychol. 120, 538–557. doi: 10.1037/pspp0000287
Heimer, R. Z., Iliewa, Z., Imas, A., and Weber, M. (2023). Dynamic inconsistency in risky choice: Evidence from the lab and field (No. w30910). National Bureau of Economic Research.
Holt, C. A. (1999). Teaching economics with classroom experiments: a symposium. South. Econ. J. 65, 603–610. doi: 10.1002/j.2325-8012.1999.tb00180.x
Holt, C. A., and Laury, S. K. (2002). Risk aversion and incentive effects. Am. Econ. Rev. 92, 1644–1655. doi: 10.1257/000282802762024700
Johnson, P., and Staveley-O’Carroll, J. (2020). An exchange rate risk experiment with multiple currencies. J. Econ. Educ. 51, 19–30. doi: 10.1080/00220485.2019.1687375
Kahneman, D., and Tversky, A. (1979). On the interpretation of intuitive probability: a reply to Jonathan Cohen. Cognition 7, 409–411. doi: 10.1016/0010-0277(79)90024-6
Korneychuk, B., and Bylieva, D. (2018). The use of business games in Russian higher education: prerequisites and obstacles. European Proceed. Soc. Behav. Sci. EpSBS 51, 13–22. doi: 10.15405/epsbs.2018.12.02.2
Lejuez, C. W., Read, J. P., Kahler, C. W., Richards, J. B., Ramsey, S. E., Stuart, G. L., et al. (2002). Evaluation of a behavioral measure of risk-taking: the balloon analogue risk task (BART). J. Exp. Psychol. Appl. 8, 75–84. doi: 10.1037/1076-898X.8.2.75
Mendez-Carbajo, D., and Malakar, L. C. (2020). Flipping the classroom with econlowdown. org. J. Econ. Educ. 51, 95–102.
Mkondiwa, M. (2020). Games of strategy in culture and economics research. J. Econ. Methodol. 27, 146–163. doi: 10.1080/1350178X.2019.1680858
Ng, C. F. (2019). A video game to supplement a hybrid principles of microeconomics course. J. Econ. Educ. 50, 44–56. doi: 10.1080/00220485.2018.1551101
Pedroni, A., Frey, R., Bruhin, A., Dutilh, G., Hertwig, R., and Rieskamp, J. (2017). The risk elicitation puzzle. Nat. Hum. Behav. 1, 803–809. doi: 10.1038/s41562-017-0219-x
Pyun, D. Y., Wang, C. K. J., and Koh, K. T. (2020). Testing a proposed model of perceived cognitive learning outcomes in outdoor education. J. Adventure Educ. Outdoor Learn. 20, 230–244. doi: 10.1080/14729679.2019.1660191
Reiley, D. H., Urbancic, M. B., and Walker, M. (2008). Stripped-down poker: a classroom game with signaling and bluffing. J. Econ. Educ. 39, 323–341. doi: 10.3200/JECE.39.4.323-341
Schechter, L. (2007). Risk aversion and expected-utility theory: a calibration exercise. J. Risk Uncertain. 35, 67–76. doi: 10.1007/s11166-007-9017-6
Servátka, M., and Theocharides, G. (2011). Understanding credit risk: a classroom experiment. J. Econ. Educ. 42, 79–86. doi: 10.1080/00220485.2011.536492
Thomas, S. (2019). "The development of interactive classroom activities to teach economic freedom to students of various learning styles," in Teaching Economics. eds. J. Hall and K. Lawson (Cham.: Springer).
Keywords: classroom experiments, expected utility theory, risk-taking JELcodes: A22, C70, C99
Citation: Alfonso A (2024) Taking risks by flying paper airplanes. Front. Educ. 9:1301952. doi: 10.3389/feduc.2024.1301952
Edited by:
Sibilla Di Guida, IMT School for Advanced Studies Lucca, ItalyReviewed by:
Andrea Maffia, University of Bologna, ItalyNicola Del Giudice, University of Camerino, Italy
Copyright © 2024 Alfonso. This is an open-access article distributed under the terms of the Creative Commons Attribution License (CC BY). The use, distribution or reproduction in other forums is permitted, provided the original author(s) and the copyright owner(s) are credited and that the original publication in this journal is cited, in accordance with accepted academic practice. No use, distribution or reproduction is permitted which does not comply with these terms.
*Correspondence: Antonio Alfonso, YWFsZm9uc29jQGdtYWlsLmVz
 Antonio Alfonso