
94% of researchers rate our articles as excellent or good
Learn more about the work of our research integrity team to safeguard the quality of each article we publish.
Find out more
TECHNOLOGY AND CODE article
Front. Educ. , 19 February 2024
Sec. Digital Education
Volume 9 - 2024 | https://doi.org/10.3389/feduc.2024.1270622
 Diana Gaviria-Rodríguez1*
 Juan Arango-Arango2
 Alejandro Valencia-Arias3
 Lilian Janet Verde Flores3
 Jackeline Valencia4Luisa Rodríguez Zavala4
Interactive learning objects (ILOs) are tools that can enhance and promote teaching in various fields of knowledge. For instance, GeoGebra is free educational software designed for teaching and learning mathematics. It is interactive mathematical software that can help students better understand accounting concepts and visualize complex financial relationships, making it easier to learn abstract concepts. Additionally, it can be used to explore what-if financial scenarios, which can help students develop their decision-making skills. The purpose of this article is to investigate the impact of GeoGebra on the development of mathematical skills among accounting science students. It contributes to the literature by demonstrating the effectiveness of teaching financial concepts through the application of five linear functions and their mathematical relationships in GeoGebra. This approach bridges the gap between differential calculus knowledge and the ability to achieve a geometric understanding and interpretation of the lines that can be created with this dynamic software. It also enables the interpretation of financial statement concepts based on the variations of the lines. GeoGebra, mathematical software, will feature a comprehensive income statement (CIS) as one of its relevant financial statements in financial accounting. Starting with an equation containing 15 variables, 2 are selected to represent the abscissa and ordinate axes, while the remaining 13 are considered parameters that can be adjusted by the user in the OIA windows. By changing these values, the equation will produce a straight line. It is worth noting that using OIA can be an effective strategy for enhancing one’s understanding of the basic sciences. The study emphasizes the significance of accuracy in financial management, the interplay among variables, and the utilization of technological tools to aid in comprehending these concepts.
With the progress of information and communications technologies, new teaching tools are being developed with greater reach. These tools can be used in a variety of ways to improve and promote the teaching of areas such as mathematics (Demirbilek and Žilinskienė, 2015). One such example, GeoGebra, is a tool designed by Markus Hohenwarter in 2002 for the teaching and learning of mathematics, and it is freely available in 45 languages online. GeoGebra allows the creation of dynamic worksheets as interactive Java applets embedded in HTML pages with dynamic constructions and interactive calculations on the internet (Velichova, 2011).
According to Bhagat and Chang (2015), students often think of geometric concepts as abstract and difficult to understand, which leads to lower student performance and contributes to a declining interest in geometry. This also happens with other mathematical concepts. On this basis, the authors conducted a study to examine the impact of using at this free educational software on the math achievements of students in the accounting sciences. The results indicated that GeoGebra is an effective tool for the teaching and learning of mathematical foundations (Romaito et al., 2021; Adelabu et al., 2022).
It is possible to develop interactive learning objects (ILOs) through means other than using computer programs such as GeoGebra software. For example, Holzinger et al. (2005) present a practical approach to m-learning that leverages what they refer to as mobile ILOs, which are used in mobile learning engines designed to run on mobile phones. These objects offer multiple possibilities for new methods of communication and exploratory learning (Al-Rahmi et al., 2022).
GeoGebra software, through the use of ILOs, can greatly benefit the understanding of math concepts. This software can also be used to understand new concepts involving the incorporation of International Standards Financial Reporting (IFRS) by small to medium enterprises (SMEs). According to Han and Krämer (2009) and Tamam and Dasari (2021), ILOs can help students better understand complex concepts and processes. Such objects can be used to stimulate students’ cognitive skills at the highest level, engaging them in interactive learning activities (Papastergiou and Mastrogiannis, 2021).
GeoGebra software began to be applied in the areas of accounting, costs, and financial indicators due to a research internship held by one of the authors of this study as part of the development of that author’s Masters in Accounting at the Universidad de Medellín and the Instituto Tecnológico Metropolitano (ITM), which are both institutions that focus on technological innovations (Gaviria, 2013).
Legislative decree No. 4946 issued on 30 December 2011 (Ministerio de Comercio, 2011) and No. 2784 issued on 28 December 2012 (Ministerio De Comercio, 2012a) indicate the following:
“…Technical Council of Public Accounts recommended to the Government that the process of convergence to international standards of accounting and financial reporting is carried out taking as a reference the International Financial Reporting Standards - IFRS-along with its interpretation, conceptual framework, the basis for conclusions and application guidelines issued by the International Accounting Standards Board – IASB.”
On the other hand, Law 1,314 instituted in 2009 (Congreso De La República, 2009), regulates the principles and norms that are needed to pursue the adoption of international standards of accounting and financial reporting. This law aims to ensure that state issues accounting laws, financial reporting, and information assurance, which “… must be fulfilled by the natural and legal persons required to maintain accounting (…), and who are not required to assert their accounts as evidence” (Ministerio de Comercio, 2012b).
The Technical Council of Public Accounting (CTCP), in compliance with Law 1314 of 2009 and with its own regulations, classifies users of accounting into the following three groups: (a) general, (b) microenterprise, and (c) simplified (Cuaspa, 2013). For each group, there are a number of laws governing convergence to international standards.
The comprehensive income statement is a financial statement that includes “items of Income and Expenses (including reclassification adjustments)” not recognized in the income statement for the period as required or permitted by other IFRS (IAS 1 paragraph 7) (Ministerio De Comercio, 2015). This statement comprises components of the “result” and another “comprehensive result.” Therefore, understanding and applying the equation of the straight line is necessary. The income statement includes gross profit, profit before taxes, profits for the year, continuing operations, profit for the year, and total comprehensive income for the year.
When considering the equation of the linear function y = mx + b, it is important to note that the slope “m” represents the rate of change, while the intercept with the ordinate axis “b” represents the initial value. How does understanding and relating these mathematical concepts help interpret the relevant factors for analyzing information and making decisions in a comprehensive income statement?
The use of information and communication technologies (ICTs) has become essential in the field of education and has had a profound impact in recent decades, bringing about significant improvements in the effectiveness and efficiency of the educational process. This impact is even more significant in an increasingly interconnected and globalized world, where the traditional physical campus may become less relevant. In this context, it becomes imperative to consider the adoption of a hybrid educational model that leverages the transformation brought about by technology in disciplines such as accounting, with the goal of enabling students to pass exams and obtain professional certifications through the strategic and effective incorporation of emerging information technology tools (Dahawy and Kamel, 2006). This approach not only enriches the educational experience but also meets the demands of an ever-evolving world where connectivity and accessibility to digital resources play a fundamental role in shaping competent professionals in the field of accounting.
In this regard, the integration of technological tools in the field of accounting education is particularly crucial in management. This process not only enables students to acquire strong competencies in both disciplines but also equips them to apply these skills to generating relevant accounting information (Lane and Shellard, 2009). Thus, in recognition of the ever-changing dynamics of business and technological environments, higher education in accounting has undergone a significant transformation, leading to the design of new programs focused on information technology. These programs aim to foster essential skills such as teamwork, creativity, and competence in enterprise resource planning (Pereira and Oliveira, 2016).
Moreover, in the field of accounting education, distance learning has proven to be highly effective, effectively meeting the demands of students and ensuring the delivery of quality education, as evidenced by previous studies (De Melo et al., 2018). This pedagogical approach has evolved over time to go beyond the mere transmission of accounting theory to include training in business research with the aim of cultivating critical skills, problem-solving abilities, and communication skills (Ong and Djajadikerta, 2019). Furthermore, additional research has supported the notion that incorporating visual elements and simulations into the classroom significantly increases the effectiveness of the learning process (Suwarni and Budiprayitno, 2019).
Computer simulations have become an essential part of modern scientific research, playing a significant role in the generation of knowledge and in the teaching of science. For example, GeoGebra, an open-source software, stands out as a versatile and adaptable resource that allows the creation of simulations in an accessible way, thus contributing to the improvement of teaching (Matos et al., 2023). In addition, this teaching approach is integrated with a project-based learning approach carried out through an electronic education system with the support of the application’s learning resources. Therefore, it is expected that the development of creative thinking in mathematics at the educational level can provide new perspectives on solving mathematical problems, assessing dimensions of creative thinking in mathematics through aspects such as fluency, flexibility, depth, and originality (Munahefi et al., 2023).
In this regard, the incorporation of digital technologies in education has proven to be a critical factor in stimulating motivation and significantly improving student performance, opening the possibility of extrapolating these successful strategies to various academic areas (Pinto and Durán-Aponte, 2020). These technologies also promote a deeper understanding of financial statements in the context of the public sector while encouraging a self-directed learning approach (Cohen and Karatzimas, 2022).
In the 21st century, the integration of appropriate technologies in education is presented as an unavoidable requirement to meet the growing demands and evolution in the field of accounting. In this context, the urgency for educators to acquire technological skills through their participation in specialized development and training programs is emphasized (Dangi et al., 2023).
In this context, interactive learning objectives (ILOs) are complementary tools that support inclusion and facilitate access to teaching and learning resources for diverse individuals. Consequently, they play a fundamental role in promoting improvements in educational processes, equity, and the diversification of education. ILOs consist of digital resources with defined educational objectives, such as courses, images, videos, and documents which can be reused in different educational environments, offering flexibility and adaptability. Their main purpose is to support learning through technology, promote inclusion, improve educational processes, promote equity and diversification in education, and contribute to the reduction of duplication and costs in the design of distance education courses (Montoya et al., 2020).
Interactive learning objects (O.I.A.) are educational resources designed to facilitate learning. They can be created using various software and are intended to be interactive, accessible, and engaging for students. Infographics such as links, buttons, images, and animations can be inserted to present information in a more attractive way, enhancing understanding of the different learning topics. This modeling approach can be applied to mathematics to improve participation and knowledge retention.
GeoGebra is one of the main software tools used for designing O.I.A. simulations. It allows students to interact with the machine by changing real-life data values in the windows. This interaction enables students to observe how a graph transforms and draw conclusions based on what they are learning in that area of knowledge. The effectiveness of these resources is evident in the development of cognitive skills and the ability to draw one’s own conclusions on a particular topic (Table 1).
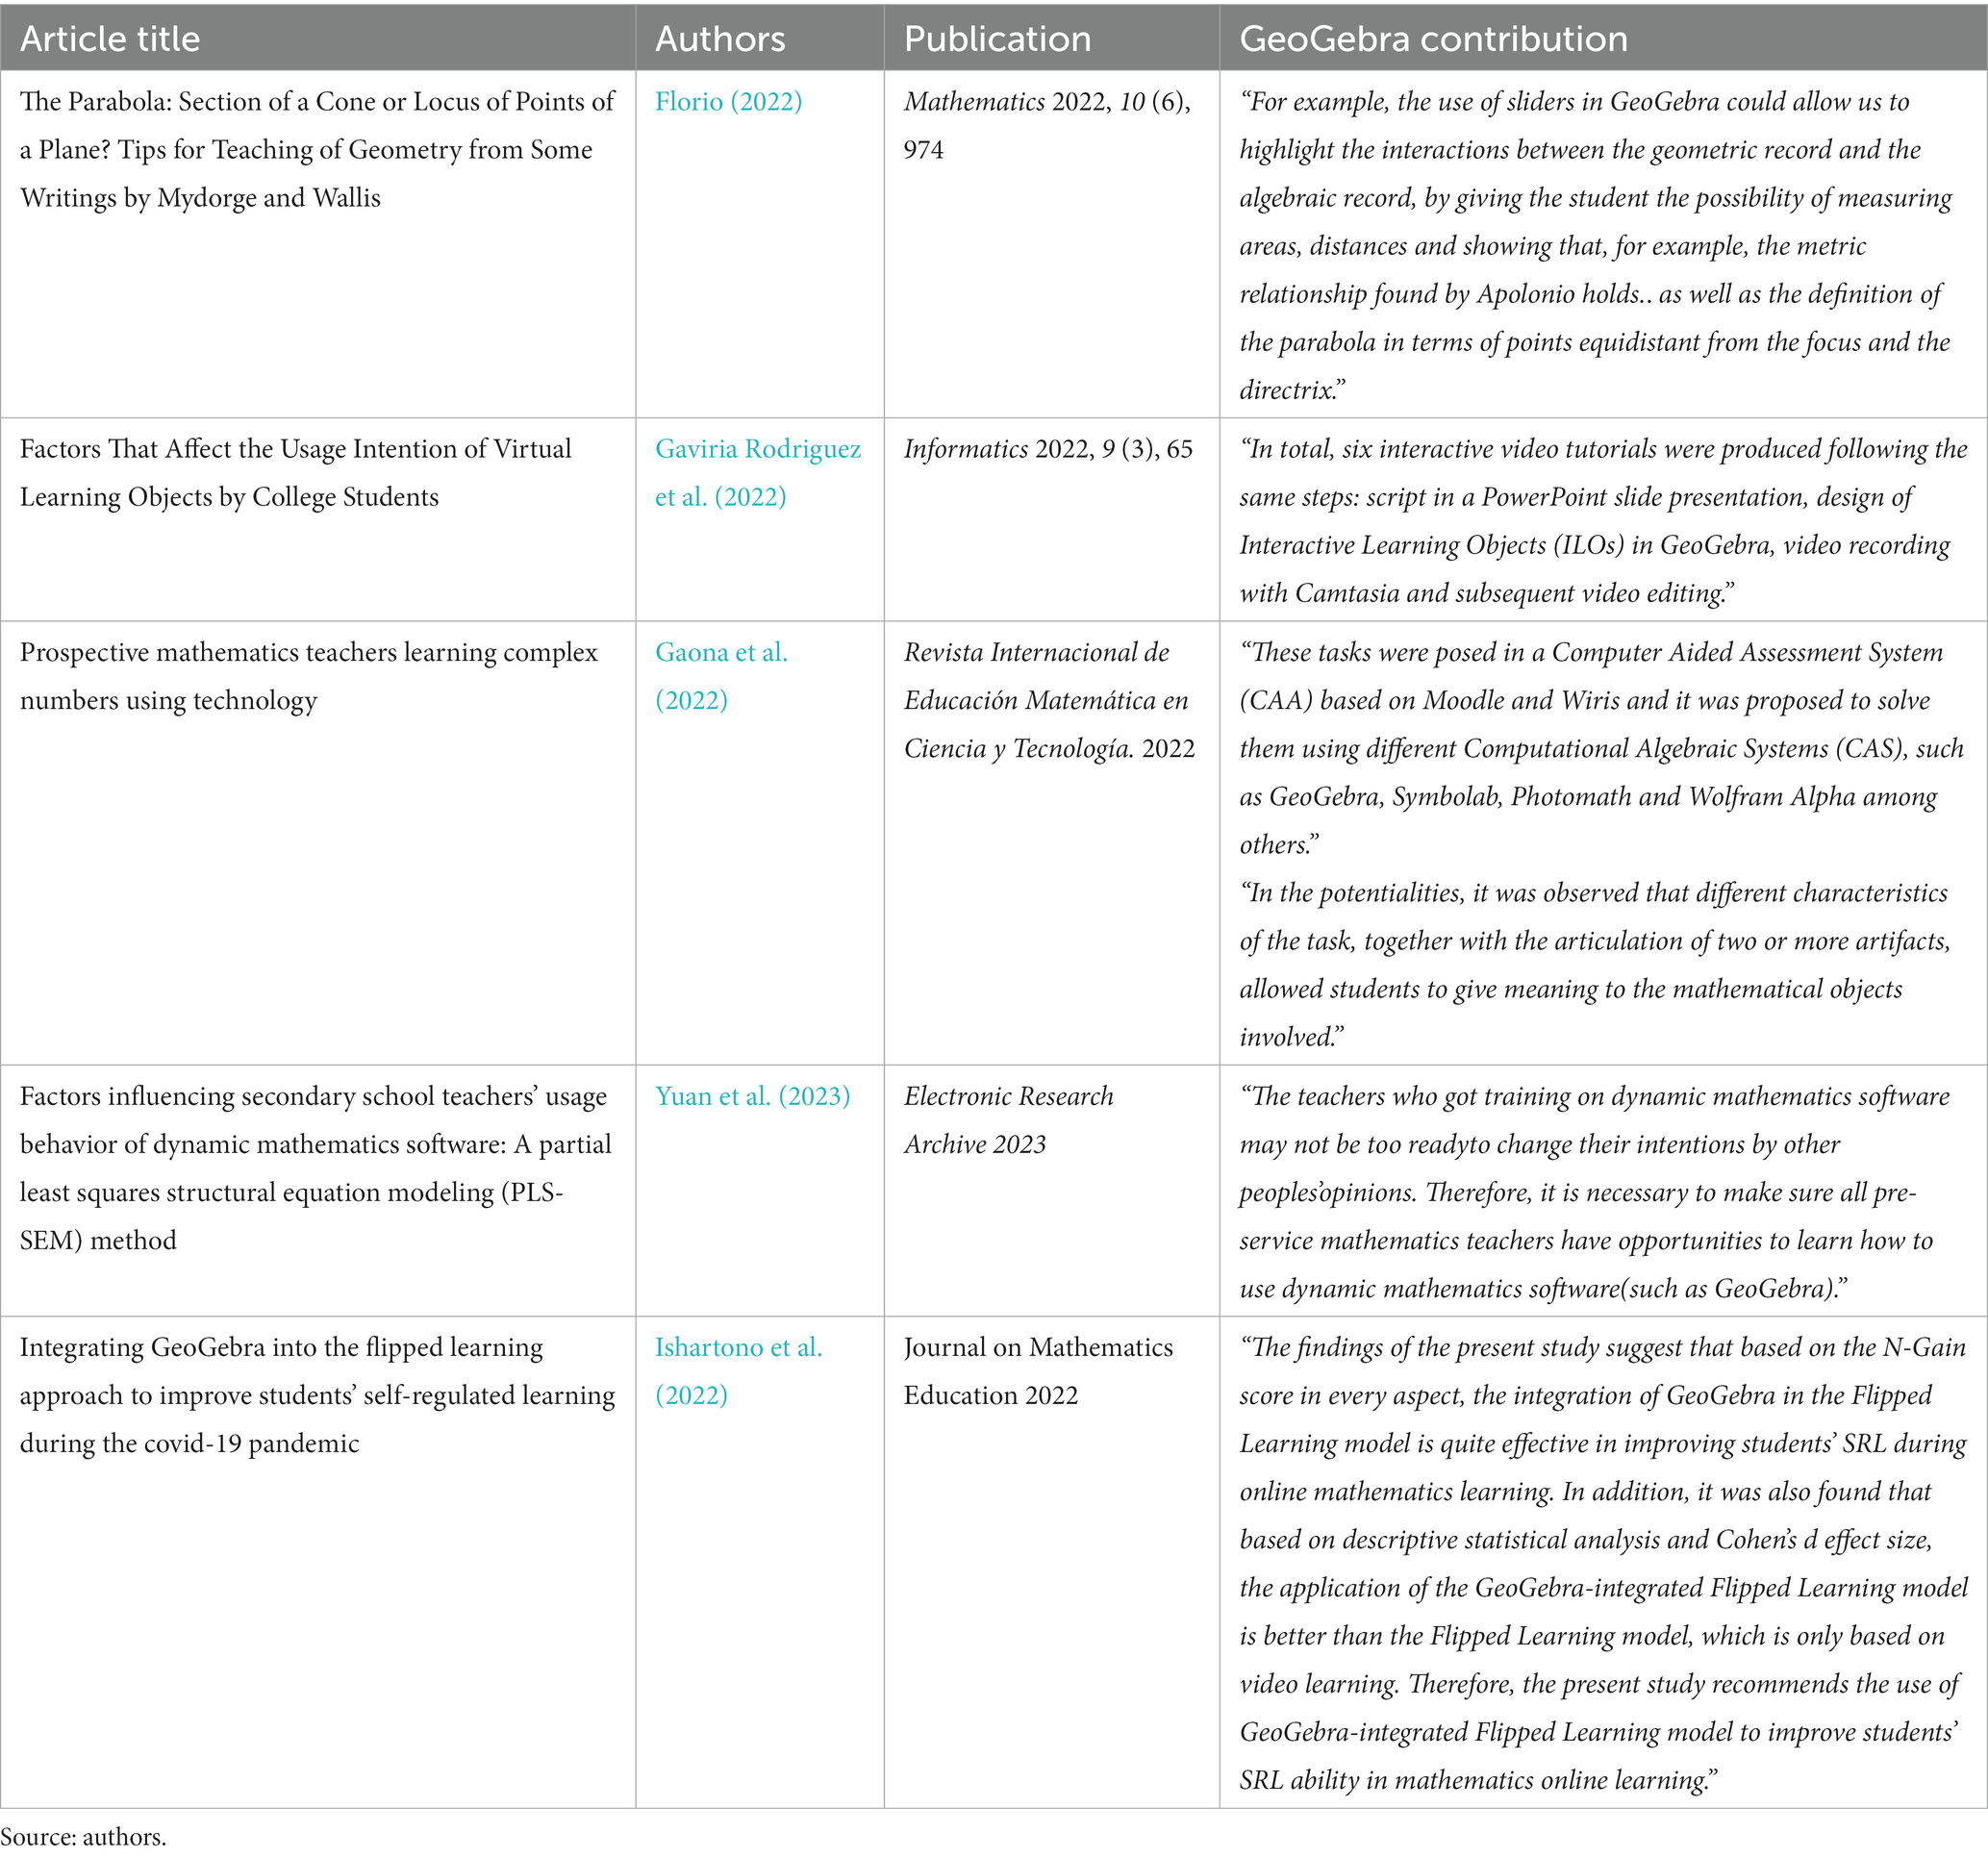
Table 1. Findings in the last 2 years of published research works where O.I.A. was used with GeoGebra software.
The methodology employed in this study is exploratory and descriptive, incorporating quantitative elements. Numerical data and parameters related to accounting and finance are integrated and represented graphically through an interactive learning object in the GeoGebra software. This graphical representation allows for the dynamic manipulation of data, enabling real-time quantitative analysis. This research approach involves iterative processes using the comprehensive income statement. Two variables are plotted on a Cartesian plane, while the other variables are used as parameters. Through cycles of activities, information is gathered and used to optimize work in subsequent iterations. This results in a hybrid approach that combines iterations and interactions.
GeoGebra is dynamic and free software that allows users to interact and create designs in different areas of knowledge. It provides the opportunity to create a digital space where data can be manipulated according to the needs of the problem, and the related graph or curve of the problem will immediately adapt to those changes. This software allows for the graphing of mathematical formulations where algebra, geometry, calculus, physics, statistics, and other areas of knowledge are related to mathematical formulations such as financial mathematics, costs, and budgets.
This software is the result of a master’s thesis project conducted by Markus Hoherwarter at the University of Salzburg in 2002. In recent years, GeoGebra has become an open-source project, relying on a group of 15 developers and more than 100 translators around the world. The latest version of GeoGebra dynamically provides multiple representations of mathematical objects through its graphical, algebraic, and spreadsheet views. GeoGebra is illustrated in Figure 1. It is currently available in 50 languages and has received several educational software awards in Europe and the US (e.g., the AESA 2002, Digita 2004, Comenius 2004, eTwinning 2006, AECT 2008, BETT 2009 finalist, eureleA 2009 finalist, and TechAwards 2009). Apart from its independent application, GeoGebra also enables the creation of interactive web pages with embedded applets (Hoherwarter and Lavicsa, 2007). These learning environments and demonstrations can be freely shared by mathematics teachers using online platforms such as GeoGebraWiki. Since 2004, the number of visitors to the GeoGebra website has increased from 7,000 per month to more than a half million per month across 190 countries.
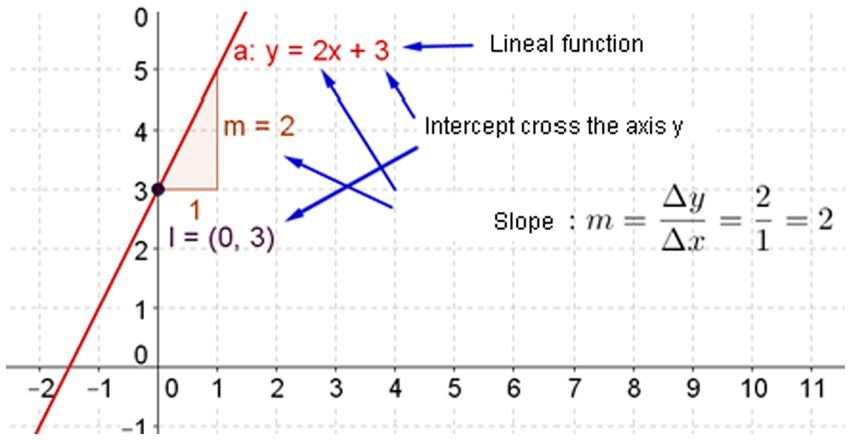
Figure 1. Fundamental elements of a straight line. Source: authors.
The linear function takes the form y = mx + b, where “x” is the independent variable and “y” is the dependent variable; the coefficient of “x” is the slope (m) – gradient-, and “b” is the intercept that crosses the “y” axis. Figure 1 shows an example of these elements, which are fundamental to applying the concepts of an income statement.
GeoGebra software was designed with five linear functions, where the x-axis is the number of sold articles (“Q”) and the y-axis is the profit in monetary units (CU). The other values are parameters in GeoGebra software.
The following windows can be designed using GeoGebra software. The parameters and values are fixed according to the problem situation, i.e., these values can be varied in each problem, and the resulting graph responds immediately. The windows are as follows:
Total administrative expenses (in CU): AE.
Cost of sales per unit (in CU): Cs.
Income tax rate (between 0 and 1): Itr.
Single line items sold: Q.
Sale price per unit (in CU): Pu.
Distribution expenses (in CU): Dc.
Financial expenses (in CU): Fc.
Other incomes (in CU): OI.
Associated profit participation (in CU): APP.
Interest, dividends, royalties, rents (in CU): I.
Some actuarial profits or losses (in CU): Act.
Year earnings or losses from discontinued operations (in CU): YEdc.
Changes in coverage instrument values (in CU): CI.
Profit or losses by exchange of financial statements (in CU): EFS.
In this study, validity refers to the accuracy and truthfulness of the interpretations, inferences, and conclusions drawn from the integration of GeoGebra software as an educational tool to enhance financial understanding. Validity ensures that the results obtained and the insights gained from utilizing GeoGebra in teaching financial concepts are indeed representative of real-world applications and that they effectively contribute to the enhancement of mathematical literacy and financial comprehension. It encompasses the appropriateness and relevance of the study’s approach in demonstrating the applicability of GeoGebra in a financial context, supporting the understanding of mathematical relationships and their representation in financial scenarios.
Reliability, in the context of this study, relates to the consistency and stability of the results and conclusions obtained using GeoGebra. It ensures that the findings regarding GeoGebra’s effectiveness in teaching financial concepts, emphasizing mathematical literacy, can be replicated consistently in similar educational settings or with different groups of students. The methodology and application of GeoGebra should yield similar outcomes and insights over multiple instances, reinforcing the dependability of GeoGebra as a tool for enhancing financial understanding and the integration of mathematical concepts. Reliability underscores the consistency and trustworthiness of the study’s approach and the potential for its application in various educational contexts.
There is a company that uses the permanent inventory system as an accounting policy, does not consider inventory stock, and has a commercial activity that buys and sells a single product line. The following information is available: number of articles sold (40), product price (300 CU), cost of sales (100 CU), total administrative expenses (5,000 CU), income tax rate (25%), distribution cost (8,580 CU), financial charges (2,300 CU), other income (0 CU), associated profit participation (3,100 CU), interest, dividends, royalties, rents (8,000 CU), some actuarial profits or losses (ACT) (−720 CU), year earnings or losses from discontinued operations (−1,300 CU), changes in coverage instrument (CI) values (380 CU), and profit or losses resulting from the exchange of financial statements (1,260 CU).
Gross profit (GP) equals the sale price of all units less the cost of sales of all units plus interest, dividends, royalties, and rents (Equation 1).
The model for this calculation is as follows:
Look at Equation (1) where the gross profits are positioned on the y-axis (dependent variable) and “Q” is positioned on the x-axis (independent variable). If Q is removed as a common factor, equation one changes to the following:
where the slope of the linear function is (Pu – Cs), and I is the intercept that crosses the ordinate axis.
Figure 2 is a screenshot of the GeoGebra software, where values are placed in windows according to the problem at hand. The linear function for gross profit (Equation 2), according to the values placed in the windows, would be:
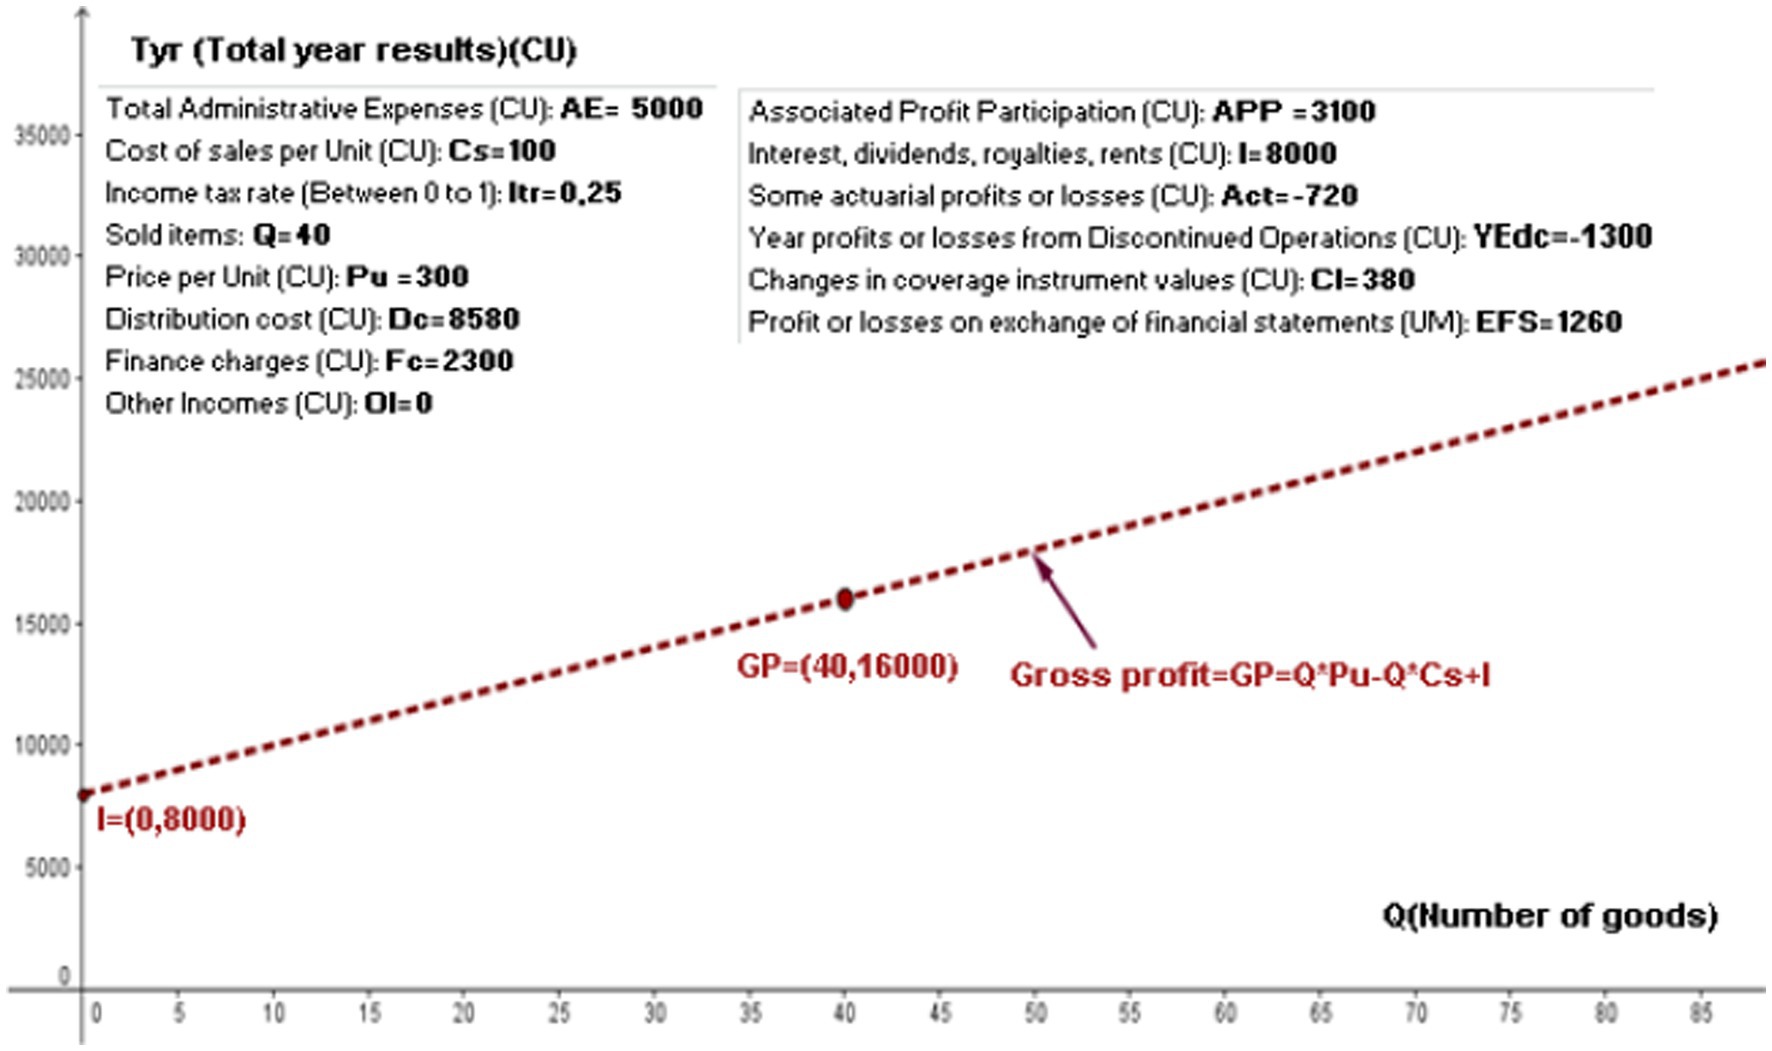
Figure 2. Linear function of gross profit. Source: authors.
Equation (3) shows that the slope of this linear function is:
, and the intercept with the axes is I = 8,000 CU, as shown in Figure 2 with the point I = (0, 8,000).
Specifically, after the sale of 40 articles, the gross profit would be:
This is shown in Figure 2 by GP = (40, 16,000), which represents the value of sold articles plus the operational incomes, which can take the form of interest, royalties, and rents, without considering alternate expenses derived from ordinary activities, such as staff costs and depreciation.
Earnings before taxes (Ebt) are equal to gross profit less administrative expenses plus distribution costs plus other incomes less finance charges plus associated profit participation (Equation 4), which is represented as follows:
However, Therefore, Ebt would be derived from Equation (5):
where is the slope of this linear function, which is the same slope as that of gross profit, indicating that these lines are parallel to each other.
The intercept with the y-axis of the “Ebt” function would be the independent variable; in other words, this would be the term that is not multiplied by the “Q” variable. That is,
Figure 3 uses the same values that can be observed in the windows of Figure 2 and graphs the lines for both “Gross Profit” and the Ebt, showing that these lines are parallel.
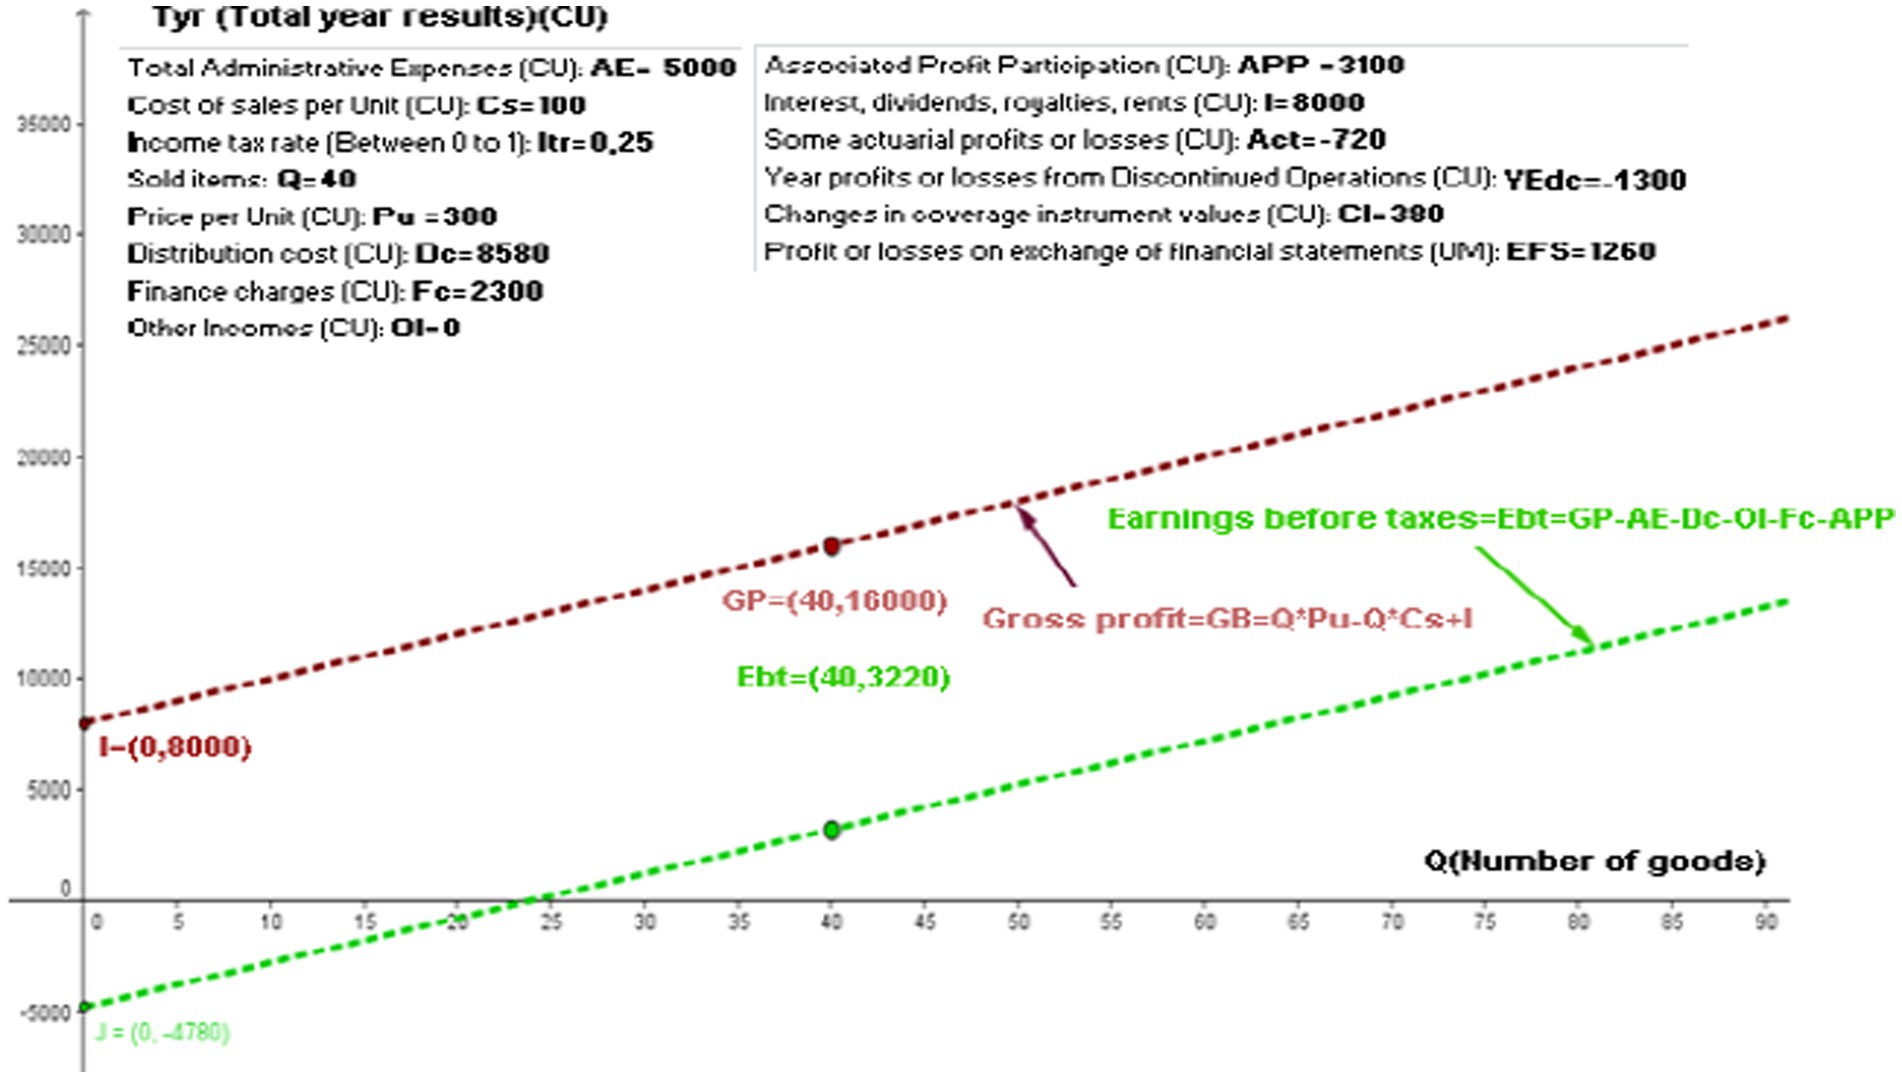
Figure 3. Linear function of gross profit and earnings before taxes. Source: authors.
The intercept with the y-axis of the linear Ebt function is . Therefore, the linear function (Equation 6) of earnings before tax would be
The point J = (0, − 4,800) in Figure 3 shows the intercept with the y-axis, which means that if the articles are not sold, a loss of 4,800 CU will be incurred, which is given by the sum of incomes (dividends, royalties, etc.), less the alternate expenses from ordinary activities.
Once it has sold 40 articles, the Ebt is:
This is reflected in Figure 3 by the value Ebt = (40, 3,220).
This figure indicates that more than 25 articles must be sold in order to result in Ebt. To determine how many articles need to be sold to avoid losses, the equation is:
, then Ebt = 0, which solves for Q:
Then, the formula indicates that it is necessary to sell 24 or more articles to avoid a loss before taxes.
Year earnings from continuing operations (YEc) (Equation 7) equal earnings Ebt, less earnings before tax multiplied by the income tax rate:
However, according to Equation (5), by replacing Equation (5) in Equation (7), the results indicate that the YEcs (Equation 8) are:
If each variable is multiplied by , “Q” will have the coefficient , and it will be equal to the slope of this linear YEc function, which is different from the Gross profit and Ebt functions.
The intercept with the y-axis indicates the independent variable of the YEc function. In other words, this intercept occurs at the value that is not multiplied by the “Q” variable:
Figure 4 still shows the same values as Figure 2 and uses the same line graphics for gross profit, Ebt, and YEc. The first two lines are parallel, while the third line always has a smaller slope because it is not reflective of “ as are the figures before, but rather of , which is multiplied by a value of “ ,” which is a value that is less than unity.
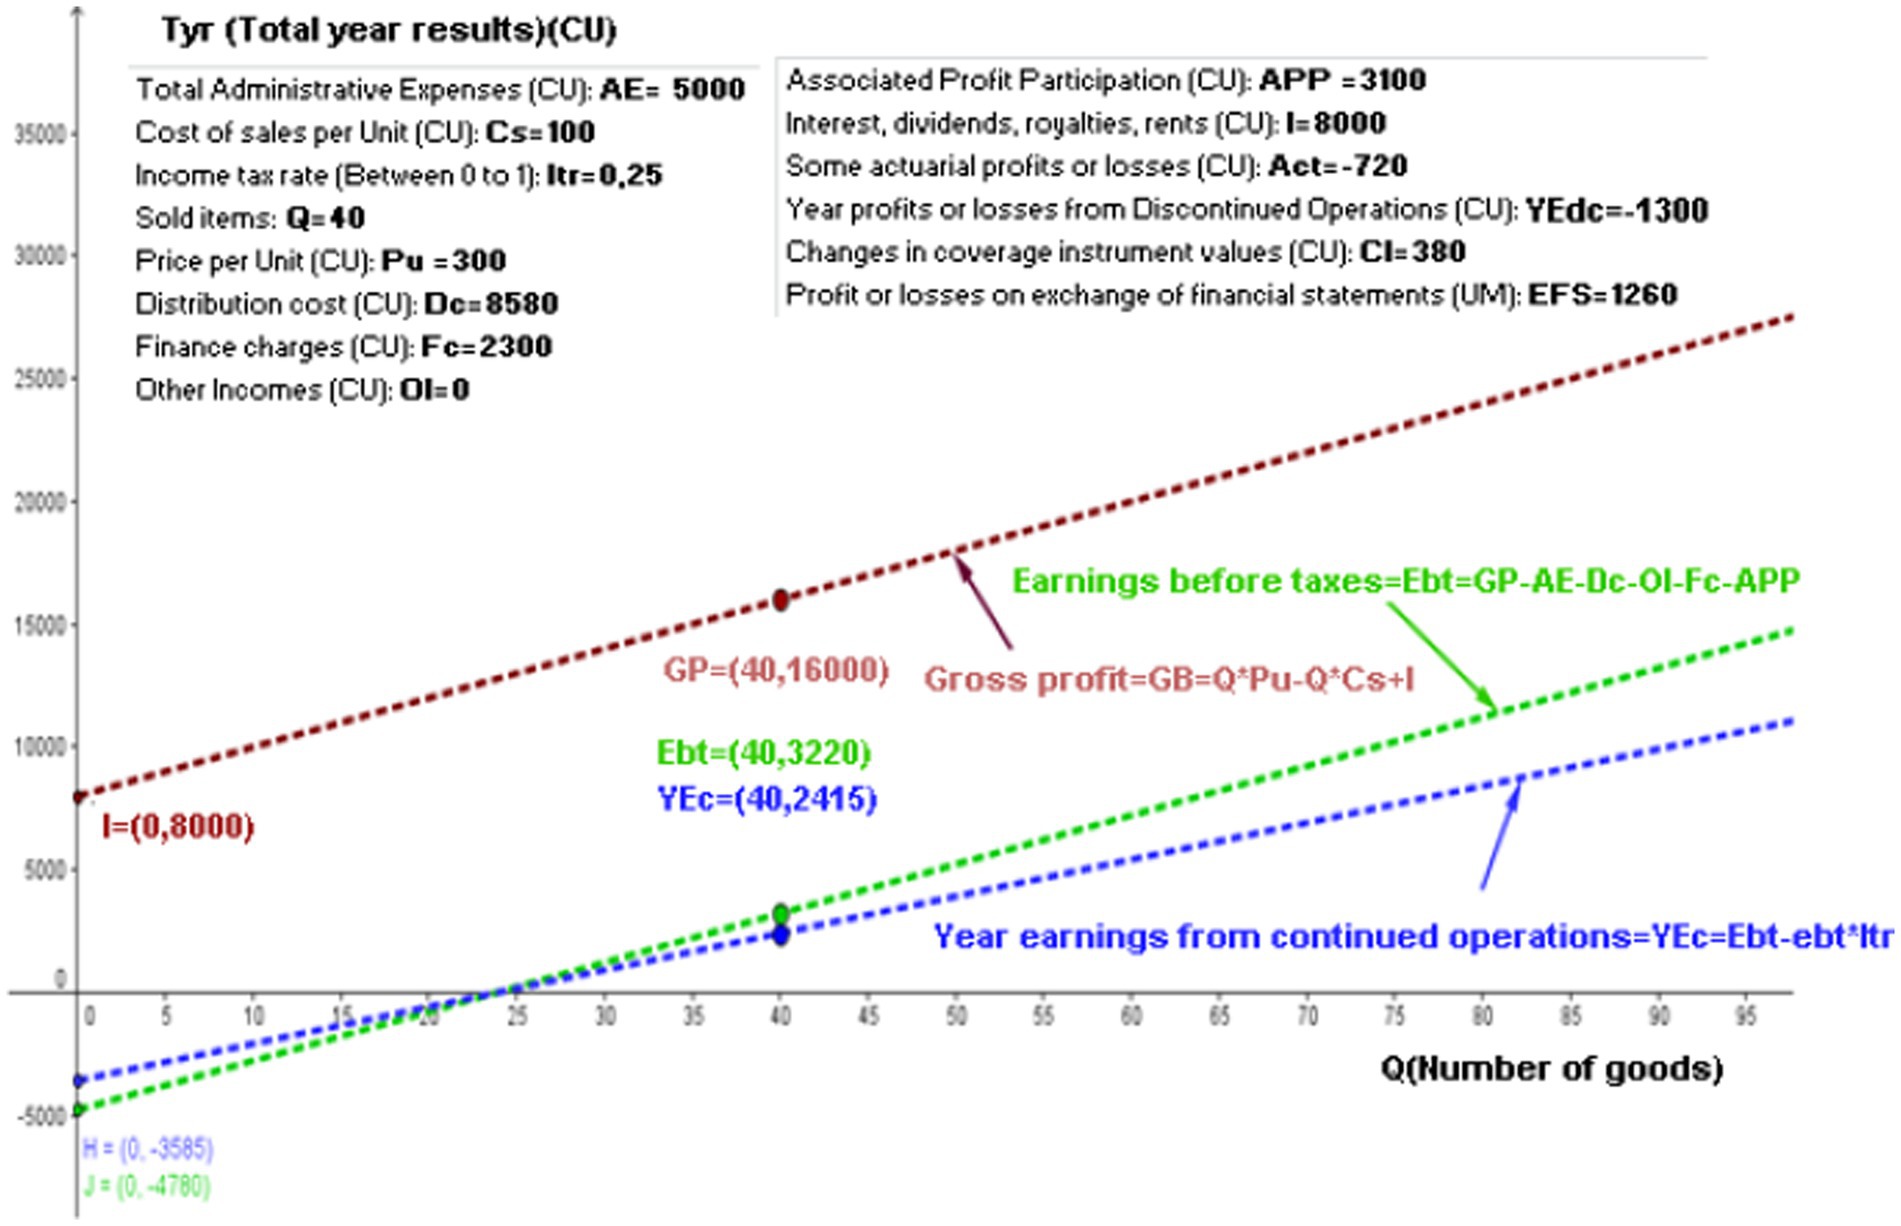
Figure 4. Gross profit, earnings before taxes and year earnings from continued operations linear functions. Source: authors.
The slope in the first two lines is , while that in the third line is
This means that while more articles are sold and the costs and selling expenses are proportionate to these increases, the YEc falls below the Ebt because of tax liability.
The intercept with the y-axis of the linear YEc function is . Thus, the linear YEc function (Equation 9) would be:
The point H = (0, − 3,585) in Figure 4 shows the intercept with the y-axis. Once 40 articles have been sold, the YEc becomes:
This is indicated in Figure 4 by the value YEc = (40, 2,415).
The year profit (YP) equals the YEc plus the year loss or earnings from discontinued operations, resulting in Equation (10):
The slope of this line (Equation 11) is the same as the slope of the YEc line:
The independent variable, or the intercept with the y-axis of the “YP” function, is the same as that of the “YEc” except that it adds the year loss or earnings from discontinued operations (YEdc) function. This intercept is:
Figure 5 shows the GeoGebra software with the same values as those in the windows of Figure 2, the straight line graphs of the gross profit, Ebt, YEc, and year profits. It clearly shows that the first two lines are parallel to each other, as are the last two.
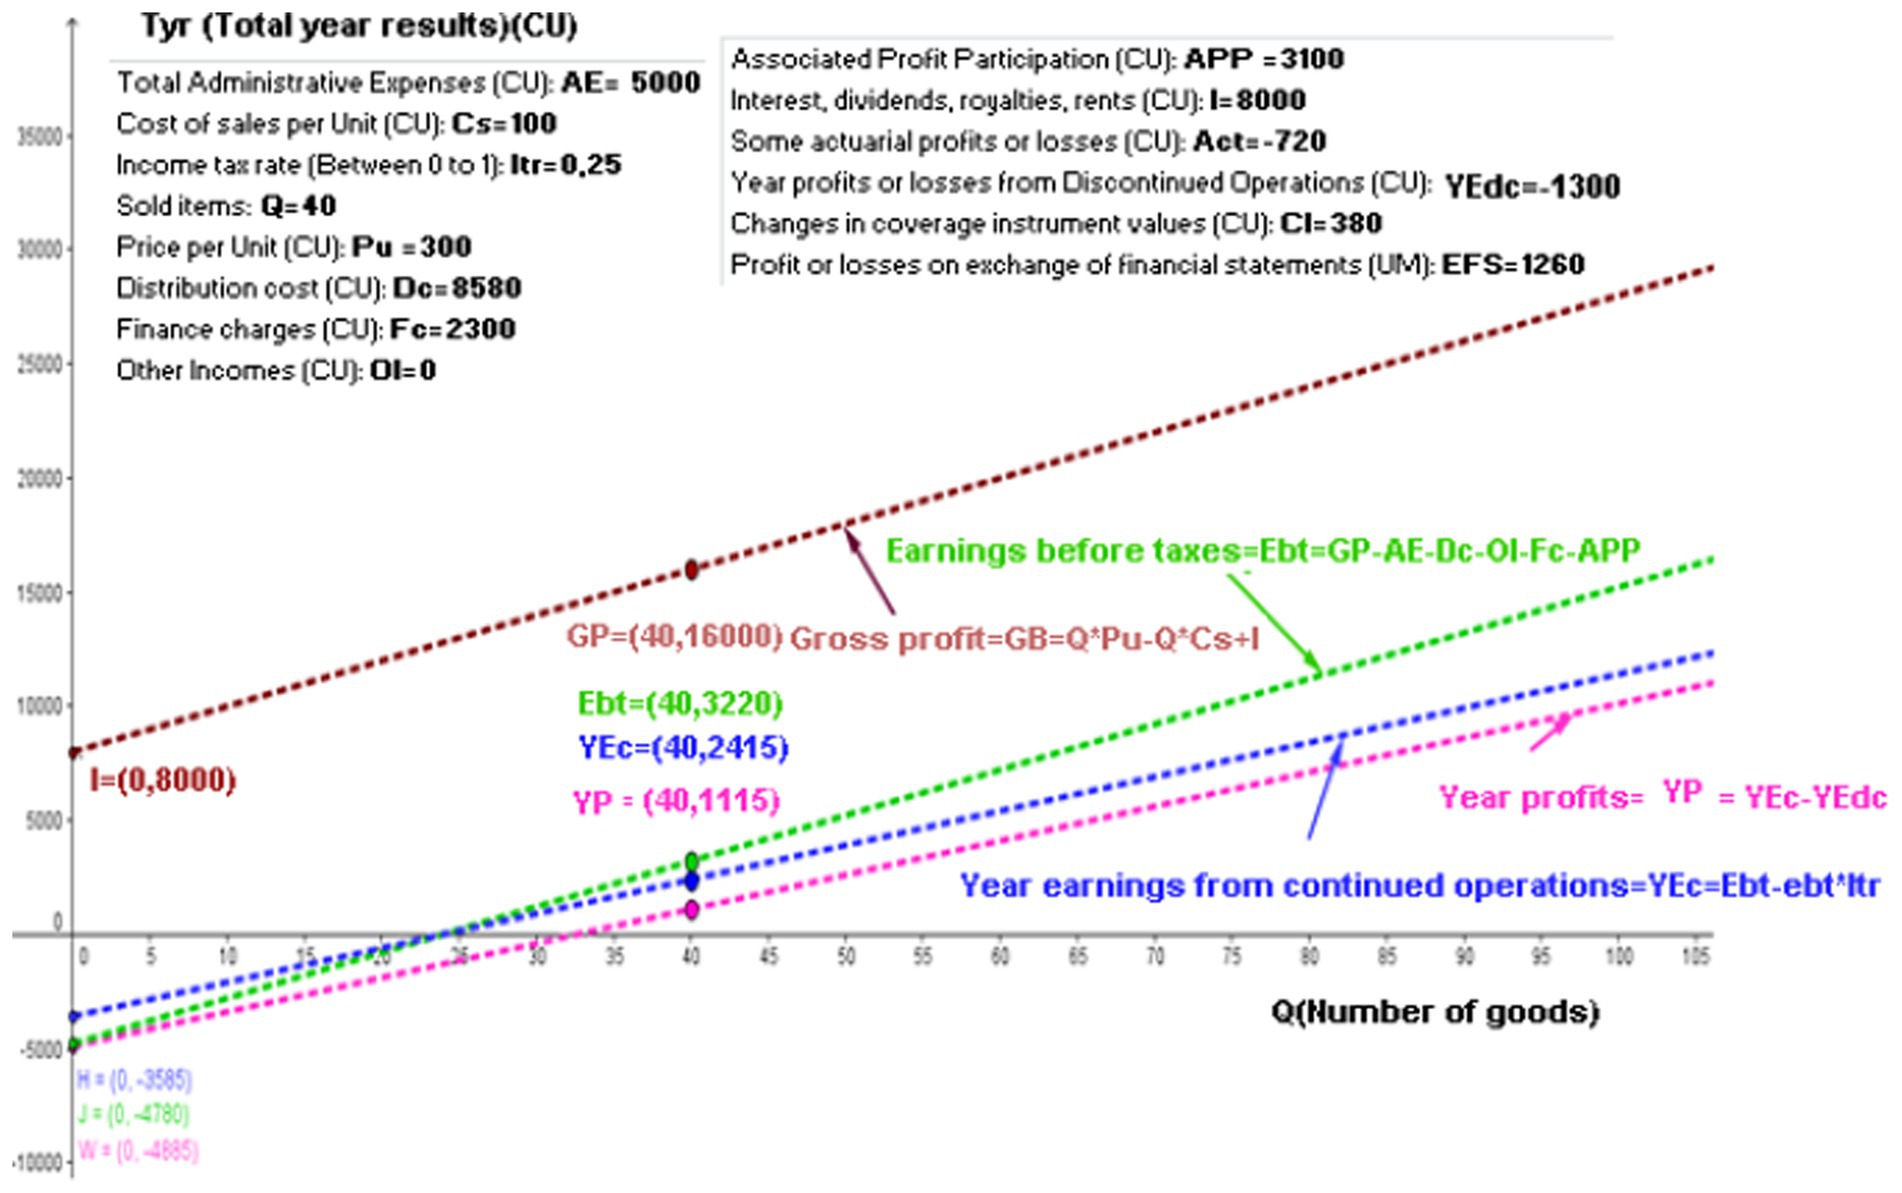
Figure 5. Gross profit, earnings before taxes, year earnings from continued operations, and year profits linear functions. Source: authors.
The intercept with the y-axis of the linear “YP” function is = = −4,885. Therefore, the linear year profit functions (Equation 12) are:
The value W = (0, −4,885) shown in Figure 5 indicates the intercept with the y-axis. Once it has sold 40 articles, the annual profit will be
The value YP = (40, 1,115) shown in Figure 5 reflects the previous result.
When the lines for YEc and YP are compared, the only difference that can be found between them is that the YEdc parameter is positive. In this case, the value YEdc = −1,300 in the linear function indicates that the YP is 1,300 CU under the YEc.
In the case where there is no YEdc problem, both lines would be the same: one would be above the other.
The net year profit (NYP) function results from taking the YP linear function, adding the “Profit or losses by exchange of financial statements,” the ACT, and the CI values (Equation 13).
That is,
Replacing Equation (11) into Equation (13) gives Equation (14):
where the slope of the line for “earnings of continued operations” and YP is the same:
The intercept with the y-axis of the “NYP” functions is the same as that for “YP,” except that it adds EFS, Act, and CI:
Figure 6 shows the five linear functions available in the GeoGebra software. Assessing these functions using the values shown in the windows is the aim of this study. The net year profit (NYP) linear function is parallel to the YEc and YP functions. The intercept with the y-axis of the linear “Net” function is
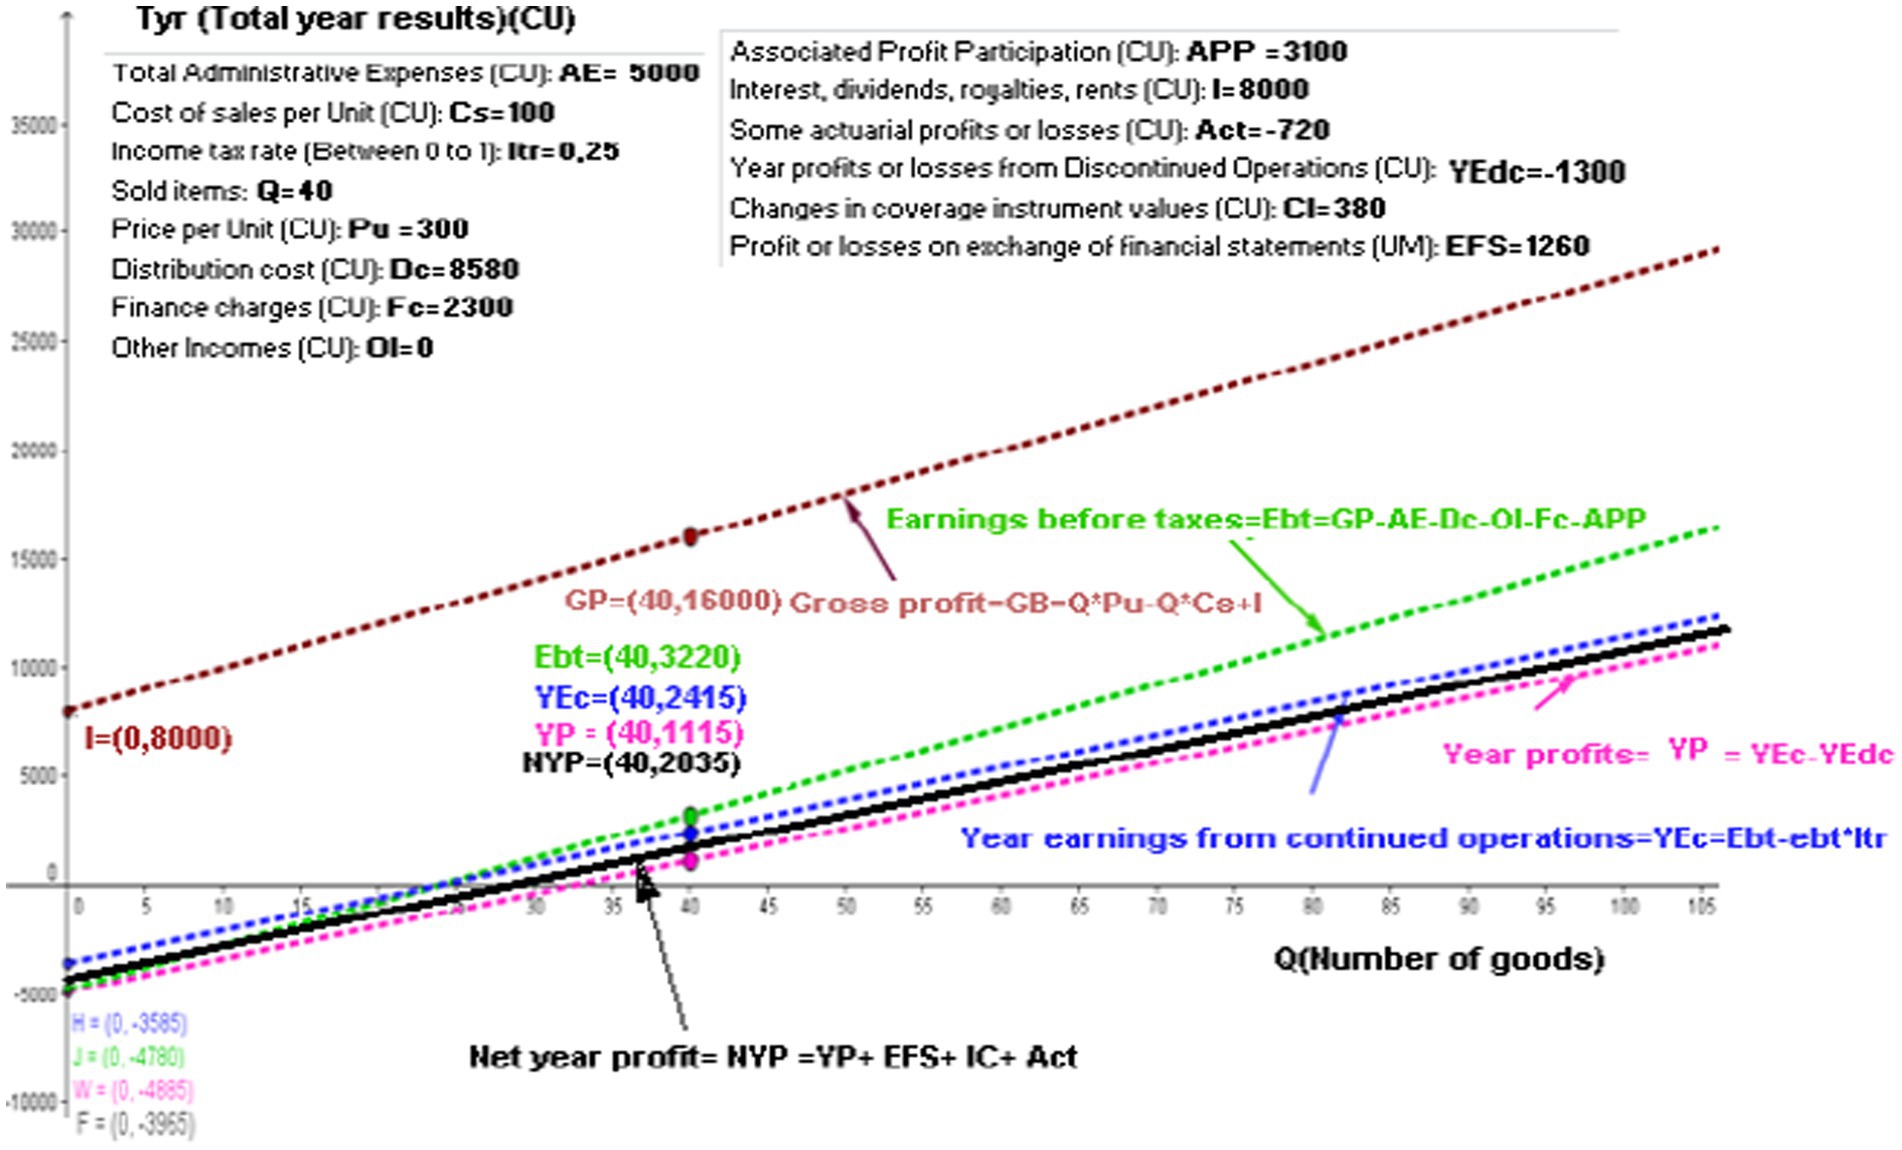
Figure 6. Modeling of gross profit, earnings before taxes, year earnings from continued operations, year profits, and net year profits linear functions. Source: authors.
The NYP linear function would (Equation 15) thus be
The value F = (0, −3,965) shown in Figure 6 indicates the intercept with the y-axis.
Once it has sold 40 articles, the NYP is = 6,000 CU – 3,965 CU = 2,035 CU
Figure 6 shows the value NYP = (40, 2,035).
In the case of an enterprise that does not have the Act or CI parameters, the calculation of “Profit or losses by exchange of financial statements” is not necessary to show this linear function because it would be the same function as that for YP.
Unlike previous and current research in this area, it is important to highlight the connections and differences with other related studies. For example, Rodríguez et al. (2016) used an interactive learning object (ILO) based on GeoGebra to teach differential calculus and costs. Our study, however, focuses on a financial context and demonstrates the effectiveness of GeoGebra in teaching financial concepts such as present value, net present value, and internal rate of return. This broadening of focus underscores the versatility of GeoGebra as a valuable tool for teaching a wide range of mathematical concepts.
Similarly, Arango et al. (2015) used an ILO in combination with GeoGebra, focusing on improving the understanding of financial formulas. In contrast, our study goes beyond financial formulas by emphasizing the importance of mathematical literacy in the context of financial decision-making. Our research emphasizes that mathematics, particularly differential calculus, is fundamental to understanding financial concepts and making informed financial decisions, and we emphasize the expansion of mathematical literacy in the financial domain.
On the other hand, Hohenwarter and Hedes (2016) focused on the GeoGebra resource-sharing platform and the identification of high-quality instructional materials. While they addressed the need to evaluate the quality of educational content, our study does not specifically focus on the evaluation of educational resources. Instead, we focus on the practical application of GeoGebra as an effective teaching tool, demonstrating its usefulness in improving the understanding of financial and mathematical concepts.
The study in question, despite its immersion in the seemingly complex field of mathematics, offers valuable practical lessons that can be beneficial to students not well versed in mathematical disciplines. First, it highlights the importance of precision in financial management in the business environment. Regardless of a student’s specialization, understanding how to gather and use accurate financial data is essential. This requirement translates into the ability to interpret financial statements, identify costs and revenues, and evaluate the performance of a business entity.
In addition, the study illustrates the interplay between various financial variables. For example, it shows how taxes can have a significant impact on a company’s profits, emphasizing the importance of considering tax implications when making financial decisions. This lesson is critical in today’s business environment, where financial decisions must be supported by rigorous analysis and a deep understanding of the relationships between different variables.
The use of technological tools, such as GeoGebra software, to visualize and better understand these concepts also emerges as a noteworthy aspect of the study. This may motivate students to embrace technology as an ally in their financial decision-making process, as these tools can simplify and expedite complex analytical tasks.
In addition, the study emphasizes that, while mathematics may seem challenging, it is a fundamental element in making informed and sound business decisions. Even for students without a math background, a basic understanding of financial concepts and their practical application can make a difference in their ability to contribute to the success of an organization or to make informed financial decisions in their personal lives. Therefore, this study emphasizes the importance of financial literacy and the ability to apply mathematical concepts in a business context and in decision-making.
The study offers a contribution to the literature by showing how GeoGebra, originally a mathematical tool, can be effectively applied in the financial domain. In addition to its interdisciplinary versatility, this approach offers valuable insights for teaching mathematics by making financial concepts more accessible and relevant to students. GeoGebra’s ability to create dynamic visualizations and its status as an open-source project with global contributors also highlight its relevance in education and research, making a significant contribution to the academic literature and knowledge in general.
The method leads students to understand that mathematics is not an insurmountable barrier but a powerful tool for analysis and decision-making in a financial context. By showing how numbers and formulas can be used to evaluate business performance, the study illustrates that mathematics can be applied in a tangible and relevant way.
To increase their competence and confidence in applying mathematics in an accounting context, students can use several strategies and resources. First, they can seek out tutorials and online resources that simplify specific mathematical concepts related to accounting. These resources often provide pragmatic examples and clear explanations that facilitate understanding.
Figures 2–6 depict Cartesian planes with the ordinate axis labeled as “Ria (Total Comprehensive Result of the year) (u.m.)” and the abscissa axis labeled as “Q (Number of articles).” Additionally, there is a window displaying “Single line items sold: Q=” to enable the identification of any coordinate point (Q, Ria) on the straight lines.
Figure 2 shows the linear function of gross profit. If there is a change in the sales price or acquisition cost, it will be reflected in a change in the slope of the line, resulting in a change in the gross profit. However, if the quantities sold remain the same while maintaining the same sales price and acquisition cost, there will be no changes in the slope, but there will be changes in the gross profit.
The profit before taxes is represented by a linear function (see Figure 3). The text reflects that the term “independent” is represented by the sum of total administration expenses, distribution expenses, financial costs, other income, and participation in the profits of associates, due to the cost system in place. The linear functions of gross profit and profit before taxes are parallel because they have the same slope (the coefficient of “Q” is the same).
The linear function of profit for the year from continuing operations is shown in Figure 4. The slope of this straight line is lower than the slopes of the gross profit and continuing operations profit lines due to the intervening tax rate, which affects the number of items sold (Q) and is less than one. The tax rate also affects other variables unrelated to Q but related to the intercept of the ordinate axis. Income tax is calculated based on gross profit, which is then reduced by expenses and financial costs and increased by income and participation in the profits of associates. If income is less than expenses, the tax rate should not be calculated.
Figure 5 shows the linear function of profit for the year. The losses for the year from discontinued operations include the sale or closure of business segments or subsidiaries. It is important to note that the year’s loss from discontinued operations is separate from the losses incurred from the company’s normal continuing operations. The linear function of the profit for the year and the profit for the year from continuing operations are parallel because they have the same slope. This is because the coefficient of “Q” is the same.
Additionally, a linear function of the total comprehensive income for the year is shown in Figure 6. This figure includes the various components of other comprehensive income. Changes in the revaluation surplus, new measurements of benefit plans—actuarial calculations, changes in the fair values of financial instruments measured at fair value with changes in OCI, profit and loss of hedging instruments, and gains and losses produced by the conversion of financial statements. The components mentioned above are carried as other equity items (ORIs), which are classified as other comprehensive income. They are not related to the units sold ‘Q’. Therefore, the slope of the linear function of total comprehensive income for the year is the same as the slope of the linear function of profit for the year and the slope of profit for the year of continuing operations. In other words, these three lines are parallel.
This case illustrates the synergy between mathematical concepts and information and communication technologies (ICTs) applied to accounting. Following the International Financial Reporting Standards (IFRS) for small and medium enterprises (SMEs), the purpose of using financial statements is to free students and educators from a single framework and allow them to analyze and relate accounting formulas as meaningful mathematical functions that enhance the understanding of accounting concepts. This approach engages the student in the geometric aspect of graphs and their theoretical underpinnings in relation to financial results. The student interacts with an interactive learning object (ILO) and formulates inferences and questions that resolve the values presented in the ILO, generating different interpretations.
The results highlighted GeoGebra’s versatility and ability to dynamically represent mathematical relationships in a financial context. Linear function concepts were used to calculate gross profit, pre-tax profit, current year profit, and net profit for the year, proving to be a valuable tool for understanding and visualizing the financial implications of various business scenarios by allowing instant adjustments to values and observing their impact on results. Unlike previous studies that have focused on the use of GeoGebra for teaching pure mathematics, this approach targets its application in a financial context, underscoring GeoGebra’s versatility as an educational tool adaptable to a wide range of mathematical concepts.
The importance of precision in financial management is highlighted, emphasizing that this skill is essential regardless of the student’s specialization. It also emphasizes the interaction between financial variables and how decisions must consider tax implications. The use of technological tools is emphasized as a means of facilitating the understanding of these concepts and motivating students to use them in their financial decision-making.
In addition, the relevance of GeoGebra as an open-source project with global contributions is emphasized, making it a valuable tool for both education and research. These ideas are reinforced using its mathematical and geometric software, which allows the design of financial statements and simplifies their interpretation and analysis by visually displaying performance in different dimensions.
It is also necessary to consider the role of the teacher in creating an integrated learning environment (ILO) in accounting. The teacher must have a strong knowledge of basic mathematics, geometry, calculus, and information technology to provide meaningful instruction through the appropriate interpretation of graphs.
With this methodology, students could learn, which promotes active knowledge construction. This type of learning encourages metacognition, the ability to learn to learn, provided there is willingness, interest, and motivation to do so, considering that prior knowledge must be connected to the newly acquired knowledge. Therefore, emphasis is placed on the construction of knowledge through the integration of past and present experiences.
It is also important to combine this learning model with the dynamics of discovery-based learning, where the student becomes the protagonist of his or her own development, using tools provided by the teacher, in this case the ILOs used in the classroom. This approach promotes learning through action, manipulation, imitation, and experimentation, turning the environment into a source of meaningful learning. This enables the understanding and representation of abstract concepts and, combined with inductive, deductive, and transductive approaches, facilitates the collection and reorganization of data to discover new concepts or generalizations, as well as the construction of logical arguments and the comparison of different elements to find similarities.
The raw data supporting the conclusions of this article will be made available by the authors, without undue reservation.
The studies involving humans were approved by CE-CIES - Centro de Investigaciones. The studies were conducted in accordance with the local legislation and institutional requirements. The participants provided their written informed consent to participate in this study.
DG-R: Conceptualization, Formal analysis, Methodology, Writing – original draft. JA-A: Formal analysis, Software, Visualization, Writing – original draft. AV-A: Conceptualization, Funding acquisition, Resources, Writing – original draft. LV: Conceptualization, Funding acquisition, Supervision, Writing – original draft. JV: Investigation, Visualization, Writing – review & editing. LZ: Formal analysis, Software, Writing – original draft.
The author(s) declare financial support was received for the research, authorship, and/or publication of this article. This article’s processing charge (APC) was financed by the Instituto Tecnológico Metropolitano, Medellin, Colombia.
The authors declare that the research was conducted in the absence of any commercial or financial relationships that could be construed as a potential conflict of interest.
All claims expressed in this article are solely those of the authors and do not necessarily represent those of their affiliated organizations, or those of the publisher, the editors and the reviewers. Any product that may be evaluated in this article, or claim that may be made by its manufacturer, is not guaranteed or endorsed by the publisher.
Adelabu, F. M., Marange, I. Y., and Alex, J. (2022). GeoGebra software to teach and learn circle geometry: academic achievement of grade 11 students. Math. Teach. Res. J. 14, 2–16.
Al-Rahmi, A. M., Al-Rahmi, W. M., Alturki, U., Aldraiweesh, A., Almutairy, S., and Al-Adwan, A. S. (2022). Acceptance of mobile technologies and M-learning by university students: an empirical investigation in higher education. Educ. Inf. Technol. 27, 7805–7826. doi: 10.1007/s10639-022-10934-8
Arango, J., Gaviria, D., and Valencia, A. (2015). Differential calculus teaching through virtual learning objects in the field of management sciences. Procedia Soc. Behav. Sci. 176, 412–418. doi: 10.1016/j.sbspro.2015.01.490
Bhagat, K. K., and Chang, C. Y. (2015). Incorporating geogebra into geometry learning-A lesson from India. Eur. J. Math. Sci. Technol. Educ. 11, 77–86. doi: 10.12973/eurasia.2015.1307a
Cohen, S., and Karatzimas, S. (2022). New development: public sector accounting education for users—embedding eLearning and technology in teaching. Public Money Manag. 42, 291–293. doi: 10.1080/09540962.2021.1986302
Cuaspa, C. (2013). Normas Internacionales de Información Financiera Convergencia a Colombia y Aplicación a Empresas de Salud, Monografía de Especialización. Bogotá: Universidad Nacional de Colombia.
Dahawy, K., and Kamel, S. (2006). The use of information technology in teaching accounting in Egypt: case of Becker professional review. J. Cases Informat. Technol. 8, 71–87. doi: 10.4018/jcit.2006070106
Dangi, M. R. M., Saat, M. M., and Saad, S. (2023). Teaching and learning using 21st century educational technology in accounting education: evidence and conceptualisation of usage behaviour. Australas. J. Educ. Technol. 39, 19–38. doi: 10.14742/ajet.6630
De Melo, G. C. V. D., Nascimento, C. S. D., and Costa, W. P. L. B. D. (2018). Technology and the teaching of accounting: an analysis of teaching-learning in the courses of accounting sciences in the modality EaD. Custos e Agronegocio 14, 22–44.
Demirbilek, M., and Žilinskienė, I. (2015). Use of geo Gebra in primary math education in Lithuania: an exploratory study from teachers’ perspective. Inform. Educ. Int. J. 14, 127–142. doi: 10.15388/infedu.2015.08
Florio, E. (2022). The parabola: section of a cone or locus of points of a plane? Tips for teaching of geometry from some writings by Mydorge and Wallis. Rev. Math. 10:974. doi: 10.3390/math10060974
Gaona, J., López, S. S., and Montoya-Delgadillo, E. (2022). Prospective mathematics teachers learning complex numbers using technology. Int. J. Math. Educ. Sci. Technol., 1–30. doi: 10.1080/0020739X.2022.2133021
Gaviria, D. (2013). Diseño de Objetos Virtuales de Aprendizaje (OVA) Utilizando el Software Geométrico Geo Gebra Para Facilitar el Aprendizaje de Formulaciones Financieras. Colombia: Universidad Nacional de Colombia.
Gaviria Rodriguez, D., Arango Arango, J., Valencia Arias, A., Palacios Moya, L., Velez Holguín, R., and Gallego Ruiz, A. (2022). Factors that affect the usage intention of virtual learning objects by college students. Informatics 9:65. doi: 10.3390/informatics9030065
Han, P., and Krämer, B. J. (2009). “Generating interactive learning objects from configurable samples” in 2009 international conference on Mobile, hybrid, and on-line learning (Cancun: IEEE), 1–6.
Hohenwarter, M., and Hedes, C. (2016). “Using quality factors to find “good” resources on the Geogebra materials sharing platform” in Proceedings of the 15th international conference WWW/internet, 229–232.
Hoherwarter, M., and Lavicsa, Z. (2007). Geo Gebra, its community and future. Available at: http://archive.geogebra.org/en/upload/files/GG_support/Hohenwarter-Lavicza-Geo Gebra-ATCM-Final.pdf.
Holzinger, A., Nischelwitzer, A., and Meisenberger, M. (2005). “Mobile phones as a challenge for m-learning: examples for mobile interactive learning objects (MILOs)” in Third IEEE international conference on pervasive computing and communications workshops (Kauai, HI: IEEE), 307–311.
Ishartono, N., Nurcahyo, A., Waluyo, M., Prayitno, H. J., and Hanifah, M. (2022). Integrating geo Gebra into the flipped learning approach to improve students' self-regulated learning during the covid-19 pandemic. J. Math. Educ. 13, 69–86. doi: 10.22342/jme.v13i1.pp69-86
Lane, A., and Shellard, E. (2009). Integrating the teaching of introductory management accounting and information technology: a case study. J. Appl. Res. High. Educ. 1, 36–44. doi: 10.1108/17581184200900012
Matos, A. P. P., Do Espírito Santo, M. A., and Souza, P. V. S. (2023). Studying Kepler’s laws using geo Gebra simulations. Phys. Educ. 58:055012. doi: 10.1088/1361-6552/ace57f
Ministerio de Comercio, I. T. (2011). Decreto Número 4946. Bogotá: Ministerio de Comercio, Industria y Turismo.
Ministerio De Comercio, I. T. (2012a). Decreto Número 2784. Bogotá: Ministerio de Comercio, Industria y Turismo.
Ministerio de Comercio, I. T. (2012b). Direccionamiento estratégico del proceso de convergencia de las normas de contabilidad e información financiera y de aseguramiento de la información, con estándares internacionales. Available at: http://www.mincit.gov.co/descargar.php?id=66688.
Ministerio De Comercio, I. T. (2015). Decreto Número 2420. Bogotá: Ministerio de Comercio, Industria y Turismo.
Montoya, D., Vargas, J. E. H., Sanchez Giraldo, J., and Hincapié, N. C. (2020). Developing a pedagogical method to design interactive learning objects for teaching data mining. J. Educ. Online 17:n1
Munahefi, D. N., Khoirunnisa, K., Dwijanto, D., Mulyono, M., Fariz, R., and Noverianto, B. (2023). “Development of open ended project based learning model assisted by geogebra for mathematical creative thinking ability” in AIP conference proceedings, vol. 2614 (AIP Publishing)
Ong, T., and Djajadikerta, H. G. (2019). Adoption of emerging technology to incorporate business research skills in teaching accounting theory. J. Educ. Bus. 94, 480–489. doi: 10.1080/08832323.2019.1574702
Papastergiou, M., and Mastrogiannis, I. (2021). Design, development and evaluation of open interactive learning objects for secondary school physical education. Educ. Inf. Technol. 26, 2981–3007. doi: 10.1007/s10639-020-10390-2
Pereira, A., and Oliveira, H. C. (2016). A new approach for teaching accounting based on technology. Turkish Online J. Educ. Technol. 2016, 31–33.
Pinto, M., and Durán-Aponte, E. (2020). Uso de Tecnologías Digitales Disponibles para la enseñanza de la Contabilidad en Educación Media. Edutec. Revista Electrónica de Tecnología Educativa 72, 125–139. doi: 10.21556/edutec.2020.72.1527
Rodríguez, D., Arango, J., Valencia Arias, A., and Olaya Ariza, J. (2016). Teaching of differential calculus and cost through an interactive learning object. Turkish Online J. Educ. Technol. 2016, 652–659.
Romaito, P., Safitri, I., Sarida, H., Nisah, H., Uswatun, H., Apriani, D., et al. (2021). The mathematics learning using geogebra software to improve students’ creativethinking ability. J. Phys. Conf. Ser. 1819:012008. doi: 10.1088/1742-6596/1819/1/012008
Suwarni, E., and Budiprayitno, B. (2019). Innovation on teaching-learning technology based on visual and simulation to improve the effectiveness and efficiency in teaching-learning financial accounting processes. J. Adv. Res. Dyn. Control Syst. 11, 142–149. doi: 10.5373/JARDCS/V11I11/20193179
Tamam, B., and Dasari, D. (2021). The use of Geogebra software in teaching mathematics. J. Phys. Conf. Ser. 1882:012042. doi: 10.1088/1742-6596/1882/1/012042
Velichova, D. (2011). Interactive maths with geo Gebra. Int. J. Emerg. Technol. Learn. 6, 31–35. doi: 10.3991/ijet.v6iS1.1620
Keywords: undergraduate students, accounting education, educational technology, interactive learning objects, teaching
Citation: Gaviria-Rodríguez D, Arango-Arango J, Valencia-Arias A, Verde Flores LJ, Valencia J and Zavala LR (2024) Using interactive learning objects in teaching accounting sciences: a case study. Front. Educ. 9:1270622. doi: 10.3389/feduc.2024.1270622
Edited by:
Stamatios Papadakis, University of Crete, GreeceReviewed by:
Khresna Bayu Sangka, Sebelas Maret University, IndonesiaCopyright © 2024 Gaviria-Rodríguez, Arango-Arango, Valencia-Arias, Verde Flores, Valencia and Zavala. This is an open-access article distributed under the terms of the Creative Commons Attribution License (CC BY). The use, distribution or reproduction in other forums is permitted, provided the original author(s) and the copyright owner(s) are credited and that the original publication in this journal is cited, in accordance with accepted academic practice. No use, distribution or reproduction is permitted which does not comply with these terms.
*Correspondence: Diana Gaviria-Rodríguez, ZGlhbmFnYXZpcmlhQGl0bS5lZHUuY28=
Disclaimer: All claims expressed in this article are solely those of the authors and do not necessarily represent those of their affiliated organizations, or those of the publisher, the editors and the reviewers. Any product that may be evaluated in this article or claim that may be made by its manufacturer is not guaranteed or endorsed by the publisher.
Research integrity at Frontiers
Learn more about the work of our research integrity team to safeguard the quality of each article we publish.