 Enes Gök1
 Burak Aydin2,3*
- 1School of Education, Karamanoğlu Mehmetbey University, Karaman, Türkiye
- 2Institute of Educational Sciences, Leuphana University, Lüneburg, Germany
- 3School of Education, Ege University, İzmir, Türkiye
The study aims to explore the effect of the type of higher education institution on students’ engagement. The meta-analyses of multilevel regression coefficients revealed significant relationships between the type of higher education institution and student engagement indicators across the years from 2013 to 2019. Comparing different types of higher education institutions with the base category, our findings revealed significant differences in effective teaching practices, discussion with diverse others, and student-faculty interaction consistent throughout the years. These findings are expected to provide insights for institutional administrators, policymakers, and researchers given that student engagement in higher education has become an indicator of quality all around the world.
Introduction
Over the years, higher education institutions around the world have become isomorphic entities mimicking each other thanks to global and local factors. One explanation for such assimilation and other recent changes in the higher education sector involves the shrinking national resources (Altbach and Peterson, 1999) combined with the increasing allure of global trends in competition (Altbach et al., 2019). This results in the internationalization of higher education institutions that compete one with another in a game that requires increased similarity in institutions of higher learning. Consistently, as Vaira (2004) stated, “higher education governance, institutional, organizational and curricular arrangements thus are deemed to converge toward a common pattern spreading increasingly worldwide, because of the effects of institutional and competitive pressures.” On the other hand, the diversity of higher education institutions, in terms of their unique mission, demography, and structure, remains a hot topic while national systems move toward a more market-driven sector resulting from the massification of higher education.
The continuing advocacy for more heterogeneous higher education sectors is underpinned by two major motives, as Guri-Rosenblit et al. (2007) indicate: first, since it is financially impossible to accommodate an exponentially increasing number of students in research institutions; and second, because diversification of market sectors, and thus expectations surrounding the backgrounds of students, requires a concurrent move toward diversity in higher education. Yet, in a complex sector that incorporates increasing numbers of similar institutions with the pressures of marketization and massification while the system itself faces an increasing demand for diversity, the quality of the sector has become more crucial for stakeholders, including students and employers. To meet this need, higher education institutions use surveys and other mechanisms to ensure the quality of the education they provide. Student engagement in this regard is a crucial step in assessing the quality of education higher education institutions provide (Coates, 2005). This is because any improvements in teaching and learning are central to the enhancement of education and contribute to ensuring the quality of higher education (Borch et al., 2020). From this standpoint, the question of whether this heterogeneity impacts the quality of education remains valid. In other words, it is unclear if the different higher education institutions provide differing quality and student experience levels.
In discussing the quality of educational experiences of students, the literature has a large number of studies and theoretical focus on the role colleges play in the quality of education they provide. To better understand the question of whether different higher education institutions reveal different results, this study considers the “college impact” as a theoretical approach for its research question. Pascarella and Terenzini (2005), who examined the extensive research on college impact in their well-known review “How College Affects Students,” summarize and describe the models of college impact research into two major theoretical underpinnings, namely “within college effects” when the change is associated with the experiences of students during their enrollment and “between college effects” when the change is associated with the characteristics of the institution. “Within college effects” may be related to student background characteristics of the students such as gender, race, socioeconomic status, and so on. Between college effect is mostly related to the characteristics of the institution such as size, mission, curriculum, institutional control, curricular focus, and so on. Focusing on the “between college effects,” we aim to examine whether different higher education institutions have different impacts on their students’ educational experiences.
As the pioneer of massified higher education and one of the most heterogeneous systems in the world, the United States system is noteworthy to consider when explaining how this heterogeneity provides different levels of student experience. To investigate this phenomenon, the present study analyzes two well-known applications in the US higher education system—the Carnegie Basic Classification and the National Survey of Student Engagement—to reveal if student experiences and engagement differ across institution types.
Background
The Carnegie Classification of Higher Education has been used in many segments of the sector, including research, policy, and institutional decision-making (Gök, in press; McCormick and Zhao, 2005). The founding purpose of Carnegie Classifications is to portray and describe the diversity of US higher education [Altbach, 2015; Carnegie Classifications (n.d.); The Carnegie Classification of Institutions of Higher Education (n.d.)]. Moreover, the aim was to create a platform that can support research and policy analysis (Carnegie Foundation, 2023). Although the system has undergone several revisions, including the latest, which was still in progress at the time of this article going to press time. Additionally, after 2005 with the introduction of new classification schemes, the platform has expanded. However, the classic and long-lasting classification, named Carnegie Basic Classification after 2005, remains the most prominent classification in the US higher education sector (McCormick and Borden, 2020). The Carnegie Basic Classification has been used as a reliable categorization by researchers of higher education, while policymakers and institutional leaders utilize it to guide resource allocation, decision-making, and learning about peer institutions.
Student engagement has become a more popular term in recent years (Tight, 2020) in both the US and around the world representing the quality of undergraduate education (Krause and Coates, 2008; Hagel et al., 2012; Zhang et al., 2015; Yin and Wang, 2016; Kandiko Howson and Buckley, 2017; Öz and Boyacı, 2021). The National Survey of Student Engagement (NSSE) is also one of the most widely used surveys in US higher education and internationally for gathering firsthand information from students about their academic experiences. These annual surveys administered to both freshman and senior students provide information about students’ engagement at their institution during their degree programs. This information is also used for a variety of purposes both inside and outside of the institution, including benchmarking with peer institutions, institutional assessment, and improvement, triangulation, communicating with internal and external stakeholders, and accountability and accreditation. It is also underscored that the more students engage with their institution the less likely they leave the institution (Tight, 2020). Having undergone major changes and revisions since its first administration in 2000, NSSE is perhaps the most widely accepted survey for student engagement. In 2020, it was administered to approximately 490,000 students at 651 higher education institutions (NSSE, 2021). It is worth noting that, by using NSSE results, the present study considers student engagement from a behavioral perspective, and consequently excludes the psychological, socio-cultural, and holistic perspectives identified by Kahu (2013). Thus, this study intends to reveal if student engagement differs from institution to institution after controlling student background characteristics.
Literature review
The impact of college on student success has been the focus of significant research, the findings of which have also been comprehensively studied by researchers who review and synthesize them. For instance, Feldman and Newcomb (1969) examined around 1,500 studies for the 40-year period from 1920 to 1960. Later, Pascarella and Terenzini (1991) integrated over 2,600 studies on the impact of college on students, before assembling 2,500 additional studies in 2005 (Pascarella and Terenzini, 2005). In the latest review study in this area, Mayhew et al. (2016) assembled over 1,800 studies published between 2002 and 2013. All these reviews have attempted to cover differing aspects of college impact research. For instance, Pike et al. (2012) found students’ choice of major to be a significant predictor of their level of engagement and outcomes. Among the massive body of literature, one subset focuses on the possible role that institutional characteristics play in student outcomes. For instance, some studies have found a relationship between classification categories and student outcomes such as graduation, persistence, learning, employment, and so on (Winter et al., 1981; Pace, 1984; Pike et al., 2006; McCormick et al., 2009) while others have argued, after controlling for student characteristics, that such a relationship is minimal or does not exist (Pascarella and Terenzini, 1991; Kuh and Hu, 2001; Pike et al., 2003). Later studies also investigated the possible interaction between an institution’s Carnegie Classification and student engagement in determining student learning outcomes. For instance, McCormick et al. (2009) found that the 2000 and 2005 classifications accounted for some level of variance in student engagement and gains, but the majority of the variance was related to student background characteristics. In other words, student outcomes are explained more by factors within an institution than those between institutions. Their findings reveal that the variance in student outcomes and engagement between higher education institutions especially among the classification categories is minimal (less than 10%), meaning that, in terms of student outcomes, the difference occurs within an institution based on student background characteristics, not between higher education institutions.
While this research data are compelling, it is still important to continue investigating the usefulness of the Carnegie Classification, given the significant changes both in classification and NSSE since 2010. In addition, the rapidly changing patterns in higher education also reinforce the need for such research since the higher education landscape has been rapidly changing because of the diversity of the student body, the role of community colleges, and shrinking financial support for higher education (Terenzini and Pascarella, 1998) in addition to the macro level forces of globalization, and internationalization, massification and the rise of communication and information technology in higher education (Altbach et al., 2019). Among these forces, the changing student population and the proliferation of technology have significantly shifted how we view higher education.
On the subject of the dramatic recent demographic changes in higher education, Pascarella (2006) argues that universities can no longer rely on the assumption that the majority of their students are white or middle class, explaining: “the same intervention or experience might not have the same impact for all students, but rather might differ in the magnitude or even the direction of its impact for students with different characteristics or traits” (p. 512). Moreover, the rise of the critical role of social media channels in students’ social and academic lives (Barrot, 2021) may herald great changes in the current role of these classification systems, when compared to the periods investigated in prior reviews. In sum, both changes in the academic landscape and systems like the Carnegie Classification and NSSE create room for future research to revisit the impact of college type on student engagement. Thus, this paper aims to use a multilevel design to examine if the Carnegie Basic Classification has explanatory power for student engagement scores. We attempt to build on the literature in this area, namely the study of McCormick et al. (2009), by applying previous methods to a dataset covering the years 2013–2019. Since both the independent and dependent variables of this prior study have changed, 100% replication is impossible, but some similar questions retain their importance and are still significant in the current literature. Thus, we propose the following research questions1 to guide the present research and its multilevel analytical design:
a) After controlling student background characteristics (i.e., gender, transfer status, full-time status, residential status, first-generation status, class level, major, race), does the Carnegie Basic Classification have any explanatory power in explaining student engagement scores?
b) Is the effect of the Carnegie Basic Classification on student engagement scores heterogeneous across the years 2013 and 2019?
Materials and methods
Data source and variables
This study used data from the 2013 to 2019 rounds of the National Survey of Student Engagement, available upon request from the Indiana University Center for Postsecondary Research. For each year of the study, 60% of NSSE data was randomly selected at student level to be included in the research. Some institutional-level variables of full-time equivalent (EFT) enrollment, graduate/professional student percentage, median ACT scores, transfer status percentage, part-time status percentage, graduate coexistence, residential status percentage, and art and science percentage were not available. Across seven years, the random sample consisted of 230,198 total observations and 547 variables. Based on the research questions, the analytical sample included 10 different student-level engagement scores as dependent variables and nine different student- and institution-level variables as independent variables for each data collection cycle. The operationalizations of the independent variables included in the current study are presented in Table 1. The dependent variables are indicators2 representing the varying aspects of student engagement, including collaborative learning (CL), Discussions with Diverse Others (DD), effective teaching practices (ET), higher-order learning (HO), learning strategies (LS), quality of interactions (QI), quantitative reasoning (QR), reflective and integrative learning (RI), supportive environment (SE), and student-faculty interaction (SF). The psychometric properties of the dependent variables were studied and reported to be satisfactory by NSSE (see Miller et al., 2016).
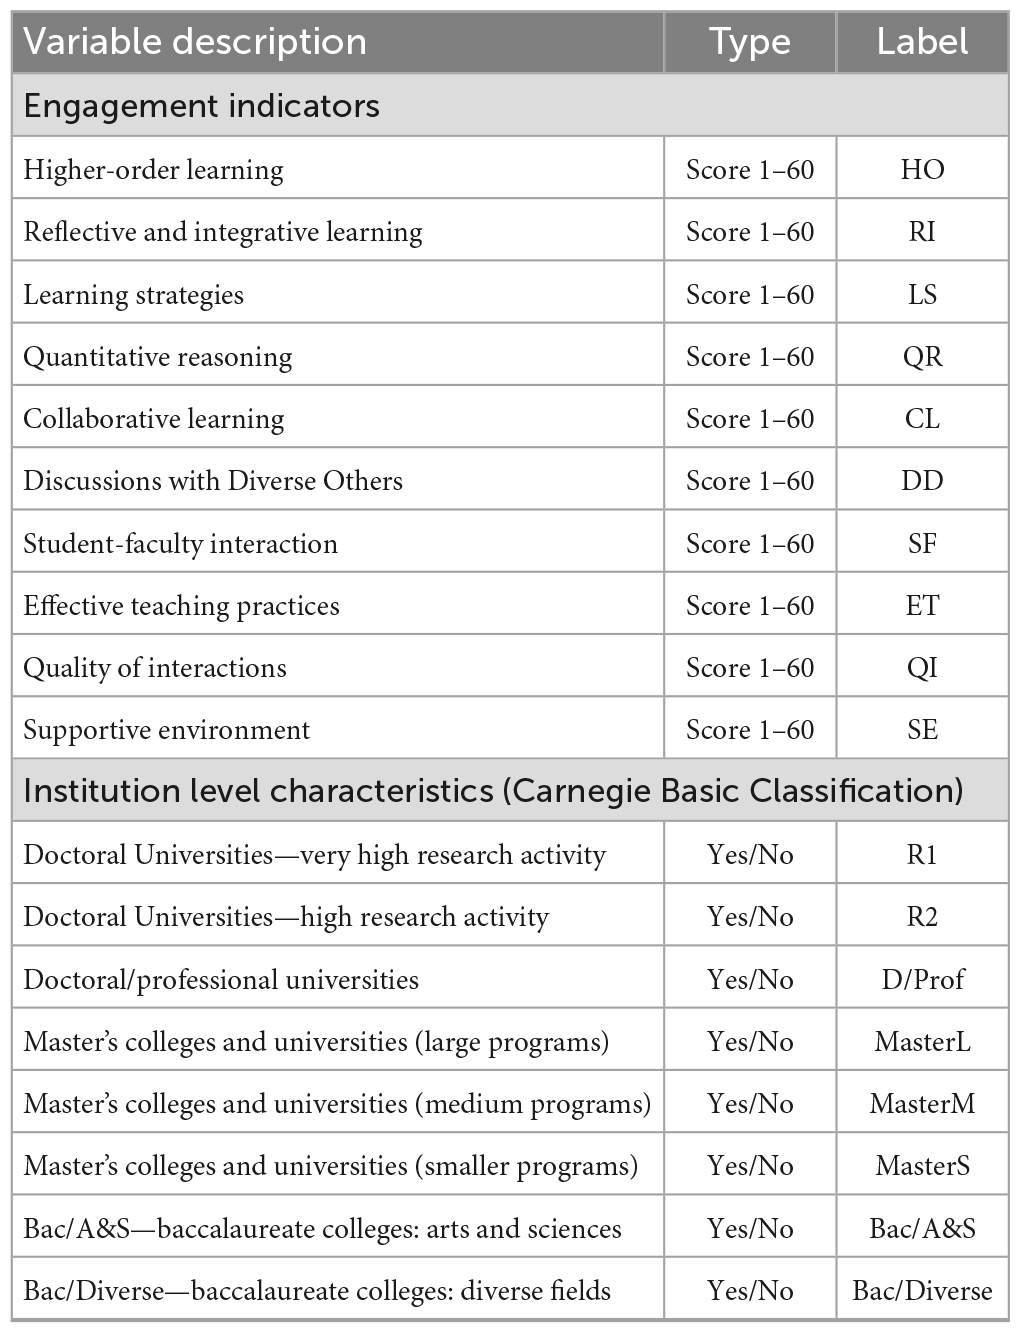
Table 1. Operationalizations of the independent variables.
Table 2 provides descriptive statistics of engagement indicators across the years. For the engagement scores, sample size, mean, and standard deviation values are reported. The student-level control variables include transfer status, first-generation status (neither parent holds a bachelor’s degree or not), full-time status, campus residency, race/ethnicity (white or not), class level (freshmen vs. other class levels), and major (arts and humanities as the reference category; biological sciences, agriculture, and natural resources; physical sciences, mathematics, and computer science; social sciences; business; communications, media, and public relations; education; engineering; health professions; social service professions; and other majors).
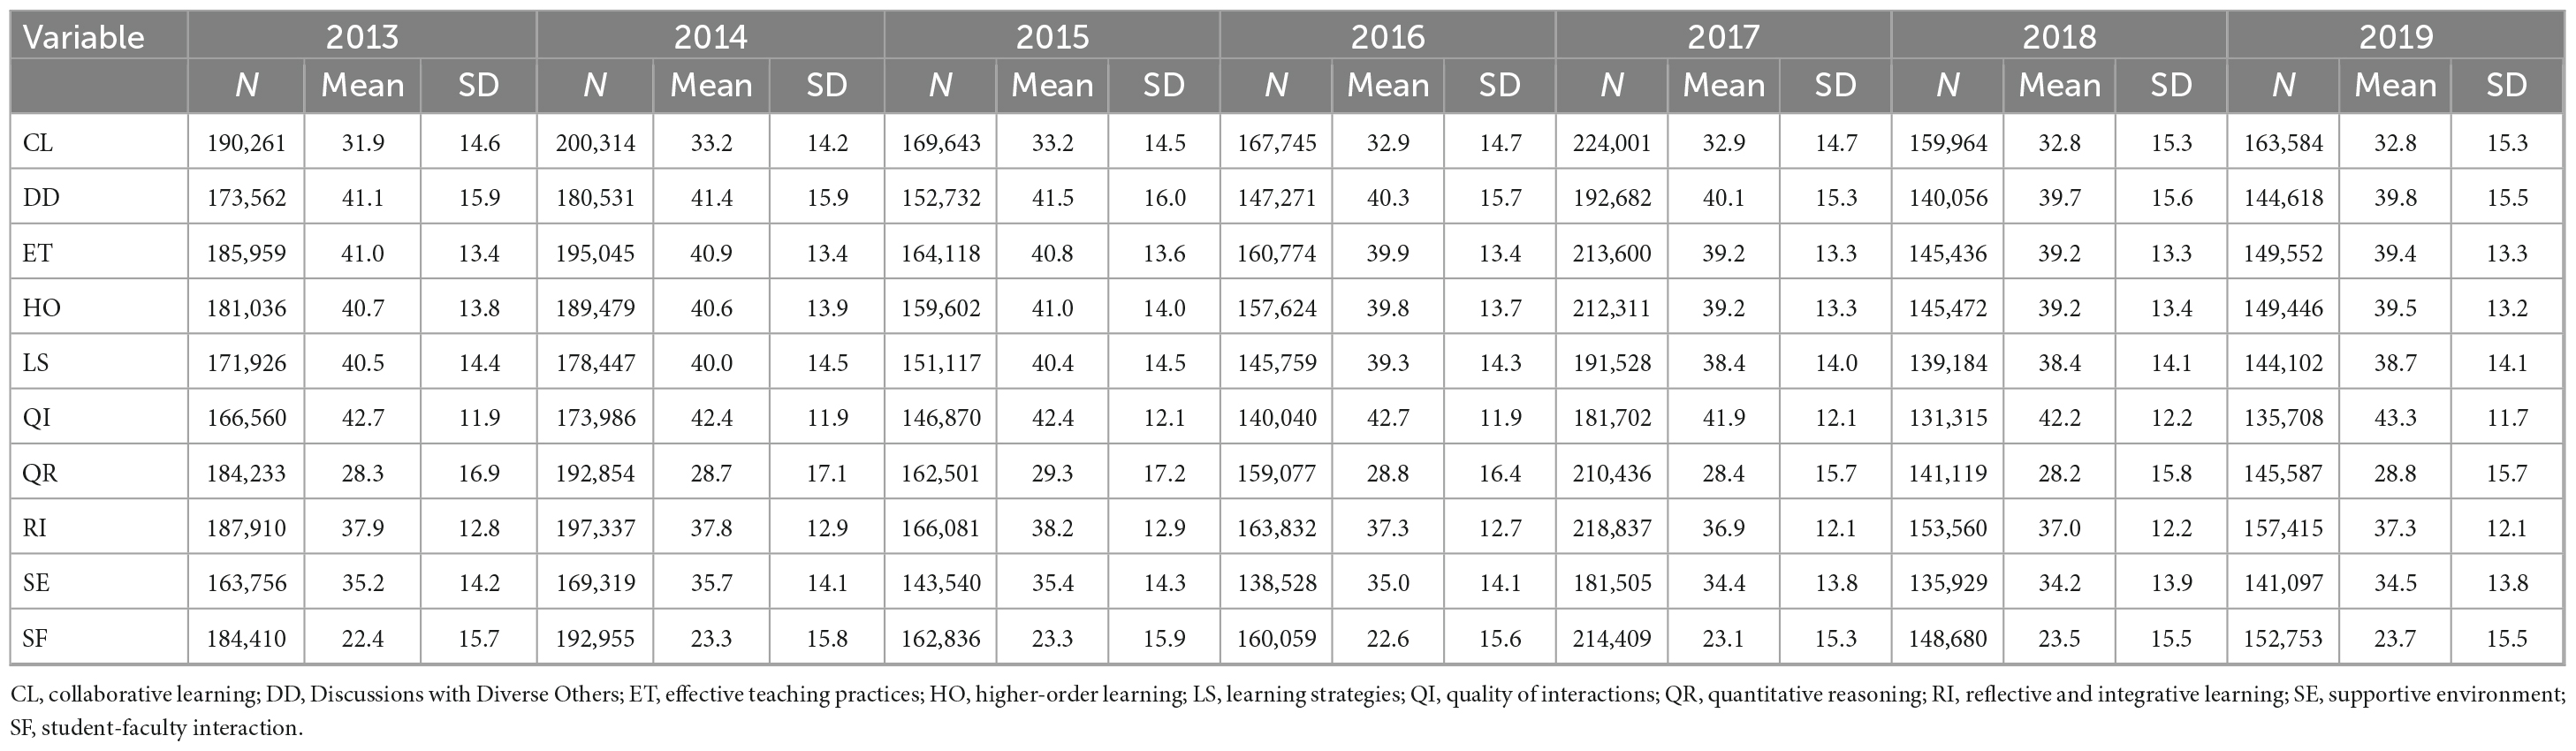
Table 2. Descriptive statistics of engagement indicators.
Table 3 provides the frequencies of the institutional-level independent variables created based on the Carnegie Basic Classification. To maintain the comparability of the data over the years, the scope of the present study was limited to 2013–2019. Although the names of the classification categories have changed three times between 2013 and 2019, these changes have not been due to radical shifts in the methodology, but rather minimal modifications in labels. For all years, the following categories are stable (the latest labels from 2019 are provided): doctoral universities—very high research activity, doctoral universities—high research activity, doctoral/professional universities, master’s colleges and universities (larger programs), master’s colleges and universities (medium programs), master’s colleges and universities (smaller programs), baccalaureate colleges—arts and sciences, and baccalaureate colleges—diverse fields. For all years, the “baccalaureate colleges—diverse fields” serves as the reference category. This category is specifically targeted to have comparable results with McCormick et al. (2009) who utilized the same category as a reference group in their research.
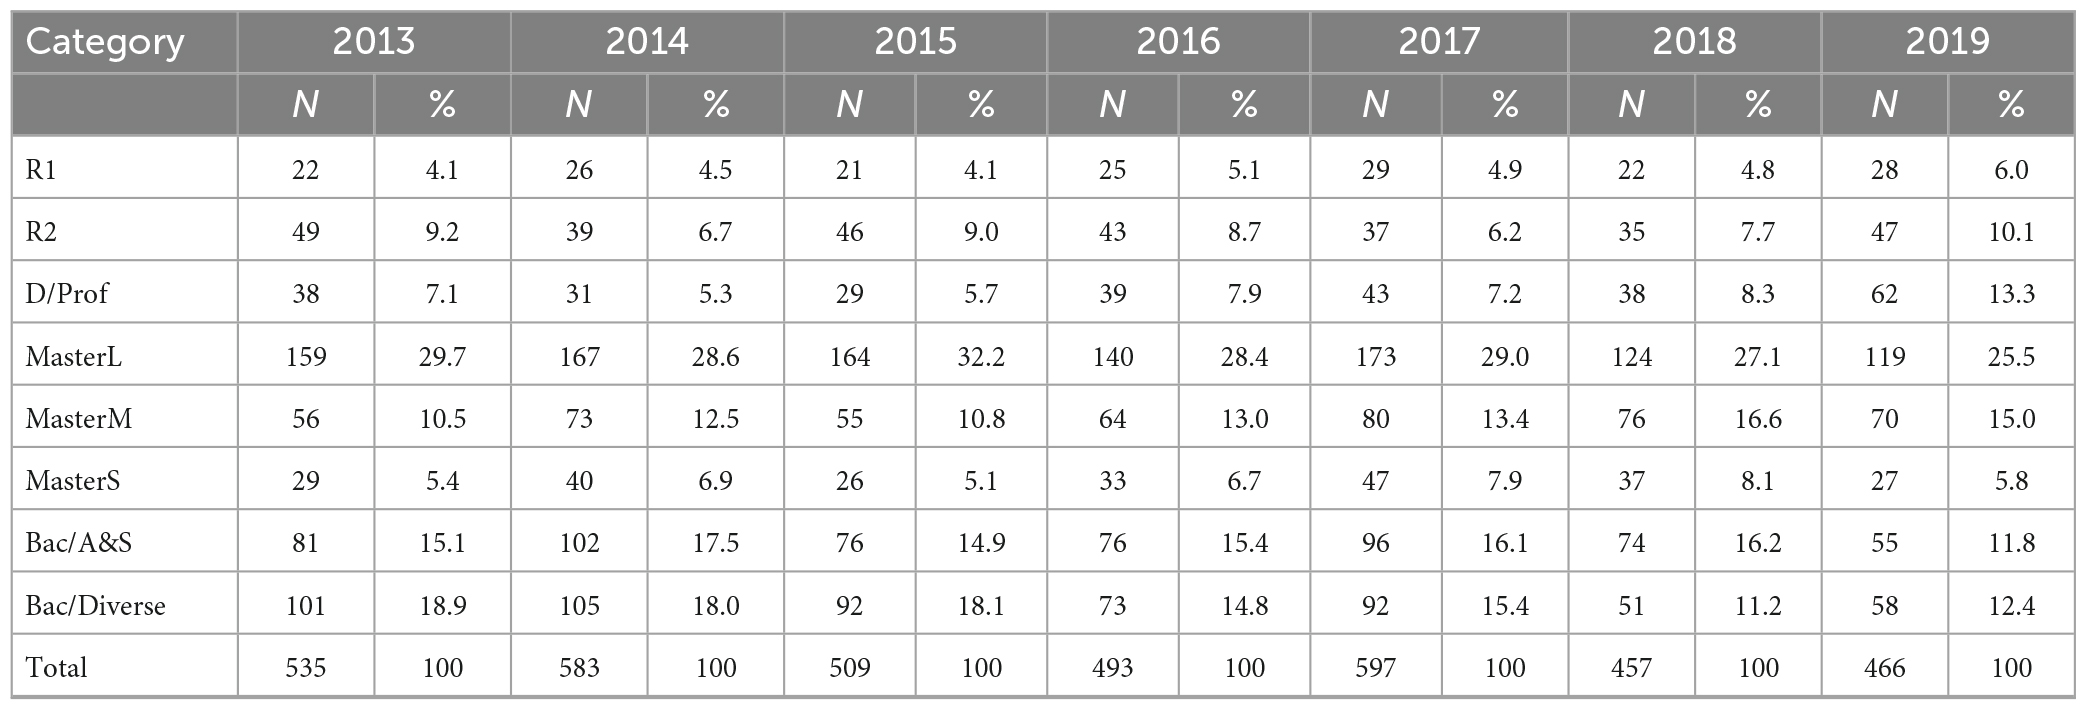
Table 3. Frequencies of institutional-level variables across years.
Analytic procedures
The NSSE data were collected each year from the invited college students; for example, in 2023, 1.5 million students from 541 institutions were invited, and 354,067 responded (NSSE, 2023). In our study, the data from each cycle from 2013 to 2019 are treated independently, as advocated by Campos et al. (2023) given that this approach has the capacity to address multiple constraints inherent in traditional single-stage analyses utilizing combined data including the oversight of variations in survey characteristics, aggregation bias, and the lack of comparability in findings across studies. Hence in our analysis, we conducted a meta-analysis to examine the relevant standardized regression coefficients from the multilevel models for each cycle. The process of splitting a large data set (e.g., across years), utilizing the same model, and combining the results with meta-analyses is referred to as the “Split/Analyze/Meta-Analyze” (Cheung and Jak, 2016) approach.
The multilevel model for this study is similar to the model employed by McCormick et al. (2009), in which students are nested in institutions. The student-level categorical control variables included gender, race/ethnicity, first-generation status, enrollment as a full-time or part-time student, campus residence, transfer status, class level, and expected major. The institutional-level predictors were seven binary variables representing eight different institutional classifications. The level 1 equation of the random-intercept model reads Eq. 1:
The level 2 of the random intercept equation reads Eq. 2:
where Yij is the engagement score for student i at institution j, β0j is the intercept, βpj is the level-1 coefficient for p different student-level variables and eij is the level-1 random component, γ00 is the average engagement score for the reference group, γ0q is the level-2 coefficient, and u0j is the level-2 random component. The described multilevel model with categorical predictors was utilized separately for each of the seven data cycles using the robust estimator (MLR) Mplus 8.6 (Muthén and Muthén, 1998–2020). This first statistical procedure resulted in seven different estimates of each level-2 coefficient (i.e., γ0q) across the years. The standardized coefficients (see Supplementary Tables 1–10) were then transformed into effect sizes using the R package esc (Lüdecke, 2019), in which the number of institutions was treated as sample size values. The second statistical procedure combined these effect sizes using a fixed effect meta-analysis model separately for each coefficient to report an overall estimate and a heterogeneity statistic. Meta-analyses were completed using major (Hamilton, 2018) and jamovi (Sahin and Aybek, 2019; The Jamovi Project, 2022) frontend to implement the steps described by Viechtbauer (2010) and Lakens (2017). Jamovi is an open-source software that offers a convenient utilization of R and major is a module to create an interface to conduct meta-analyses using the R package metafor.
Findings
The fixed effect meta-analysis results are given in Table 4. The Q statistics to quantify the heterogeneity (see Chen and Peace, 2021) ranged between 0.45 and 10.45 with a p-value larger than 0.05 in all models, indicating that the effect size estimates were similar across years. For collaborative learning, the average effect size across years was statistically significant only for the comparison between Bac/A&S and Bac/Diverse; β = 0.38 (SE = 0.06, p < 0.05) which indicates that students in Bac/A&S reported larger scores. For Discussions with Diverse Others, the average effect sizes were also positive and significant, except for the comparison between six and Bac/Diverse, with the largest average effect size found in favor of R1, β = 0.43 (SE = 0.09, p < 0.05). For effective teaching practices, compared to the students in Bac/Diverse, students in R1, R2, D/Prof, and MasterL reported significantly lower scores; whereas students in MasterM and MasterS reported similar scores and students in Bac/Diverse reported significantly higher scores (β = 0.69, SE = 0.06, p < 0.05). For higher-order learning, the largest average effect size was found for the comparison of Bac/A&S and Bac/Diverse; β = 1.18 (SE = 0.07, p < 0.05) indicates students in Bac/A&S reported substantially larger scores. A similar pattern was observed for learning strategies β = 0.39 (SE = 0.06, p < 0.05), for quantitative reasoning β = 0.75 (SE = 0.06, p < 0.05), for reflective and integrative learning β = 1.26 (SE = 0.06, p < 0.05), and for supportive environment β = 0.54 (SE = 0.06, p < 0.05). For student-faculty interaction, except for the comparison of Bac/A&S vs. Bac/Diverse, the average effect sizes were relatively large and negative, with the largest negative average effect size found for the comparison of R1 vs. Bac/Diverse, β = −0.72 (SE = 0.09, p < 0.05).
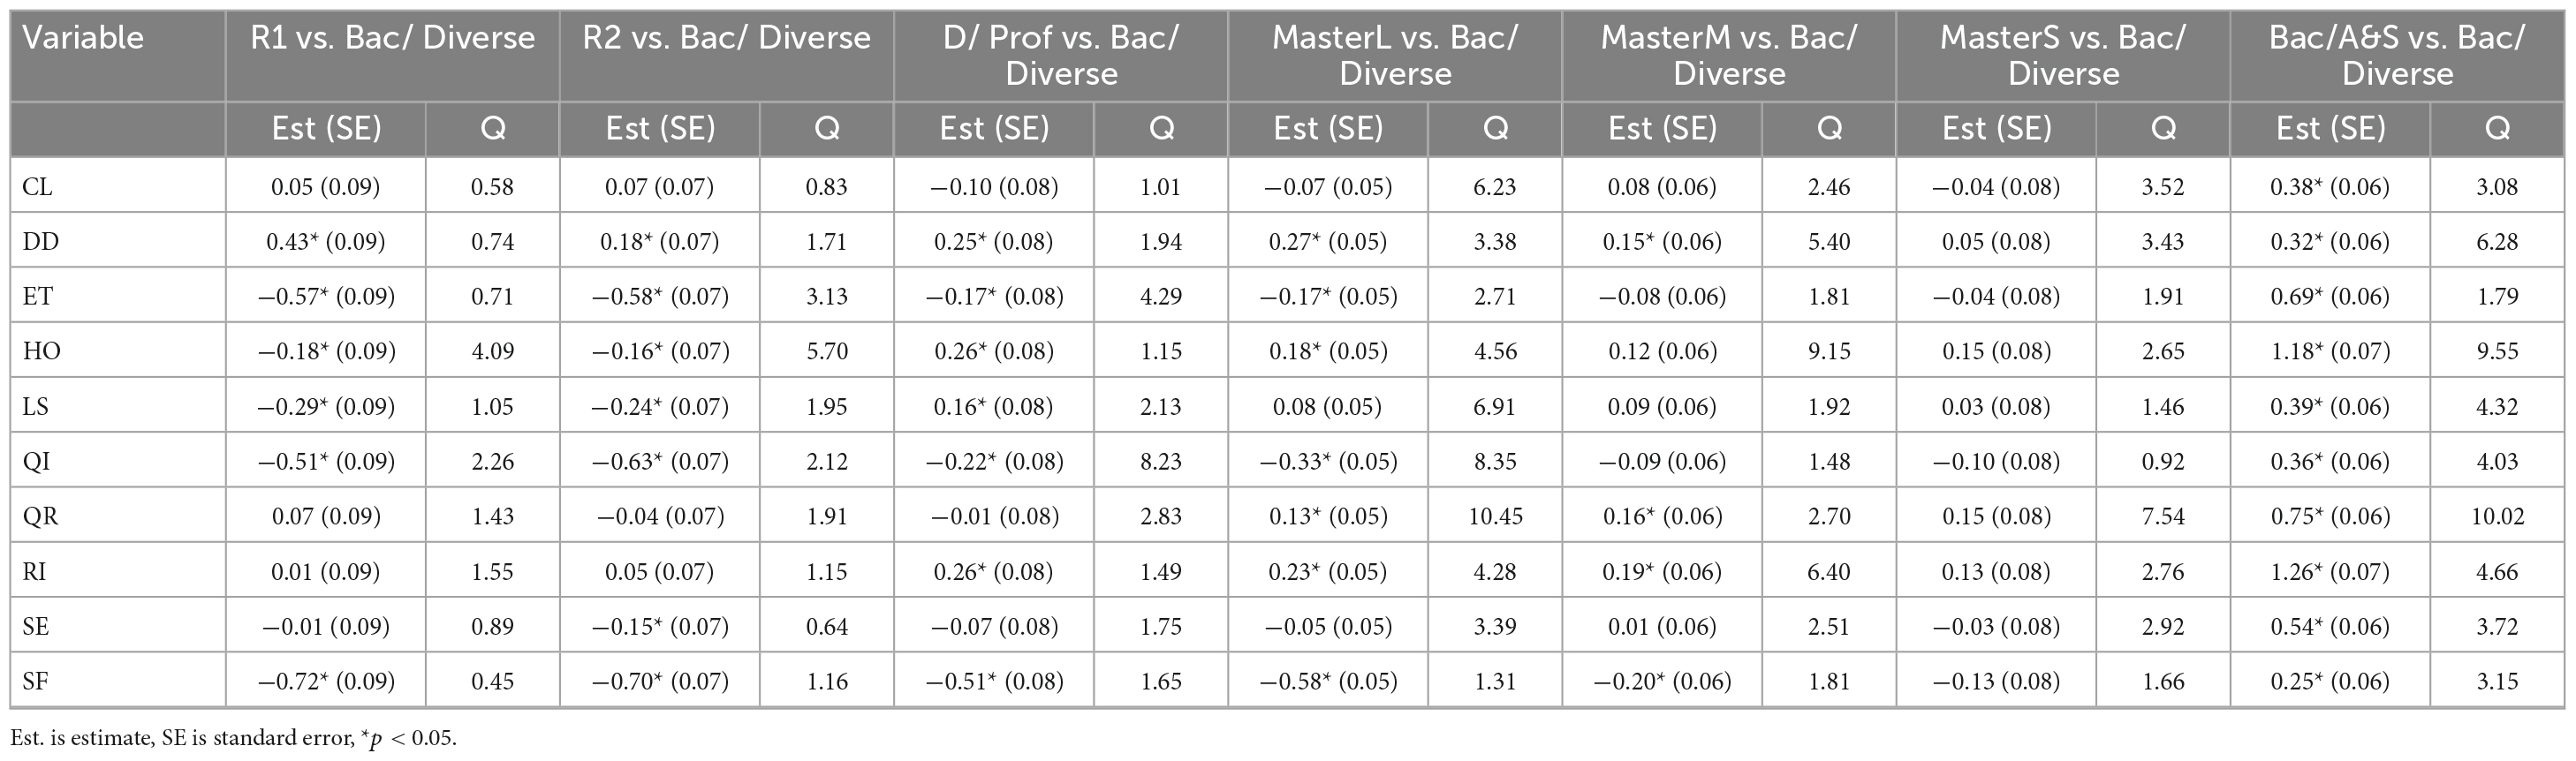
Table 4. Fixed effect meta-analysis results.
Discussion and conclusion
Higher education institutions carry out surveys to assess student engagement and the quality of education they offer. Despite the tendency of higher education institutions to conform to a similar structure, there is a growing demand for diversity from different stakeholders. In this study, we aim to determine whether there is a difference in student engagement across Carnegie Basic Classifications and academic years. The findings of the seven-year engagement scores provide promising results regarding the impact of institutional-level variables on student engagement indicators in the United States after controlling student-level background characteristics.
With the call for more accountable and transparent higher education, institutional stakeholders—including faculty, scholars, policymakers, and administrators—became increasingly focused on assessing the quality of college experiences (Campbell, 2015). To respond to such a call, this study analyzed the impact of institution type on student engagement indicators using meta-analysis. The findings demonstrate significant differences in engagement indicators between the selected institution type and the reference category of baccalaureate colleges—diverse fields.
Diversity in higher education long has been a discussion in higher education research, especially the demographic diversity of its faculty and students. Diversity of the student population is expected to foster the quality of educational experiences of the students. As Hurtado (2001) highlights, based on a comprehensive literature review student growth and development in educational activities and outcomes are significantly related to a diversity of student and faculty populations on campus. However, having an adequately diverse population does not guarantee the quality the diverse population is expected to bring to campus. “A commitment to diversity is not simply a matter of achieving adequate representation” (Hutchinson and Hyer, 2000, p. ix). For instance, Holland and Ford (2021) found that “more selective institutions are more likely to represent their diversity, and more likely to engage in practices that emphasize their traditionally under-represented minority student populations than less selective institutions, though it is the less selective institutions that have higher populations of these students” (p. 1). Similarly, we found that the most prestigious institutions seem to create an environment where students have more opportunities to interact with diverse others than the other types of institutions.
In our analysis based on student experiences, one of the greatest differences that we found surrounds effective teaching practices. Students enrolled at institutions that fall within R1, R2, D/Prof, and MasterL (“doctoral universities—very high research activity,” “doctoral universities—high research activity,” “doctoral/professional universities,” and “master’s colleges and universities—large programs,” respectively) see fewer instances of effective teaching practices than those students at institutions falling into the “baccalaureate colleges—diverse fields,” This finding seems to confirm the argument that the incentive system at research institutions that favor research productivity tends to penalize the teaching responsibility of faculty members (Wieman, 2015) which results in lower teaching quality. We found a similar pattern for student-faculty interaction thereby confirming the findings of McCormick et al. (2009). Almost all institution types differ from the reference category of “baccalaureate colleges—diverse fields,” with the largest negative difference emerging in student/faculty interaction between this category and “doctoral universities—very high research activity.” This appears to indicate that the greater resources that an institution allocates to research, the lower value they attribute to effective teaching practices and student/faculty interaction, which consequently leads to lower student satisfaction. It confirms the findings of Lee and Rhoads (2004) who found a strong negative relationship between educational commitment and the use of research funding. This finding also confirms the Boyer (1998) Commission Report, which argues that research institutions that place a disproportionate emphasis on the quantity of scholarship fail to respond to the educational needs of their undergraduates. One of the most critical findings of this paper is the persistence of the themes noted by McCormick et al. (2009) in 2004, over a decade later: higher education institutions that put more emphasis on research seem to ignore their educational responsibilities, particularly on teaching practices and faculty/student interaction. Recognizing this, the American Council of Education (ACE), the new management in Carnegie Classification, is also adding a new research sub-category to research institutions after the R1 and R2 sub-categories by changing the criteria effective as of 2025. Also, aware that higher education institutions sacrifice other responsibilities to get the research label, ACE will separate the research category from the classic Carnegie Basic Classification and present it as a separate list, to reduce the competition demand and tension in US higher education.
The findings imply some important information for university administrators, policymakers, and future research. Doctoral research institutions should create an environment that fosters better educational experiences and student-faculty interaction. Policymakers in the US and other countries should be aware that, in the higher education sector, where research is often prioritized and incentivized, there is a risk of compromising the quality of education and student experiences. Therefore, measures should be taken to prevent jeopardizing education in higher education. This study is limited to the self-reported student data collected through NSSE surveys. Future research should consider additional data from varying surveys to test the role of institutional characteristics on student engagement and educational quality. It is worth noting that we relied solely on the Carnegie Basic Classification categories as institutional characteristics. However, it is possible that these categories may not fully capture the differences and similarities between institutions, as cautioned by Gök (in press) and McCormick et al. (2009). Thus, future researchers should use new data and technology to better explain institutional characteristics and their role in student engagement. In line with this recommendation, in our analysis the median pseudo-R2 (Snijders and Bosker, 2012) value was 0.01 with a maximum of 0.02, indicating that the Carnegie Basic Classification only explained 1% of the variance in student engagement scores in general, and lower than 2% in all variables across seven years. Further, in our analyses the unconditional intraclass correlation coefficients for the dependent variables were less than 0.10 which is similar to the results by McCormick et al. (2009), specifically the median value was 0.03 with a maximum of 0.09. One last condition is that the p-values from multiple tests were not adjusted, and each meta-analysis was treated as an individual study.
Overall, the quality of higher education continues to attract curiosity and demand from every segment of the system. The NSSE and other large-scale studies respond to such demands from stakeholders seeking to assess the educational quality of both their own schools and peer institutions. Within this setting, the Carnegie Basic Classification seems to remain a crucial mechanism for revealing institutional mission differences in US higher education.
Data availability statement
The data analyzed in this study is subject to the following licenses/restrictions: this study used data from the 2013 to 2019 rounds of the National Survey of Student Engagement, available upon request from the Indiana University Center for Postsecondary Research. Requests to access these datasets should be directed to Indiana University Center for Postsecondary Research.
Author contributions
EG: Conceptualization, Writing – original draft. BA: Formal Analysis, Methodology, Software, Writing – original draft.
Funding
The authors declare financial support was received for the research, authorship, and/or publication of this article. This research was supported by the Scientific and Technological Research Council of Türkiye (Project ID: 1059B192000009). This publication was funded by the Open Access Publication Fund of the Leuphana University Lüneburg.
Conflict of interest
The authors declare that the research was conducted in the absence of any commercial or financial relationships that could be construed as a potential conflict of interest.
Publisher’s note
All claims expressed in this article are solely those of the authors and do not necessarily represent those of their affiliated organizations, or those of the publisher, the editors and the reviewers. Any product that may be evaluated in this article, or claim that may be made by its manufacturer, is not guaranteed or endorsed by the publisher.
Supplementary material
The Supplementary Material for this article can be found online at: https://www.frontiersin.org/articles/10.3389/feduc.2023.1305747/full#supplementary-material
Footnotes
- ^ Carnegie Basic Classification data are collected at the institution level; student background characteristics and engagement scores data are collected at the student level.
- ^ For more detailed information, refer to the following website: https://nsse.indiana.edu/nsse/survey-instruments/engagement-indicators.html#a1.
References
Altbach, P. G. (2015). The Carnegie classification of American higher education: more—and less—than meets the eye. Int. High. Educ. 80, 21–23. doi: 10.6017/ihe.2015.80.6153
Altbach, P. G., and Peterson, P. M. (1999). Higher education in the 21st century: global challenge and national response. IIE Research Report No. 29. IIE Books. New York, NY: Institute of International Education.
Altbach, P. G., Reisberg, L., and Rumbley, L. E. (2019). Trends in global higher education: tracking an academic revolution, Vol. 22. Leiden: Brill.
Barrot, J. S. (2021). Scientific mapping of social media in education: a decade of exponential growth. J. Educ. Comput. Res. 59, 645–668. doi: 10.1177/0735633120972010
Borch, I., Sandvoll, R., and Risør, T. (2020). Discrepancies in purposes of student course evaluations: what does it mean to be “satisfied”? Educ. Assess. Eval. Account. 32, 83–102. doi: 10.1007/s11092-020-09315-x
Boyer, E. L. (1998). The Boyer commission on educating undergraduates in the research university, reinventing undergraduate education: a blueprint for America’s research universities, Vol. 46. Stony Brook, NY: State University of New York at Stony Brook.
Campbell, C. M. (2015). “Serving a different master: assessing college educational quality for the public,” in Higher education: handbook of theory and research, ed. M. Paulsen (Cham: Springer), 525–579. doi: 10.1007/978-3-319-12835-1_12
Campos, D. G., Cheung, M. W. L., and Scherer, R. (2023). A primer on synthesizing individual participant data obtained from complex sampling surveys: a two-stage IPD meta-analysis approach. Psychol. Methods doi: 10.1037/met0000539
Carnegie Classifications (n.d.). Carnegie foundation. Available online at: carnegiefoundation.org/our-work/postsecondary-innovation/carnegie-classifications/ (accessed November 28, 2023).
Carnegie Foundation (2023). Carnegie classifications. Carnegie Foundation. Available online at: https://www.carnegiefoundation.org/our-work/postsecondary-innovation/carnegie-classifications/
Chen, D. G. D., and Peace, K. E. (2021). Applied Meta-analysis with R and Stata. Boca Raton, FL: CRC Press. doi: 10.1201/9780429061240
Cheung, M. W. L., and Jak, S. (2016). Analyzing big data in psychology: A split/analyze/meta-analyze approach. Front. Psychol. 7:738. doi: 10.3389/fpsyg.2016.00738
Coates, H. (2005). The value of student engagement for higher education quality assurance. Qual. High. Educ. 11, 25–36. doi: 10.1080/13538320500074915
Feldman, K., and Newcomb, T. (1969). The impact of college on students. San Francisco, CA: Jossey-Bass.
Gök, E. (in press). Carnegie basic classification. J. Higher Educ. Policy Manage. doi: 10.1080/1360080X.2023.2299152
Guri-Rosenblit, S., Šebková, H., and Teichler, U. (2007). Massification and diversity of higher education systems: interplay of complex dimensions. High. Educ. Policy 20, 373–389. doi: 10.1057/palgrave.hep.8300158
Hagel, P., Carr, R., and Devlin, M. (2012). Conceptualising and measuring student engagement through the Australasian Survey of Student Engagement (AUSSE): a critique. Assess. Eval. High. Educ. 37, 475–486. doi: 10.1080/02602938.2010.545870
Holland, M. M., and Ford, K. S. (2021). Legitimating prestige through diversity: how higher education institutions represent ethno-racial diversity across levels of selectivity. J. High. Educ. 92, 1–30. doi: 10.1080/00221546.2020.1740532
Hurtado, S. (2001). “Linking diversity and educational purpose: How diversity affects the classroom environment and student development” in Diversity challenged: Evidence on the impact of affirmative action, ed. G. Orfield (Cambridge, MA: Harvard Education Publishing Group), 187–203.
Hutchinson, S. R., and Hyer, P. B. (2000). The campus climate for diversity: student perceptions. Office of the Senior Vice President and Provost. Blacksburg, VA: Virginia Polytechnic Institute and State University.
Kahu, E. R. (2013). Framing student engagement in higher education. Stud. High. Educ. 38, 758–773. doi: 10.1080/03075079.2011.598505
Kandiko Howson, C., and Buckley, A. (2017). Development of the UK engagement survey. Assess. Eval. High. Educ. 42, 1132–1144. doi: 10.1080/02602938.2016.1235134
Krause, K. L., and Coates, H. (2008). Students’ engagement in first-year university. Assess. Eval. High. Educ. 33, 493–505. doi: 10.1080/02602930701698892
Kuh, G. D., and Hu, S. (2001). Learning productivity at research universities. J. Higher Educ. 72, 1–28.
Lakens, D. (2017). Equivalence tests: a practical primer for t-tests, correlations, and meta-analyses. Soc. Psychol. Personal Sci. 8, 355–362. doi: 10.1177/1948550617697177
Lee, J. J., and Rhoads, R. A. (2004). Faculty entrepreneurialism and the challenge to undergraduate education at research universities. Res. High. Educ. 45, 739–760. doi: 10.1023/B:RIHE.0000044229.70457.ca
Mayhew, M. J., Rockenbach, A. N., Bowman, N. A., Seifert, T. A., and Wolniak, G. C. (2016). How college affects students: 21st century evidence that higher education works, Vol. 1. San Francisco, CA: John Wiley & Sons.
McCormick, A. C., and Borden, V. M. H. (2020). “Higher education institutions, types and classifications of,” in The international encyclopedia of higher education systems and institutions, eds P. N. Teixeira and J. C. Shin (Dordrecht: Springer), 697–705. doi: 10.1007/978-94-017-8905-9_22
McCormick, A. C., and Zhao, C.-M. (2005). Rethinking and reframing the Carnegie classification. Change 37, 50–57. doi: 10.3200/CHNG.37.5.51-57
McCormick, A. C., Pike, G. R., Kuh, G. D., and Chen, P. S. D. (2009). Comparing the utility of the 2000 and 2005 Carnegie classification systems in research on students’ college experiences and outcomes. Res. High. Educ. 50, 144–167. doi: 10.1007/s11162-008-9112-9
Miller, A. L., Sarraf, S. A., Dumford, A. D., and Rocconi, L. M. (2016). Construct validity of NSSE engagement indicators. NSEE Psychometric Portfolio Report. Bloomington, IN: Indiana University, Center for Postsecondary Research, School of Education.
Muthén, L. K., and Muthén, B. O. (1998–2020). Mplus user’s guide, 8th Edn. Los Angeles, CA: Muthén & Muthén.
NSSE (2021). About NSSE. Available online at: https://nsse.indiana.edu/nsse/about-nsse/index.html (accessed July 28, 2021).
NSSE (2023). Evidence-Based Improvement in Higher Education. Available online at: https://nsse.indiana.edu/nsse/reports-data/nsse-overview.html (accessed November 27, 2023).
Öz, Y., and Boyacı, A. (2021). The role of student engagement in student outcomes in higher education: implications from a developing country. Int. J. Educ. Res. 110:101880. doi: 10.1016/j.ijer.2021.101880
Pace, C. R. (1984). Measuring the quality of college student experiences. An account of the development and use of the college student experiences questionnaire. Los Angeles, CA: Higher Education Research Institute.
Pascarella, E. T. (2006). How college affects students: ten directions for future research. J. Coll. Stud. Dev. 47, 508–520. doi: 10.1353/csd.2006.0060
Pascarella, E. T., and Terenzini, P. T. (1991). How college affects students: findings and insights from twenty years of research. San Francisco, CA: Jossey-Bass Inc.
Pascarella, E. T., and Terenzini, P. T. (2005). How college affects students: a third decade of research, Vol. 2. Indianapolis, IN: Jossey-Bass.
Pike, G. R., Kuh, G. D., and Gonyea, R. M. (2003). The relationship between institutional mission and students’ involvement and educational outcomes. Res. High. Educ. 44, 241–261. doi: 10.1023/A:1022055829783
Pike, G. R., Smart, J. C., and Ethington, C. A. (2012). The mediating effects of student engagement on the relationships between academic disciplines and learning outcomes: an extension of Holland’s theory. Res. High. Educ. 53, 550–575. doi: 10.1007/s11162-011-9239-y
Pike, G. R., Smart, J. C., Kuh, G. D., and Hayek, J. C. (2006). Educational expenditures and student engagement: when does money matter? Res. High. Educ. 47, 847–872. doi: 10.1007/s11162-006-9018-3
Sahin, M., and Aybek, E. (2019). Jamovi: an easy to use statistical software for the social scientists. Int. J. Assess. Tools Educ. 6, 670–692. doi: 10.21449/ijate.661803
Snijders, T. A. B., and Bosker, R. J. (2012). Multilevel analysis: an introduction to basic and advanced multilevel modeling. London: SAGE.
Terenzini, P. T., and Pascarella, E. T. (1998). Studying college students in the 21st century: meeting new challenges. Rev. High. Educ. 21, 151–165. doi: 10.1353/rhe.1998.a30045
The Carnegie Classification of Institutions of Higher Education (n.d.). About Carnegie classification. Available online at: https://carnegieclassifications.acenet.edu/ (accessed October 20, 2023).
The Jamovi Project (2022). jamovi. (Version 2.3) [Computer Software]. Available online at: https://www.jamovi.org
Tight, M. (2020). Student retention and engagement in higher education. J. Furth. High. Educ. 44, 689–704. doi: 10.1080/0309877X.2019.1576860
Vaira, M. (2004). Globalization and higher education organizational change: a framework for analysis. High. Educ. 48, 483–510. doi: 10.1023/B:HIGH.0000046711.31908.e5
Viechtbauer, W. (2010). Conducting meta-analyses in R with the metaphor package. J. Stat. Softw. 36, 1–48. doi: 10.18637/jss.v036.i03
Wieman, C. (2015). A better way to evaluate undergraduate teaching. Change Mag. High. Learn. 47, 6–15. doi: 10.1080/00091383.2015.996077
Winter, D. G., McClelland, D. C., and Stewart, A. J. (1981). A new case for the liberal arts. Assessing institutional goals and student development. San Francisco, CA: Jossey-Bass.
Yin, H., and Wang, W. (2016). Undergraduate students’ motivation and engagement in China: an exploratory study. Assess. Eval. High. Educ. 41, 601–621. doi: 10.1080/02602938.2015.1037240
Keywords: Carnegie Classification, student engagement, assessment, multilevel analysis, higher education
Citation: Gök E and Aydin B (2024) The explanatory power of Carnegie Classification in predicting engagement indicators: a multilevel analysis. Front. Educ. 8:1305747. doi: 10.3389/feduc.2023.1305747
Received: 02 October 2023; Accepted: 18 December 2023;
Published: 08 January 2024.
Edited by:
David Rodriguez-Gomez, Universitat Autònoma de Barcelona, SpainReviewed by:
Jillian Kinzie, Indiana University, United StatesLouis Rocconi, The University of Tennessee, Knoxville, United States
Copyright © 2024 Gök and Aydin. This is an open-access article distributed under the terms of the Creative Commons Attribution License (CC BY). The use, distribution or reproduction in other forums is permitted, provided the original author(s) and the copyright owner(s) are credited and that the original publication in this journal is cited, in accordance with accepted academic practice. No use, distribution or reproduction is permitted which does not comply with these terms.
*Correspondence: Burak Aydin, YnVyYWsuYXlkaW5AbGV1cGhhbmEuZGU=