 Giorgio Bolondi
 Laura Branchetti
 Clelia Cascella
 Chiara Giberti
- 1Faculty of Education, Free University of Bozen-Bolzano, Bolzano, Italy
- 2Department of Mathematics “Federigo Enriques”, University of Milan, Milan, Italy
- 3Department of test development, Istituto nazionale per la valutazione del sistema educativo di istruzione e di formazione (INVALSI), Rome, Italy
- 4Manchester institute of education, School of Education, Environment and Development, The University of Manchester, Manchester, United Kingdom
- 5Department of human and social science, University of Bergamo, Bergamo, Italy
The purpose of this paper is to explore whether and how the verbal formulation of a task influences the activation of argumentative processes in a geometrical word problem involving figural concepts. The study adopts a multilevel explanatory mixed methods research design. Both the quantitative and qualitative experiments were based on a paradigmatic situation of figural concept proposed by Fischbein. Our main quantitative result is that different formulations of a task impact on students’ performance and on the selection of an argumentative or operational option. Moreover, we qualitatively investigated the students’ approaches, and this allowed to observe a variety of approaches ranging from a completely operational one to an argumentative one. The analysis highlighted interesting facts about the integration of sentential information and diagrams and the students’ strategies.
1. Introduction
In 1993, Efraim Fischbein published a foundational paper entitled “The Theory of Figural Concepts.” While explaining the relationships between image and concept, he presented a particularly significant situation (Figure 1).
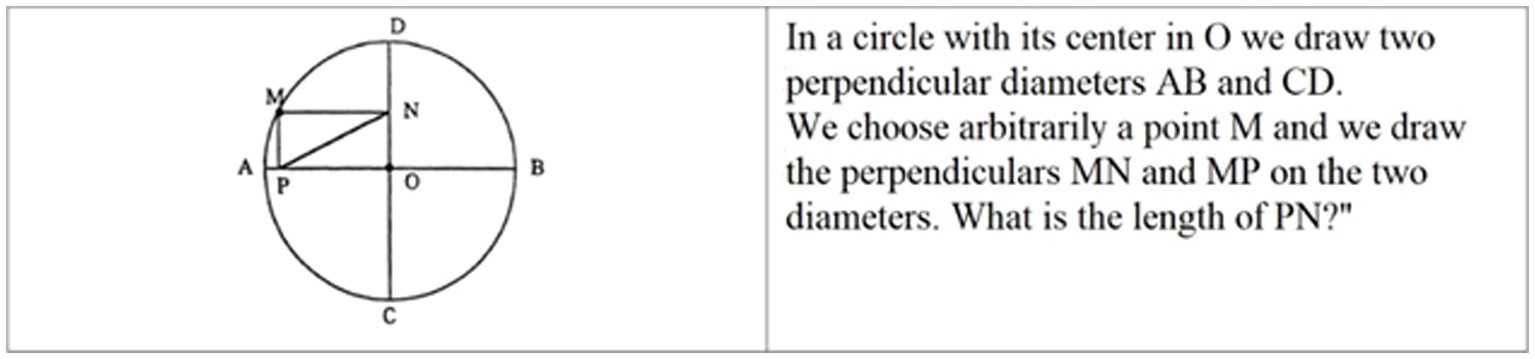
Figure 1. The original text in Fischbein’s paper is “in a circle with its center in C…,” which is not coherent with the figure, Fischbein (1993, p. 142).
The process which leads to the correct conclusion is activated “suddenly.” In Fischbein’s words:
The fact that we jump to the conclusion suddenly – PN = MO = radius = constant – at the very moment when we have grasped the rectangle PONM, without an intervening investigation, supports the idea that the considered figure is, from the beginning, not an ordinary image but an already logically controlled structure (Fischbein, 1993).
Fischbein focused on the sudden recognition of the polygon as a rectangle, identifying it as a clue of the development of a specific attitude towards geometrical figures, that is necessary to face geometrical problems with a theoretical approach. He describes a sort of “Aha! effect” which is known to be present in the construction of logical argumentation in mathematics (Balacheff, 2010).
A task inspired by the one proposed by Fischbein was administered in a test for a Large Scale Assessment (LSA henceforth) in 2010 to around 550,000 grade 08 students in Italy. An important change made by the authors of the test was that the fact that PONM as a rectangle was explicitly declared. Despite this explicit statement, only 37.2% of students provided the correct answer and 18.3% of the justifications given were correct. We observed this phenomenon: even when the fact that PONM is a rectangle is explicitly declared, the process is not necessarily activated. Similar results occurred also in another LSA test containing a similar item, administered in 2014 to Grade 10 students. Both tests were administered by the official Italian Agency INVALSI in the frame of the National Assessment System. “To grasp the rectangle” revealed to be something more than “To see the rectangular shape PONM” (figural input) plus “To state that the figure PONM is a rectangle” (conceptual input). This can be considered an example of how LSAs can “quantify” known theoretical constructs (Bolondi and Ferretti, 2021).
Italian students at the end of grade 8 are expected to develop an approach to geometrical problem solving that combines concrete reasoning and actions on objects based on the observation of the pictorial representations with logical statements based on conceptual properties, according to the national Guidelines for the Curriculum (MIUR, 2012). Working on geometric diagrams looking at it both as a figure and as a bearer of “abstract” properties is also included in the curriculum (MIUR, 2012). So, a general question is how far verbal description of a geometric task can be relevant in this interplay.
This is at the same time crucial to successfully access high school mathematics and hard to make for several students, as the results of LSAs showed. We consider this task paradigmatic also from this point of view. This interplay between figures (which bring properties) and properties (which lead the exploration of figures), which is at the core of the idea of figural concept, is particularly relevant when students switch from a lower mathematical curriculum to a higher one, where argumentation becomes structured (Chazan, 1993; Fujita et al., 2010).
In this paper we investigate the students’ approaches to this problem, which may be considered a prototypical task used to assess skills at the passage from Grade 08 to Grade 09 (in Italy, the first high-school grade). It can reveal the development or not of the expected approach to geometrical problem solving.
Our initial goal was to explore quantitatively how far the logical control of the structure of the situation depended on features of the formulation of the task, considering in particular linguistic aspects. The research hypothesis was that the way the information was expressed in sentential form could influence the students’ reasoning on figures, hence their strategies. We searched for intermediate steps in students’ reasoning: we focused on the identification of the path which leads the student to recognize a proposed claim as correct.
Our methodological choice was based on the assumption that a complex phenomenon like the one we are investigating may be better regarded, described, and interpreted by means of a gradual magnification of the observation. In fact, neither a blind quantitative datum, how huge it may be, nor a specific and necessarily contextualized focused study, how deep it may be, by themselves can give a sound and convincing account of phenomena like the one we consider, whose evidence emerges at systemic level. This implies a gradual switching from quantitative large-scale evidence to qualitative in-deep observation.
Starting from the evidence of LSAs, we therefore formulated different versions of the same text and we administered them to a population of 1,684 students. An anchoring technique (Bolondi et al., 2018) allowed the detection of a statistically significant relationship between linguistic organization and students’ answers, confirming the research hypothesis.
The results of the first step stirred up other research questions; we investigated whether and how the features of the stimuli influenced the students’ answers with a pilot study in a 9th grade class, trying to shed light on possible explanations. We used figural concepts to carry out an a priori analysis of the task and analyze students’ answers in the qualitative step. To analyze the students’ interaction with figures we referred to the conception of a geometrical figure (Herbst et al., 2017). The qualitative investigation showed that it was possible to group by similarity the approaches of the students of our population and we identified conditions under which the text reading can influence the student’s exploration approach to geometrical problems.
2. Theoretical framework
Our theoretical background interfaces three areas, relevant in different steps of our research design: the impact of the formulation of a task on students’ strategies, the conception of geometrical figures and Toulmin’s model for characterizing the components of argumentative reasoning.
2.1. Formulation of a task
It is generally accepted that language plays an important role in the development of mathematical thinking and is a crucial mediator of mathematical activity (Ferrari, 2004). Much research highlights the impact of linguistic formulation on students’ approaches to word problems and several frameworks are available (Novotná and Chvál, 2018). Nesher (1976) identified three components of the text that produce such an effect: logical (operations, lack or abundance of data, etc.), syntactic (position of the question in the text, number of words, etc.) and semantic (contextual-relations, implicit suggestions etc.). Duval (1991) showed that, by changing some “variables rédactionnelles” (French original name), including linguistic variations, students’ strategies may change significantly. Laborde (1995) included other variations: punctuation, syntactic complexity, word density, order of information, declaration of intermediate objects needed for the solution. Daroczy et al. (2015) confirmed that problem solving-strategies could depend on linguistic factors like wording, semantic categories, and propositions. Bolondi et al. (2018), while developing a technique for measuring the impact of the formulation of a task on students’ answers, observed that a variation may produce different impacts on students with different mathematical abilities.
While reading texts expressing mathematics tasks, students might adopt peculiar reading strategies. We are interested in variations of the syntax of the formulation of a task. We stress the fact that we use the word “syntax” (and its derivatives) in the original linguistic meaning. We rely on the definition provided by the standard reference for Italian language (Simoni, 2011):
Syntax deals with the ways in which words can combine, with the structures (or constructions) that are thus obtained and with the effects that such combinations have on other planes, such as that of pragmatics (transl. by the authors).
2.2. Conceptions of figures, diagrams, and figural concepts
To consider the impact of formulation of the task on students’ strategies in geometrical problem solving, it is important also the way students deal with the figures included in the task, and how they coordinate the information retrieved from the figure with the one presented in the text. When students come to secondary geometry, they bring with them some conceptions of figure (Herbst et al., 2017). Fischbein (1993, p.148) stressed that it is necessary to consider “the complexity of relationships between the figural and the conceptual aspects in the organization of figural concepts and the fragility of that organization in the students’ minds.” Fischbein’s (1993) developed the notion of figural concept to stress that the diagrammatic representations of geometrical concepts provide them with features that are not entirely contained in their abstract definition: the fact that those concepts can be diagrammed enables metaphorical operations.
We summarize here the main references which guided our analysis.
Students’ interpretation of figures in geometry has been investigated from several perspectives (Herbst et al., 2017). Following these authors., who, in turn, used the notion proposed by Balacheff and Gaudin (2010), by conception we mean “a stable system of interactions between a knowing agent (e.g., a child) and a milieu (the mathematical counterpart to the child in those actions).” Consistently, conceptions of figures are “ways of making sense of their activity at various levels of spatial organization” (Herbst et al., 2017, p. 2); we are interested in the conception of figure as description of small objects, named descriptions of objects in the microspace. Conceptions of figures can be modeled using a quadruplet (P, R, L, Σ), that in this case we can be summarize as follows:
- Problems in which the conception is operational, that may be written or oral statements in the milieu, or goal states ascribed to the agent (P).
- Operators used to pursue those problems, repeatable and transposable actions that the agent is observed doing with or without instruments (R).
- Semiotic registers (language or another sign system) employed in communicating the problem to the agent as well as used by the agent to act on the milieu (L).
- Set of controls inscribed in the milieu or ascribed to the subject on account of observations of their decision making; controls check for the correct application of operators and for whether a given problem has been solved correctly (Σ).
Laborde (2005) discussed two kinds of properties of geometric figures, distinguishing the types of information conveyed by a diagram (that is a “picture” or “sensory representation”; Duval, 1995): spatiographical and theoretical properties.
Some spatiographical properties, such as the color and width of strokes, are not geometrical. Others, such as the specific length of segments or amplitude of angles, are geometrical but incidental to a specific figure - e.g., the angles could be of that size but also others.
What characterizes a figural concept is…
the fact that it expresses an idea, a general, ideal representation of a class of objects, based on their common features. In contrast, an image (we refer here to mental images) is a sensorial representation of an object or phenomenon (Fischbein, 1993, p. 139).
Larkin and Simon (1987) introduced another level of analysis, comparing the ability to manage sentential and diagrammatic representations of information in problem solving: diagrammatic representations required less processing than their sentential counterparts. In sententially-stated problems “the given data structure does not match the given program. Therefore, to solve the problem at all, the problem solver must enhance the data structure in ways that prove considerably easier with diagrams than with sentences” (Larkin and Simon, 1987, p. 82). The “given data structure” are the givens of a problem, and the “given program” are the statements of definitions and properties that can be used in solving. The diagram not only shows together things that are related, but it also makes apparent different kinds of objects that could be read in the data (e.g., three intersecting lines are not only that, but they also make a triangle). A diagram helps to encode and relate the givens. Extra work is needed in sentential problems: the sentential part could refer to objects that become evident in the interaction with the diagrammatic representation, so the request itself could not be comprehended relying only on statements. The geometric diagram largely reduces the work of recognition with respect to only sententially stated problems.
2.3. Argumentation
The Toulmin model for describing argumentation has been used in mathematics education research (Krummheuer, 1995; Boero et al., 2010; Durand-Guerrier et al., 2011). We underline that we use it for describing our input, i.e., the formulation of the task, and not possible outputs, i.e., the description of reasonings of students, as it is done, for instance, by Komatsu et al. (2017). Toulmin’s (2003) model considers six interrelated elements: the Claim (the position to be argued), the Ground (the data or facts on which the claim is grounded), the Warrants (the principles which allow grounding the claim over the data), the Backing (the set of conditions where the warrants are applicable), the Rebuttal (possible consideration of counter-arguments), and the Qualifier (the possible strengths of the claim). Our task was designed as a form of proof validation in the sense of Selden and Selden (2003, 2015).
3. Research questions
In geometrical word problems, conceptual information is often propelled sententially, mainly by the verbal text of a task, and some more information is represented diagrammatically.
In our task, students might combine sentential and diagrammatic information to select an option. We wonder if the syntactic formulation of the sentential part of the task activates in different ways the students’ resources leading them to different choices. Indeed, the syntactic formulation of the sentence can play a role, since it establishes the relationship between different elements of a sentence and could encourage the students to consider the theoretical properties of objects, named or represented graphically (recognition of useful statements, synergy between sentential and diagrammatic information). Depending on previous conceptions of geometric figures and habits when they interact with the milieu, some syntactic formulations can be more familiar to students, and guide them to interact with the figure in already established ways. Moreover, the givens of an argumentative reasoning can be different than the ones needed to solve the problem operating with measurements and numbers or using approximations, so information chosen by the students can lead them to different operations and controls.
Fixing the figure, we expected a different formulation of the text to lead students to a different exploration of the figure or discourage the students from reading the text in favor of using only the information seen in the figure, resulting in a different distribution of answers.
Our research questions are as follows:
1. Is there a significant quantitative difference between the distributions of students’ answers if the syntactic formulation of the task changes? Are there syntactic formulations that correspond to a higher percentage of choices of the option including the theoretical property of the rectangle?
2. Is it possible to identify and qualitatively interpret the students’ reasoning supporting their choice, linking the elements of the syntactic organization of the text to the argumentative processes and to the interaction text-figure? Is there evidence of an “implication” between features of the task formulation and students’ recurrent reasonings?
In the next section, we describe the distinct phases of our research methodology.
4. Research design and methodology: global view
According to the classification and the terminology adopted by Creswell and Plano Clark (2017), our design can be considered a (weak) multilevel sequential explanatory mixed methods research design Figure 2.
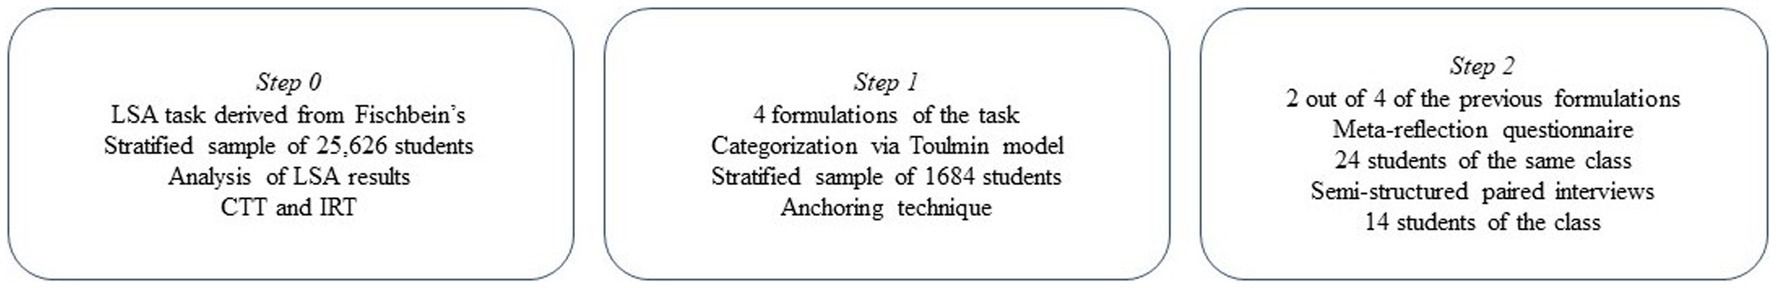
Figure 2. Research design.
We must specify that individuals considered in each “zoom” are not a subset of the previous one, for reasons of timing and acquired knowledge of the task (this is the reason for the adjective “weak” before “multilevel”). To ensure a global coherence of the research plan, the choice of the observed samples and groups has always been driven by consideration of coherence and compatibility.
Due to the sequential design of our study, we discuss the results of each step immediately afterwards, to design and implement the subsequent step. That’s why the paper is organized following the steps, each step containing the methodology, the experimental plan, the results and the discussion which lead to the subsequent step.
We based the task-design of Step 1 on the use of 2.3, the design of Step 2 and the interpretation of the results of Step 0 and Step 2 on the combined use of 2.1 and 2.2, whilst the elaboration and interpretation of the data collected in Step 1 (essentially quantitative) is based on the anchoring technique (Bolondi et al., 2018).
5. Step 0: discussing empirical evidence from LSA
5.1. Task
The following item was administered in the frame of a large-scale high scale testing in Italy. The item was based on Fischbein’s situation, but explicitly stated the fact that the figure ABCD was a rectangle (Figure 3).
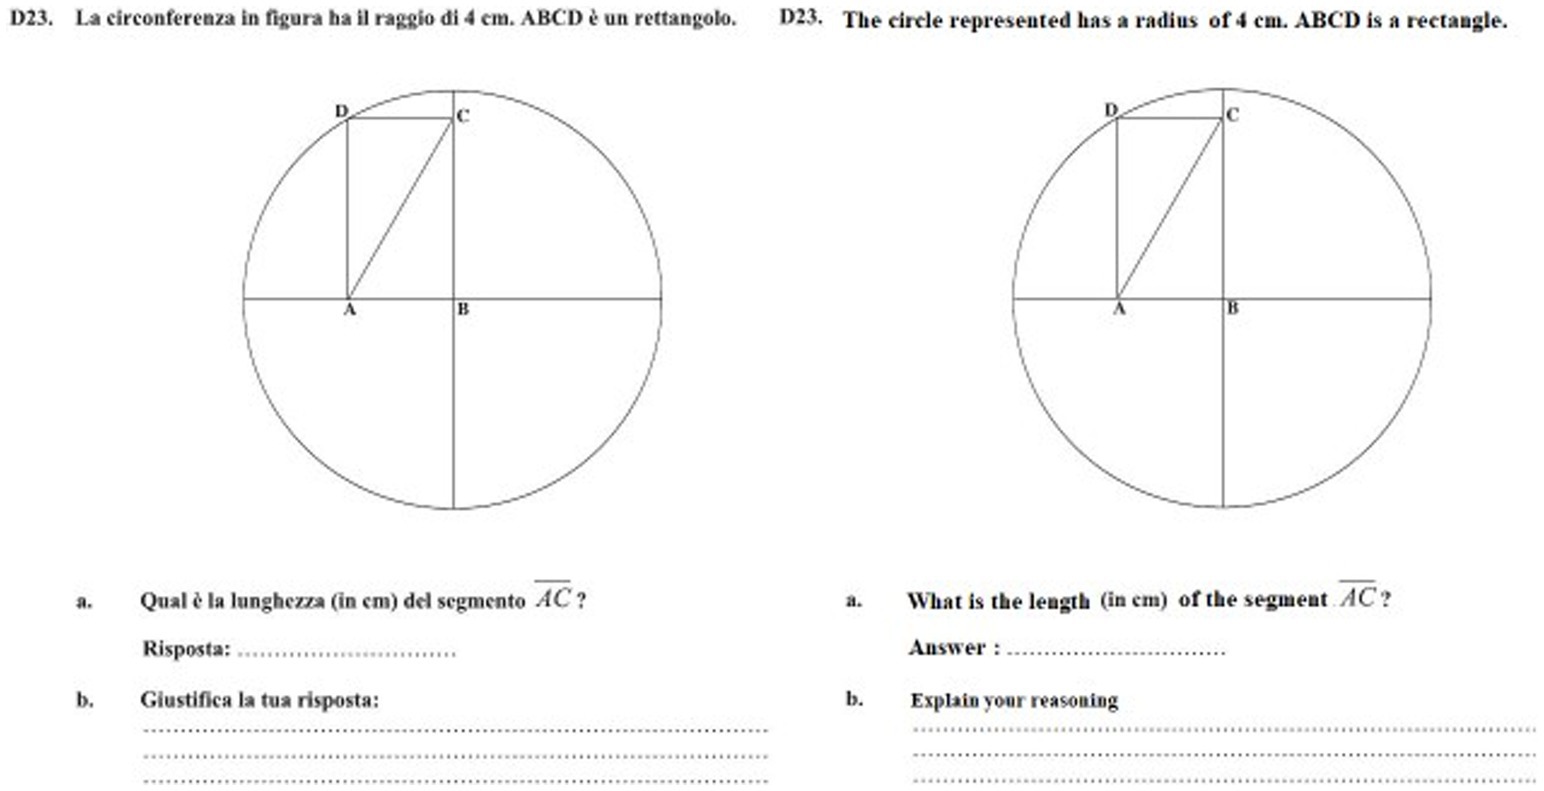
Figure 3. INVALSI item, www.gestinv.it. Translation by the authors.
5.2. Population
The task was administered to approximately 550,000 students attending the final month of grade 08, participating in a high-stake LSA (contributing to the final grading of the student). We conducted our analysis on a stratified sample drawn by INVALSI and statistically representative of the whole grade 8 population (25,626 students).
5.3. Methodology
The data analysis follows the modeling approach implemented by INVALSI: the Rasch model (Rasch, 1960; RM henceforth) was implemented using Conquest 4.0. RM is a logistic model, which provides a difficulty parameter for each item and the Items Characteristic Curve (ICC) which describes the trend of the correct answer as a function of students’ ability on the whole test. Furthermore, we considered a specific output of Conquest, the distractor plot, which reports the ICC compared to the empirical trend of all the possible answers (correct one and incorrect ones) as a function of students’ ability. We underline that we used the term “ability” in the psychometric technical meaning, i.e., to refer to the amount property the INVALSI scale purports to measure.
The analysis of the output of the RM was joined by other information gathered by Conquest. Analysis of the percentages of students’ answers allowed us to have a first overall information on students’ behavior facing this item which we further investigated using distractor plot analysis. We decided to include percentages in addition to Rasch parameters (Figures 4 5).
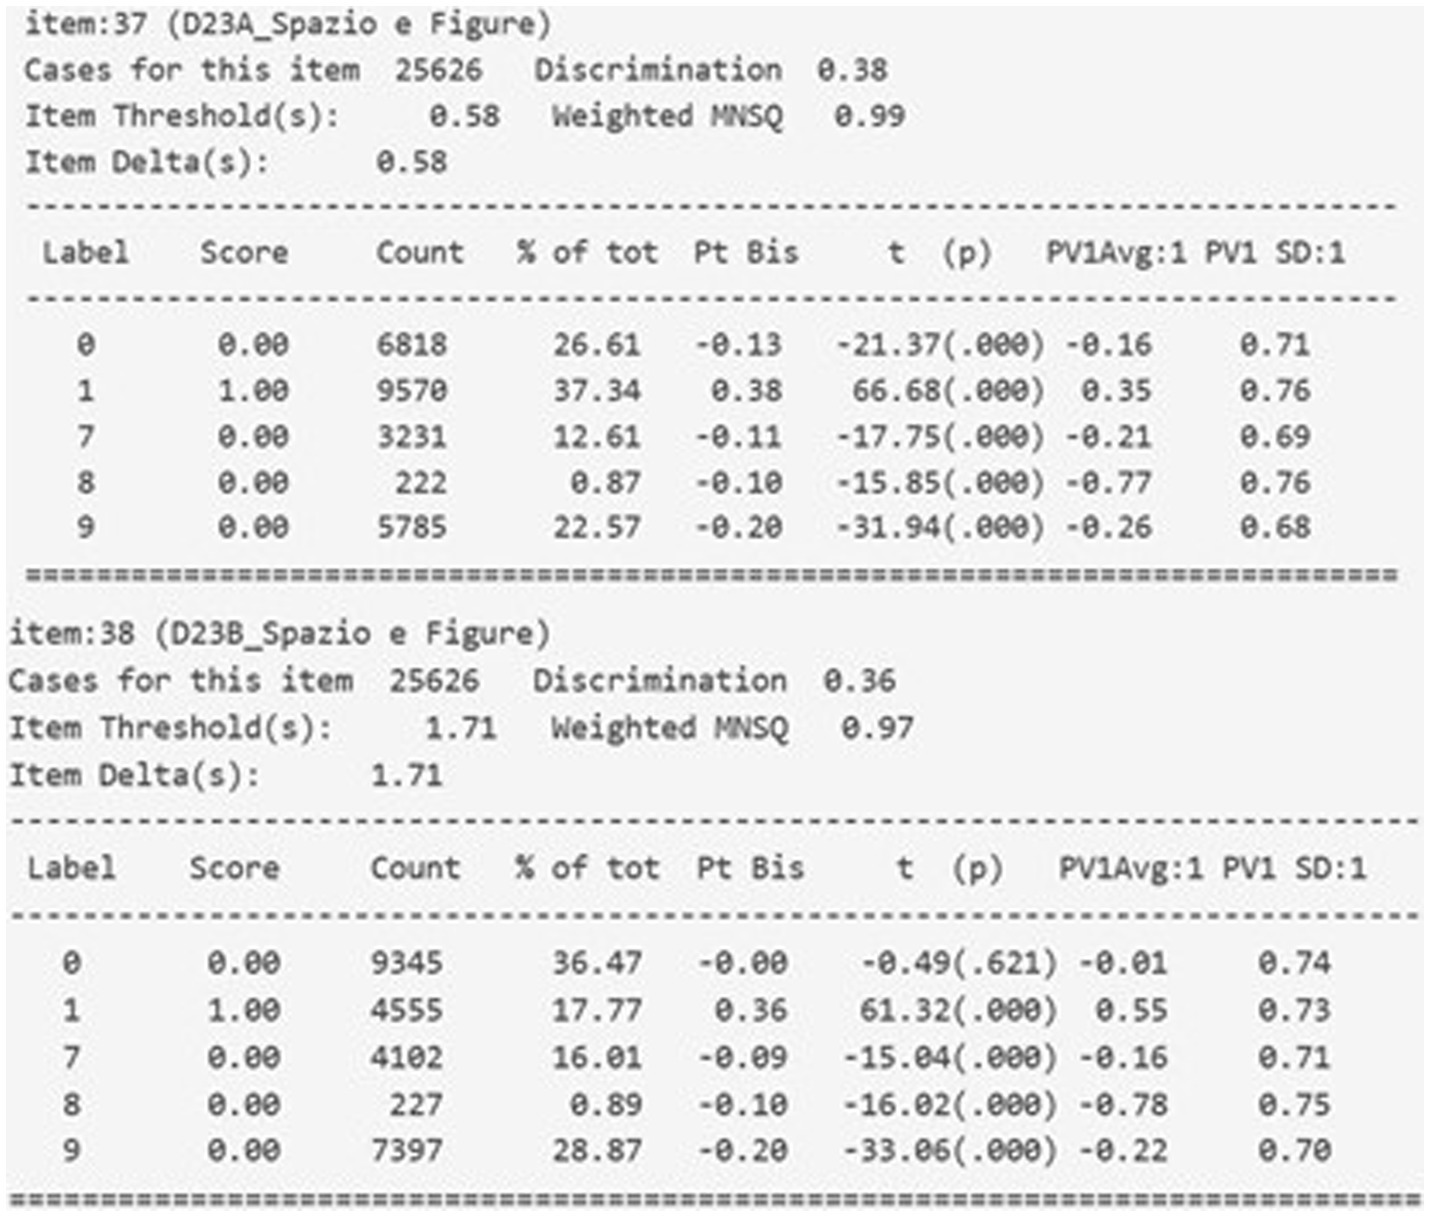
Figure 4. Results of the INVALSI items, www.gestinv.it. Labels: 0, wrong answers; 1, correct answers; 7, invalid; 8, non-reached; 9, missing.
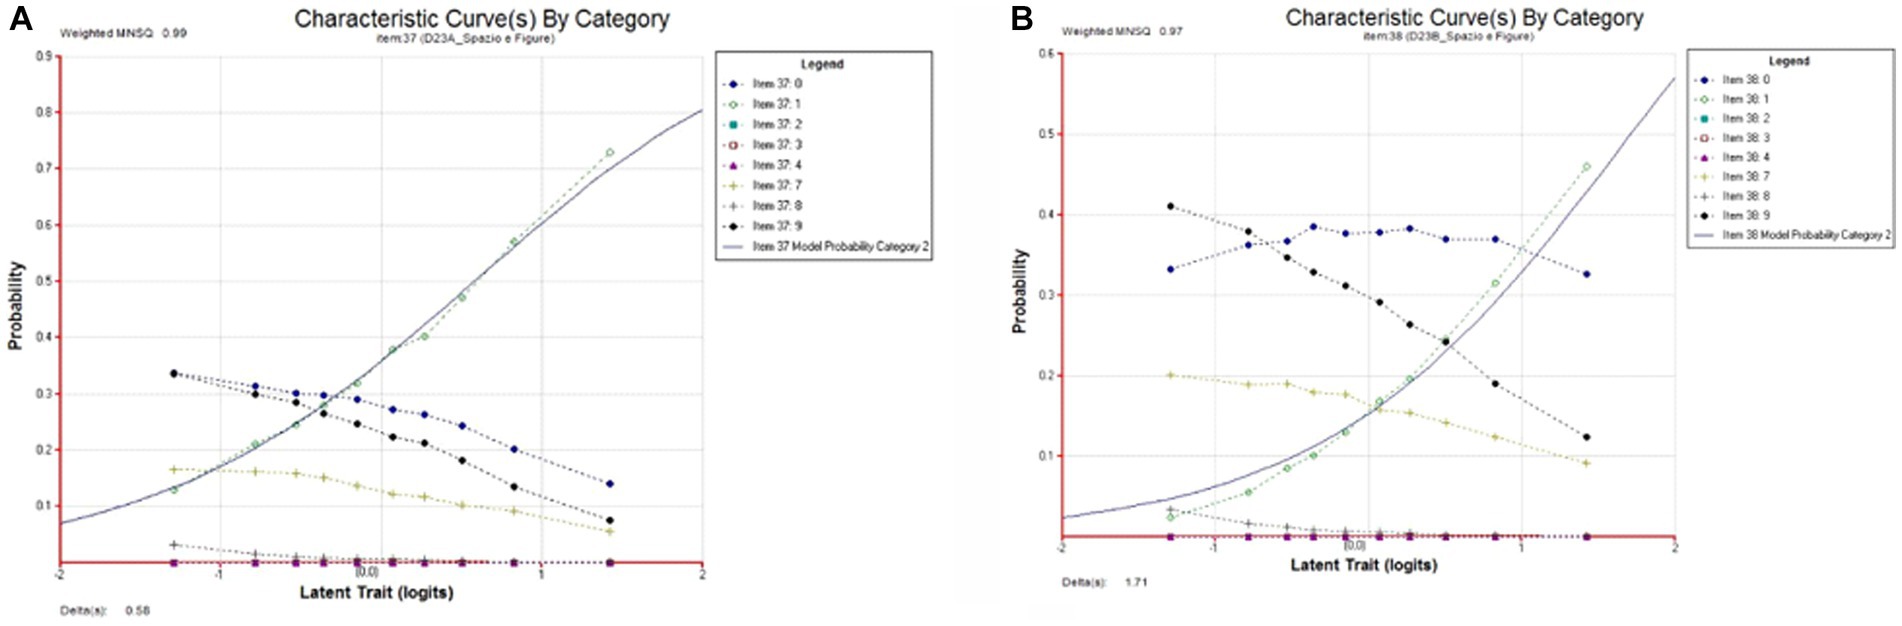
Figure 5. Plots of the INVALSI items [(A): above; (B): below], www.gestinv.it. Labels as in Figure 4.
RM offers advantages compared with other analytical approaches, such as Classical Test Theory (CTT). CTT focuses on the total test score, by computing for example frequency of correct responses (to indicate item difficulty); frequency of responses (to examine distractors); reliability of the test and item-total correlation (to evaluate discrimination at the item level) (Impara and Plake, 1998). Although these statistics are widely used (also in most of the previous research mentioned in our theoretical framework), all of them are sample dependent (Hambelton, 2000). In contrast, RM overcomes such a limitation by estimating test-free persons parameter and sample-free items’ parameters (Wright and Stone, 1979).
Such a property, “measurement invariance,” is one of the reasons why several authors have argued that RM is superior to CTT (e.g., Reise and Haviland, 2005; Prieler, 2007). Among the number of arguments favoring Rasch (Andrich and Marais, 2019), we focused here just on those about (possible) differences between items difficulty computed within the framework of the RM and CTT, and the related topics such as measurement precision. In particular, within the framework of the CTT, the measurement precision is assumed to be equal for all individuals irrespective of their attribute levels, whereas, in the framework of the RM, the measurement precision depends on the latent-attribute value (Jabrayilov et al., 2016). RM takes the pattern of item scores into account when inferring latent-attribute scores. Therefore, in pre-test and post-test situations, it may reveal (even very subtle) changes in individuals’ “ability.” Such a change could go unnoticed “if one uses the sum scores from CTT, which ignore the pattern of the item scores” (Jabrayilov et al., 2016, p. 560).
Item difficulty computed within the two analytical frameworks are different. Nonetheless, as recently pointed out for example by Jabrayilov et al. (2016), studies have suggested that RM “is superior to CTT, provided that tests contain, say, at least 20 items, but in general the differences between the two methods are small.” (p. 568). In our perspective, CTT is in general sufficient to point out didactical issues and the main pieces of evidence of emergent criticalities, but RM allows the use of the anchoring technique which is a key tool for step 2.
5.4. Results and discussion
To interpret students’ results, we use both CTT and RM (Figures 4 5).
Figure 4 reports on an overview of the item’s psychometric functionality. The data refer to the sample of 25,626 students. 37% of students chose the correct answer to a.
Another information is in the following distractor plots. On the x-axis there is the latent trait, i.e., the ability measured by the test, and on the y-axis the probability of students s’ choices. These graphs represent as a function of students’ ability both the empirical datum of the distribution of the answers (the dotted line), and the ICC (the continuous line).
The closer the empirical and the estimated curves are, the better the goodness of item’s fit is. Distractor plots show a good data-model fit.
The trend of missing, wrong and invalid answers is decreasing in the first item. For lower ability levels the probability of incorrect and missing answers is similar, for higher ability levels the probability of missing answers is lower than 0.1. Item b shows a similar trend for missing and invalid answers; the trend of incorrect answers is almost constant and, also for higher ability levels, the probability of wrong answers is higher than 0.3 (Figure 5).
The overall percentage of missing and invalid answers (35% in item a, 45% in item b) is very high, especially for low ability levels. If we look at missing answers to the other items of the same test, the average percentage of missing + invalid answers to open-ended items is approximately 15%. This confirms students’ difficulties in facing this item, which is evident also for high performing students.
These systemic data provide empirical quantitative evidence of the fact that “grasping the rectangle” is something more than “to see the rectangular shape ABCD” + “to state explicitly that ABCD is a rectangle.” In Fischbein’s (1993, p.144) words, in the course of a productive reasoning process, images and concepts interact intimately, but it does not seem to be enough to make the students focus their attention on the rectangle, writing an information in a sentential form - at least, not with a text formulated as we showed before.
This evidence showed the need for deeper investigation and informed the design of Steps 1 and 2.
6. Step 1: implementing variations in the syntactic formulation of the task
6.1. Task
Assessing the development of argumentative skills is a very complex issue (Durand-Guerrier et al., 2011). What we are here interested in is how the choice of a warrant (in the sense of Toulmin model), and hence the activation of the argumentation (how it was intended by Fischbein) may be influenced by the linguistic formulation of the task. Relying on the results presented in our literature review, we hypothesized that a different position of the key elements of argumentation in the syntactic structure of the sentences could influence the students’ reasonings and orient them in different directions regarding their interpretation of the request and might have an impact on the activation of the interplay between conceptual and figural aspects. We used Toulmin model for a theoretically-based construction of the variations of the formulation of the task. The elements needed for the argumentation (in particular Claim, Ground and Warrants, categorized according to Toulmin’s model) were differently organized in the syntactic structure of a sentence.
Hence, we prepared 4 formulations, derived from the original one. We explicitly stated, as in the INVALSI task, that the figure was a rectangle. We transformed the open-ended question into a multiple-choice version. This allowed to “catalyze” students’ choices. The choice was between four different claims to support a thesis or its negation. We decided to scaffold their approach, forcing it to a claim-warrant answer in two progressive steps to encourage a reasoning process (Stylianides et al., 2017): students had to decide if the claim about the length of the segment “diagonal of the rectangle” was true, and to choose among four different warrants. We inserted the task in a test of 32 items, in order to apply our quantitative technique, as we will explain in depth.
The stimulus was proposed in four formulations that re-organized the argumentative elements in different syntactic structures (Figures 6 7). We adopted patterns of linguistic formulations that are common in Italian textbooks, in particular in V4. In this version, all the data are syntactically subordinated to the claim and presented in the statement made by the fictitious character of the situation. We indicate:
• C the claim “Mario states that the segment AD measures 4 cm.”
• D1 the facts (ground) related to the circle “C is a circle with center C and radius 4 cm.”
• D2 the fact (ground) related to the rectangle “CABD is a rectangle.”
• W1 the warrant “The length of AB can be calculated using the Pythagorean Theorem and the result is different from 4.”
• W2 the warrant “There are not enough data for calculating the length of AD.”
• W3 the warrant “The length of AB can be calculated using the Pythagorean Theorem and the result is 4.”
• W4 the warrant “The diagonals of a rectangle are equal.”
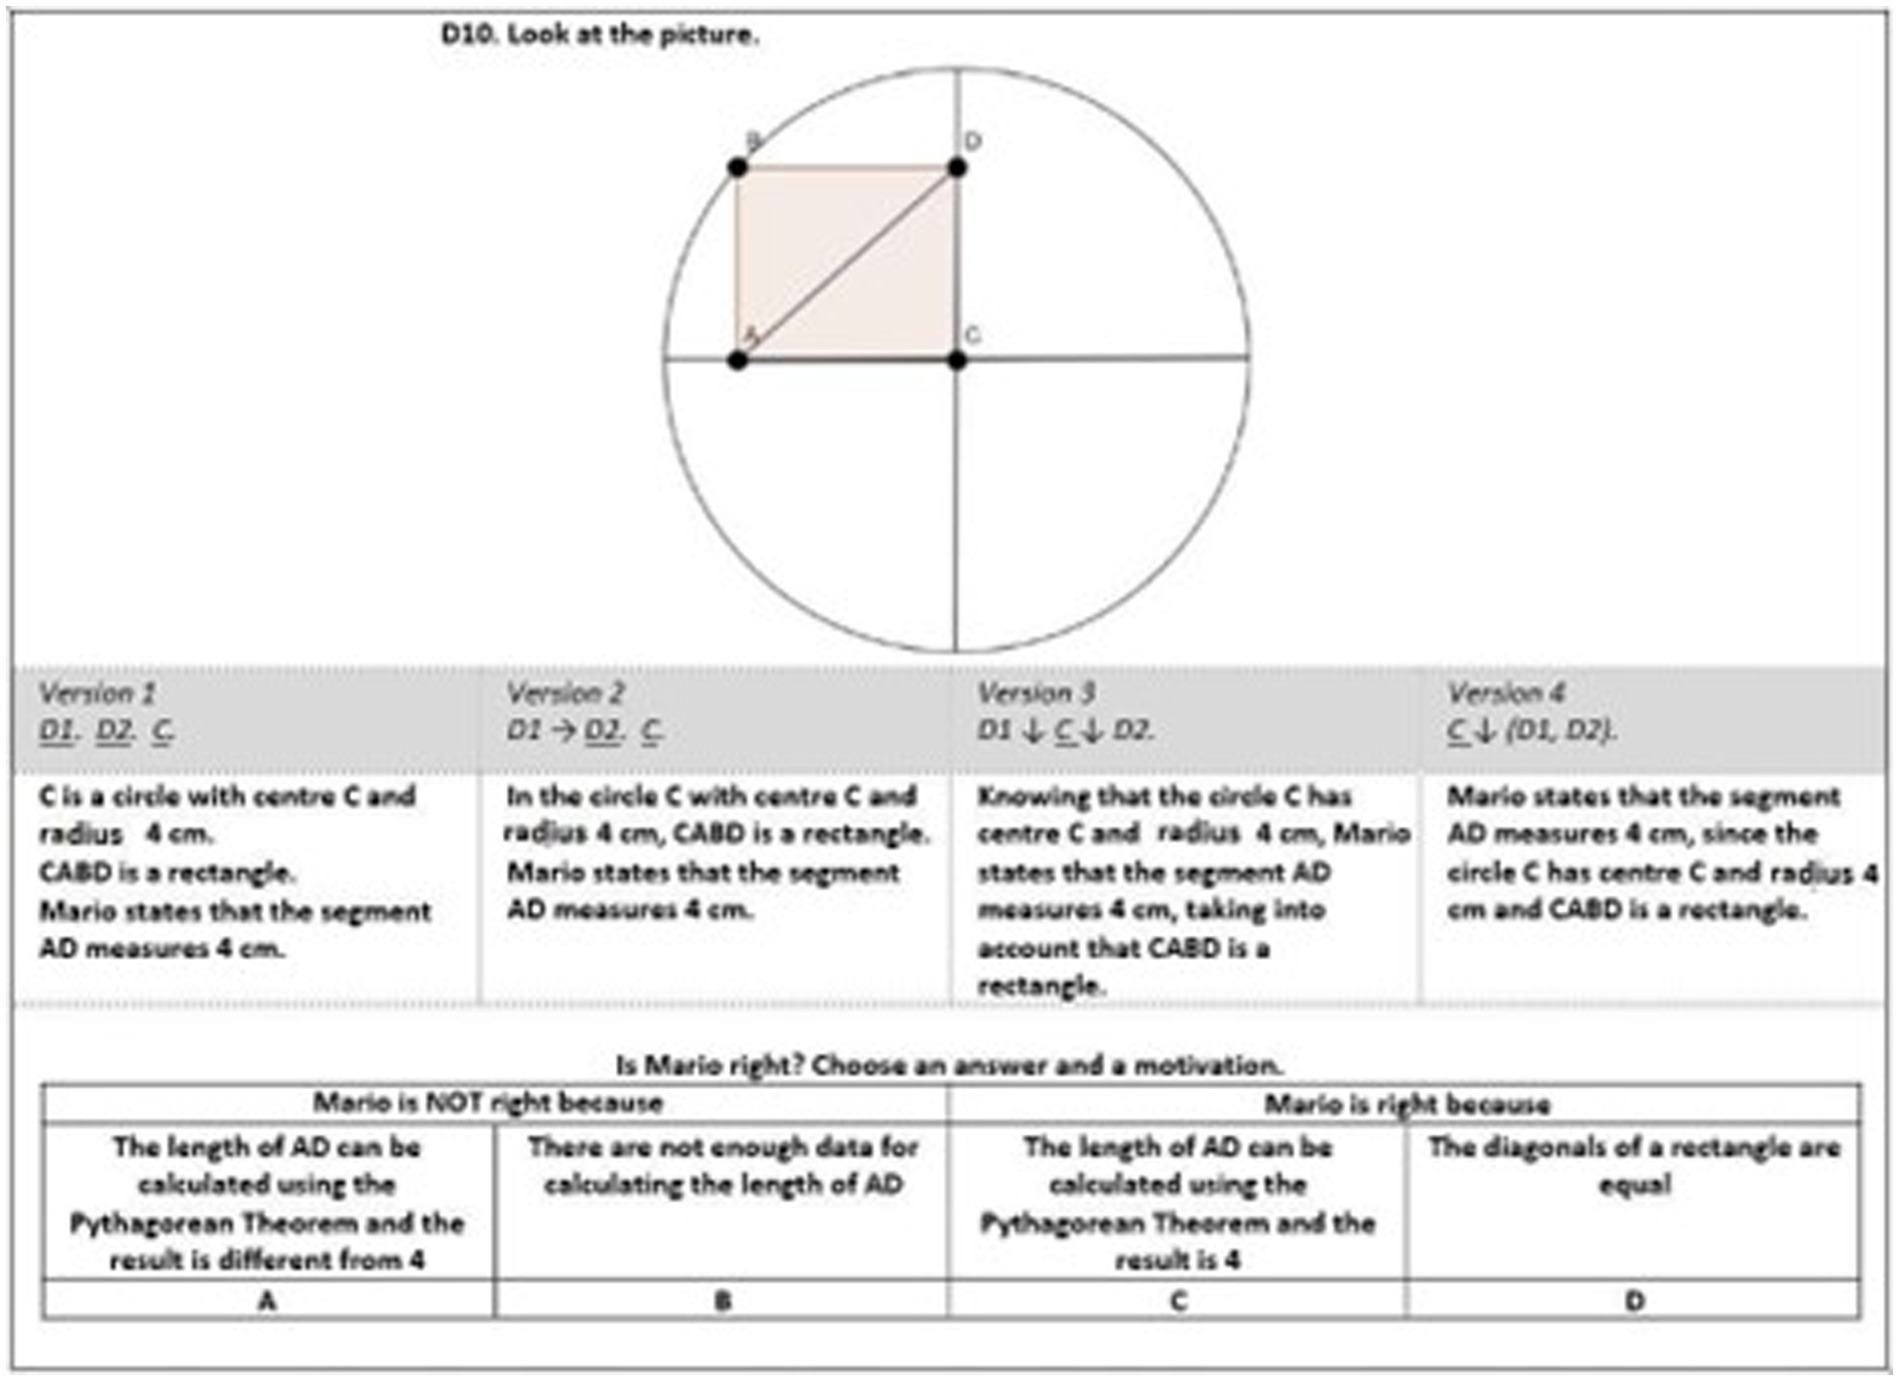
Figure 6. The different formulations of the task.
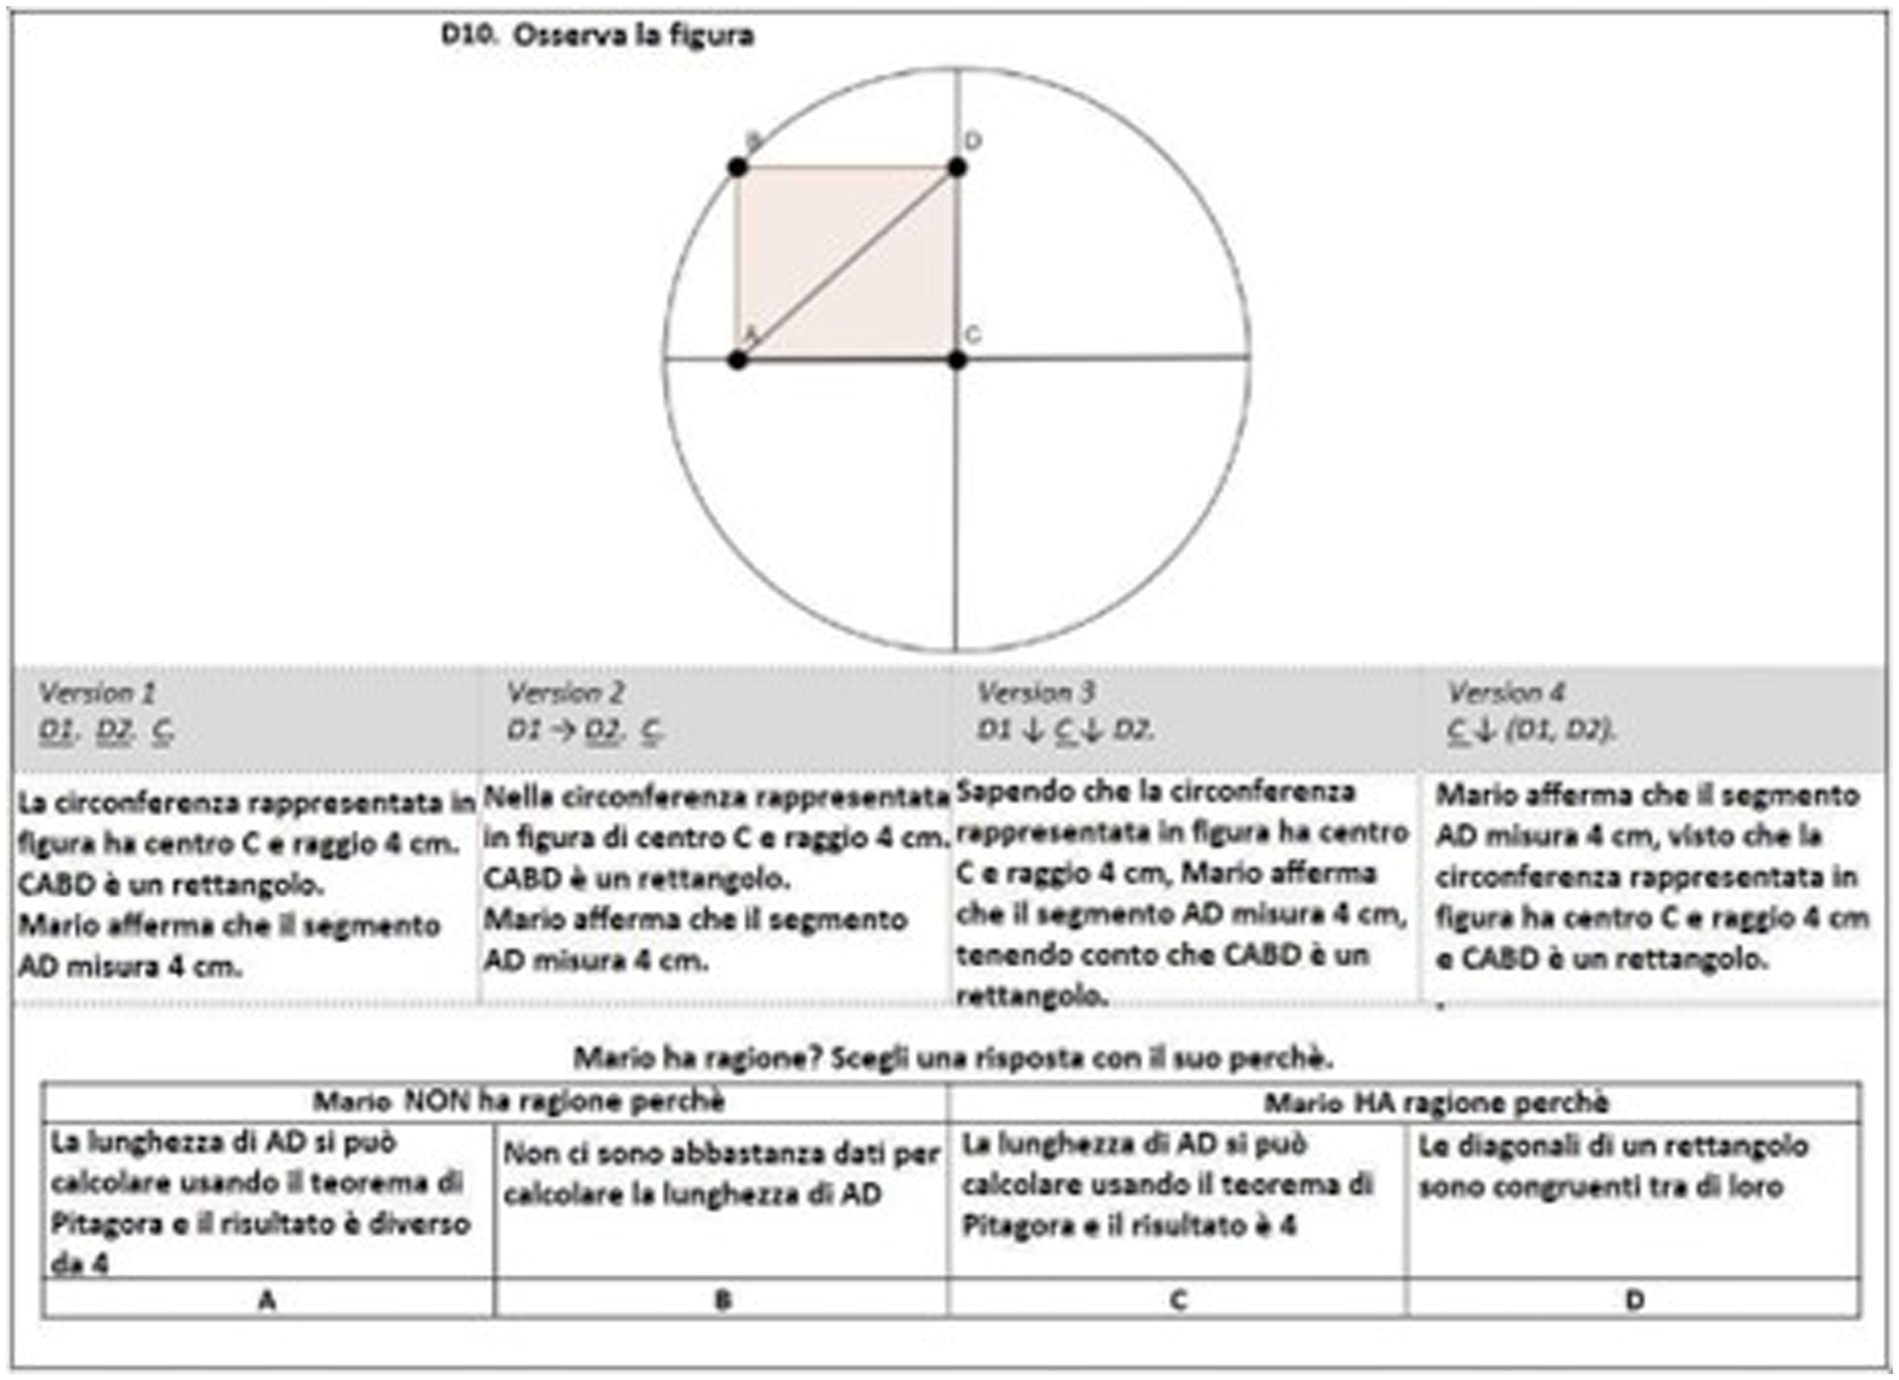
Figure 7. The different formulations of the task (original Italian).
Main clauses are underlined, and subordinations are indicated with arrows (if the linguistic form suggests a causal subordination, the arrow is vertical).
The students must choose between different warrants (Ws) supporting claim C or its negation. We observe that the linguistic structure of the stimuli of V1 and V2 is simpler with respect to V3 and V4: the claim is isolated and there are no subordinated sentences.
6.2. Population
Step 1 consisted in the administration of a test to a sample of 1,684 students from 85 grade 8 classes, selected via a probabilistic sampling strategy and then stratified by students’ region of residence and socioeconomic background. The test was administered at the end of the school year.
6.3. Methodology
The design of the experiment and the quantitative analysis are based on the methodology presented in Bolondi et al. (2018). We divided students into four groups, each answering only one of the four versions of the task. The four versions were administered to each class following a spiraling process. The key difficulty of comparing different versions of the same task (administered to different students) has been faced via the methodology developed and validated by Bolondi et al. (2018) and based on test equating technique. The comparison between groups is possible thanks to the introduction of a consistent number of other items, the same for all the students, composing the “Core Test” (CT). The CT is composed of items taken from previous LSAs, with good psychometric features, covering all mathematics contents and different difficulty levels. Each student completed a test composed of the CT and one version of the task. The mathematical ability of the students was measured through the common items composing the CT. Then, the difficulty of the four versions was measured on a common scale by using an anchoring technique (Kolen and Brennan, 2004) discussed by Bolondi et al. (2018). After having validated the robustness of the CT, we compared the empirical data (students’ answers) as functions of students’ ability on the CT. After equating, the difficulty of the versions of the task are directly comparable and the significance of different items’ difficulties can be argued considering the confidence interval calculated using the standard error. We compared the distribution of the correct option, against its alternatives for each version of the proposed task, via the distractor plots.
6.4. A priori analysis
The choice of options A and C (warrants W1 and W3) indicates a calculation approach based on the Pythagorean theorem. Option B (warrant W2) recalls the initial stage of Fischbein’s discussion: At a first glance, it seems that the problem cannot be solved because the lengths of the segments MP and MN depend on the position of the point M (Fischbein, 1993, p.142). Option D (warrant W4) recalls the warrant supporting the argumentation following the approach discussed by Fischbein. Indeed, one might also develop a correct and complete argumentation based on the Pythagorean theorem and on the equality of the opposite sides of the rectangle- but with a theoretical use of the statement of the theorem, not only a calculation.
Some features of the text might induce students to approach this geometrical word problems, according to their previous conceptions and habits. They might be completely misleading if they are accustomed to look for data in the text and guess a formula allowing to solve the problem with arithmetic. In this case the students might be convinced that the provided numerical data are not enough and look for other data in the figure. Moving to a different level of analysis, students might start reading the text and have difficulties in understanding it because of its linguistic complexity (Bolondi et al., 2018); this might induce a missing answer or make the student misread the request.
Going more deeply into the analysis, we wondered what elements of the text might induce in the students an argumentative or a non-argumentative strategy. How far is the argumentation based on a geometrical backing (the geometrical theory students have in mind) and on conceptual warrants?
The proximity of the text to the usual formulation of geometrical problems in Italian schools could have activated in students the search for a similar strategy; this might have occurred in the case of students mentioning the Pythagoras theorem. Difficulty in reading the text, due to syntactic complexity, could have led the students to select only some aspects of the figure ignoring the information in the text. The choice of a “Pythagorean warrant” (positive or negative) was based on the assumption that the shape of a right-angled triangle (half of the rectangle) is evident in the picture, and thus could cause the “activation” of a routine based on the Pythagorean theorem, attracting the students who expect an algorithmic procedure based on formulae.
According to our framework, the choice of the claim (Mario is right or not) might be due to intuition of the solution in the case of activation of the figural and conceptual articulation in the case of the rectangle. In the other cases, the students expect further calculations and choose the claim after further reasoning and work on the figure, looking for additional data or trying to infer further properties of other figures like the right-angled triangle, or choose the option corresponding to the warrant W2 (the problem cannot be solved). Indeed, if the students expect data and calculations based on formulas, and do not find data enough in the text to use the formulas they have in mind, they might consider the problem impossible to solve, and do not search for other strategies. We expect the students who choose the warrants recalling the Pythagoras theorem to be the ones more influenced by previous practices (measuring, calculating) and the analogy with other geometric problem-solving strategies they are more accustomed to.
6.5. Results and discussion
The data collected satisfied the conditions of the methodology validated in Bolondi et al. (2018), through the application of the Spearman-Brown formula. All the research data are available in a repository (Giberti, 2021). The results in terms of item difficulty based on test equating procedure, performed considering the CT plus our item (Table 1) highlight that item versions V1 and V2 are easier than versions V3 and V4. More precisely, considering a confidence level of 95% (α = 0.05), we observe a statistically significant difference between item difficulty parameters comparing V1 vs. V4 and V2 vs. V3 and V4.
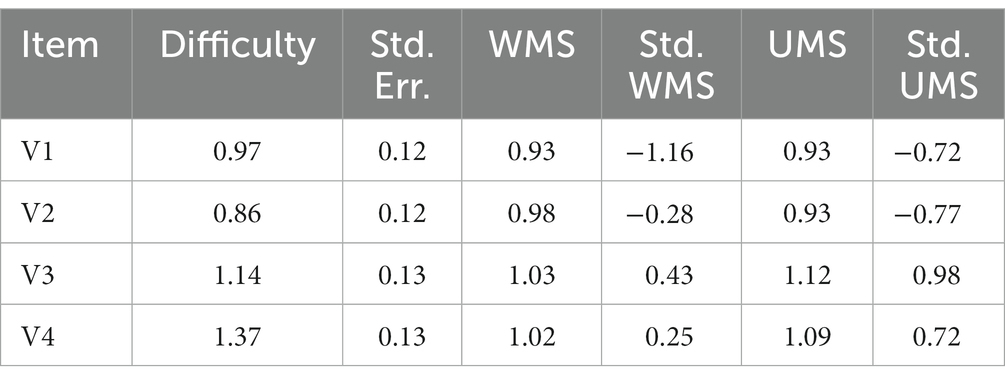
Table 1. Results of test equating, considering the core test CT and item D10.
The difficulty parameter increases with the syntactic complexity. We underline that the difficulty parameter for the 4 versions is measured on the same Rasch scale, centerd on 0. In the following graphs “theta” is the “ability” of the student, i.e., the construct measured by the Core-Test (Table 1 Figure 8).
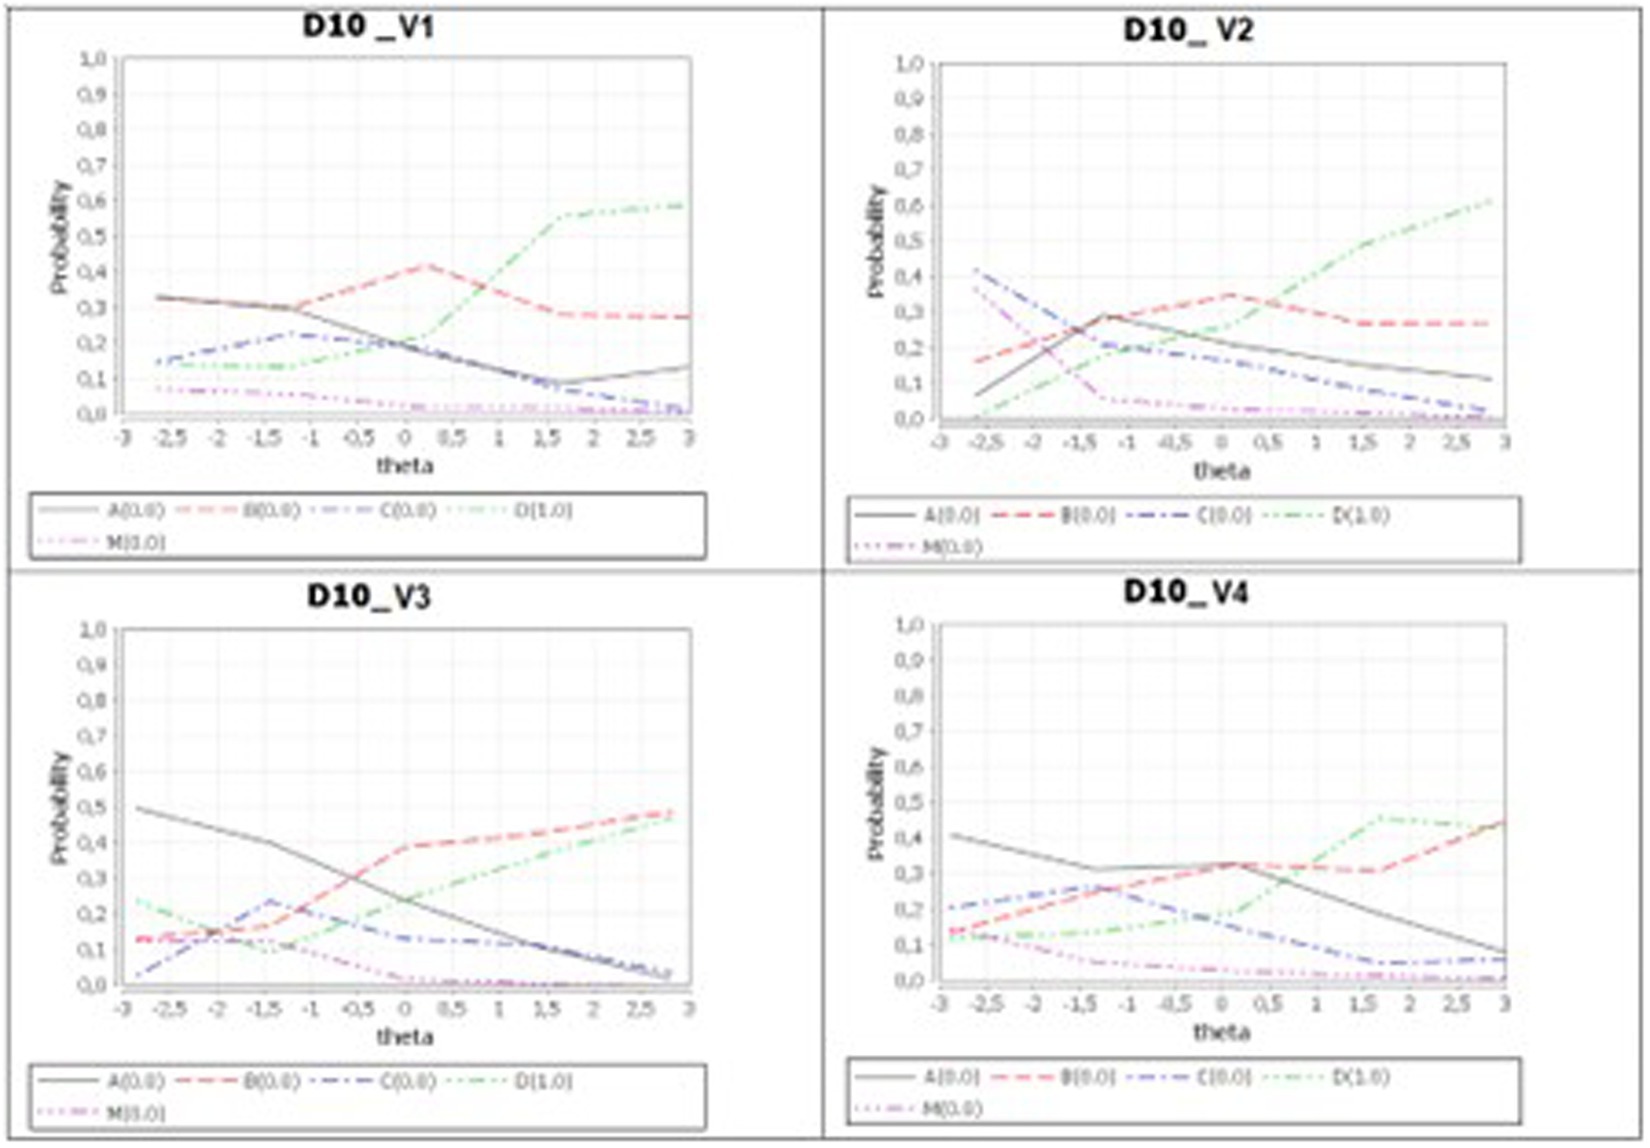
Figure 8. Distractor plots for the Vs.
In V3 and V4 the increased linguistic complexity seems to lead more students to a wrong choice. In particular, a large number of students chose distractor A, hence warrant W1. This might be interpreted referring to the conceptions of geometrical figures in the microspace developed in previous school practice – and this suggested an aspect of students’ reasoning to explore in the qualitative part of the study (Step 2). Figure 8 shows that V1 discriminates better than the other versions. This fact is important, from the psychometric point of view but also from teachers’ perspective.
V4 shows an unexpected behavior, with a slight decrease in the number of correct answers in the highest ability part of the sample. In the case of V2 version, very few students with low ability chose distractor A. This distractor becomes much more attractive for students facing V3 or V4. There are different behaviors in the four versions for distractor B: it has a “humped performance” trend (Ferretti et al., 2018) in V1 and V2 and an increasing trend (even for high-level students) in V3 and V4. Students with different achievements in the test are thus globally affected in different ways by the linguistic variations, as already observed by Bolondi et al. (2018).
Indeed, this quantitative evidence needs interpretation and a process of careful investigation of the students’ reasoning in tackling the task, reading the text and looking at the figure. It seems true that some variables in the formulation of the task might influence the students’ approach, causing undecided students to move in one direction rather than another.
However, we have no clear evidence of a correlation between the complexity of the formulation of the text (according to the criteria we selected) and the students’ choice of a claim+warrant that we can label as a geometrical argumentation based on conceptual and figural. The only information we have is that in two cases the number of answers that can be considered as belonging to that typology increased. The dynamics of choice of path to follow when answering such a question looks complex, and the formulation of the task is just one of the multiple factors involved.
Looking at the students’ choices of distractors, some of our a priori qualitative hypotheses are supported by the quantitative data, considering the high number of students who selected one of the distractors. In particular, the proximity of V4 to the usual formulation of problems in Italian schools and the activation on strategies mentioning the Pythagorean theorem appeared as relevant elements.
Such preliminary observations of the quantitative data shaped the design of our Step 2.
7. Step 2: qualitative investigation on students’ reasoning and search for recurrent approaches
This step is a qualitative analysis of the students’ strategies in geometrical argumentative tasks and the reflection reasoning. We want to collect evidence on what led them to decide how to use information in the text and in the figure and articulate them, and what is (or is not) a good strategy to face such a task. We focused on the activation of the “argumentative mood” and on fruitful figural/conceptual dynamics. In the spirit of our mixed-method approach, we carried out a qualitative study in order to explore some students’ reasoning and check if the interpretative hypotheses formulated by relying on the quantitative analysis and framework were confirmed by such reasoning. The logic we followed was to provide some “existence proofs” (Schoenfeld, 2000) of the hypothesized reasonings. We explored these issues with a two-phases approach: first via a reflection questionnaire, and then via paired interviews.
7.1. Task
We focused on two versions of the test designed for step. We chose the two versions which resulted more distant both in terms of item formulation and quantitative (i.e., the difficulty proved by test equating) results: V2 and V4. In these two cases, which quantitatively showed different trends on comparable populations of students, there are quite different syntactic structures.
7.2. Population
The population chosen for this step was a grade 9 class (24 students) of “Liceo Scientifico,” i.e., High School with scientific-focused curriculum, in the first month of the school year. Hence, we assumed that the implemented curriculum for this class was comparable with that of the students involved in the previous steps. We decided to select students from the same class to fix the variable of the teacher’s approach, thus normalizing at most the students’ conceptions of geometrical figures and habits of approach to geometrical problem solving. The class was selected among others after interview with the teachers, to verify how this target individuated by the (intended) National Curriculum was actually considered in their implemented classroom curriculum.
7.3. Methodology
We administered a written test in the form [CT + a version among V2 and V4 of the item]. Then we asked the students to answer a written questionnaire, focused on the task object of our study, with open questions for guiding a self-reflection on their interaction with the text and figure, and the role of linguistic and figural aspects in their choice of answer (Table 2).
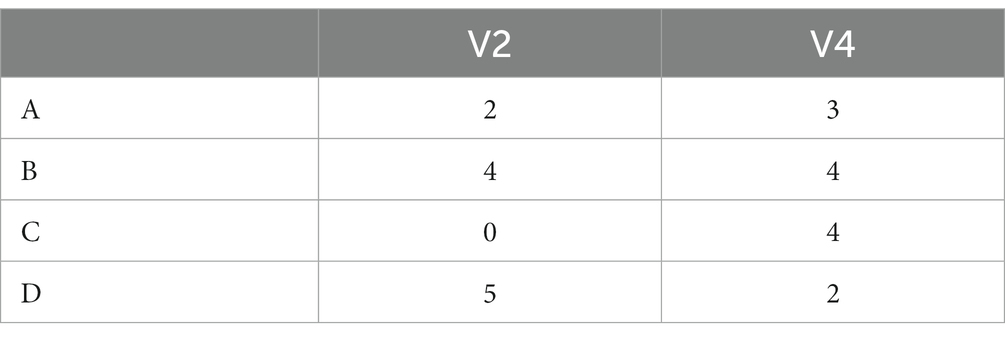
Table 2. Overview of students’ choices.
We selected 14 students out of the 24 who answered the questionnaire, looking at those providing non-trivial remarks, forming pairs of students who had chosen different options. We carried out a semi-structured interview asking the students to discuss in pairs and compare their answers to the item and the reflection questionnaire. This methodology was explored by Wilson et al. (2016). We asked to discuss and find some common ground, while comparing their different approaches. The interviews were recorded, transcribed, and analyzed with our framework. We conducted a detailed analysis of the students’ guided reconstructions of their reasoning and interviews to explore the mutual interaction between the students’ approach and the use of information in the text and in the figure. We also searched for explicit argumentative steps in their reasoning. Original protocols, with the complete transcript of interviews, are collected in a repository (Giberti, 2021).
7.4. Global analysis of the test and the reflection questionnaire and discussion of the main results
Looking at the 24 students who answered the test, we observed some differences.
Five students out of eleven chose D with version V2, while only 2 out of 13 chose it with version V4; the greatest difference concerns the choice of option C. These results did not disconfirm (for this group of students) the trend observed quantitatively. Even though we do not give any statistical meaning to them, they encouraged us to explore the students’ reasonings, looking for explicit evidence of differences between students who had different versions or some patterns that could help us to interpret qualitatively the impact of the formulation that emerged from the quantitative analysis.
Immediately after the test, we proposed the reflection questionnaire about their strategy and their use of the text and figure. This methodology was effective for collecting information about the students’ approaches to the problem. All 24 students answered the questions and were able to explain their reasoning, showing awareness of their choices and not guessing, as could happen with close questions. Moreover, the students showed in many cases their beliefs about the use of text and figures and the effective strategies that influenced them in their choices.
Our data do not allow us to identify a neat linear causality between the syntactic complexity and the students’ inclination to use the text significantly in their solutions. However, we can make some comments by looking globally at the students’ answers to the reflection questionnaire and interviews and looking for significant phenomena that shed some light onto the complex issue of understanding the relationship interplay between text and figure, the students’ attitude towards procedural and argumentative answers, and other factors.
Our global analysis showed that many factors were mentioned by the students as factors that influenced their reasoning that can be read with the categories of our framework. Four aspects were evidenced within this perspective:
1. Linguistic issues.
2. Sentential/graphical interaction and different students’ approaches while managing sentential and graphical information in problem solving.
3. Spatiographical-theoretical elaboration of information presented by means of diagrams.
4. Conceptions of figures and their impact on students’ interpretation of the task and use of text and diagrams and set of controls.
7.5. Linguistic choices
Looking at the consideration about linguistic aspects outlined by the students, we collected some recurrent open answers that we grouped for similarity.
Some students declared that the text was helpful:
- was clear (14 students; 8 V2, 6 V4).
- was necessary, guided them (5 students; all V2).
while other students did not consider the description expressed in sentential form useful:
- did not help them to understand better the solution to the problem or the figure (6 students; 2 V2, 4 V4).
- included useless conceptual information, like “center is C,” ABCD is a rectangle, … (10 students, 9 of them did not choose D, equally distributed among A, B, and C (3 each); 4 V2, 6 V4).
- was the container of numerical data (10 students; 4 V2, 6 V4).
- was misleading (2 students; 1 V2, 1 V4).
The version of the text assigned to the students, which quantitatively seemed to influence them in the previous step, did not emerge clearly among this small group of students as a variable leading them, in a clear and recognizable way, to prefer option D in the case of V2 and less in the case of V4 (even though the number of students who chose D was greater, in proportion, with V2). The only information in this direction is that 5 students with V2 declared that the text guided their reasoning, whilst no student with V4 declared the same. However, we can make some observations about the differences between the students’ behavior relying on the comments they made about the usefulness of the text, as we will show in the next section.
7.6. Sentential and graphical information and use of information in the text
The same information was considered useless by some students, and necessary and helpful by others. It is interesting that in most cases this information concerns conceptual aspects (C is the center, ABCD is a rectangle). “C as center” is a particularly interesting case. It was mentioned as fundamental information by most students who chose option D, while it was explicitly said to be confusing (1) and useless (6) by students who ignored the relationship between the diagonal of the rectangle and the radius of the circumference. These students preferred a more operational approach (A or C) and reflected on the right-angled triangle, not considering the conceptual information retrievable from the text that could attract them towards option D. One factor that influenced the students’ approaches to the text reading was the presence of the figure, as we expected. Some students remained only linked to the text and some students ignored the text completely, relying only on the figure. These are opposite and extreme behaviors occurred in a few cases. In most cases the students tried to merge information coming from text and figure.
7.7. Spatiographical-theoretical elaboration of information presented by means of diagrams
As a general trend, most students recognized to the figure a role in showing aspects that could not be inferred only by the sentential expression of properties; this confirms the awareness of what Fischbein (1993) stressed about the necessity of a figural part of geometrical concepts in problem solving and argumentative tasks, and the need for many students to use graphical representation to recognize properties emerging in the construction. In particular some students focused on the right triangles obtained dividing the rectangle with its diagonals or realized that A was on the circumference thus it could be an extreme of a segment that became a radius.
Some students searched for conceptual properties that could be visualized, relying then on theoretical properties after recognizing the object; other students carried out a completely figural reasoning relying only on the evident and immediate features of the figure, but still referring to properties of the objects or theoretical relations and not introducing issues linked to measurements; other students searched for measurements and tried to infer or approximate the lengths of segments; finally, some students looked at the figure as a source of numerical values to use in formulas, to carry out calculations.
In three cases, students referred not only to theoretical properties but often to features that were accidental; as Laborde (2005) stressed, some spatiographical information has been used as necessary while they were only features of the specific diagram. This is the case of students who saw similar lengths of the edges and assumed that the rectangle was a square or approximated the measurements in the diagram to obtain data to put in the formulas. Moreover, the students saw in the figure different objects: sometimes the fact that the figure was a rectangle was considered useless in the text, since they focused on the right angle triangles so they did not understand why the text reported the information that is was a rectangle. Other students considered useless that C was the center of the circumference since they did not focus on the segment as a ray. In these cases, the text did not guide the students’ exploration since it conflicted with their expectations or habits.
Some students perceived a conflict between information expressed in sentential and graphical ways and had to struggle and to decide how to manage it and to what to give a priority. One student declared that she started from the figure, being attracted by the rectangle “lying” on an edge, since the figure stresses that element, and declared to ignore the text and use it as a container of numerical data (“I used the only measurement given by the text, i.e., 4”). Other students – mainly those who used the spatiographical accidental features of the diagram as necessary – stated that they had ignored the text since there was an inconsistency between the figure drawn (a square, according to their perception) and the text (a rectangle).
7.8. Conceptions
An interesting observation concerns the differences in the use of the figure between students who chose option D and other students. All the students who chose option D used the conceptual information in the text in some way, even in the case of students who declared they used mainly the figure in their lines of reasoning.
As we expected, the students’ previous experience and habits were mentioned by the students as factors influencing their choices. In some cases, the students’ use of the text in the process of problem-solving was explicitly declared to be compromised by experiences of misunderstanding of the text, which had led the student to make a wrong choice in the past. An example is the following: It was easier for me to look at the figure. In fact, I personally prefer problems where there are images, and even more those where there are also written data and measurements on the figure. This is because the text can also say strange things. For example, there was a maths test in middle school, in which they had used a term that was not normal, that I did not understand, and this got me very confused. In fact, I eventually changed my answer, which had been the right one, simply because of having read the text and seeing this strange word.
8. Case studies and examples of recurrent approaches
Since the overview of qualitative data collected showed a heterogeneity of students’ strategies, reasonings, and approaches, we investigated the data through case studies to figure out some patterns of approaches to the problem reported by the students themselves, with a particular attention to the attention paid to the text, to what elements in particular, and to the role of the information in the text in the whole reasoning. These results help to reflect on the features of the formulation that could have led the student to consider or not some data, or some geometrical properties.
Relying on the framework, we combined the lenses in order to see the intertwining between the actions on the figure, use of the text, argumentative reasoning and use of sentential information and the students’ facets of geometrical objects that were included in their conception of figures in the microspace (graphical, conceptual/theoretical, numerical/measurements). Each reference to one of the entries of Table 3 was labeled. We outlined with a coloring technique how these students referred to the elements of the formulation of the task.
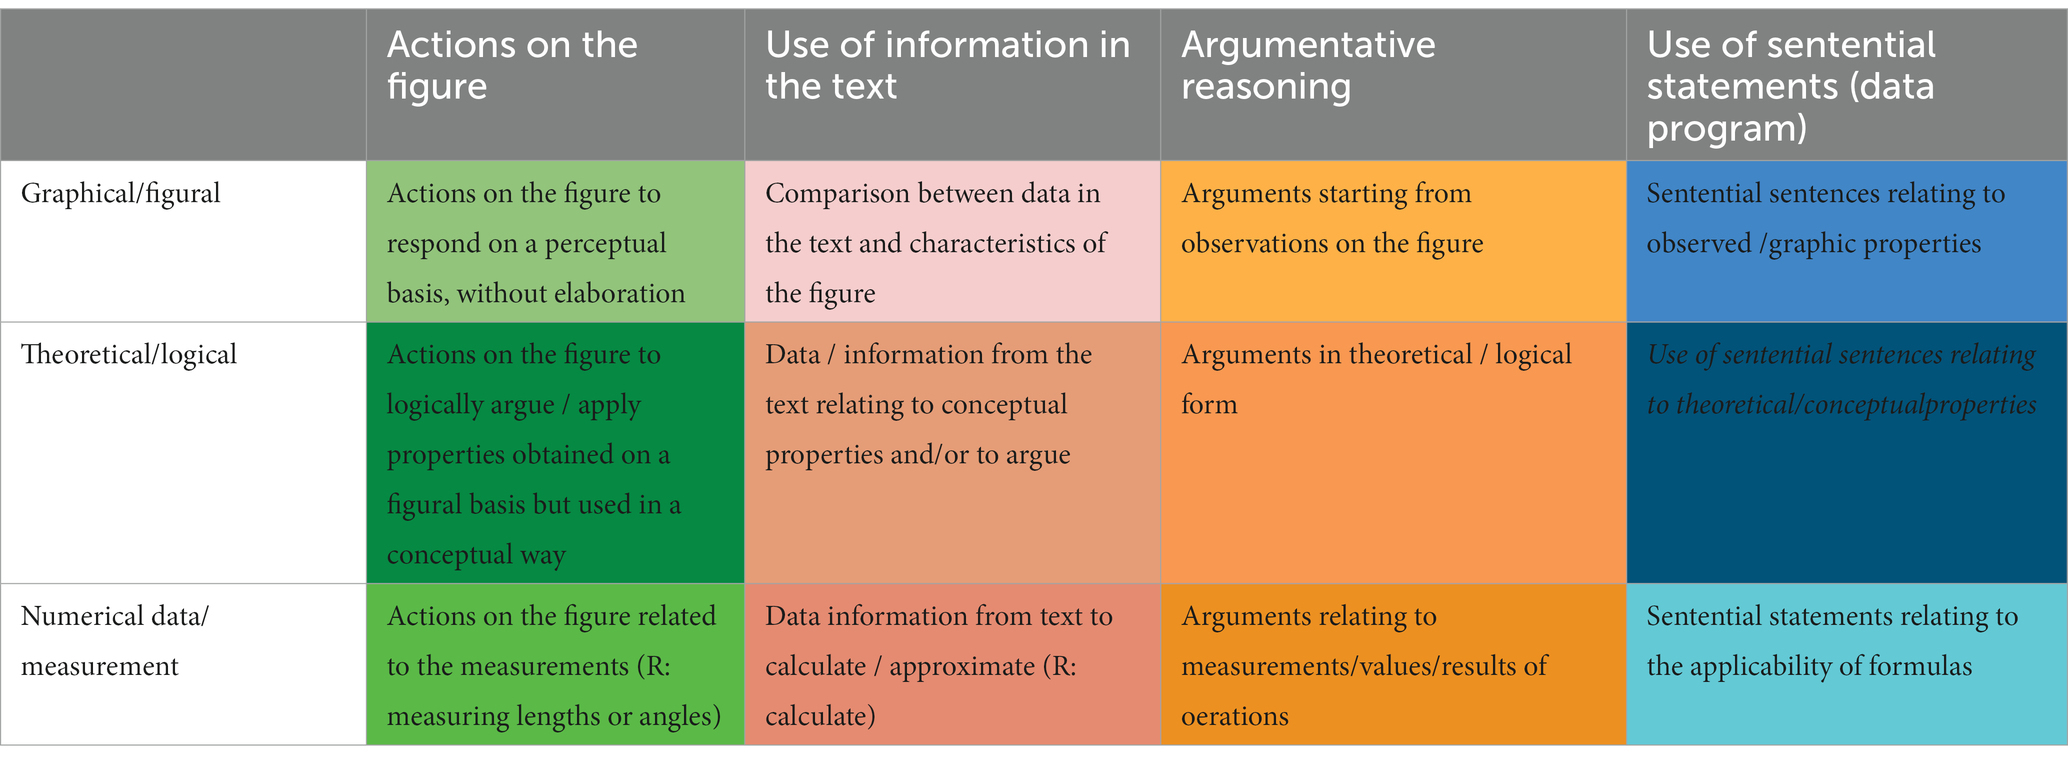
Table 3. Labeling of students’ actions.
We grouped students who made similar choices in order to exhibit existence proofs of different approaches and show the complexity of interplay between the use of figures and text and the choice of a strategy (more operational/computational or theoretical/argumentative). We made a distinction in particular between those who opted for the theoretical/argumentative (1) answer and the others (2-3-4). Finally, we triangulated the results using the interviews in pairs and checking whether the students’ reflections and strategies expressed in the questionnaire were confirmed by the same students in discussions with a peer and an interviewer.
We identified four main macro approaches; in cases in which there were significant differences inside the same macro approach, we showed more than one exemplary case. We comment briefly on the cases we identified to highlight some patterns and interesting features.
From now on we will refer to Qx as the following questions (asked in the questionnaire or in the interviews).
Q1. Read again the item D10 and describe your line of reasoning. Please try to recall and report both your mathematical reasoning and your solving strategy (What was your starting point? Did you read the answer options, and then did you identify the correct answer by ruling out the other options? Or did you make a “direct” argument?)
Q2. Which words, expressions, or sentences in the text were critical in reflecting on the problem and giving your answer?
Q3. Did you find ambiguous/misleading words in the text? Which ones? Why did you find them misleading?
Q4. Did you overlook some words or expressions because, in your opinion, they were not useful to solve the item? If so, please tell us which ones and why you think that they were not useful.
Q5. Did you use parts of the figure to solve the item? If so, which ones? Why?
Q6. Did you modify the figure? If so, please tell us what you modified.
Q7. Did the text help you to interpret the figure? If so, how? Which words helped you more?
Q8. Did the figure help you to interpret the text?
Q9. Did the text channel your reasoning? If so, how? Which words guided your line of reasoning?
8.1. Students who chose the option with a conceptual warrant (D) following an argumentative logically controlled structure of reasoning, who carried Out reasoning mainly based on the figure: S1 (V2, middle level); S2 (V2, high level)
In this first case we find students who chose the option with a conceptual warrant (D) following an argumentative logically controlled structure of reasoning, who carried out reasoning mainly based on the figure Both were assigned V2. They value the conceptual information about the circumference in the text. Some distinction can be drawn among them.
S1 reported argumentative steps referring mainly to observations of the figure, never mentioning theoretical properties even when the sentences referred to the conceptual aspects.
Q1. In answering item D10, firstly I noted that equals 4 cm because it is the radius. Then, I noted that the diagonal lines in the rectangle are congruent because the right rectangle with hypotenuse equals the right rectangular with hypotenuse .
Q2. C is the center of the circle. Its radius is 4 cm and CABD is a rectangle.
Q4. At the beginning, I did not consider the fact that C was the center because it did not seem important. Then, I realized that it was.
Q5. Above all, I considered that B was a point of the circumference and, then, I concluded that was 4 cm.
Q6. I did not need to modify the figure.
Q7: [The text helped me because I found]* that C is the center and the radius is 4 cm.
[*Text added to make sense of the student’s answer].
Q8. Absolutely yes, it did. Without the figure, one cannot understand that B is a point of the circumference.
S2 recalls definitions and theorems theoretically, using them explicitly in the argumentation as a geometrical backing.
Q1. I did not read the answer options. I preferred to try to make a direct argument. Since the radius is 4 cm, then is 4 cm (a radius is the segment that starts from the center and finishes on a point on the circumference). is also a diagonal line in the rectangle CABC. Since the diagonal lines in a rectangle are congruent, then is 4 cm.
Q2. C is the center of the circle.
The radius is 4 cm.
CABD is a rectangle.
Q4. I used all the data in the text but I based my reasoning more on the figure than on the text.
8.2. Student who uses the figure exploiting mainly the figural/spatio-graphical aspects (figure as a diagram), not considering theoretical geometrical properties and not argumenting: S3 (V4, low level)
In this typology we find students who use the figure exploiting mainly the figural/spatio-graphical aspects (figure as a diagram), not considering theoretical geometrical properties and not argumenting (S3). The main difference between S3 and S1, who refers to elements of the figure, is that he disregards important conceptual information in the text; in particular “ABCD is a rectangle” was considered useless, the circumference was not mentioned, and he only considers the measurements of the radius. The student seemed to work on the figure only graphically, and he said that he could have understood the text without the figure. The information is not integrated and the text is used as a container of numerical information. This is consistent with the choice of the option C (he refers to calculations, even if he did not perform them).
S3 was assigned V4; the high syntactic complexity might have contributed to disregarding information in the text.
Q1. To be honest, I just glanced at the figure: I tried to represent the straight line AD on the radius of the circumference and it seemed to me the same. Therefore, in my opinion, it was C.
At the beginning, I marked option A but, when I realized that the text contained a critical measurement, I changed my mind and I marked option “C”.
Q2. The fact that the radius is 4 cm.
Q3. No, I did not.
Q4. The fact that CABD was a rectangle: it is useless.
Q5. As I said, the segment AD was the key element of my line of reasoning.
Q6. I moved the straight line AD onto the radius of the circumference.
Q8. Absolutely yes, it did. But, I do not deny that I would have understood the text even without it [even without the figure]*.
Q9: [The text helped me]* by providing very useful data.
[*Text added to make sense of the student’s answer].
8.3. Students who chose an option mentioning calculation and Pythagoras theorem and followed a procedural/computational approach consistent with the conception of figures as descriptions in the microspace (measurements, formulas, calculation): S4 (V4, low level)
Q1. At the beginning, I tried to understand the text and I did some calculations. I calculated that the side was 2 but, on second thought, I realized that I was wrong.
AD should be , i.e., 4, but I did not find 2 numbers that, squared, equalled 16. Now, I think that I could have used the Pythagorean theorem but the result is different.
Q2. First of all, the measurements.
Q5. Yes, I did. I tried to use the hypotenuse and I looked for reasonable numbers for both sides.
Q8. Yes, it did. But it did not help me to find the correct answer.
Q9. This text did not help me a lot, especially the section about “equal measures.” That part confused me a lot.
S5 (V4, low level).
Q1. I marked option “C” for item D10 that I encountered on Friday: “The length of AD can be calculated by using the Pythagorean theorem and the result is 4.” To calculate AD, I thought that the length of AC approximated 3.5 cm and the side DC approximated 3.5. Then, I applied the Pythagorean theorem and I found that it was around 4 cm, as the radius of the circumference, and, most likely, since I was not clear about the correct answer, I just ruled out some options.
Q5. I used the side AC and AD (and measured them), in the attempt to find an answer to this question.
Q6. To be honest, before trying to apply the Pythagorean theorem, I moved the triangle so that the hypotenuse overlapped the radius. Then, I noticed that they were similar to each other.
Q7. The text helped me by giving me the length of AD in cm. Then, I tried to understand if Mario was right.
Q8. The information in the text overlapped that provided by the figure. They say pretty much the same thing.
This typology individuates students who chose an option mentioning calculation and Pythagoras theorem and followed a procedural/computational approach consistent with the conception of figures as descriptions in the microspace (measurements, formulas, calculation). We detect among them two sub-typologies.
S4 is an example of student who tries to guess the missing length of the edges in a particular configuration (exploiting in some cases also the fact that the rectangle “seemed” to be a square) to put in the Pythagorean formula in order to check whether they found a couple of numbers that led to 4 as length of the hypotenuse or not, using the text as a container of numerical data and ignoring the conceptual aspects.
S5 is an example of student who tries to guess the missing length of the edges in a particular configuration (exploiting in some cases also the fact that the rectangle “seemed” a square) in order to compute the length of the hypotenuse using a formula and check whether it could be approximated to 4 or not, using the text as a container of numerical data and ignoring the conceptual aspects. He considers the text and the figure equivalent, not sources of information to integrate.
The main difference is the strategy (arithmetical or modeling approach). The text is in one case misleading, in the other considered equivalent. Maybe the answer is related to their goals: in the modeling approach all the work is on the figure, while in the arithmetic approach it is relevant.
In both cases, the high syntactic complexity might have contributed to ignoring conceptual information in the text and searching for a strategy where they could exploit the figure only.
8.4. Students focusing only on data in the text, who chose The option “not enough data”: S6 (S1, middle level); S7 (V4, high level); S8 (V4, middle level)
This typology includes students who focus only on data in the text, and who chose the option “Not enough data.” Two kind of behavior can be observed.
S6 did not find numerical data in the text, so she looked for information in the figure, without finding a solution.
Q1. I looked at the data reported in the text. Looking at the figure, I realized that some data were missing whereas some other data were useless. Therefore, I marked option B.
Q5. Yes, I did. [I used]* the length of and . [Looking at the figure]* one can realize that they are smaller than the radius.
[*Text added to make sense of the student’s answer].
Q6. Yes, I did. I used 2 triangles that allowed me to use the Pythagorean theorem.
Q8. No, it did not.
Q9. Yes, it did. In particular, the following data: AD = 4 cm and radius = 4 cm.
S7 abandoned immediately and selected the option.
Q1. My reasoning was: firstly, I tried to use the Pythagorean theorem, but I did not know the lengths of the sides. I looked at the radius but it was not useful. Therefore, I concluded that [Mario]* was wrong because we do not have enough data.
[*Text added to make sense of the student’s answer].
Q2. The length of the radius and the absence of other data.
In this case, the highest syntactic complexity might have contributed to abandoning suddenly the solution without carrying out further reasoning. We interviewed these students in pairs, but the interview did not clarify this point.
The last typology (S8) includes students for whom the linguistic formulation hides the argumentative structure; they identify “not enough data” with “there is not a strict connection between data and conclusions.” The high syntactic complexity might have contributed to confusion between the data and the conclusion.
Q1. At the beginning, I could not understand what Mario meant. His hypotheses seemed weak to me. Therefore, I marked option B.
Now, I have realized that his hypothesis was that AD was 4 cm. Now, I have realized that the diagonal lines in a rectangle overlap each other and therefore I think that the correct answer to item D10 is ‘D’.
Q9. What Mario said was not clear. At the beginning, I messed up data and hypotheses. I thought his hypotheses were based on nothing. Then, I was helped by the “given that…” [in the text]*.
[*Text added to make sense of the student’s answer].
9. Conclusions and further issues
In this paper, we tackle two research questions. The first regards the existence of quantitative evidence of a relationship between the syntactic formulation of the task and students’ answers in a geometrical word problem provided with a figure, while the second concerns the investigation and interpretation of such results.
A first interesting quantitative phenomenon, that is not considered by our research questions but confirmed the relevance of our study, is the following: even if the figure is explicitly stated to be a rectangle in the text and the correct warrant is proposed, the percentage of students choosing the correct warrant is low. This result confirms the difficulties of students at this stage of learning to process sentential information and integrate them with the diagrammatic one and the fact that the adoption of a conceptual/argumentative approach is still an ongoing process for most students.
Once observed this general trend, we report answers to our research questions.
9.1. Answer to question 1
The answer to research question 1 is affirmative: we observed statistically significant differences between the distributions of students’ choice of the four options in case of different syntactic formulations of the task. The trend goes in the following direction: increasing the linguistic complexity →increasing the difficulty of the task (i.e., reduction of correct answers). Syntactic complexity makes an already intrinsically difficult job even harder.
9.2. Answer to question 2
The second is about the possibility of identifying, and qualitatively interpreting, students’ reasonings with tools of our framework. Our analysis showed that the students’ reasonings and strategies cannot be easily and linearly connected to the formulation.
We identified patterns of approach to this problem considering our variables (the text, the conception of the figure, in particular the representation, the operations and the controls, the argumentative process). We observed a variety of approaches ranging from a completely operational one, with reasoning based on calculations, to an argumentative one, with reasoning carried on using the properties of entities seen as figural concepts. The analysis did not show the syntactic features of the text as decisive variables themselves (no formulation was associated with a specific pattern), but it opened up hypotheses about the relationship established by students between the elements of the text and their conceptions of figures, and about the integration of sentential information and diagrams in geometrical word problem solving at the beginning of high school.
As a general trend, we observed that in many cases both the text and the figures interplay dynamically with students’ reasoning and that, for most of the students involved in the study, “grasping the rectangle” as a figural concept is more a target than a starting point. As Fischbein states, “images and concepts interact in the cognitive activity of a person (a child or an adult) cooperating sometimes or conflicting in other situations.”
The syntactic formulation of the text, thus the relationships established between different elements of the argumentation in the text, seems to have an impact on students’ approaches, combined with other conditions. Even if this is not statistically significant, the students who ignored important conceptual information in the text were in most cases assigned V4, the most complex from the syntactical point of view, and with low achievements. However, also students with middle and high achievements assigned V4 did not select the correct answer and all answered B. In these cases, it seems that the formulation might have influenced their reasoning in a significant way, even if not visible in our data.
With our methodology we identify some possible trajectories in the students’ reasonings.
Previous conceptions of geometric figures appeared as important elements in this process, since the students referred explicitly to previous practices. Such conceptions were activated by students who abandoned or never entered the argumentative reasoning, sometimes because of difficulties in following the text flow of information or understanding the request, and somehow started solving a different problem where the conception of figures was a modeling one (measure and find out a numerical approximated solution). Indeed, in some cases the conflict between information inferred from the text and from the diagram led the students to abandon the text reading, trusting only the picture and interacting with it according to an operational conception (measuring, attention to incidental features of the picture mentioned by Laborde (2005), searching for data).
These qualitative results are an interesting starting point for further investigations about the complex phenomena that underlie geometrical problem solving with word problems and figures in the microspace at the transition between middle and high school. It is possible that eye-tracker analysis of the student’s reading phase could help to integrate such data by looking at the starting point of a student’s reading and to see whether and how the key elements of the text and of the figure are looked at, or not.
Data availability statement
The raw data supporting the conclusions of this article will be made available by the authors, without undue reservation.
Ethics statement
Ethical approval was not required for the study involving human samples in accordance with the local legislation and institutional requirements because of the nature of the study. Written informed consent for participation in this study was provided by the participants’ legal guardians/next of kin.
Author contributions
GB supervised the research and, along with LB and CG, acted as principal investigator, collected qualitative data, and wrote the manuscript. CC participated in the tests’ construction, developed the methodological strategy employed to equate and analyze students’ answer and served as reviewer of the manuscript. All authors contributed to the article and approved the submitted version.
Funding
This work was supported by the Open Access Publishing Fund of the Free University of Bozen-Bolzano. Step 1 of the work has been funded by INVALSI, under the project “Variazioni 2”.
Acknowledgments
The authors thank teachers who participated in the experiments.
Conflict of interest
The authors declare that the research was conducted in the absence of any commercial or financial relationships that could be construed as a potential conflict of interest.
Publisher’s note
All claims expressed in this article are solely those of the authors and do not necessarily represent those of their affiliated organizations, or those of the publisher, the editors and the reviewers. Any product that may be evaluated in this article, or claim that may be made by its manufacturer, is not guaranteed or endorsed by the publisher.
References
Andrich, D., and Marais, I. (2019). A course in Rasch measurement theory: Measuring in the educational, social and health sciences. Singapore: Springer Nature Singapore Pte Ltd.
Balacheff, N. (2010). “Bridging knowing and proving in mathematics. An essay from a didactical perspective” in Explanation and proof in mathematics. eds. G. Hanna, H. N. Jahnke, and H. Pulte (Heidelberg, Germany: Springer), 115–135.
Balacheff, N., and Gaudin, N. (2010). Modeling students' conceptions: the case of function. Res. Math. Educ. 16, 183–211. doi: 10.1090/cbmath/016/0
Boero, P., Douek, N., Morselli, F., and Pedemonte, B. (2010). “Argumentation and proof: a contribution to theoretical perspectives and their classroom implementation” in Proceedings of the 34th conference of the International Group for the Psychology of mathematics education. eds. M. M. F. Pinto and T. F. Kawasaki, vol. 1 (Belo Horizonte: PME), 179–204.
Bolondi, G., Branchetti, L., and Giberti, C. (2018). A quantitative methodology for analyzing the impact of the formulation of a mathematical item on students learning assessment. Stud. Educ. Eval. 58, 37–50. c
Bolondi, G., and Ferretti, F. (2021). Quantifying solid findings in mathematics education: loss of meaning for algebraic symbols. Int. J. Innov. Sci. Math. Educ. 29, 1–15. doi: 10.30722/IJISME.29.01.001
Chazan, D. (1993). High school geometry students' justification for their views of empirical evidence and mathematical proof. Educ. Stud. Math. 24, 359–387. doi: 10.1007/BF01273371
Creswell, J. W., and Plano Clark, V. L. (2017). Designing and conducting mixed methods research (3rd). London, UK: Sage.
Daroczy, G., Wolska, M., Meurers, W. D., and Nuerk, H. C. (2015). Word problems: a review of linguistic and numerical factors contributing to their difficulty. Front. Psychol. 6:348. doi: 10.3389/fpsyg.2015.00348
Durand-Guerrier, V., Boero, P., Douek, N., Epp, S. S., and Tanguay, D. (2011). Argumentation and proof in the mathematics classroom. In G. Hanna and M. Villiersde (Eds.), Proof and proving in mathematics education. New ICMI study series 15. Dordrecht, The Netherlands: Springer.
Duval, R. (1991). “Interaction des différents niveaux de représentation dans la compréhension de textes” in Annales de Didactique et de sciences cognitives. ed. P. R. Richard (Strasbourg: Université de Strasbourg), 136–193.
Duval, R. (1995). Semiosis et pensée humaine: sémiotiques registres et apprentissages intellectuels. Berna: Peter Lang.
Ferrari, P. L. (2004). “Mathematical language and advanced mathematics learning” in Proceedings of the 28th conference of the International Group for the Psychology of mathematics education. eds. M. Johnsen Hoines and A. Berit Fuglestad (Bergen, Norway: PME), 383–390.
Ferretti, F., Giberti, C., and Lemmo, A. (2018). The didactic contract to interpret some statistical evidence in mathematics standardized assessment tests. EURASIA J. Math., Sci. Tech. Ed. 14, 2895–2906. doi: 10.29333/ejmste/90988
Fischbein, E. (1993). The theory of figural concepts. Educ. Stud. Math. 24, 139–162. doi: 10.1007/BF01273689
Fujita, T., Jones, K., and Kunimune, S. (2010). “Students’ geometrical constructions and proving activities: a case of cognitive unity?” in Proceedings of the 34th conference of the International Group for the Psychology of mathematics education. eds. M. M. F. Pinto and T. F. Kawasaki, vol. 3 (Belo Horizonte, Brazil: PME), 9–16.
Hambelton, R. K. (2000). Emergence of item response modeling in instrument development and data analysis. Med. Care 38, 60–65. doi: 10.1097/00005650-200009002-00009
Herbst, P., Fujita, T., Halverscheid, S., and Weiss, M. (2017). The learning and teaching of secondary school geometry: A modeling perspective. New York, USA: Routledge.
Impara, J. C., and Plake, B. S. (1998). Teachers' ability to estimate item difficulty: a test of the assumptions in the Angoff standard setting method. J. Educ. Meas. 35, 69–81. doi: 10.1111/j.1745-3984.1998.tb00528.x
Jabrayilov, R., Emons, W. H., and Sijtsma, K. (2016). Comparison of classical test theory and item response theory in individual change assessment. Appl. Psychol. Meas. 40, 559–572. doi: 10.1177/0146621616664046
Kolen, M. J., and Brennan, R. L. (2004). Test equating, scaling, and linking: Methods and practices (2nd ed.). New York, NY: Springer-Verlag.
Komatsu, K., Jones, K., Ikeda, T., and Narazaki, A. (2017). Proof validation and modification in secondary school geometry. J. Math. Behav. 47, 1–15. doi: 10.1016/j.jmathb.2017.05.002
Krummheuer, G. (1995). “The ethnography of argumentation” in The emergence of mathematical meaning: Interaction in classroom cultures. eds. P. Cobb and P. H. Bauersfeld (Hillsdale, NJ: Lawrence Erlbaum)
Laborde, C. (1995). Occorre apprendere a leggere e scrivere in matematica. La matematica e la sua didattica 9, 121–135.
Laborde, C. (2005). The hidden role of diagrams in students’ construction of meaning in geometry. In J. Kilpatrick, C. Hoyles, and O. Skovsmose, with P. Valero (Eds), Meaning in mathematics education (pp.159–179). New York: Springer.
Larkin, J., and Simon, H. (1987). Why a diagram is (sometimes) worth ten thousand words. Cogn. Sci. 11, 65–100. doi: 10.1111/j.1551-6708.1987.tb00863.x
MIUR (2012). Ministero dell’Istruzione, Università e Ricerca Indicazioni nazionali per il curricolo della scuola dell’infanzia e del primo ciclo di istruzione, MIUR: Roma.
Nesher, P. (1976). Three determinants of difficulty in verbal arithmetic problems. Educ. Stud. Math. 7, 369–388. doi: 10.1007/BF00452220
Novotná, J., and Chvál, M. (2018). Impact of order of data in word problems on division of a whole into unequal parts. J. Effic. Responsib. Educ. Sci. 11, 85–92. doi: 10.7160/eriesj.2018.110403
Prieler, J. A. (2007). So wrong for so long: changing our approach to change. Psychologist 20, 730–732.
Rasch, G. (1960). “Probabilistic models for some intelligence and attainment tests” in Copenhagen: Danmarks Paedagogiske Institut (Chicago: University of Chicago Press)
Reise, S. P., and Haviland, M. G. (2005). Item response theory and the measurement of clinical change. J. Pers. Assess. 84, 228–238. doi: 10.1207/s15327752jpa8403_02
Schoenfeld, A. H. (2000). Purposes and methods of research in mathematics education. Not. Am. Math. Soc. 47, 641–649.
Selden, A., and Selden, J. (2003). Validations of proofs considered as texts: can undergraduates tell whether an argument proves a theorem? J. Res. Math. Educ. 34, 4–36. doi: 10.2307/30034698
Selden, A., and Selden, J. (2015). “Validations of proofs as a type of reading and sense-making” in Proceedings of the 39th conference of PME. eds. K. Beswick, T. Muir, and J. Wells, vol. 4 (Hobart, Australia: PME), 145–152.
Stylianides, G., Stylianides, A., and Weber, K. (2017). Research on the teaching and learning of proof: Taking stock and moving forward. In Compendium for Research in Mathematics Education. ED. J. Cai, (National Council of Teachers of Mathematics), 237–266.
Wilson, A. D., Onwuegbuzie, A. J., and Manning, L. P. (2016). Using paired depth interviews to collect qualitative data. Qual. Rep. 21:1549. doi: 10.46743/2160-3715/2016.2166
Keywords: task formulation, figural concepts, argumentative processes, multilevel explanatory mixed methods, rectangle
Citation: Bolondi G, Branchetti L, Cascella C and Giberti C (2023) What does it mean to “grasp the rectangle”? Organization of linguistic formulation and activation of argumentative processes in geometrical problems. Front. Educ. 8:1250661. doi: 10.3389/feduc.2023.1250661
Edited by:
Lakshmi Narayan Mishra, VIT University, IndiaReviewed by:
Vijai Kumar Pathak, VSB College of Engineering Technical Campus Coimbatore, IndiaAllen Leung, Hong Kong Baptist University, Hong Kong SAR, China
Copyright © 2023 Bolondi, Branchetti, Cascella and Giberti. This is an open-access article distributed under the terms of the Creative Commons Attribution License (CC BY). The use, distribution or reproduction in other forums is permitted, provided the original author(s) and the copyright owner(s) are credited and that the original publication in this journal is cited, in accordance with accepted academic practice. No use, distribution or reproduction is permitted which does not comply with these terms.
*Correspondence: Giorgio Bolondi, giorgio.bolondi@unibz.it