 Riin Seema*
 Ene Varik-Maasik
- School of Educational Sciences, Tallinn University, Tallinn, Estonia
Students have been distance learning to a considerable extent during the Covid years and the primary concerns are teenagers’ learning difficulties, digital addiction and long screen time. Our aim was thus to study teenagers’ perceived learning difficulties, digital addiction and screen time. The current study was a part of a larger e-survey. The data were collected across Estonia from 8,486 teenagers who studied in the inclusive education system during spring 2022. The students were 11–20 years old. While analysing the data, we had to exclude the answers of 315 students. Those students had answered carelessly or inaccurately, had written an inaccurate age, illogical answers or similar answers throughout the test. We studied teenagers’ level of learning difficulties, digital addiction and screen time. The study shows positive correlations between learning difficulties, digital addiction and screen time. Digital addiction and screen time predict 11% of the variability of perceived learning difficulties scores based on a Linear Regression model. The model shows a poor prediction for students whose scores are very different from the mean. We describe the weaknesses of an e-survey method in inclusive education. Linear statistical models predict well for average students, but do not predict well for respondents who are very different from the mean. The so-called residuals need special attention or, paradoxically, exclusion from the statistical analysis. The outliers are often the students who need help in the inclusive system. Here, we will share our insights, what we have learned as researchers from conducting the study. We cannot collect reliable data about special needs students with any wide scale e-survey if we do not address the developmentally heterogeneous group of students and their needs while participating in the survey. This is significant for study reliability as well as gathering data from children with special needs.
Introduction
The data of this study were collected across Estonia at the beginning of 2022, when periodic distance learning still took place, depending on the Covid situation. Therefore, the context of Covid-induced distance learning and its impact on students and their environment is important to understand.
The outbreak of COVID-19 and the sudden change to distance learning can be regarded as an abnormal change in the environment which influenced the patterns of using digital devices (Zhang et al., 2022). The disrupted school years have been challenging for any educational system worldwide. It has caused learning gaps for students and had the worst impact on disadvantaged students (Dorn et al., 2021; ECEPAA, 2023).
The boundaries between home and schoolwork became blurred and it was impossible to study without using digital tools. Young people have described in their narratives that distance learning meant using different information and communication technologies (ICTs): e-school for schoolwork and grades, e-mails with teachers and classmates, homework performed as group work in Google Drive, or social media groups created for communication with the class and teachers. In addition, e-textbooks and workbooks were utilised, as well as educational videos available on the internet (Eickelmann et al., 2022).
The European Union funded the DigiGen project, which used participatory methodologies to understand how and why some children and young people take advantage of ICTs while others are negatively affected (Horizon, 2020). The study revealed that the resulting lack of face-to-face communication during distance learning became a demotivating factor for active participation in online learning sessions. According to the child, it also led to a feeling of being left behind in terms of learning. Some children and young people in Estonia, Germany, Greece and Norway reported that distance learning needs more self-regulation than in-class learning. Students experienced self-regulation challenges because of the distractions offered by digital devices, apps, social media platforms and games. Concerns were expressed in all participating countries regarding some children and young people having an even more difficult time learning and catching up during the phases of reorganisation of school learning than others (Eickelmann et al., 2021).
The Estonian Ministry of Education coordinated a study to understand the experiences of distance learning and its impact on the general education system from a teacher’s perspective. The study revealed that in inclusive education students cope with distance learning differently. There are students to whom the distance learning is easy, and students for whom it suits with help from caregivers and teachers, and there are other students for whom it does not suit at all. Due to learning difficulties that resulted from new learning patterns, children differed even more than before in terms of individual characteristics and the need for help in learning (Tammets et al., 2021).
Estonian teachers pointed out that the distance learning period was especially hard for students with insufficient learning competence. Difficulties in learning also led to a drop in motivation: schoolwork was often missed, and studies were not attended. During the distance learning period, the role of the home environment in learning came to the fore. Especially for students with special educational needs, along with school support, additional support at home is also very important. Unfortunately, some students did not get sufficient help from home in studying (Tammets et al., 2021).
Teachers are worried that excessive ITC use by students is a risk for young people becoming addicted to ICTs, since the digital era has impacted negatively on children’s social skills. There are indications that children and young people suffer from anxiety, learning difficulties and behavioural problems that might be related to a lost balance between the digital world and the real world. At the same time schools lack knowledge of how to deal with digital addiction (Eickelmann et al., 2022).
For the vast majority, ICT use is adaptive, but a subgroup of vulnerable individuals is at risk of developing problematic usage patterns. The pandemic not only accelerated people’s exposure to the Internet and digital media but also induced psychological problems, which, in return, increased the risks of increased digital addiction (Király et al., 2020). A longitudinal study and meta-analyses showed an increasing trend of digital addiction during the past two decades, which dramatically worsened during the COVID-19 pandemic. This study provided a comprehensive estimation of the global prevalence of multiple subtypes of digital addiction, which varied between regions, economic levels, genders, and assessment scales (Meng et al., 2022).
Digital addiction as an evolving problem
Teenagers interact with digital devices more and more, since new devices and software, learning and leisure environments and apps are being continuously developed (Seema et al., 2022). Web based tools provide students with access to a large amount of up-dated information, facilitate student autonomy, enable collaborative teamwork and promote flexible and interactive education (García-Martín and García-Sánchez, 2013). Young people feel comfortable with digital devices but also feel bad if they do not have internet connection (Gutiérrez Ángel et al., 2022).
In a digitally rich society digital addiction is a problem which is tricky to conceptualise and measure. However, the border between healthy and unhealthy or addictive use of digital devices seems to be at the point where the use of digital devices becomes all-encompassing and the overuse of digital devices disturbs important areas of life and the person’s health suffers (Seema et al., 2022).
Problematic use or addictive behaviour towards digital devices are not yet included as diagnosable mental health issues in any major diagnostic system in the Western countries. Conceptualisations of the phenomena are still inconsistent, but reaching a consensus on the definition of digital addiction would benefit future research (Almourad et al., 2020). Only addiction to gaming (Internet Gaming Disorder) is described in the American Diagnostic and Statistical Manual of Mental Disorders (DSM-5-TR) and World Health Organization has included gaming disorder in the 11th Revision of the International Classification of Diseases (ICD-11), as cited in Sherer (2023).
Karakose et al. (2022) have conducted a meta-analysis of hundreds of scientific articles, have used the term “digital addiction” as an umbrella term to refer to addiction to the Internet, social media, smartphones, digital devices, video games, or similar digital technologies. Another meta-analysis (Meng et al., 2022) used digital addiction to refer to the compulsive, prolonged, and uncontrollable use of any digital device or media with deleterious effects on the psychological or physical health of users. Since the variety of digital technologies is constantly increasing, handling all these types of addiction as a generalised pathology would help to develop a broader framework for the diagnosis, prevention, and treatment of digital addiction (Karakose et al., 2022).
Almourad et al. (2020) analysed the literature on behavioural addiction definitions in 1996–2018 toward information and communication technologies, finding a degree of consensus on core features of digital addiction encompassing the Internet, gaming and smartphone addiction. As digital addiction seems to be comorbid with other mental health problems, there is the question of whether the underlying problem really is an addiction, or if the behaviour would be better considered to be a symptom or coping mechanism for a separate mental health issue (Almourad et al., 2020).
A study with Chinese primary school students revealed that increased problematic use of Internet-related activities was associated with greater psychological distress (Chen et al., 2021). An Estonian study with secondary and high school students showed that the group of teenagers who had the highest digital addiction scores and used screens the longest had the highest learning difficulties and lowest learning motivation. At the same time the group of students with lowest digital addiction scores and who use digital devices less than other students, did not perceive learning difficulties and they had a high learning motivation (Seema et al., 2022).
Inclusive education in Estonia
The principle of inclusive education is laid down in the Basic Schools and Upper-Secondary Schools Act. According to the law, every child has the right to attend a school in their residential area or study in a mainstream school with an adapted curriculum and to receive different kinds of support (European Agency for Special Needs and Inclusive Education, 2018 p. 3).
In the Estonian inclusive education system, 95.4% of all students, including those with special educational needs, study in mainstream schools’ regular classes. At the same time only 2.5% of students learn in special needs classes in mainstream schools and 2.1% learn in special schools. Students with special educational needs who study in regular classes form 15.3% of all 6th-12th grade students. Special education students are assigned either general support, enhanced support, or special support (Estonian Ministry of Education and Research, 2022, September 7).
In Estonia, students are required to complete nine grades. Almost two thirds of primary school graduates choose a gymnasium for further education. General secondary education in gymnasiums takes place in grades 10–12. If a student’s disability or disorder requires a highly specialised organisation of studies or support services, he or she is provided the opportunity to study in a special group or attend a special school. However, parents can choose what suits their child better – a regular or special school (European Agency for Special Needs and Inclusive Education, 2018; Estonian Ministry of Education and Research, n.d., special educational needs).
If it becomes apparent that a student has special educational needs, the coordinator for specialised education initiates children’s educational and psychological research and additional supportive measures are implemented. If needed, the services of special education teachers, psychologists or social pedagogues are made available. The additional support measures for the child implemented by schools include differentiated instruction in the classroom or individual learning curriculum or special-pedagogical help and speech therapy sessions in study support groups after classes (Estonian Ministry of Education and Research, n.d., support measures).
The school teacher is usually alone in the classroom with all children in Estonian primary and secondary education. Special education teachers and other support specialists usually work with special needs children outside of the classroom. But not all students get help, since elementary schools lack special needs specialists (Kolnes and Konstabel, 2018). Schools lacked almost half of the required special education specialists, and the specialists were missing in both rural and urban schools. In a quarter of elementary schools support services are missing or not available to the required extent (National Audit, 2020).
Based on the Estonian Education Information System, the biggest groups of children with educational special needs were children with temporary or permanent learning difficulties, writing and reading difficulties, children with calculation problems and children with behavioural problems, along with children with activity and attention disorders. Children may have several educational needs at the same time (Estonian Ministry of Education and Research, 2022, September 7).
Students’ learning difficulties
Learning difficulties is, by its nature, a collective term that has been used widely and often without much precision (Westwood, 2007). The concept may include one or more specific difficulties, but may also include attention deficit and/or hyperactivity disorder, Asperger’s syndrome, or a specific speech impairment (Macintyre and Deponio, 2003). Learning difficulties can be caused by disabilities, but also by the student’s unfavourable socio-cultural background and the inappropriateness of the teaching methodology or curriculum. It is often a combination of different factors (Westwood, 2007). Learning difficulties can vary in depth, and can be temporary or permanent (Schults et al., 2018).
Not every different learning need is a disability or disorder. For example, a student with a second language and different cultural background may experience difficulties in learning, but sometimes a diagnosis is not what he or she needs – as long as there are no associated behavioural disorders or other pathologies. Many current practices in schools with diverse learners contribute to misidentifying learning differences as learning disorders (Hoover, 2009).
A characteristic of students with learning difficulties is that their academic performance is lower than that of their peers. This can occur in most subjects or subjects that require the application of certain specific skills. Students with learning disabilities mostly have difficulties in reading, writing or calculating (AUSPELD Supporting People with Learning Disabilites, 2014).
In previous studies that have analyzed the performance or opinions of students with learning difficulties, the definition of participants with learning disabilities has mostly been based on clinical diagnoses (Sakiz et al., 2015; Gaspar et al., 2016; Ben-Naim et al., 2017; Veni and Merlene, 2022) or the participants have been students who have obtained low results in tests of learning competencies (Alesi et al., 2014). There have been only some studies for assessing of self-perceptions of learning disabilities in inclusive education (Rothman and Cosden, 1995; Rijumol et al., 2011).
There was a need for a scale that evaluates learning difficulties perceived by the student’s own perspective and that can be used in surveys. In this sense, the creation of the Perceived Learning Difficulties questionnaire was justified, as it is not a diagnostic tool, but examines frequency of learning difficulties from the student’s point of view. The difficulties that occur more often in learning, were also used as a basis for creating the Perceived Learning Difficulties scale (Seema et al., 2022).
The aim of our current paper was to study teenagers’ learning difficulties and digital addiction and to reveal any differences between genders and age groups. The goal was also to investigate relationships between teenagers’ perceived learning difficulties, digital addiction and screen time and to analyse how much teenagers’ screen time and symptoms of digital addiction predict their learning difficulties.
The article answers the following research questions:
1. What are the scores of teenagers’ perceived learning difficulties (LDS), digital addiction (DAST) and screen time?
2. Do the scores of learning difficulties and digital addiction differ between genders and depending on age?
3. How do scores of teenagers’ perceived learning difficulties, digital addiction and screen time correlate?
4. How much does teenagers’ screen time and symptoms of digital addiction predict their learning difficulties?
Methods
Sample and procedure
The current study was a part of a larger e-survey, that in addition to the topics discussed in this paper consisted of topics such as distance learning, learning strategies, bullying, etc. Participation in the project was agreed with school leaders. All the schools received some anonymous feedback about the collected data from the Centre for Innovation in Education (Haridusinnovatsiooni Keskus, 2022).
The data were collected across Estonia from 8,486 teenagers who learned in 47 schools at the beginning of 2022. The students were 11–20 years old. Participation for students was voluntary and anonymous. They had the possibility to answer the e-questionnaire during a 2-week period (mid-January to 1 February). Some schools asked for an extension of the deadline. Some schools organised answering during school time, while others let the students fill out the scales at home.
Respondents had the possibility to mark their gender between 3 choices: (1) Male (3,621 students); (2) Female (4,136 students); (3) Other/Do not want to disclose (414 students). They also had the possibility to mark their age. Student ages were 11–20 years.
We had to exclude the answers of 315 respondents because the data were not reliable. They had been deliberately disruptive (inaccurate age or impossible number of hours); had answered carelessly (similar answers throughout the questionnaire), or had not understood the answer (had marked time of birth not their age, etc.). “If you cannot trust that respondents understood what you’d asked them to do, you cannot trust the results they provide” (Hillman, 2022).
Our research focus was initially students’ digital addiction and perceived learning difficulties, until we realised that we would have to exclude the students who seem to have special needs when completing the thorough e-questionnaire: students who have reading and learning difficulties, students with behavioural problems, and foreign students who are not fluent in Estonian, etc. We also realised the flaws of a survey, the outliers are the students who usually need help at school.
Measures
In this paper we will discuss only a small part of the survey (see Table 1), which used a voluminous e-questionnaire and was coordinated by the Centre for Innovation in Education. The scales we describe in this paper were also used in the 2020 study (see Seema et al., 2022). The full e-questionnaire consisted of more than 50 topics/questionnaires, and took students from 20 min to 1 h to fill out. We note the serial number of each scale since the volume of the e-questionnaire is important to keep in mind when collecting data in the inclusive educational context.
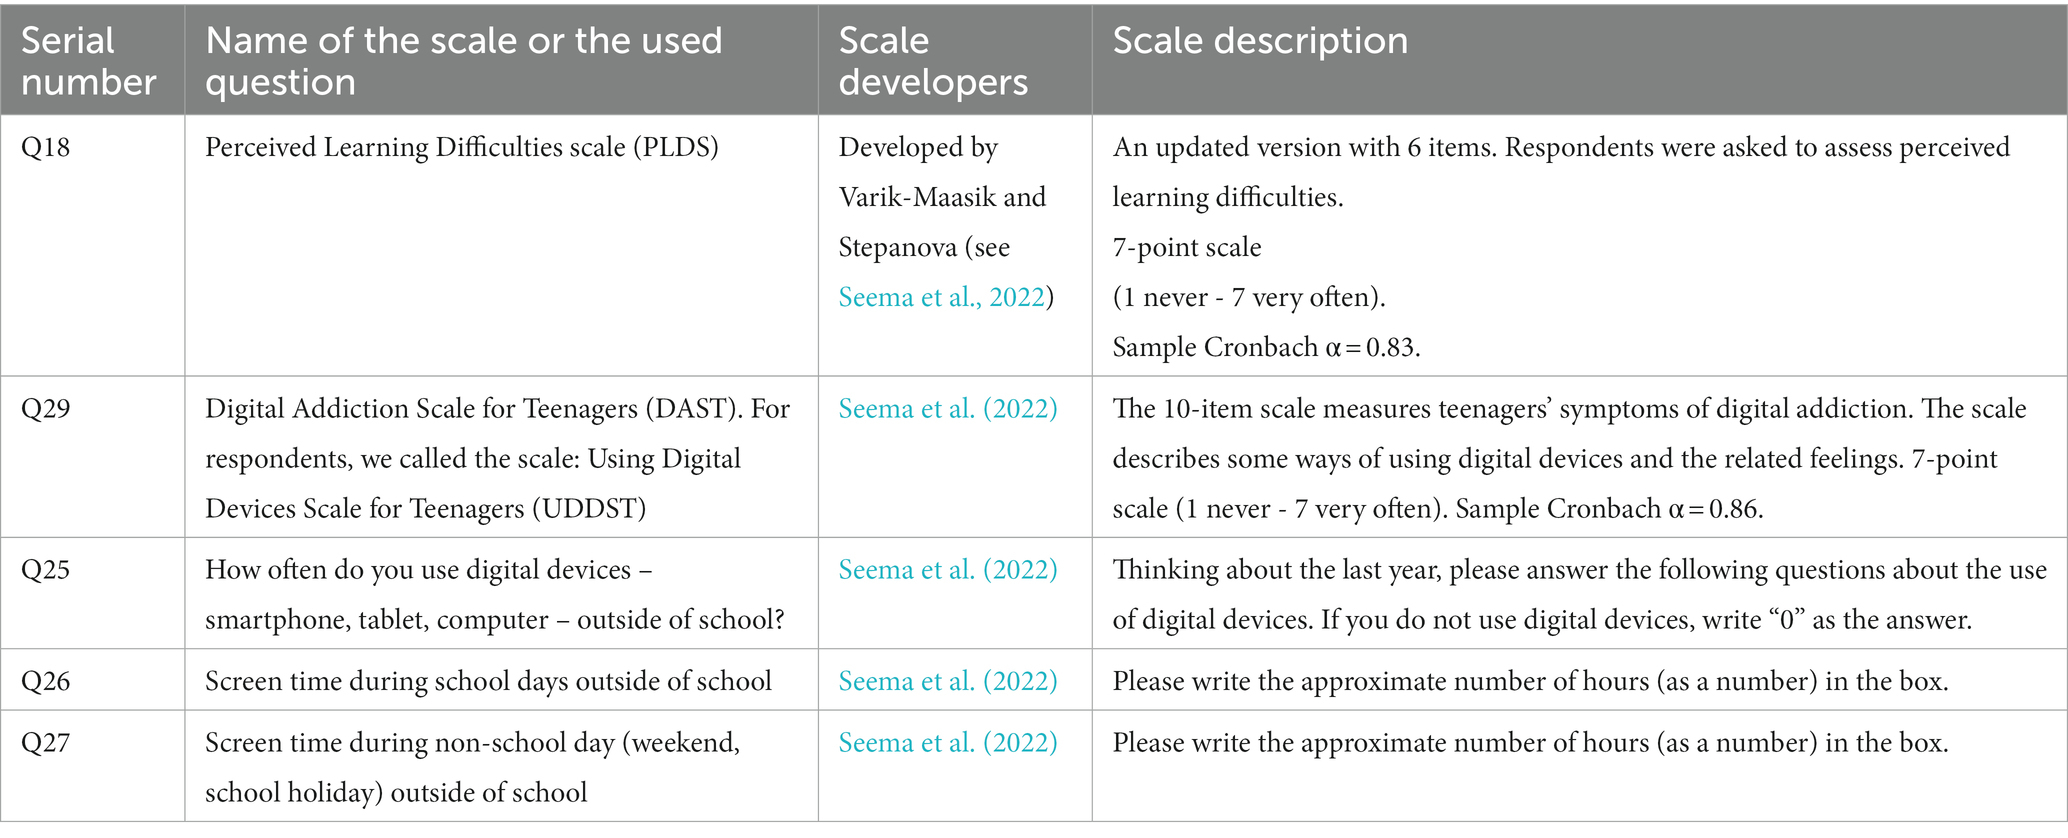
Table 1. Scales and questions used in the current paper.
Results
The scores of teenagers perceived digital addiction (DAST) learning difficulties (LDS), and screen time
The mean score of digital addiction was 35.63 points, standard deviation 10.9; min 10 points and max 70 points (Figure 1). In the current study digital addiction scores of 21.2% of students were one standard deviation above the mean, with the DAST score over 46.53 points. Two standard deviations above the mean were 4.1%, with the DAST score over 57.43 points.
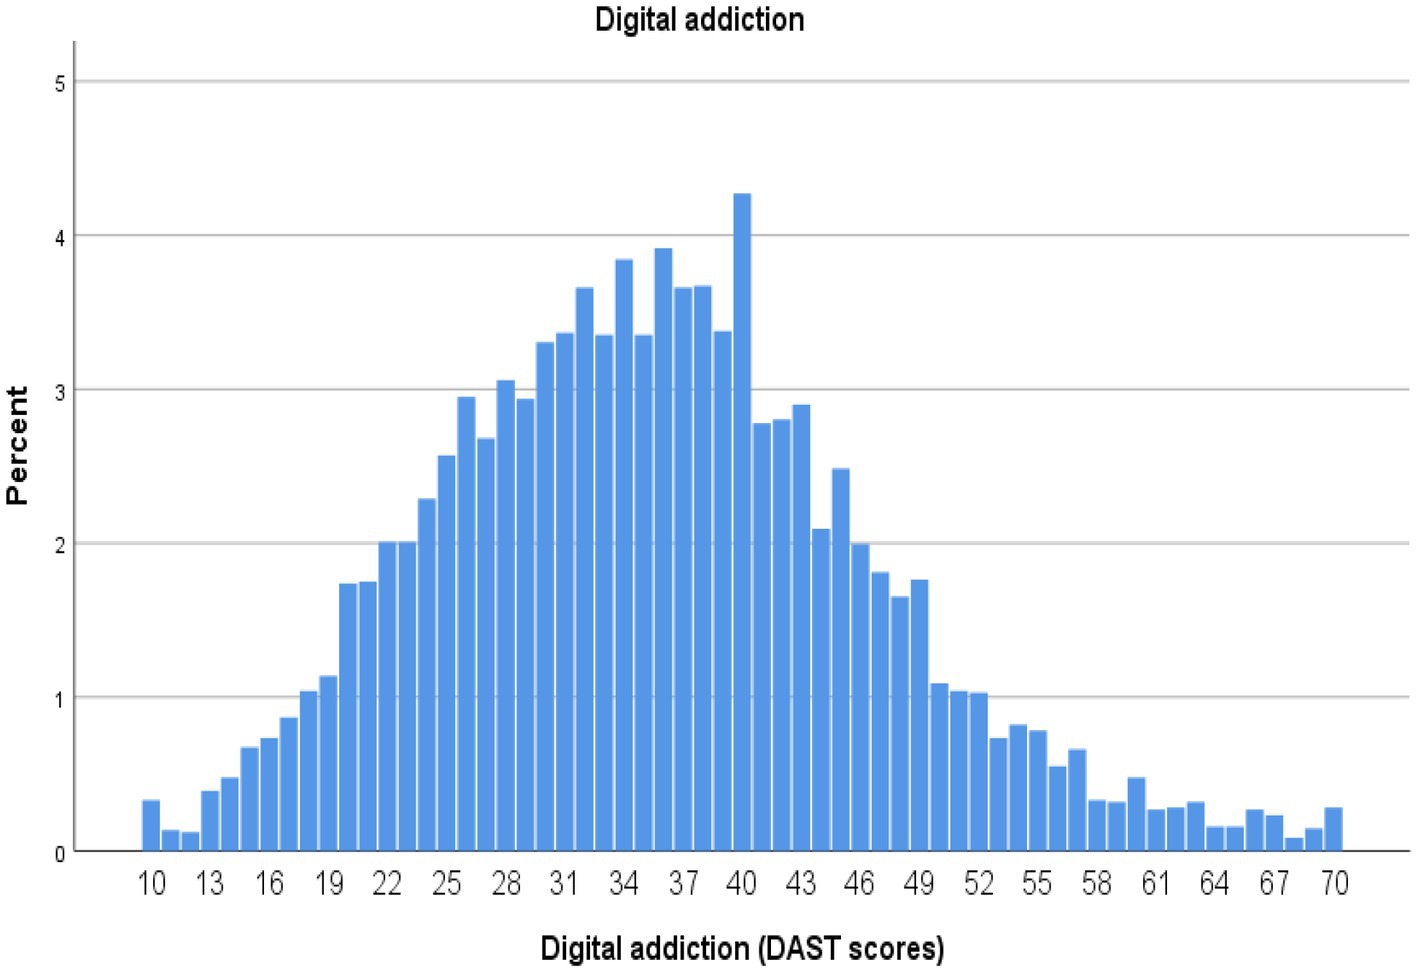
Figure 1. Digital addiction scores measured with the DAST scale.
The mean score of perceived learning difficulties was 18.47 points, standard deviation 6.5, min 6 and max 42 points (Figure 2). Our study also revealed that an average student perceives learning difficulties slightly below the scale average point. At the same time 17.1% of students perceived learning difficulties one standard deviation above the average, which means 24.97 LDS points or more. For 4.9% of students LDS points were 2 standard deviations over the mean (31.47 points), meaning that learning is often or very often hard for them. At the same 13.7% of students remain below the 1 standard deviation below the mean, which means learning is rarely hard for them (11.97 LDS).
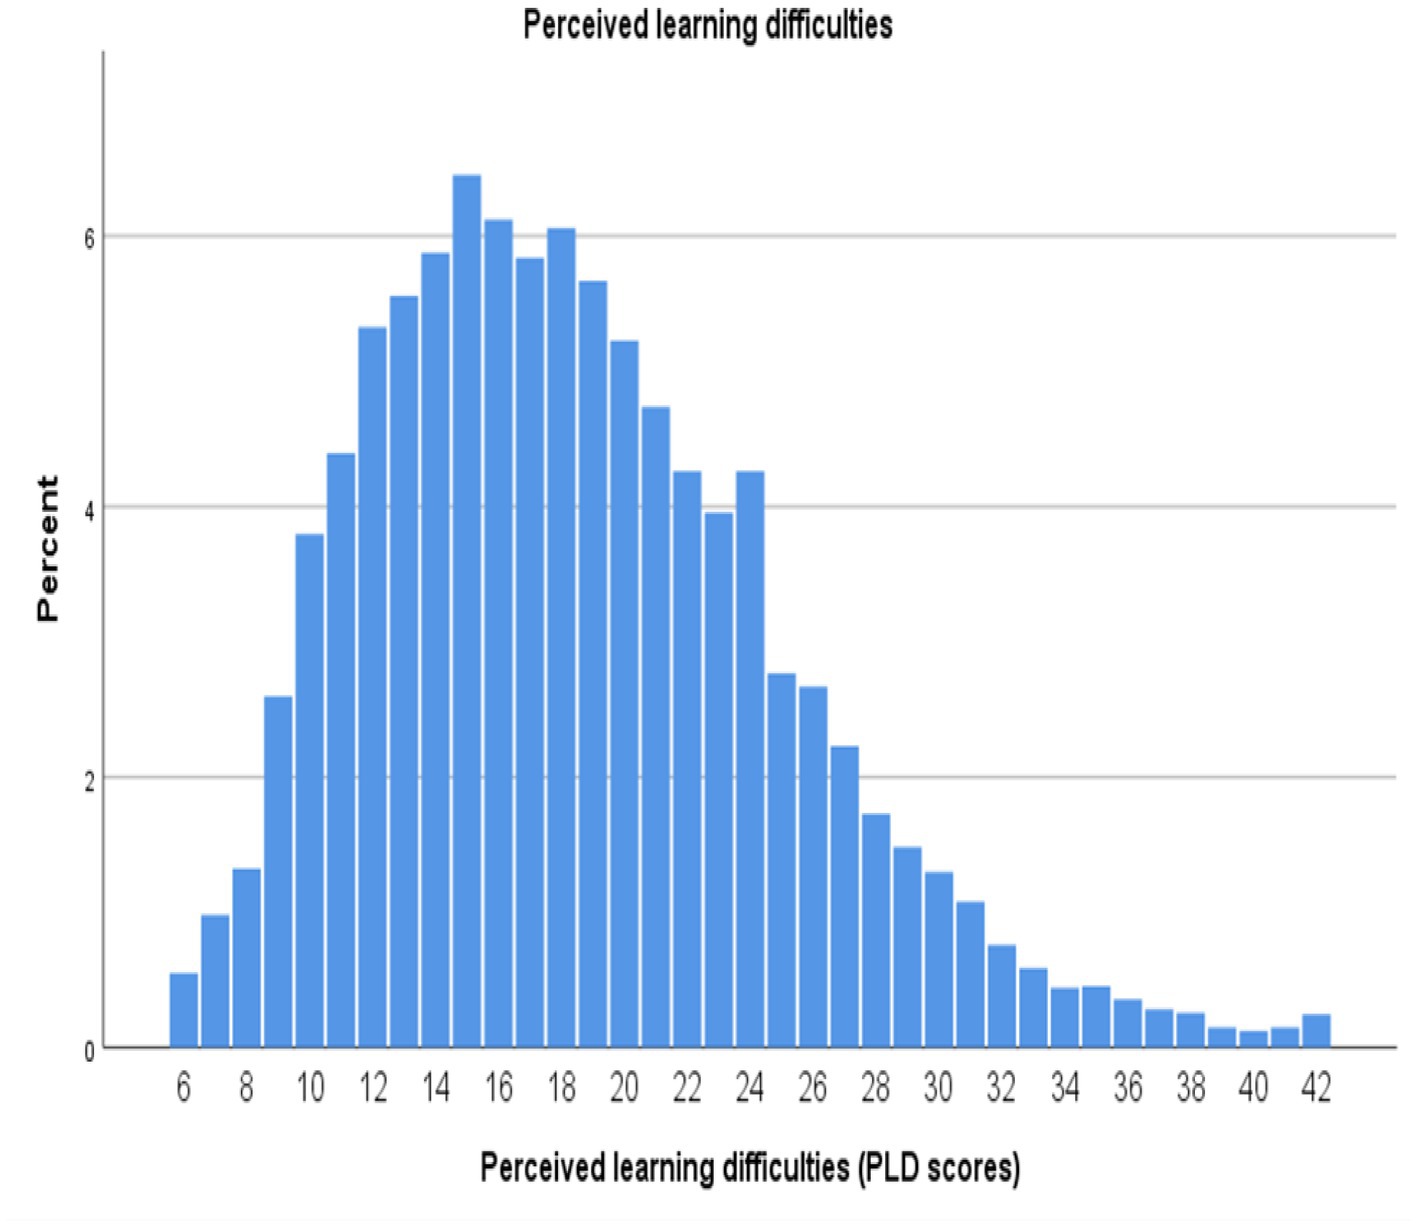
Figure 2. Students’ perceived learning difficulties measured with a PLD scale.
Screen time during school days and screen time during weekends were variables that had open answers. Therefore, students even gave some unrealistic answers. For example, 45 students had answered that they use digital devices for 24 h during weekends. In the course of organising the data we considered logical up to 17 h of screen time during school days and 20 h during a day during a weekend. Therefore, we removed the outliers.
Students spent an average 4.8 h (Std 2.2 h) using digital devices during a school day (before and after school), min 0 h and max 17 h (Figure 3). One standard deviation over the mean was the answers of 18.9% of students who had said that they use digital devices on weekdays more than 7 h a day. Two standard deviations above the mean was the answers of 5.5% of students (more than 9.2 h). At the same time 1 standard deviation below the mean was only 13.11% of answers (2.6 h) and 2 standard deviations below the mean was only 0.9% of students (0.4 h).
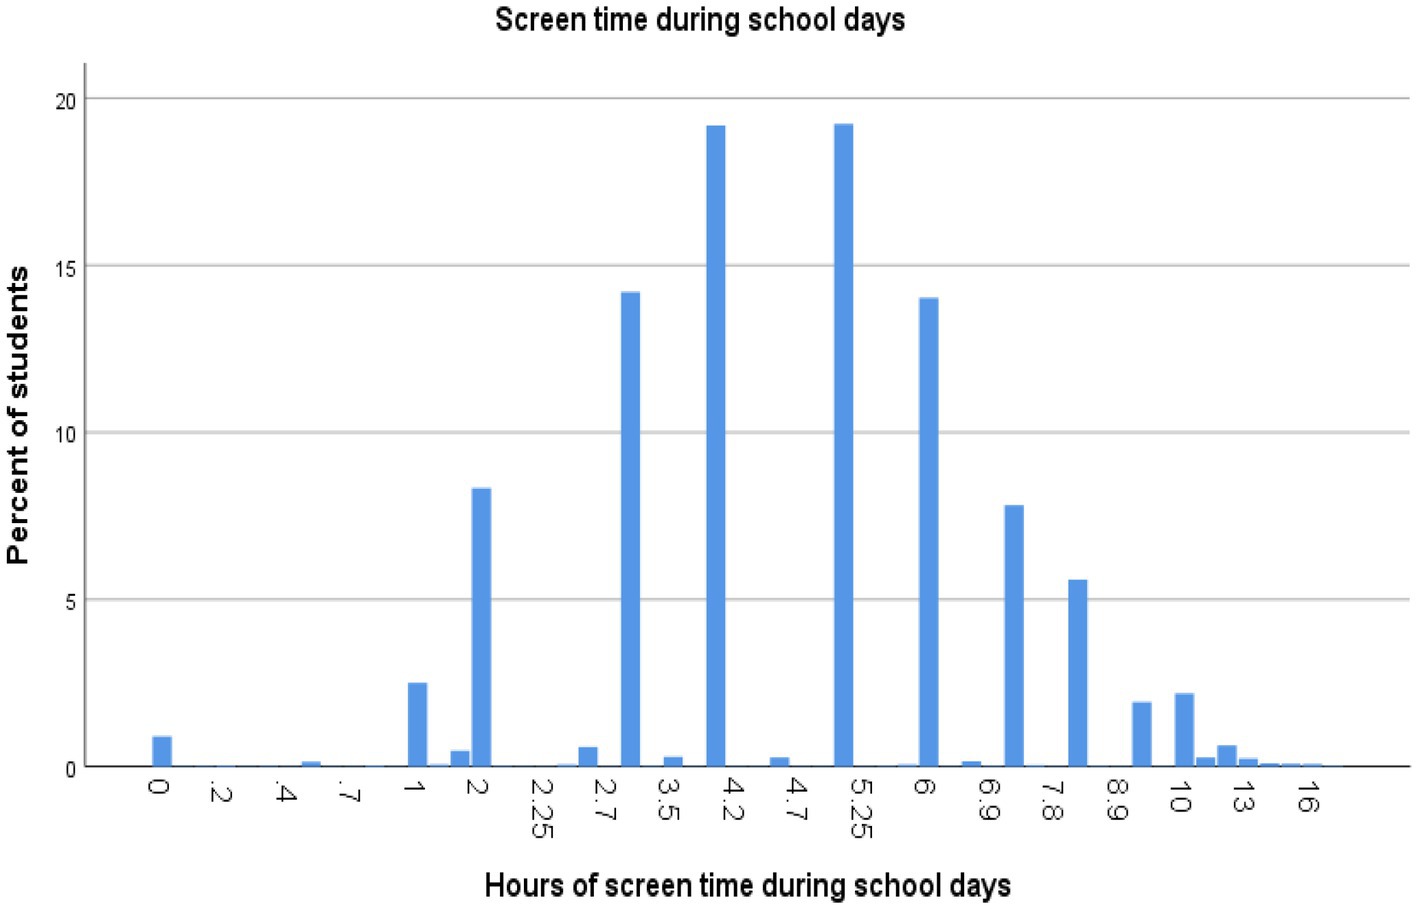
Figure 3. Students’ screen time during school days.
Students used screens on average 6.7 h (Std 3.3 h) on a non-school day (weekend, school holiday), min 0 h and max 20 h (Figure 4). One standard deviation above the mean was the answers of 18.2% of students, since they used screens 10 h a day, and two standard deviations was the answers of 13.3% of students, and they used screens 13 or more hours a day during weekends.
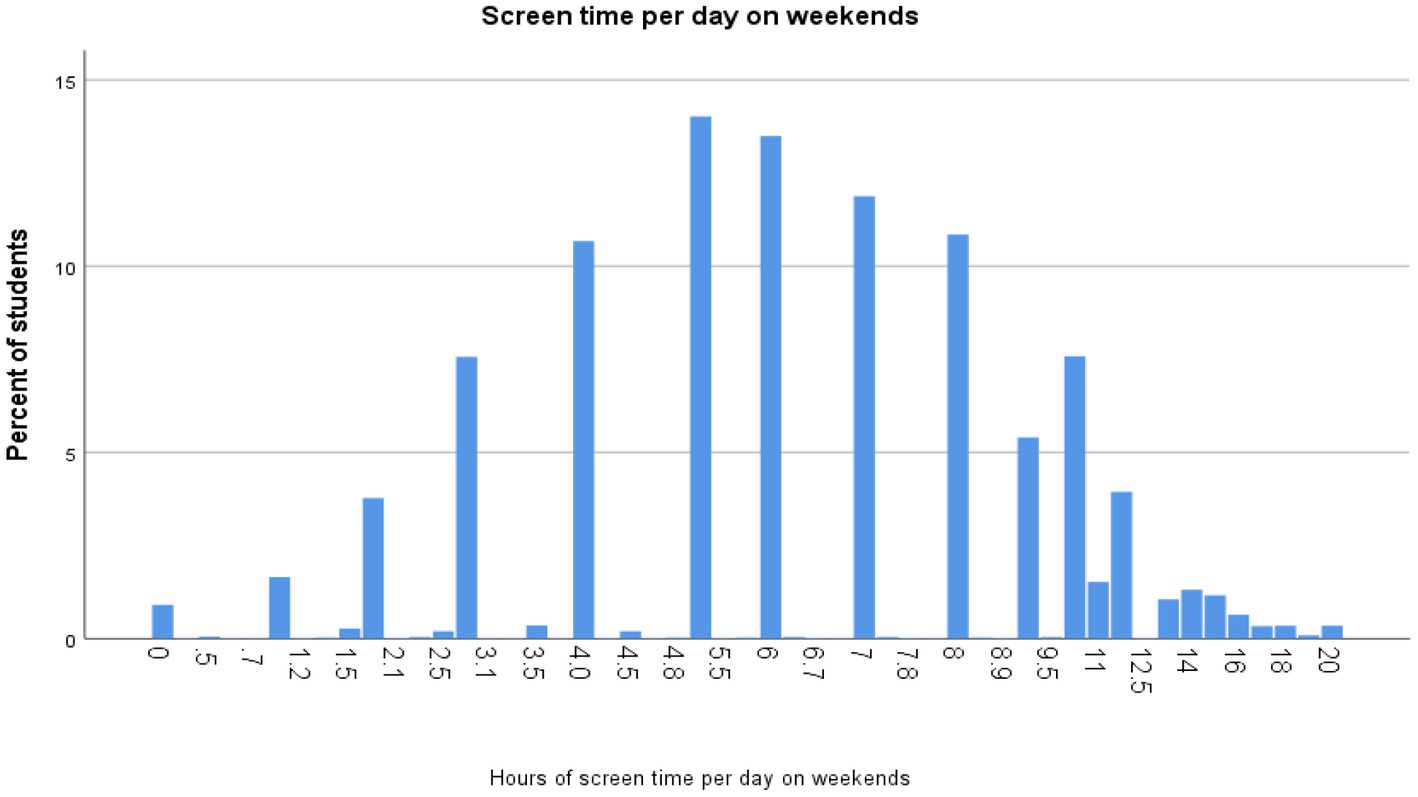
Figure 4. Students’ screen time per day on weekends.
Perceptions of digital addiction, learning difficulties and screen time between gender and age groups
One-way ANOVA analysis with the Bonferroni and Dunnett T3 post hoc tests showed that the scores of digital addiction, learning difficulties and screen time differed statistically between gender and age groups (p ≤ 0.001; see Appendixes 1–8). Female students and those who had not marked their gender had higher digital addiction scores than male students. The students who had not marked their gender had the highest perceived learning difficulties in the arithmetical mean score, while male students had the lowest learning difficulties arithmetical mean score. The group of students who had not marked their gender also reported on average longer screen time than male or female students.
Our study showed that perceived symptoms of digital addiction statistically rise at the age of 14 and stay at relatively similar levels for 15-, 16-, 17- and 18-year-old students. Digital addiction scores were slightly lower for 19-year-old students compared to 18-year-old students, but not statistically significantly. In our sample there were only a few 11- and 20-year-old students, therefore it is not possible to make generalisations for these age groups (see Appendix 4).
Correlations between perceived learning difficulties (LDS), digital addiction (DAST) and screen time
The perceived learning difficulties scores were moderately positively related to digital addiction (r = 3.23), weakly positively related to screen time outside of school on school days (r = 0.177) and screen time during weekends (r = 0.174). At the same time digital addiction scores were moderately positively related to screen time on schooldays (r = 0.384) and weekends (r = 0.373). Screen time on school days and weekends was strongly positively correlated (r = 0.710). All correlations were significant p < 0.0001. Correlations are shown in Table 2.
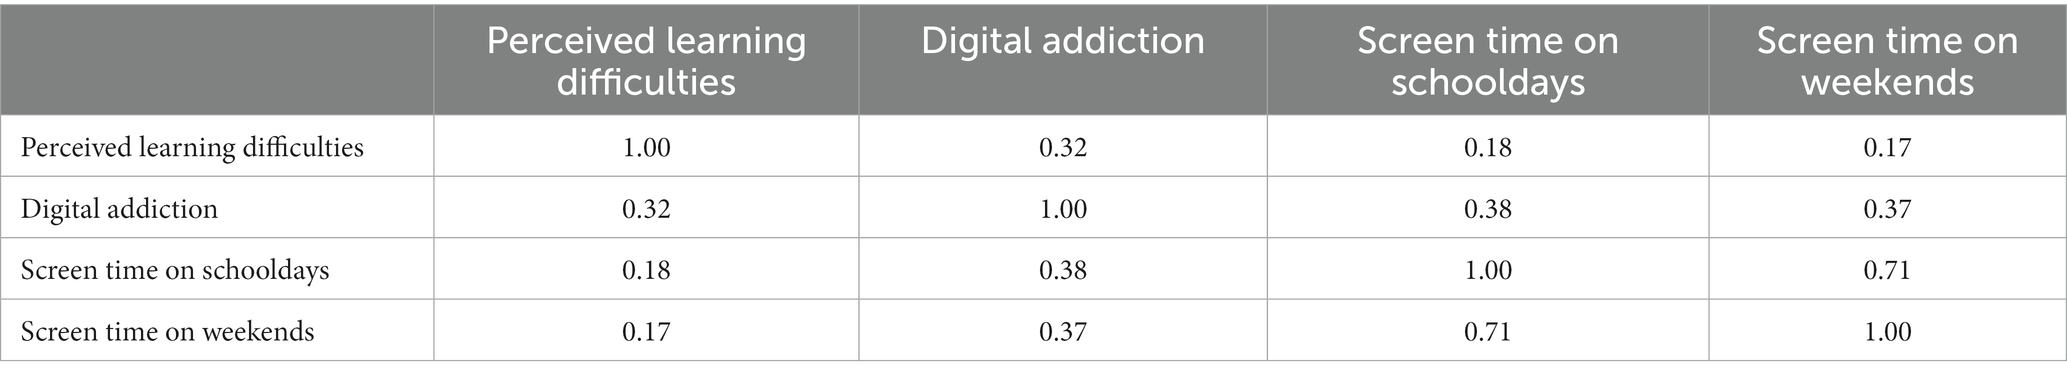
Table 2. Pearson correlations between students’ perceived learning difficulties, digital addiction and screen time (N = 8,171), p < 0.0001.
Predictions of perceived learning difficulties based on digital addiction and screen time
Firstly, we used linear regression analysis to test if the predictor variable (digital addiction) significantly predicts students’ perceived learning difficulties. We made a linear model that shows how much digital addiction (X) predicts learning difficulties (Y).
Learning difficulties score (Y) = 11.5 + 0.2 (digital addiction score).
The model showed that 10% of variability of learning difficulties (R2 = 0.10) was described by digital addiction (β = −0.1). The overall regression was statistically significant: F = (1; 8,168) = 952.22, p < 0.001.
It was found that digital addiction significantly predicted learning difficulties (β = 0.19, p < 0.001).
However, prediction of the model of learning difficulties for an individual in the general population may differ from the Standard Error of the Estimate = 6.19 (Appendix 9). Residual values show unexplained differences between the predicted value and the observed value. The minimum predicted residual or difference between predicted value and observed value was −18.73 points and the maximum difference between predicted value and observed value was 25.78 points (Figure 5).
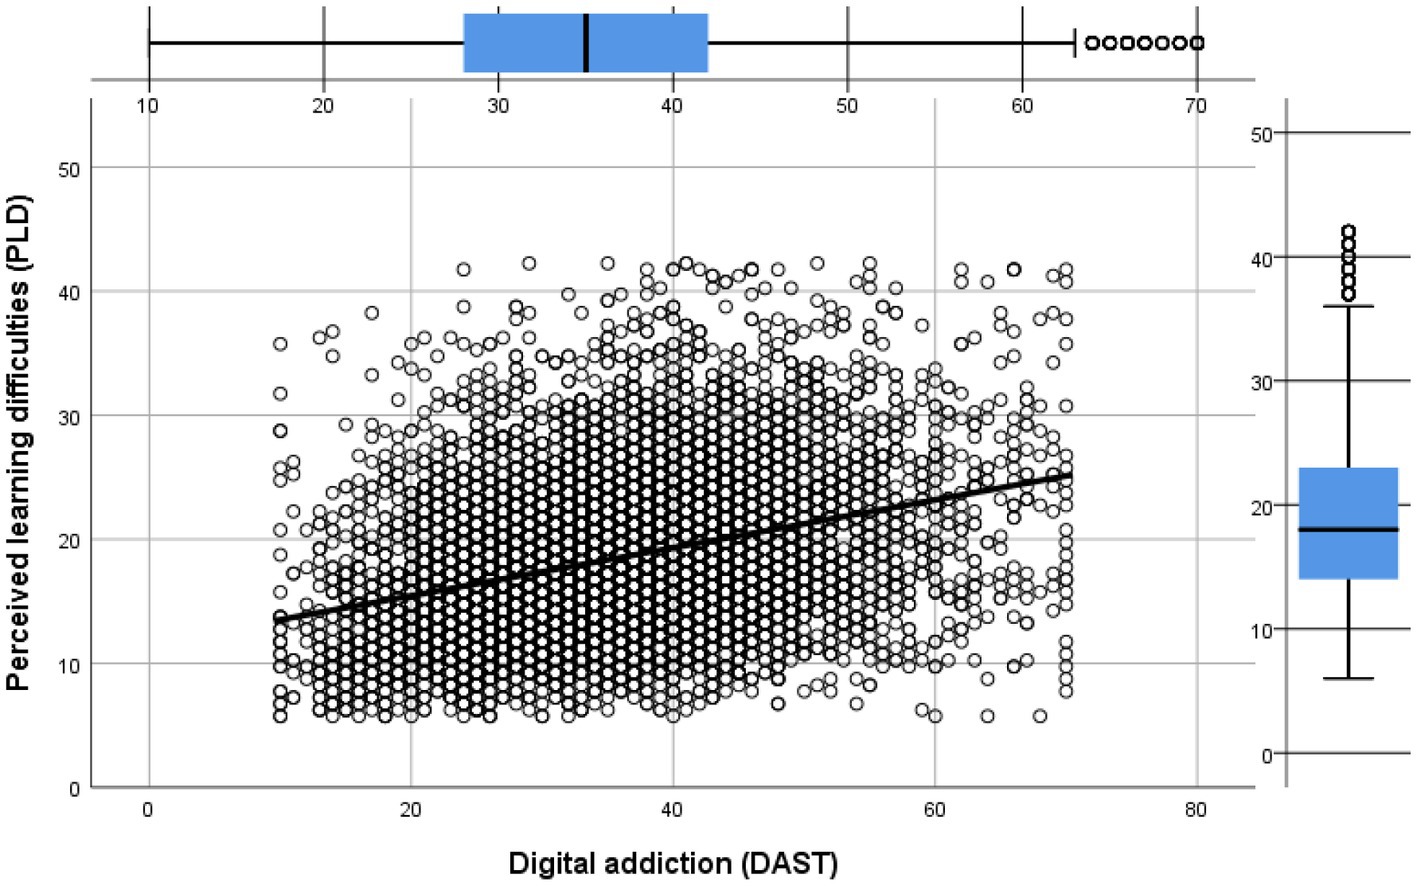
Figure 5. Linear regression of digital addiction (DAST) and perceived learning difficulties (PLD) scores.
We also made another linear regression model to test how much students’ symptoms of digital addiction and screen time together predict their learning difficulties.
We used a linear regression analysis to test if predictor variables significantly predict response variables. The regression model predicts perceived learning difficulties (Y) as the dependent variable for an individual student based on the independent variables [digital addiction (X1), screen time (X2) on schooldays and screen time on weekends (X3)].
Y = 11.2 + 0.2 (X1) +0.1 (X2) + 0.07 (X3).
The model showed that around 11% of variability of learning difficulties (R2 = 0.11, p < 0.001) was described by a combination of three independent variables: digital addiction (β = 0.2; p < 0.001), screen time during school days (β = 0.1; p < 0.00) and screen time during weekends (β = 0.07; p < 0.001). The overall regression was statistically significant (R2 = [0.11 (11%)], = [F-330.77], [p < 0.001]). Prediction of the model of learning difficulties for an individual in the general population may differ on average 6.17 points (Appendix 10).
Discussion
As a large survey carried out in the Estonian inclusive educational system we were seeking answers concerning the scores for teenagers’ perceived digital addiction and learning difficulties of 11- to 20-year-old students. Our goal was to investigate relations between teenagers’ perceived learning difficulties, digital addiction and screen time and to analyse how much teenagers’ screen time and symptoms of digital addiction predict their learning difficulties. But in any inclusive education not only students with mean values, but also students at risk with values over one or two standard deviations above or below the mean, should be in the research focus.
Teenagers’ perceived digital addiction, learning difficulties and screen time
The study showed that in inclusive education students form a heterogeneous group with large differences in perceived symptoms of digital addiction, perceived learning difficulties and screen time. The average Estonian student perceives symptoms of digital addiction to an average extent. The mean score of digital addiction measured with the DAST scale at 2022 was one point higher than the score that was found with the same scale at the beginning of the first COVID-19 wave in 2019 (Seema et al., 2022). That means 3 years of distance learning periods have raised the mean scores of perceived digital addictions only slightly. The digital addiction scale (DAST) is a self-assessment scale, and with any addiction there is a possibility for denial.
Of concern is the fact that digital addiction scores of 21.2% of students are high, with values one standard deviation above the mean. The DAST does not diagnose anyone, but allows the possibility to screen occurrence of the problem at the level of population. The scale may be useful for students own self-assessment and reflection of their own behaviour towards digital devices in human studies lessons, but the studies are not yet available (Seema et al., 2022).
Our study also revealed that an “average student” in inclusive education perceives learning difficulties a little below the scale average point. That means for an average student learning is only somewhat rarely hard and these students might not make enough effort when learning. Students whose answers are below one standard deviation below the mean rarely or never feel that learning is difficult for them, so learning may not be sufficiently challenging for the gifted. A previous international study has shown that teachers teach less in inclusive education classes across countries and teaching space slows down (Cooc, 2019).
At the same time there are 17% of students who feel often that learning is hard for them and even 5% of students who feel very often that learning is hard for them. That means they have not gotten enough help from teachers or support specialists. The results are similar to the Australian data that reported that 15–20% of students have learning difficulties and 3–5% of students have learning disabilities. Left unidentified and without appropriate intervention the students have little likelihood of achieving at levels close to their academic potential (AUSPELD Supporting People with Learning Disabilites, 2014). Still, we should keep in mind that studies have shown that students with learning disabilities do not have a realistic perception about themselves. They tend to overestimate their abilities (Lawrence and Sathiyaseelan, 2019).
There was a significant variation between students’ answers regarding their screen time, which was 0–24 h. In our survey 45 students answered that they use their screens 24/7. Even while we removed the outliers, their answers showed that the question is not so easy to answer. As the DigGen project revealed, during distance learning periods boundaries between school and home disappeared and it became impossible to study without using digital tools (Eickelmann et al., 2021). We firstly considered removing all those respondents who had answered 0 h, because even this seems to be impossible, given that students had to use their digital devices for doing homework. Still, we did not remove the answers of those who reported no screen use outside of school if their other answers seemed to be trustworthy. But there were several students who reported 0 screen hours, but they had been dishonest about their age or other open data, and we removed them. Problems with the inclusion of students with learning difficulties into a survey have also been noticed during the International Student Assessment (PISA; OECD, 2018).
Estonian teenagers’ average screen time (of 4.8 h during school days and 6.8 h during weekends) is much higher than suggested by the Canadian and Australian 24-h movement guidelines for young people up to 17 years. Sedentary recreational screen time should be limited to 2 h per day in order to ensure a teenager’s healthy lifestyle. This does not include screen-based activities for educational uses (Okely et al., 2022).
A previous Estonian study showed with a cluster analysis that no more than 3 h of screen time during school days and 4.5 h during weekends is healthy and those who use more seem to have more perceived learning difficulties and lower subjective wellbeing (Seema et al., 2022).
Differences between gender and age groups
Our study showed that there are some significant differences between students’ gender and age groups. The study differentiated from previous studies, since we separated three gender groups (Male; Female; Do not want to say/other) and therefore a new finding appeared, that the third, smaller, gender group had the highest digital addiction scores, the longest screen time and the highest learning difficulties. It seems that students with gender-related distress may need some more psychological help in inclusive educational systems. Canvin et al. (2022) have claimed that gender-diverse young people may need some additional skilled support without pathologizing or aiming to change a young person’s gender identity.
Our study also revealed an interesting fact, that Estonian female students had a significantly higher DAST scores than males. Previous studies have shown no statistically significant differences in smartphone addiction and social media addiction between male and female respondents. At the same time a meta-analysis has shown that gaming addictions are more prevalent in males (Meng et al., 2022).
In the future studies the third small gender group needs some extra attention, since they seems to have the higest perceived learning difficulties (PLD scores). A further interesting result was the fact that male students had reported lower perceived learning difficulties than female students. This result contradicts the knowledge that boys generally have more identified learning disabilities across racial and ethnic groups (Cortiella and Horowitz, 2014). A clear pattern have emergeed across all European countries that boys are identified as having special educational needs to a much greater extent than girls are (Ramberg and Watkins, 2020). At the same time research studies have showed that equal numbers of boys and girls have difficulty with reading. Therefore, many girls with learning difficulties may be unidentified and unsupported by special education (Cortiella and Horowitz, 2014).
Our study showed that perceived symptoms of digital addiction statistically rise at the age of 14 and stay at relatively similar levels for 15-, 16-, 17- and 18-year-old students. Digital addiction scores were slightly lower for 19-year-old students compared to 18-year-old students, but not statistically significantly. In our sample there were only a few 11- and 20-year old students, therefore it is not possible to make generalisations for these age groups (see Appendix 4).
Relations between perceived learning difficulties, digital addiction and screen time
The study revealed some significant correlations between learning difficulties, digital addiction and screen time. The perceived learning difficulty scores were moderately positively related to digital addiction, and weakly positively related to screen time. At the same time digital addiction was moderately positively related to screen time on school days and weekends. Screen time on school days and weekends was strongly positively correlated. All correlations were significant, p < 0.0001. The correlations are shown in Table 2. An Estonian study carried out 3 years ago showed very similar relationships between the variables (Seema et al., 2022).
A previous Turkish study investigated relations between digital addiction and problem-solving and inquiry skills. They measured digital addition with the DAS (Dilci, 2019) and inquiry skills with the ISS (Karademir and Saracaloglu, 2013) and the study showed a low negative significant relationship between these constructs (Yildiz, 2021). Babic et al. (2017) found associations between changes in screen time and mental health outcomes in adolescents.
Predictions of perceived learning difficulties based on digital addiction and screen time
Distance learning period with longer screen time and more challenges for self-regulated learning has highlighted the issue of students with learning disabilities. We searched for an answer to the question of how much learning difficulties are predicted by digital addiction and screen time. The analysis showed that 10% of variability of learning difficulties is predicted by digital addiction. Since digital addiction and screen time are related, digital addiction and screen time together predict 11% of learning difficulties scores. But we must be reminded that in inclusive education, students are a large and heterogeneous group with great variety, therefore the model predicts badly for those students whose scores are different from the mean and who are designated the outliers.
To the best of our knowledge, studies have not previously predicted perceived learning difficulties based on digital addiction, although a Turkish study predicted students’ inquiry skills based on digital addiction. The study showed that digital addiction measured with the DAS (Dilci, 2019) levels explained 5% of the variance in the high school students’ inquiry skills (Yildiz, 2021). A French population-based study showed through logistic regression modelling that the daily screen time was strongly associated with early adolescents’ school, behaviour and mental health difficulties (Chau et al., 2022).
Critique and conclusion
We can offer several insights based on the results of the survey. Firstly, we realised that the periods of distance learning have blurred the boundaries between school and home, and have qualitatively changed the way children use digital devices – therefore the question of how many hours they use outside of school seems to be hard to answer. Future studies and experiments with objective assessment of screen time are important to understand the real situation and its impact on children.
Secondly, we realised that we cannot study and understand special children with methods convenient to mainstream science. With a long and complicated questionnaire, it is not possible (without the help of a support specialist, teacher or parent) to examine children who have serious reading or writing difficulties, behavioural difficulties, nor those children who, due to another mother tongue, have not yet mastered the language to the extent that they can accurately answer the questionnaire.
Thirdly, we realised the paradox that, when working with large amounts of data, we have to clean the data and exclude the answers of such children that seem to be of doubtful value, i.e., unreliable. In the data, they appear as empty cells, only identical numbers and arbitrary and illogical answers. Children who give such answers to the questionnaire stand out in school because of their special needs – they may have difficulty concentrating on the task, they sometimes do not understand the meaning of what they read, or they are fooling around. Both teachers and support specialists work with these kinds of students with special needs, but such children may be left out of big data. In real life we cannot treat special needs children as objects, but rather subjects with needs, feelings, thoughts and actions. We cannot exclude them from classes in the way that scientists can and should exclude their data from the study for the sake of correct data and reliability.
Scientific research strives for large amounts of data, and the survey is often chosen as a research method because it can be used to collect a wealth of data at once and relatively easily. However, there are major shortcomings in inclusive education when conducting a large-scale survey. One of the disadvantages is that the researchers cannot check the honesty of the respondents when answering the questionnaire. It is also difficult to find out whether the respondent has understood the question at all.
Inclusive education challenges researchers and presupposes inclusive science. When planning any research, it is important to consider the use of research methods suitable for children with special needs. It is important to plan how to include special needs students into a survey with the help of trusted adults. When completing the questionnaires, children with special needs may need help in completing the test and understanding the work instructions. They may need the questionnaire read aloud and the opportunity to ask clarifying questions about the questionnaire.
More thought should be given to how special educational needs children can participate in research. As researchers, we could use more mixed research methods and study children with special needs in a differentiated and individualised way, just as we recommend differentiated and individualised teaching to practitioners. It is time-consuming and expensive work, just as individualised teaching is time-consuming, labour-intensive, and expensive.
As researchers we must be humble when speaking about inclusive education. If we as researchers do not reach these special children ourselves, then how can we say that we know how these special children think and feel and how to teach them in inclusive education? As researchers, we too could reach such children who are not mentally and emotionally ready to answer the questionnaire. We need to admit that for studying students with severe learning difficulties, we need contact with real children. To understand the educational system and the diversity of students, we ourselves need pedagogical practice from time to time.
Our study showed that, in inclusive education, students’ learning difficulties vary largely – with a group of students who experience learning difficulties very differently to those to whom the learning environment does not give sufficient challenges in learning. A large variety appeared in students’ digital addiction and screen time, but it seems that the average Estonian student does use screens more often than is healthy for them. Digital addiction and screen time explains 11% of variability in learning disabilities, and this is understandable, since their innate abilities and learning and home environment and other factors are also very important.
Finally, we provide a list of strengths and limitations of our study. A strength of the study, as well as its limitation, can be considered that the study was conducted during the corona period, and changes in the environment could have influenced the behavior and responses of young people. The second strength and limitation as well can be considered that the research was conducted electronically in the system of inclusive education, but without taking into account the need for greater support of students with special needs by answering a large questionnaire. This circumstance also led to the exclusion of quite a large part of the respondents from the sample, as their answers were not reliable. Among the respondents, there may still be those answers where all questions were not adequately answered. The students answered the questionnaires in the computer classrooms of the schools and in the students’ homes, so the researchers did not have the opportunity to observe the students while filling out the questionnaire and help them if necessary.
A limitation of this study can be considered the subjectivity of the answers, as the data were collected with self-assessment questionnaires. The aim of the present study was not to diagnose, but to investigate the subjective evaluations of elementary school and high school students on the frequency of perceived learning difficulties, symptoms of digital addiction screen time.
A limitation of our study is the fact that it was a cross-sectional study and statistical analyses cannot make any generalisations about the cause and effect of digital addiction and learning difficulties. Explaining variability of answers and predicting one variable based on another does not mean showing direction of the effect. However, the screening study still showed that digital addiction and overuse of digital devices is a problem for many students that should be prevented or dealt with at national policy level. Future studies could develop any experiments, interventions and longitudinal studies for measuring causal relations between screen time, digital addiction and learning difficulties. In the future, a survey could also be conducted among primary school students and teachers, support specialists and parents could also be included in the survey.
Data availability statement
The data analyzed in this study is subject to the following licenses/restrictions: The current study was a part of a larger e-survey, that in addition to the topics discussed in this paper consisted of topics such as distance learning, learning strategies, bullying, etc. Participation in the project was agreed with school leaders. All the schools received some anonymous feedback about the collected data from the Centre for Innovation in Education (Haridusinnovatsiooni Keskus, 2022). Requests to access these datasets should be directed to https://www.tlu.ee/kooliuuring.
Ethics statement
Ethical review and approval was not required for the study on human participants in accordance with the local legislation and institutional requirements. Written informed consent from the participants’ legal guardian/next of kin was not required to participate in this study in accordance with the national legislation and the institutional requirements.
Author contributions
RS and EV-M contributed to the conception and design of the work, data analysis and interpretation, drafting the article, critical revision of the article, final approval of the version to be published.
Funding
Publishing this article as an Open Access paper will be funded by the European Regional Development Fund through an ASTRA measure project (TLU TEE or Tallinn University as the promoter of intelligent lifestyle); (no 2014-2020.4.01.16-0033).
Conflict of interest
The authors declare that the research was conducted in the absence of any commercial or financial relationships that could be construed as a potential conflict of interest.
Publisher’s note
All claims expressed in this article are solely those of the authors and do not necessarily represent those of their affiliated organizations, or those of the publisher, the editors and the reviewers. Any product that may be evaluated in this article, or claim that may be made by its manufacturer, is not guaranteed or endorsed by the publisher.
Supplementary material
The Supplementary material for this article can be found online at: https://www.frontiersin.org/articles/10.3389/feduc.2023.1191817/full#supplementary-material
References
Alesi, M., Rappo, G., and Pepi, A. (2014). Depression, anxiety at school and self-esteem in children with learning disabilities. J. Psychol. Abnorm. Child. 3, 1–8. doi: 10.4172/2329-9525.1000125
Almourad, B. M., McAlaney, J., Skinner, T., Pleva, M., and Ali, R. (2020). Defining digital addiction: key features from the literature. Psihologija 53, 237–253. doi: 10.2298/PSI191029017
AUSPELD Supporting People with Learning Disabilites (2014). Understanding Learning Difficulties: A Practical Guide. Available at: https://www.emmaus.act.edu.au/storage/understanding-learning-difficulties-for-teachers.pdf. (Accessed July 4, 2023).
Babic, M. J., Smith, J. J., Morgan, P. J., Eather, N., Plotnikoff, R. C., and Lubans, D. R. (2017). Longitudinal associations between changes in screen-time and mental health outcomes in adolescents. Ment. Health Phys. Act. 12, 124–131. doi: 10.1016/j.mhpa.2017.04.001
Ben-Naim, S., Laslo-Roth, R., Einav, M., Biran, H., and Margalit, M. (2017). Academic self-efficacy, sense of coherence, hope and tiredness among college students with learning disabilities. Eur. J. Spec. Needs Educ. 32, 18–34. doi: 10.1080/08856257.2016.1254973
Canvin, L., Hawthorne, O., and Panting, H. (2022). Supporting young people to manage gender-related distress using third-wave cognitive behavioural theory, ideas and practice. Clin. Child Psychol. Psychiatry 27, 1246–1262. doi: 10.1177/13591045211068729
Chau, K., Bhattacherjee, A., Senapati, A., Guillemin, F., and Chau, N. (2022). Association between screen time and cumulating school, behavior, and mental health difficulties in early adolescents: a population-based study. Psychiatry Res. 310:114467. doi: 10.1016/j.psychres.2022.114467
Chen, I.-H., Chen, C.-Y., Pakpour, A. H., Griffiths, M. D., Lin, C.-Y., Li, X.-D., et al. (2021). Problematic internet-related behaviors mediate the associations between levels of internet engagement and distress among schoolchildren during COVID-19 lockdown: a longitudinal structural equation modeling study. J. Behav. Addict. 10, 135–148. doi: 10.1556/2006.2021.00006
Cooc, N. (2019). Do teachers spend less time teaching in classrooms with students with special needs? Trends from international data. Educ. Res. 48, 273–286. doi: 10.3102/0013189X19852306
Cortiella, C., and Horowitz, S. H. (2014). The State of Learning Disabilities: Facts, Trends and Emerging Issues. New York: The National Center for Learning Disabilities.
Dilci, T. (2019). A study on validity and reliability of digital addiction scale for 19 years or older. Univers. J. Educ. Res. 7, 32–39. doi: 10.13189/ujer.2019.070105
Dorn, E., Hancock, B., Sarakatsannis, J., and Viruleg, E., (2021). US States and Districts Have the Opportunity to Not Only Help Students Catch Up on Unfinished Learning From the Pandemic But also Tackle Long-Standing Historical Inequities in Education. Available at: https://www.mckinsey.com/industries/education/our-insights/covid-19-and-education-the-lingering-effects-of-unfinished-learning. (Accessed July 4, 2023)
ECEPAA (2023). The Impact of COVID-19 on Chools in Europe. Available at: https://www.ecepaa.eu/the-impact-of-covid-19-on-schools-in-europe/. (Accessed July 4, 2023)
Eickelmann, B., Barbovschi, M., Casamassima, G., Drossel, K., Gudmundsdottir, G.B., Holmarsdottir, H.B., et al. (2021). The Younger Generation’s Views on How Their Education Is Preparing Them for the Digital Age Against the Background of COVID-19: Results of an Exploratory Study in Five European Countries. (DigiGen - Working Paper Series No. 5).
Eickelmann, B., Casamassima, G., Labusch, A., Drossel, K., Sisask, M., Teidla-Kunitsõn, G., et al. (2022). Children and Young People’s Narratives and Perceptions of ICT in Education in Selected European Countries Complemented by Perspectives of Teachers and Further Relevant Stakeholders in the Educational Context. (DigiGen- Working Paper Series No.11).
Estonian Ministry of Education and Research . (n.d.). Special Educational Needs. Available at: https://www.hm.ee/en/education-research-and-youth-affairs/special-educational-needs#support-measures-for. (Accessed July 4, 2023)
European Agency for Special Needs and Inclusive Education (2018). Country Policy Review and Analysis: Estonia. Available at: https://www.european-agency.org/sites/default/files/agency-projects/CPRA/Phase2/CPRA%20Estonia.pdf. (Accessed July 4, 2023)
García-Martín, J., and García-Sánchez, J.-N. (2013). Patterns of web 2.0 tool use among young Spanish people. Comput. Educ. 67, 105–120. doi: 10.1016/j.compedu.2013.03.003
Gaspar, T., Bilimoria, H., Albergaria, F., and Matos, M. G. (2016). Children with special educational need and subjective well-being: social and personal influence. Int. J. Disabil. Dev. Educ. 63, 500–513. doi: 10.1080/1034912X.2016.1144873
Gutiérrez Ángel, N., Mercader Rubio, I., Trigueros Ramos, R., Oropesa Ruiz, N. F., García-Sánchez, J. N., and García Martín, J. (2022). Digital competence, use, actions and time dedicated to digital devices: repercussions on the interpersonal relationships of Spanish adolescents. Int. J. Environ. Res. Public Health 19:10358. doi: 10.3390/ijerph191610358
Haridusinnovatsiooni Keskus (2022). Kooliuuring 2022. Available at: https://www.tlu.ee/kooliuuring#kooliuuring-2022. (Accessed July 4, 2023)
Hillman, J. (2022). Survey Data Quality: The 4 Factors that Matter Most to Researchers. Available at: https://www.prolific.co/blog/survey-data-quality-factors-that-matter-to-researchers. (Accessed July 4, 2023)
Hoover, J. , (2009). Differentiating Learning Differences from Disabilities: Meeting Diverse Needs through Multi-Tiered Response to Intervention. US, New Jersey: Pearson.
Horizon, J. (2020). Research and innovation. Available at: https://research-and-innovation.ec.europa.eu/funding/funding-opportunities/funding-programmes-and-open-calls/horizon-2020_en. (Accessed July 6, 2023)
Karademir, A. C., and Saracaloglu, A. S. (2013). Sorgulama becerileri olceginin gelistirilmesi: gecerlik ve guvenirlik calismasi. Asian J. Instr. 1, 56–65.
Karakose, T., Tülübaş, T., and Papadakis, S. (2022). Revealing the intellectual structure and evolution of digital addiction research: an integrated bibliometric and science mapping approach. Int. J. Environ. Res. Public Health 19:14883. doi: 10.3390/ijerph192214883
Király, O., Potenza, M. N., Stein, D. J., King, D. L., Hodgins, D. C., Saunders, J. B., et al. (2020). Preventing problematic internet use during the COVID-19 pandemic: consensus guidance. Compr. Psychiatry 100:152180. doi: 10.1016/j.comppsych.2020.152180
Kolnes, M., and Konstabel, K. (2018). Tugispetsialistide Arvu ja Vajaduse Hindamine. Available at: https://www.innove.ee/wp-content/uploads/2018/05/Tugispetsialistide-analuusi-aruanne_UT_Innove.pdf. (Accessed July 4, 2023)
Lawrence, S., and Sathiyaseelan, A. (2019). How children perceive their disability in learning? J. Hum. Soc. Sci. 24, 55–60.
Macintyre, C., and Deponio, P. (2003). Identifying and Supporting Children with Specific Learning Difficulties. London & New York: Routledge Falmer.
Meng, S.-Q., Cheng, J.-L., Li, Y.-Y., Yang, X.-Q., Zheng, J.-W., Chang, X.-W., et al. (2022). Global prevalence of digital addiction in general population: a systematic review and meta-analysis. Clin. Psychol. Rev. 92:102128. doi: 10.1016/j.cpr.2022.102128
National Audit (2020). National Audit Office: In a Quarter of Estonian Schools and a Third of Kindergartens, Children Do Not Receive Educational Support Services. 3011.2020. Available at: https://www.riigikontroll.ee/Suhtedavalikkusega/Pressiteated/tabid/168/ItemId/1306/View/Text/amid/557/language/en-US/Default.aspx. (Accessed July 4, 2023)
OECD (2018). PISA special educational needs feasibility study. EDU/PISA/GB(2018)22. Available at: https://www.oecd.org/pisa/pisaproducts/PISA-Special-Education-Needs-Feasibility-Study.pdf. (Accessed July 4, 2023)
Okely, A. D., Ghersi, D., Loughran, S. P., Cliff, D. P., Shilton, T., Jones, R. A., et al. (2022). A collaborative approach to adopting/adapting guidelines. The Australian 24-hour movement guidelines for children (5-12 years) and young people (13-17 years): an integration of physical activity, sedentary behaviour, and sleep. Int. J. Behav. Nutr. Phys. Act. 19, 1–21. doi: 10.1186/s12966-021-01236-2
Ramberg, J., and Watkins, A. (2020). Exploring inclusive education across Europe: some insights from the European agency statistics on inclusive education. Res. Educ. 6, 85–101. doi: 10.32865/fire202061172
Rijumol, K. C., Thangarajathi, S., and Ananthasayanam, R. (2011). Factor analytic study of cognitive processing and self perception of learning disabilities among the elementary inclusive school children. J. Educ. Psychol. 5, 32–38. doi: 10.26634/jpsy.5.1.1496
Rothman, H. R., and Cosden, M. (1995). The relationship between self-perception of a learning disability and achievement, self-concept and social support. Learn. Disabil. Q. 18, 203–212. doi: 10.2307/1511043
Sakiz, H., Sart, Z. H., Börkan, B., Korkmaz, B., and Babür, N. (2015). Quality of life of children with learning disabilities: a comparison of self-reports and proxy reports. Learn. Disabil. Res. Pract. 30, 114–126. doi: 10.1111/ldrp.12060
Schults, A., Kivirähk, T., Plado, K., and Häidkind, P. (2018). Hariduslike erivajaduste määratlus ja kaasav haridus. E. Rmt Krull (Toim.) Pedagoogilise Psühholoogia Käsiraamat (615–672). Tartu: Tartu Ülikooli Kirjastus.
Seema, R., Heidmets, M., Konstabel, K., and Varik-Maasik, E. (2022). Development and validation of the digital addiction scale for teenagers (DAST). J. Psychoeduc. Assess. 40, 293–304. doi: 10.1177/07342829211056394
Sherer, J. (2023). Internet Gaming. US. Washington, DC: American Psychiatric Association Available at: https://www.psychiatry.org/patients-families/internet-gaming. (Accessed July 4, 2023)
Tammets, K., Ley, T., Eisenschmidt, E., Soodla, P., Sillat, P.J., Kollom, K., et al. (2021). Eriolukorrast Tingitud Distantsõppe Kogemused ja Mõju Eesti Üldharidussüsteemile. Säilenõtke Eesti Kooli Aluseks on Tugev Koostöö ja Mitmekülgne Õppimiskultuur. Tallinn. Available at: https://www.hm.ee/sites/default/files/documents/2022-10/tlu_raport_distantsope_yldharidus_2810.pdf. (Accessed July 4, 2023)
Veni, K. R., and Merlene, A. M. (2022). Self-perception and psychological well-being as determinants of classroom behavior of students with and without learning disability. J. Indian Assoc. Child Adolesc. Ment. Health 18, 158–166. doi: 10.1177/09731342221122840
Westwood, P. (2007). Commonsense Methods for Children with Special Educational Needs. London & New York: Routledge.
Yildiz, A. (2021). The relationship between secondary education students’ digital addiction levels and their inquiry skills. Res. Pedagogy 11, 151–164. doi: 10.5937/IstrPed2101151Y
Keywords: digital addiction, learning difficulties, screen time, inclusive education, survey, outliers
Citation: Seema R and Varik-Maasik E (2023) Students’ digital addiction and learning difficulties: shortcomings of surveys in inclusion. Front. Educ. 8:1191817. doi: 10.3389/feduc.2023.1191817
Edited by:
Brahm Norwich, University of Exeter, United KingdomReviewed by:
Judit García-Martín, University of Salamanca, SpainLynne Sanford Koester, University of Montana, United States
Copyright © 2023 Seema and Varik-Maasik. This is an open-access article distributed under the terms of the Creative Commons Attribution License (CC BY). The use, distribution or reproduction in other forums is permitted, provided the original author(s) and the copyright owner(s) are credited and that the original publication in this journal is cited, in accordance with accepted academic practice. No use, distribution or reproduction is permitted which does not comply with these terms.
*Correspondence: Riin Seema, c2VlbWFyaWluQGdtYWlsLmNvbQ==