 Natalya Matveeva
 Lea Dorel2
94% of researchers rate our articles as excellent or good
Learn more about the work of our research integrity team to safeguard the quality of each article we publish.
Find out more
ORIGINAL RESEARCH article
Front. Educ. , 22 June 2023
Sec. Digital Learning Innovations
Volume 8 - 2023 | https://doi.org/10.3389/feduc.2023.1190150
The establishment of scientific foundations for the integration of information technologies and innovative educational processes in student learning activities entails the necessity of creating a basis for transitioning from information processes to information technologies. The research aims to study the effectiveness of innovative information technologies in higher education and assess student involvement in using innovative information technologies. The study relies on the experimental survey method to assess respondents’ involvement in the use of innovative information technologies. In addition, the modeling method was used to increase students’ motivation to study through visualization and other modern technologies. A training program based on visualization and innovative information technologies aimed to study their impact on the teaching process in higher education was developed. The study results show that visualization technologies improve students’ intrinsic motivation to learn. The practical significance and further research prospects are due to the possibility of applying the training program developed in the study in higher education. The program can also become the basis for developing new training programs to study other subjects as it is not tied to studying a certain discipline and requires only computer skills.
Visual information is perceived faster and more directly, as evidenced by the trend toward the mass use of infographics and data visualization tools in pedagogical technologies (Velichová, 2018). Mathematics in higher education is increasingly often taught based on the STEM methodology, which involves direct participation in experiments, gaining knowledge through personal experiments, and solving real problems (Mystakidis et al., 2022). Occasionally, a dearth of laboratories and apparatuses hampers the complete realization of this pedagogical approach. In this case, visualization can be used as follows: pre-made infographics on the topic being studied; machine visualization and 3D modeling of mathematical models, phenomena, formulas, and educational materials in the form of videos and three-dimensional cartoons (a higher level of memorization and understanding); students can perform tasks aimed at the visualization of educational materials (Aldalalah et al., 2019).
Innovative information technologies that can be used in the learning process are three-dimensional visualization and animation, the ability to view educational materials on mobile devices and online learning platforms that are widely used in universities and colleges, visual presentations made by students, etc. Today schoolchildren are characterized by clip thinking. Consequently, individuals tend to experience greater ease in assimilating information when it is presented visually, such as through diagrams, tables, videos, or audio recordings. These allow the presentation of educational materials graphically, which contributes to students’ creative thinking development (Nardi, 2014; McLachlan and Webley, 2021). The possibilities of using symbols and diagrams to teach mathematics have also been studied (Presmeg, 2020).
Visualization technologies are also commonly used in law studies (McLachlan and Webley, 2021). For example, the effectiveness is characterized by the use of contract comics in law teaching, which visualizes laws. Information technologies make it possible to focus on the individual approach and ensure the variability of the educational process (Maharg, 2016). Individualized learning, implemented with the help of a computer, takes into account each student’s knowledge and tracks their academic performance. The interactive and innovative nature of this training promotes contact between a teacher and a student while improving information perception and cognition skills.
The pandemic has intensified the use of information technologies in education (Dwivedi et al., 2020). Distance learning was implemented with the help of special software that allows theoretical material visualization through screen sharing (Schneider and Council, 2021). As an illustration, Google Classroom facilitates the establishment of a virtual educational environment, wherein each subject can be taught individually, granting access to both teachers and students (Ramadhani et al., 2019). The Google Classroom platform offers functionalities enabling instructors to upload educational resources, pre-recorded videos, audio tracks, and design assessments. Nevertheless, it should be noted that this platform falls short of providing a comprehensive video-based solution. Another group of online learning platforms (Zoom, Skype, and Google_Meet) has an advantage in the context of educational material visualization through presentations and online classes (Katz and Kedem-Yemini, 2021). There are also online learning platforms (Coursera and edX) that offer various online courses and can be used to visualize theoretical materials (Mutiga and Hullinger, 2021). For example, when teaching mathematics, the Desmos application is used. This is a graphical calculator for calculating data, and drawing pictures (Liang, 2016; King, 2017). Also, the 01math platform hosts tasks of various complexity levels while adapting to students’ knowledge. Thus, the platform advantage is the focus on personalized learning (Hosseini et al., 2021). The Moose Math application is aimed at improving practical mathematical skills, which makes it possible to study mathematics in a playful way (Laato et al., 2020).
In the educational process, visualization contributes to the development of professional competencies and technical skills, as well as memory, imagination, understanding, and critical and strategic thinking (Wang et al., 2019). Modern trends in higher education institutions (HEIs) are associated with providing students with teaching methods that can lead to skills development and foster their creative and individual thinking (Akhmedov, 2022). Simultaneously, educators should be knowledgeable about innovations in communication and information technologies, which can be subsequently utilized in various research areas. Concurrently, the implementation of new technologies in course delivery grants HEIs competitive advantages.
The primary challenge of implementing innovative information technologies is the financial constraints and limited government support for higher education institutions. These factors have led to the search for innovative means of survival and attracting new students to the classroom as potential users (Szymkowiak et al., 2021). The integration of innovative communication technologies utilizing ICT through computers, mobile phones, and telephone lines for access and management of electronic data on the Internet enables active student engagement in the learning process, provides lifelong learning opportunities, and grants a competitive advantage to institutions that have not fully realized the possibilities offered (Castro and Tumibay, 2021). Higher education institutions have the potential to incorporate ICT for effective communication and promotion of their services, aiming to attract both current and prospective audiences. Additionally, integrating innovative technologies enables these institutions to provide cutting-edge tools and resources for their educational processes (Miranda et al., 2021). While virtual and online learning experiences cannot fully replace the benefits of physical engagement, they can greatly enhance the overall learning journey. To foster a culture of innovation in higher education, it is crucial for institutional leadership and organizational structures to actively support and encourage such initiatives (Susilawati et al., 2021). However, upon reviewing the existing literature, it becomes evident that there is a scarcity of studies examining the effectiveness of innovative information technologies, particularly in visualization, within the domains of mathematics, pedagogy, and legal sciences in higher education. Future research endeavors are anticipated to provide deeper insights into this subject matter, addressing existing gaps and enhancing our understanding of its broader implications.
The rapid development of science and technology and the pandemic require the use of modern teaching methods and approaches. In particular, this relates to mathematics education (Bray and Tangney, 2017). Traditional methods (writing notes and learning textbook paragraphs, followed by their retelling) have become outdated and lost their effectiveness in modern realities. Today, visualization and innovative information technologies are being updated. They make it possible to present educational materials as widely as possible and to visualize them to facilitate students’ learning (Martín-Gutiérrez et al., 2017). Applications such as Zoom, Discord, WC Online, Blackboard Collaborate Ultra, GoBoard, Google Hangouts, Skype, Penji, and BrainCert (Johns and Mills, 2021) are used to teach several disciplines online. The advantages of online learning encompass multiple facets, including the opportunity for learners to revisit lectures on multiple occasions, a concentrated emphasis on the cultivation of practical skills, and the utilization of visual aids to enhance the comprehension and assimilation of educational materials. Modern online learning platforms used in higher education combine education management systems and applications such as Moodle, Blackboard, Canvas, Brightspace, and others. Thus, the educational material can be presented in the form of text, graphics, and video (Trenholm and Peschke, 2020).
Researchers from Bangladesh proposed the use of the flipped classroom method. According to this approach, theoretical material is studied as homework, while classroom classes are aimed at the practical application of the knowledge gained (Al Mamun et al., 2022). The flipped classroom model is also considered in the context of the Massive Open Online Courses (MOOCs) platform, which hosts online learning courses (Wang and Zhu, 2019). The advantage of both models is their focus on practice, the availability of an online assessment, and the possibility of uploading video and audio content. Vietnamese researchers highlight the impact of the Industry 4.0 model on higher education, which ensures its informatization, digitalization, and expansion of functionality (Tri et al., 2021).
Researchers point to the effectiveness of virtual reality in learning by implementing an interdisciplinary approach in the context of the Science, Technology, Engineering, and Mathematics (STEM) model (Mystakidis et al., 2022). The STEM model is distinguished by its exploration of subjects across four distinct knowledge domains accompanied by the cultivation of professional skills and competencies encompassing critical thinking, academic proficiency, and other relevant attributes (Loyalka et al., 2021). Regarding STEM education, the examination of mathematics through an experimental framework is given due consideration (Maass et al., 2019). Moreover, this study examines the utilization of animation, drawings, and videos as instructional aids in university-level subjects, emphasizing the imperative to integrate contemporary technologies, particularly visualization, into the learning process (Salim and Tiawa, 2015). STEM education makes it possible to improve mathematical literacy, technological pedagogical knowledge, and mathematical thinking skills (Yıldırım and Sidekli, 2018). An illustrative instance is the Geogebra application, renowned for its remarkable efficacy in facilitating the study of mathematics. The software allows users to design 3D drawings without using rulers and compasses (Celen, 2020). The SimReal+ interactive application is designed to visualize educational materials with the help of drawings, animations, diagrams, and other interactive technologies (Hadjerrouit and Gautestad, 2019). In addition, the SimReal+ application contains a graphical calculator, video tutorials, broadcasting capabilities, and video and interactive simulations for teaching mathematics (Hadjerrouit, 2017).
Artificial intelligence (AI) is used to visualize theoretical material (Yu, 2020) in higher education. This contributes to the expansion of teaching methods taking into account an individual approach to each student’s knowledge level and the use of information technology (Surden, 2019; Hwang and Tu, 2021). Chinese researchers have developed an education system based on the VisMis visualization platform (Zhu et al., 2018). Researchers from Colombia have studied the features of using visualization in teaching gifted students in the 3D computer environment (Benedicto et al., 2015).
Researchers from Norway have studied the possibilities of artificial intelligence and emotional intelligence technologies in legal education (Carrel, 2019). The findings demonstrate that information technologies play a dual role, not only aiding students in comprehending laws but also significantly enhancing their professional competencies and skills, particularly in the realms of decision-making and problem-solving. It is highlighted that visualization increases students’ motivation to learn. Additionally, it facilitates the rapid acquisition of theoretical knowledge and fosters a dynamic interplay between theory and practice, prioritizing the practical application of the acquired information. The advantages of the training course are an adequate pace of work, simplicity, interaction, etc. Researchers from Israel have considered visualization effectiveness in mathematics in the context of self-efficacy and problem-solving skills (Kohen et al., 2022).
The article aims to study the effectiveness of innovative information technologies, in particular visualization, for teaching mathematics, pedagogical education, and legal sciences in higher education. The study objectives are as follows: based on a survey, our aim was to identify students’ involvement in innovative information technologies, to compare indicators among students of 1–3 years of study, analyze students’ motivation to study and the impact of visualization on increasing motivation, and to develop a training program based on innovative information technologies.
The study involved 62 students from three educational institutions: Kazan Federal University (Elabuga, Russia), Financial University under the Government of the Russian Federation, and a teacher training college located in Israel (Kfar Saba) (a total of 186 students). The sample was formed through a random selection process, taking into account the stipulated criteria of equal representation among male and female participants, as well as individuals from the 1st, 2nd, and 3rd year of study from each respective university Students were selected at random and invited to participate. In the event of refusal, an offer was extended to other students, following a similar random sampling procedure. This process was repeated until the sample was fully formed. If we consider the total number of students in each university and college across the 1–3 years of study, the acceptable sampling error should not exceed p = 4.87. In other words, as long as the sample falls within these limits, it can be deemed representative of the study.
There were three stages in the study. In the first stage, a training program “Innovative information technologies in Education” was developed (Figure 1). The course “Innovation and Information Technologies in the Learning Process” was exclusively undertaken by participants assigned to the experimental group. The only requirement was computer skills, as during the training program development, the emphasis was not on the subject the students studied but on teaching innovative information technologies.
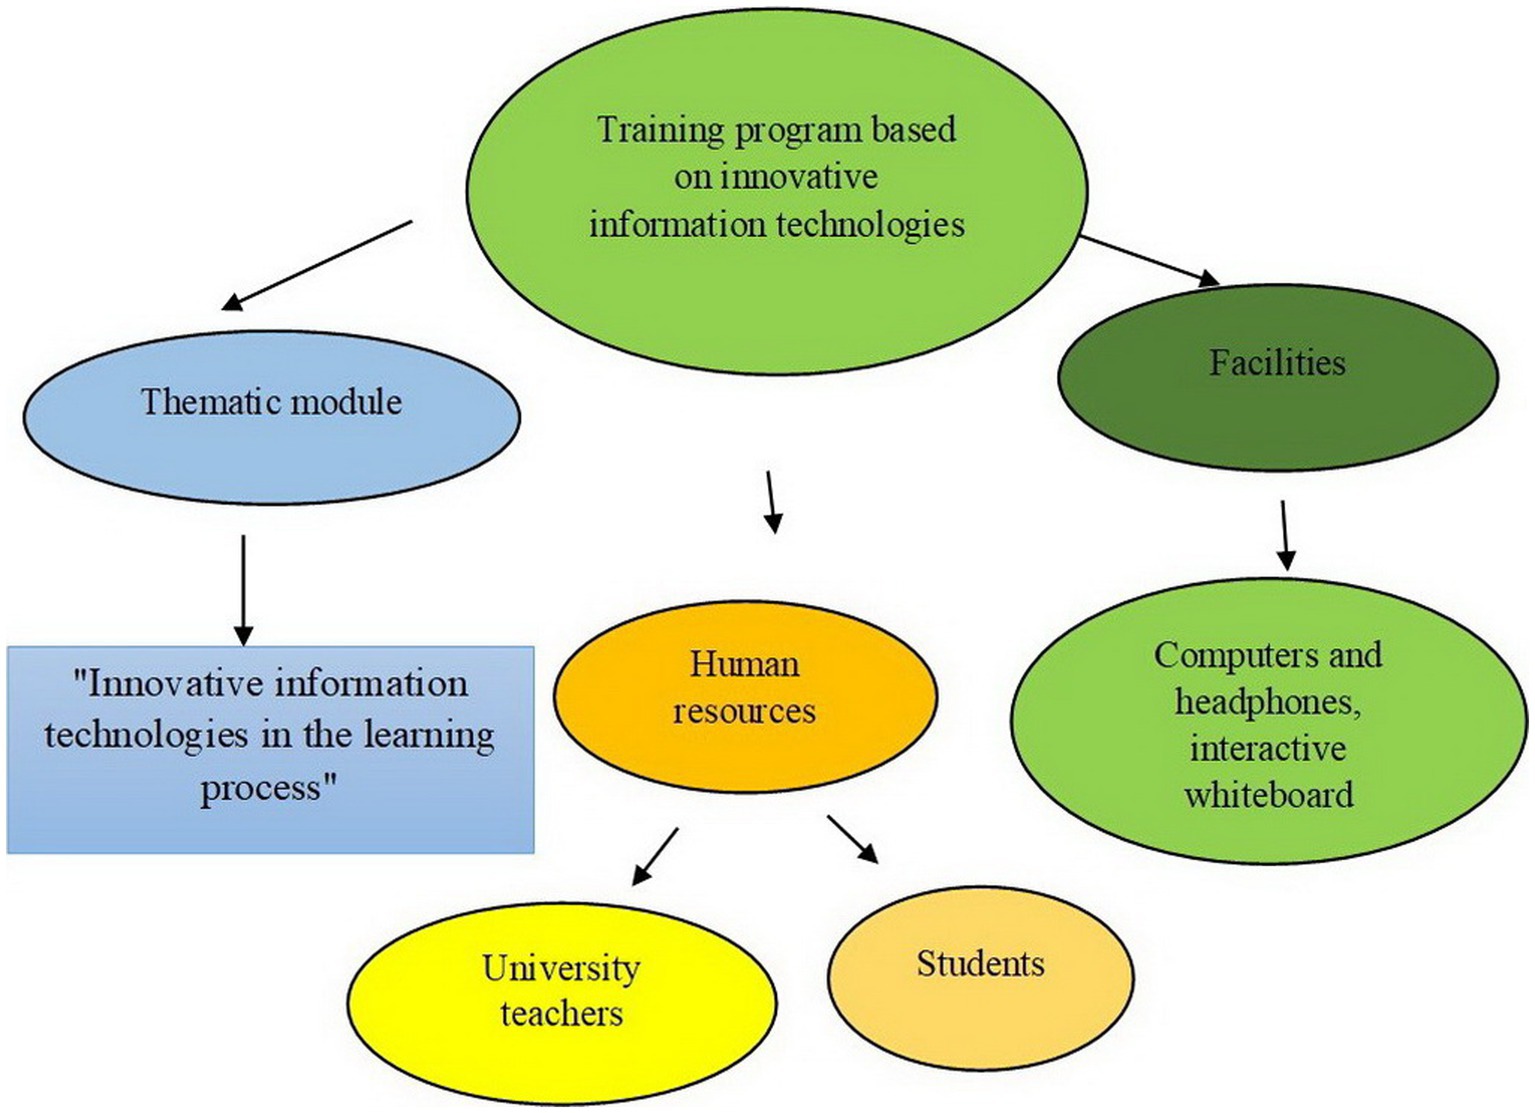
Figure 1. Structure of the training program based on innovative information technologies.
The training course consisted of the thematic module “Innovative and information technologies” divided into classes aimed at familiarizing students with modern technologies, developing professional competencies, and increasing motivation to learn (Table 1). To partake in the training program, respondents merely required access to a computer to view educational materials and videos and utilize learning platforms. The human resources involved in the learning process are the students (the respondents) and the university teachers participating in the experiment. All classes were conducted in university classrooms. For convenience, the students were divided into several groups of 10–15 people. The training process took place over 2 weeks. The educational material aimed to familiarize learners with innovative information technologies and the possibilities of visualization in the learning process.
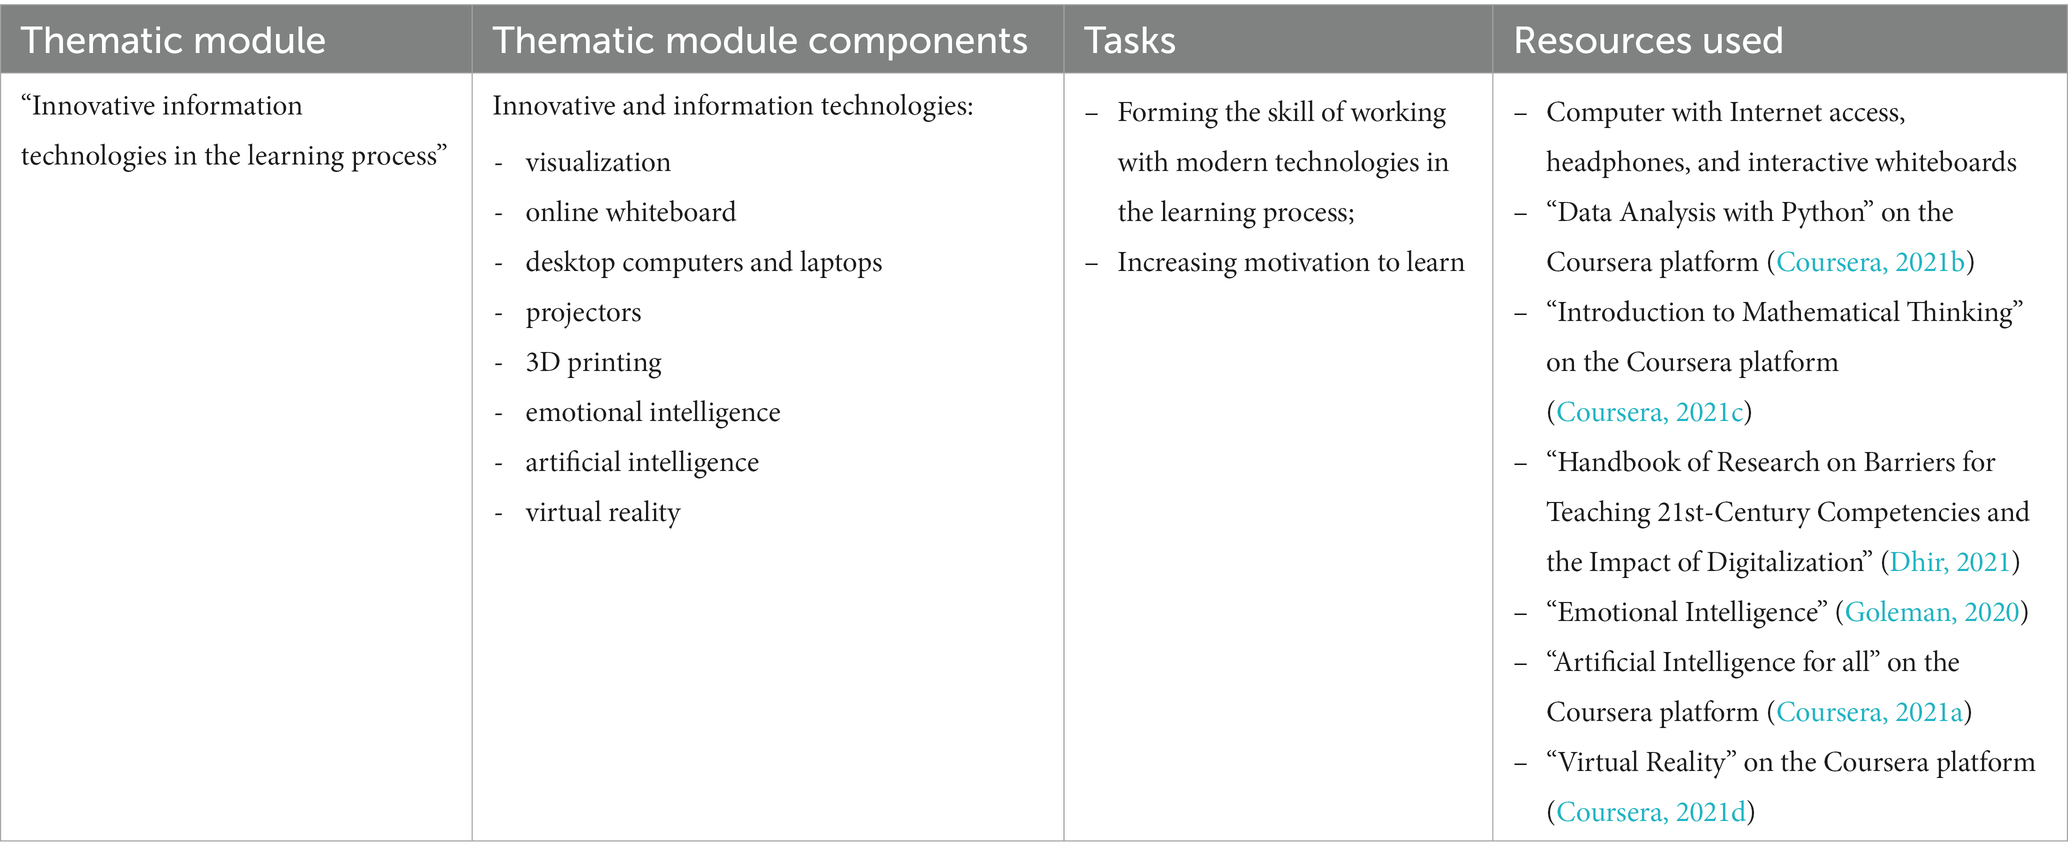
Table 1. Content of the training program based on innovative information technologies.
The training process by the program developed took place at the second stage of the study. The training program was uploaded on the Moodle distance learning platform. Access to the program was given to teachers and all students. To get acquainted with the program and view all its components, it was necessary to register with a Google account. An invitation to join the program and an access code was emailed to everyone who entered their data. To log in to the system, each teacher or student was required to enter the email address specified during registration and the access code. The training program, the educational material, and links to all websites for familiarization with innovative information technologies or downloading applications needed for training were posted on the platform page.
The study relies on the experimental survey method to assess respondents’ involvement in the use of innovative information technologies. In addition, the modeling method was used to increase students’ motivation to study through visualization and other modern technologies.
The survey was conducted immediately before the intervention with a training course (pre-test) and immediately after the end of this course (post-test). In this case, two tests were carried out. The first is The Self-Regulation Questionnaires Learning Self-Regulation Questionnaire (SRQ-L) (Williams and Deci, 1996; Black and Deci, 2000) aimed at identifying extrinsic or intrinsic motivations and its strength for adult students. This method of studying intrinsic motivation and various types of motivation is widely known and often used in practice and academic research. Its advantage is that it has several specialized and well-validated robust options for classrooms, schools, universities, or business applications. The second test asked participants to rate: “Does the use of visualization affect motivation to learn?” on a 5-point Likert scale (where 1 point was “does not affect motivation at all” and 5 points was “very strongly motivates”). To determine the presence of statistically significant changes in the results before and after the intervention and the presence of differences between the control and experimental groups, the Student’s t-test was used. To check the normality of the distribution in the sample, the Shapiro–Wilk test was used for the pre-test results in the experimental, control group, and the entire sample as a whole. The results of both types of tests were checked by a two-tailed Student’s t-test. Testing was carried out in the classroom after the completion of classes with the direct participation of assistants trained by the researchers to control and assist in the test performance.
To establish the presence of consistent changes in the quality of students’ motivation, Pearson’s direct correlation compared the results of the pre-test and post-test SRQ-L for the same participants. As per the researchers’ observations, the presence of a correlation signifies a connection between the changes in individual student outcomes. This correlation, when examined alongside a t-test, may reveal statistically significant differences; however, it also indicates a consistent alteration in the motivation levels of a significant number of students. A correlation between test score changes for a large proportion of students will show such a change. A study was also made on the correlation between the subjective assessment of students during the post-test and the results of the SRQ-L. This correlation was supposed to show the awareness and accuracy of students’ self-assessment, or vice versa, and the desire to indicate a positive result in the real absence of it.
In the third stage, a survey was conducted. First, the respondents were sent a Google form questionnaire, which consisted of the following questions: “Which teaching methods are preferred in your educational institution? (traditional/modern);” “Are visualization and innovative information technologies used in the classroom?” “Assess your motivation to learn (high, medium, or low);” “Does the use of visualization affect motivation to learn?” “What motivation factors, do you think, affect the learning process?.” There was no time limit to complete the questionnaire.
The respondents’ answers were processed in Statistica and Microsoft Excel; charts reflecting each question indicator were created.
The experiment was conducted in compliance with all ethical standards and anonymity; there were no requirements to provide confidential information (first name, last name, place of residence, etc.). The respondents gave their written consent to conduct the experiment and process data. The survey participants were asked to indicate their year of study at the time of the experiment. The integration of a new academic discipline into the experimental group was meticulously planned and incorporated into the class schedule to ensure minimal disruption to the ongoing educational process. The use of the experimental intervention did not adversely affect participants’ academic performance or interfere with their studies.
The normality of the distribution by the Shapiro–Wilk method is shown for the experimental group where W = 1.783; for the control group, W = 1.567; for the entire sample, W = 1.271. Thus, it should be recognized that within the sample as a whole and in each of the groups (control and experimental), the distribution is close to normal, and the Student’s parametric t-test can be applied in this case. A comparison of the results of the test of internal motivation for students before the intervention showed no statistically significant differences between the groups (p = 1.256); the average values are within the standard deviation. At the same time, after the intervention, the post-test shows the presence of significant differences (p = 0.001) (Table 2). This result allows us to suggest that the use of the proposed course really increased the intrinsic motivation for learning as a result of gaining knowledge and skills in using tools and methods of information visualization. The comparison of the results of the experimental group pre- and post-test also demonstrates the presence of significant changes (p = 0.000) with a significant increase in the average test score (from 24.17 to 34.59 points out of the 49.00 maximum allowable). This indicates that the differences with the control group were not random because the changes in the experimental group are also significant (Table 2).
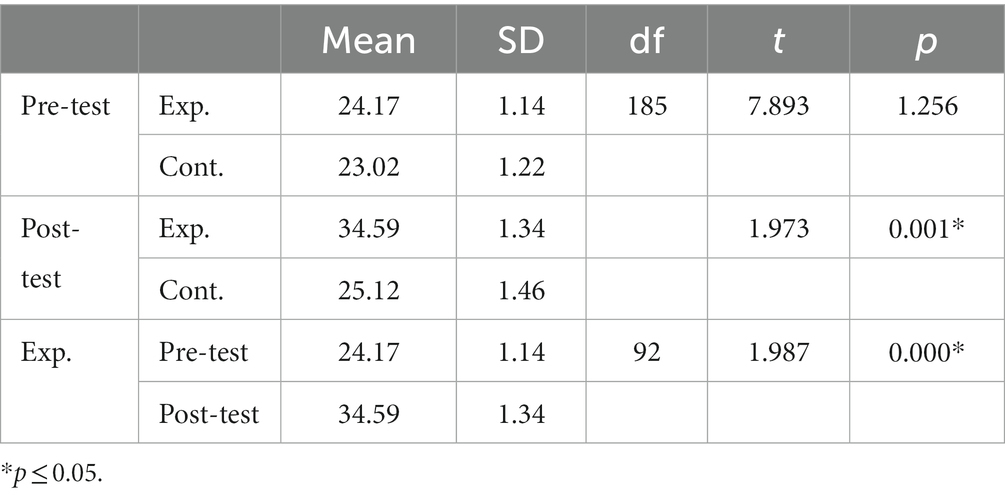
Table 2. Two-tailed student’s t-test results for pre- and post-test of SRQ-L comparisons.
The results of a survey with a subjective assessment of the impact of knowledge about visualization on learning motivation are similar to the results of the first test. The pre-test showed no statistically significant differences between the groups. Post-test indicates a statistically significant difference (p = 0.011). For the experimental group, the difference between the results of the subjective assessment of participants pre- and post-test also appears to be significant (p = 0.002) (Table 3). Thus, it can be said that the subjective assessment of the increase in motivation for learning with the development of knowledge and skills in information visualization also steadily increases significantly in the group that underwent such training (from 3.11 to 4.04 points out of the 5.0 maximum possible).
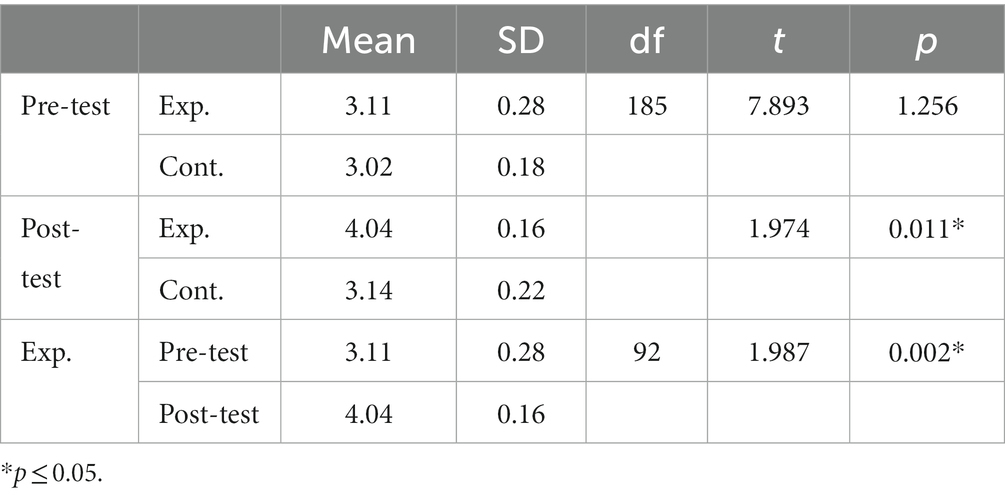
Table 3. The results of a two-tailed student’s t-test to compare the pre-and post-test of a survey on the subjective assessment of motivation (5-point Likert scale).
Pearson’s correlation between pre-and post-test results gives a value of r = 0.565 for the control group (medium correlation strength) and r = 0.861 (strong correlation) for the experimental group. The correlation between pre-and post-test results for the experimental group indicates an even stronger direct correlation, r = 0.941. This means that the majority of participants in the experimental group consistently increased the values of motivation. The comparison of post-test results for SRQ-L tests and subjective assessment of motivation shows r = 0.816. Based on the results, it can be concluded that there is a strong correlation between a more objective assessment through the SRQ-L test and a subjective assessment. In other words, students in the experimental group are cognizant of the change in their intrinsic motivation and comprehend its underlying source. Their assessment is not only the result of a desire to demonstrate performance improvement but may objectively correspond to it.
The figures show the descriptive statistics results for additional surveys. Figure 2 demonstrates the responses to the question “Which teaching methods are preferred in your educational institution? (traditional/modern).” A significant proportion of first-year (56%) and second-year (55%) students acknowledged the prevalence of traditional teaching methods, suggesting a lack of progress in the integration of innovative information technologies within contemporary higher education. Accordingly, 44% of first-year and 45% of second-year students mentioned a preference for modern teaching methods in their educational institutions. Among the third-year students, these figures are 51% (traditional) and 49% (modern).
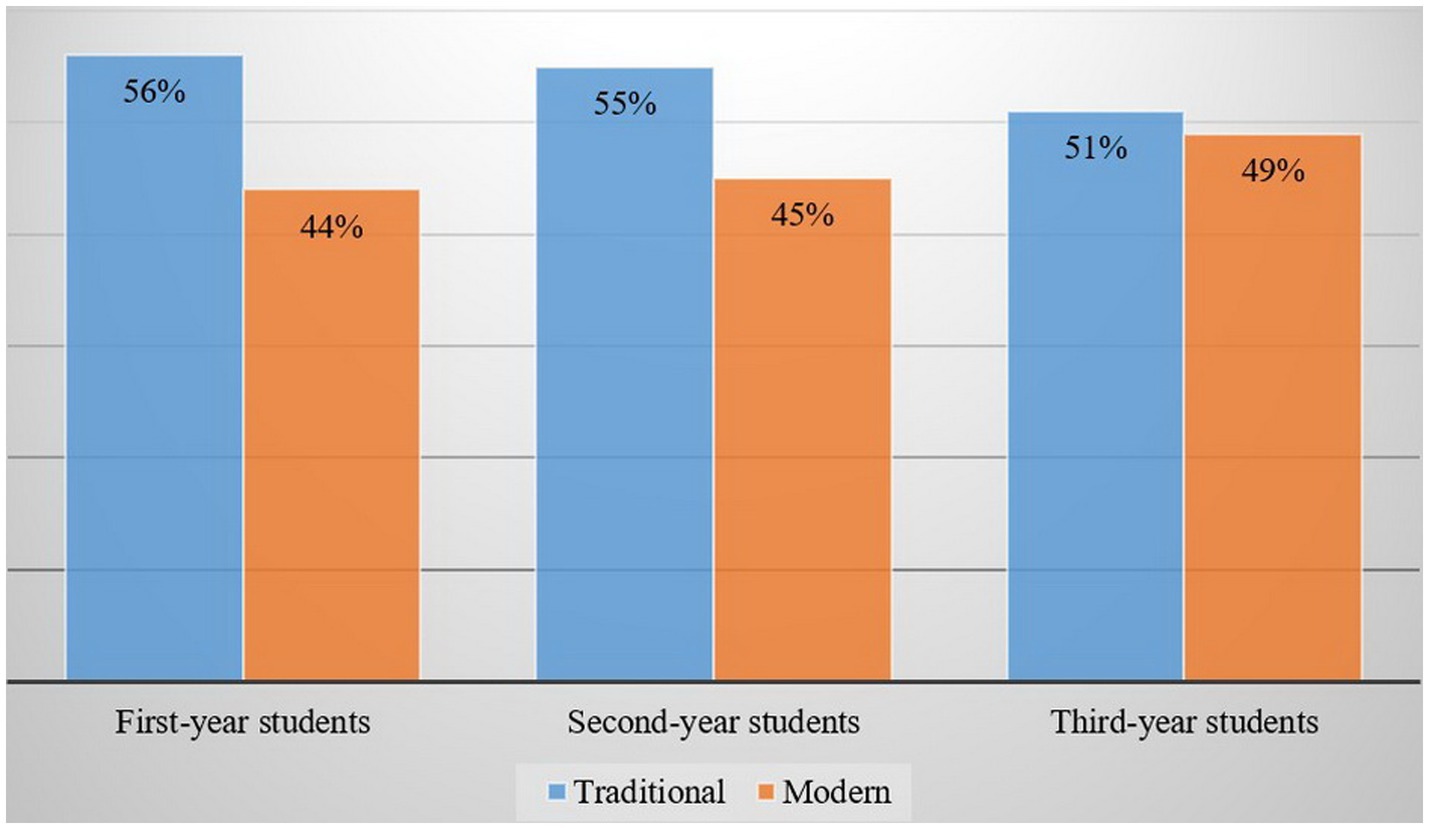
Figure 2. The responses to the question “Which teaching methods are preferred in your educational institution? (traditional/modern)”.
The respondents’ answers to the second question “Are visualization and innovative information technologies used in the classroom?” show that the majority of first-year (55%), second-year (53%), and third-year (57%) students selected the option of “Yes, but rarely” while the majority of fourth-year students (60%) ticked “Yes, often” (Figure 3). The “Yes, often” indicators among the first-, second-, and third-year students were as follows: 35, 34, and 33%, respectively.
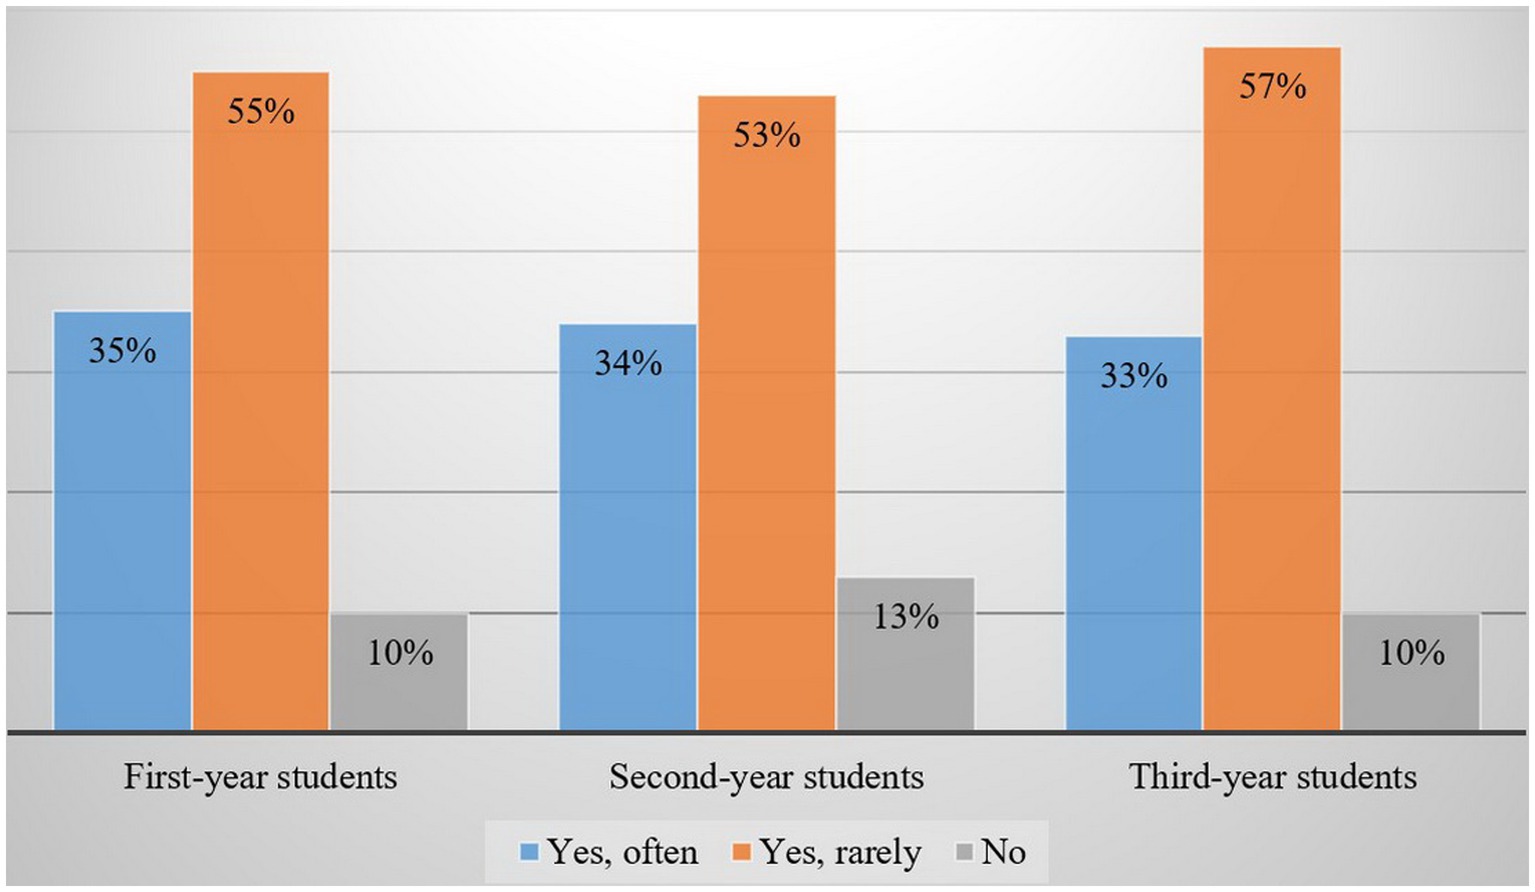
Figure 3. The respondents’ answers to the question “Are visualization and innovative information technologies used in the classroom?”.
Figure 4 shows the respondents’ answers to the question “Assess your motivation to learn (high, medium, or low).” The majority of first-year students (62%) assess their motivation to study as high. At the same time, motivation decreases in accordance with the year of study. A considerable portion of second-year (57%) and third-year (61%) students exhibit a predominantly moderate level of motivation. The other motivation indicators were as follows: 30% of first-year students have medium and 8% have low motivation; 23% of second-year respondents have high and 20% have low motivation; 30% of third-year students have high motivation and, accordingly, 9% have low motivation to study.
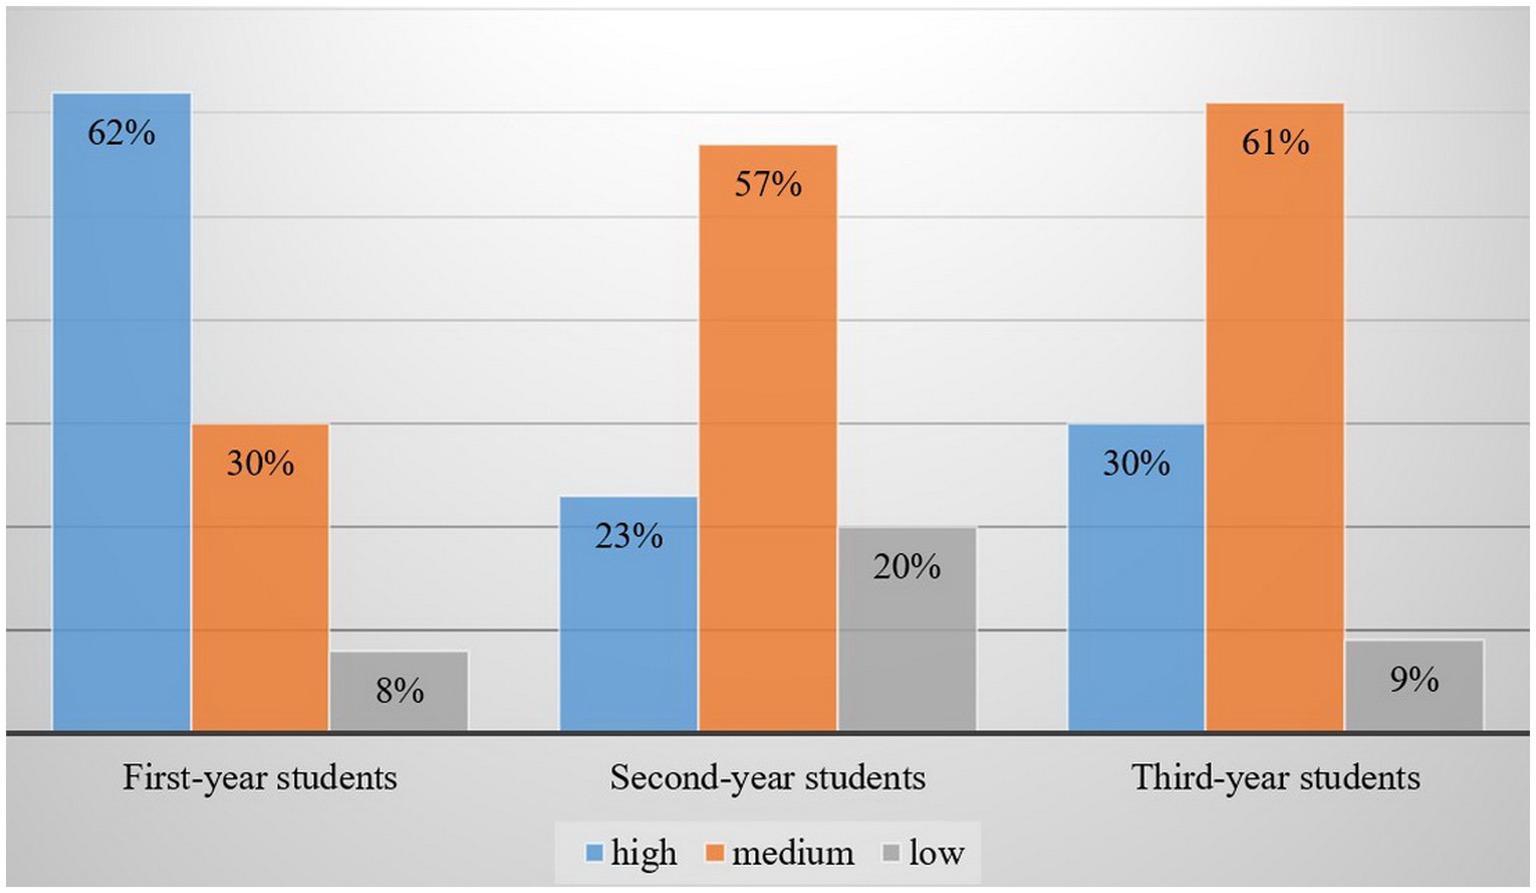
Figure 4. The respondents’ answers to the question “Assess your motivation to learn (high, medium, or low)”.
The results of the question “Does the use of visualization affect motivation to learn?” show that the majority of the respondents (first-year students – 65%; second-year students – 56%; third-year students – 50%) believe that visualization affects their motivation to learn (Figure 5). However, the “No” indicators were obtained: first-year learners – 35%; second-year learners – 44%; third-year learners – 50%.
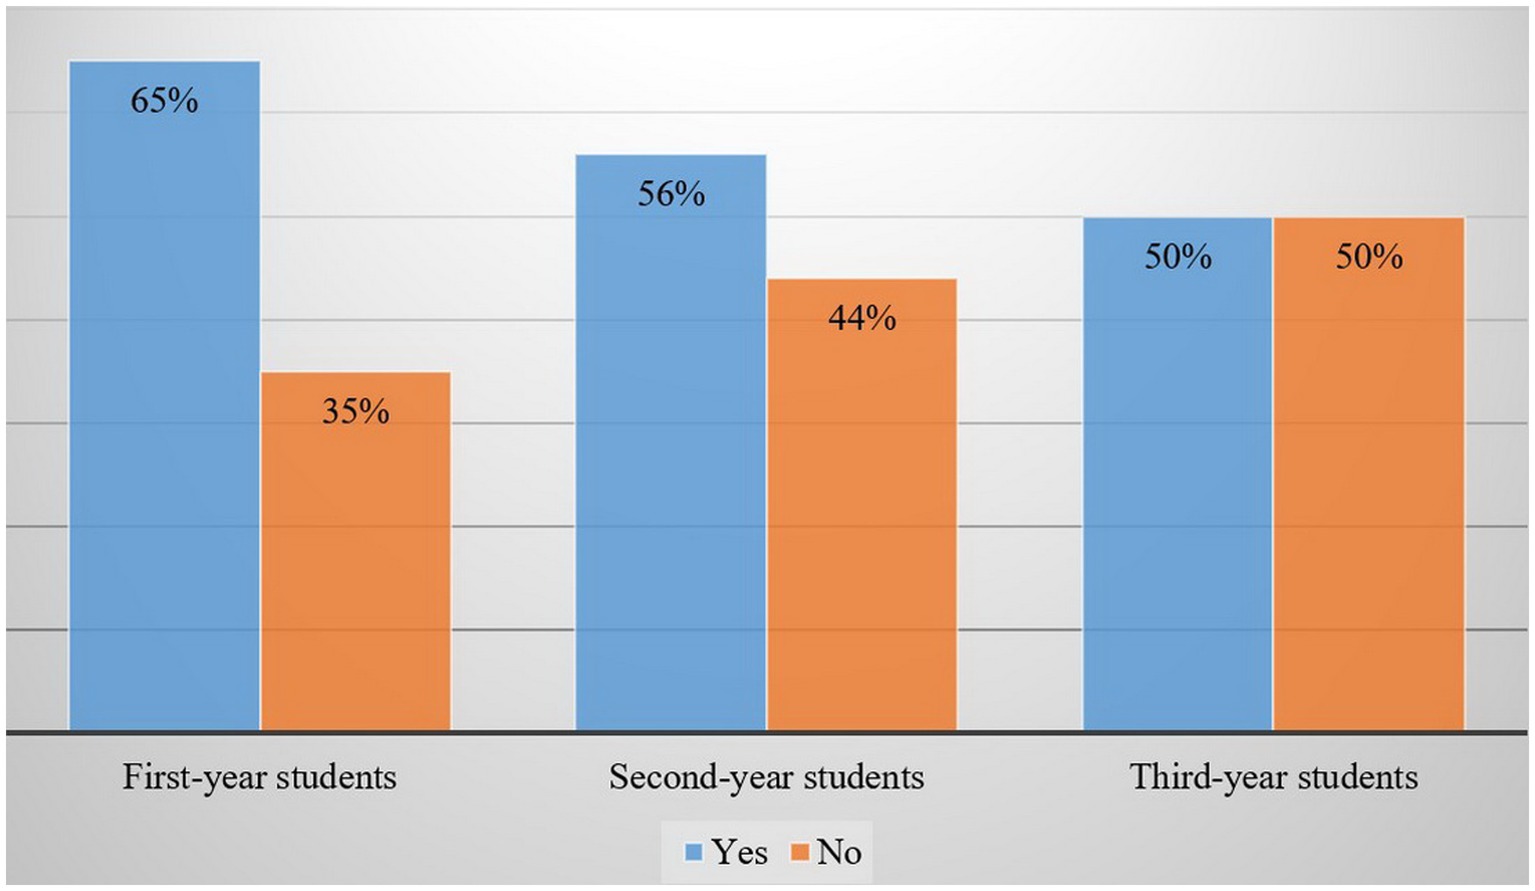
Figure 5. The respondents’ answers to the question “Does the use of visualization affect motivation to learn?”.
The respondents’ answers to the question “What motivation factors do you think affect the learning process?” are described in Figure 6. Among the first-year students, the most common answers were “self–development” (56%), “motivation” (43%), “interesting subjects” (38%), and “knowledge” (36%); the second-year students noted, “knowledge” (46%), “self-development” (49%), “motivation” (52%), and “diploma” (38%); third-year students indicated “application of knowledge in practice” (63%), “knowledge” (60%), “self-development” (52%), and “diploma” (37%).
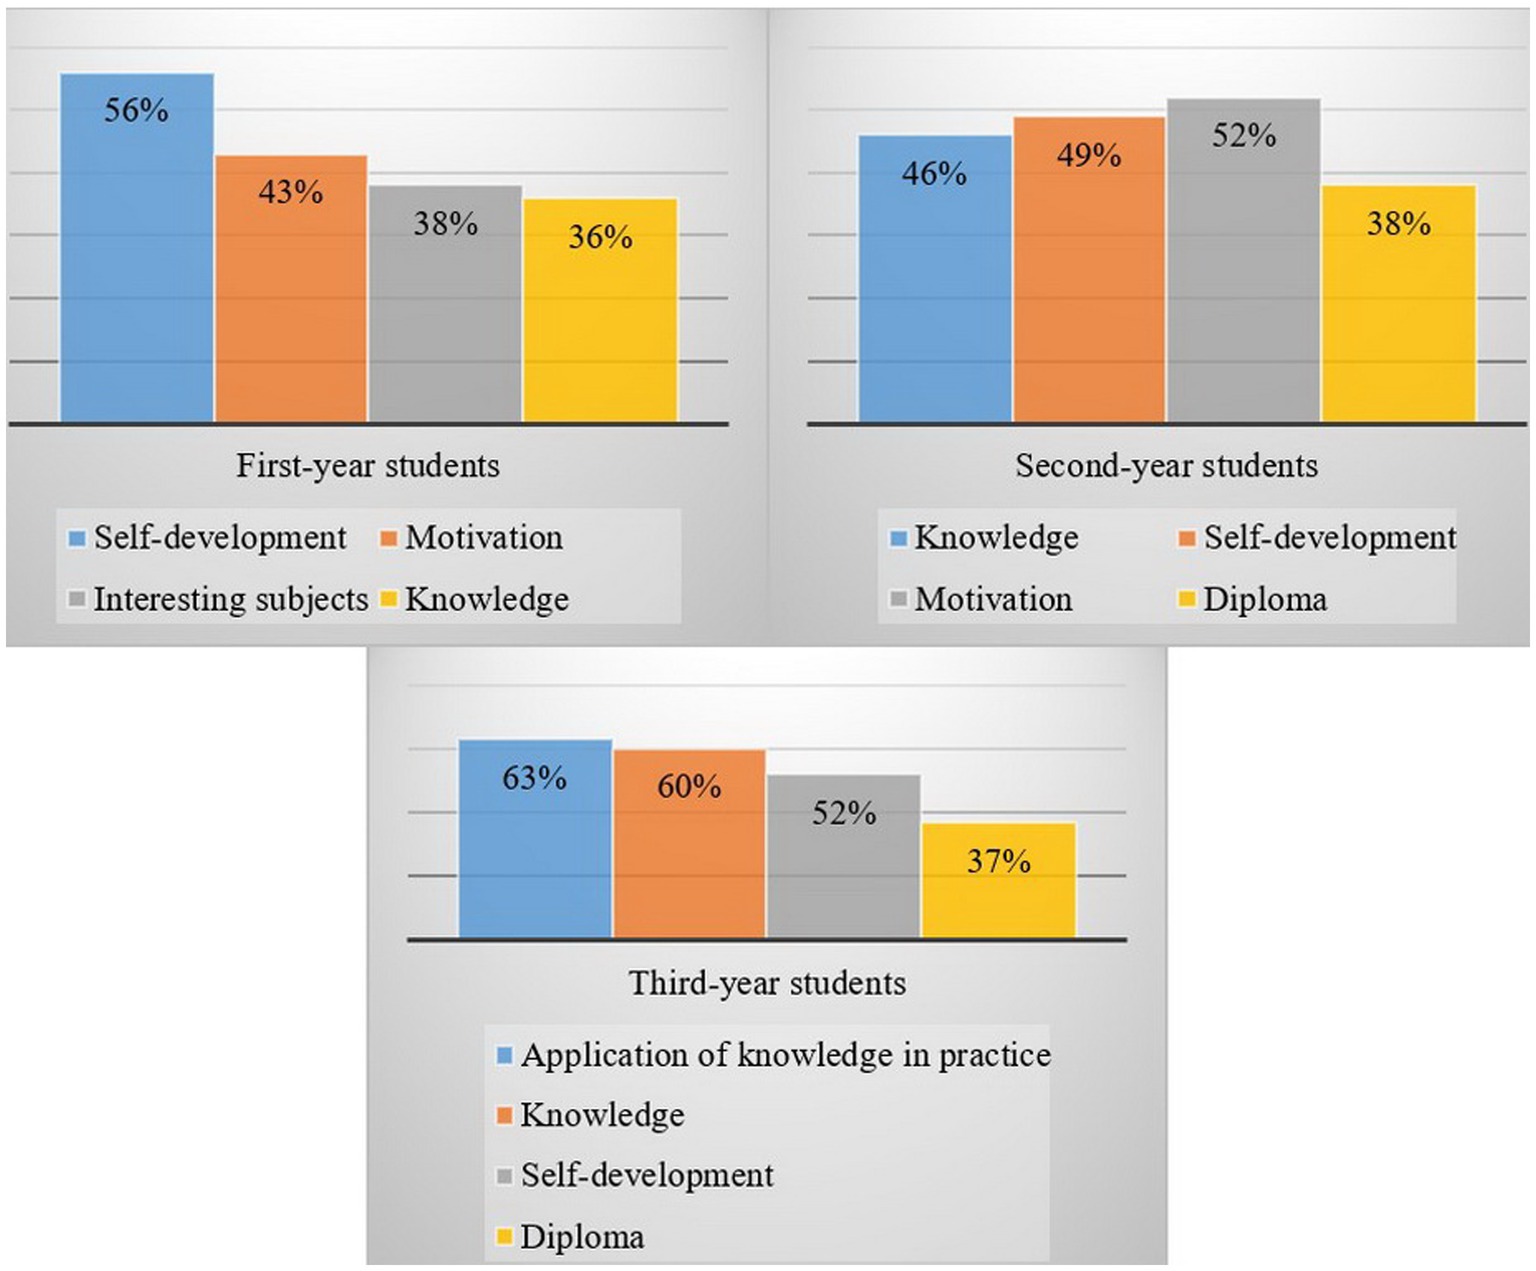
Figure 6. The respondents’ answers to the question “What motivation factors, do you think, affect the learning process?”.
The analysis of the results obtained shows the relevance of studying the effectiveness of innovative information technologies in education not only in China but also in other countries. For example, Turkish researchers studied the self-efficacy of teachers in the context of modern technology applications (Doğru, 2017). As a result, a self-efficacy scale was developed, and it was concluded that modern technologies are highly effective in training. This is consistent with the findings of the present study’s experiment.
The features of using modern technologies in legal studies were analyzed by Polish researchers (de Araújo, 2021). The results show that new technologies contribute to the development of information skills and professional competencies in law, in particular civil, family, corporate, and arbitration proceedings. The researchers noted that the ability to present information as well as current research increased motivation and engagement in law education.
The impact of information technologies on the management of computer science classes has been analyzed (Barinova et al., 2018). The research advantage is the study of the impact of modern technologies and information visualization on the effectiveness of the learning process, in particular, students’ academic performance. The effectiveness of information technologies in monitoring the learning process was confirmed. The described method can be applied not only in monitoring the study of computer science but also in other subject areas.
English researchers have studied the features of interactive visualization and personality-oriented education (Fırat and Laramee, 2018). Based on the analysis of the results, it was concluded that interactive visualization facilitates the perception of information and the educational process. It is preferable to classify potential resources for the study of modern technology applications in the learning process by thematic groups. There was a similar study in the USA, which confirmed the impact of interactive visualization on students’ motivation to study (Schweitzer and Brown, 2007). The researchers also described a method for involving students in the educational process—active learning based on visualization.
In Spain and the USA, self-organized maps (SOM) were developed to visualize theoretical materials (Qian et al., 2019). This approach stands out for its utilization of self-organized maps, which enhance the learning process, effectively save time, and aid in organizing and delivering information in a more accessible manner. SOM (Self-Organizing Map) is a machine learning technique that employs dimensionality reduction based on property similarities to visualize the relationships among materials in a multidimensional dataset. In this study, Self-Organizing Map (SOM) was employed to investigate the correlations among 21 material properties in a dataset consisting of more than 398 commercial materials. The trained SOM model was visualized using U-matrix maps, clustering maps, and heat maps. The clustering and heatmaps derived from SOM were employed to identify unique materials and establish correlations between material properties and the underlying material structure.
Many learners must cope with a visual barrier that they are not even aware of (Parzysz, 1988). The use of digital tools to investigate and study 3D objects could help students overcome visual obstacles. Komatsu and Jones (2020) reported that students with limited spatial vision managed to deal with mathematical problems using technological tools. In their study, they employed Dynamic Geometry Environments (DGE). The authors analyzed lessons with students from a secondary school (aged 14–15; 9th grade). As a result, they revealed that the incorporation of Dynamic Geometry Environments (DGE) helped students in their ability to generalize the concepts they had been taught. While initially unable to achieve generalization when using DGE, the authors later succeeded through a combination of paper, pencil, and innovative technologies. That is to say, the use of technological tools combined with adequate meditation by a teacher has an important role in closing gaps.
Chinese researchers studied the effectiveness of 3D printing in teaching mathematics and concluded that this type of visualization improves thinking skills and understanding of instructional materials (Sun and Li, 2017). The innovative teaching method was implemented during the study of geometry by students. Following a mathematical equation and the representation of the Möbius strip in MATLAB 3DMAX, and other software tools were utilized to create 3D models, enabling the visualization of the three-dimensional form of the Möbius strip. From the exploration of mathematical equations to the completion of printed works, although more demanding and rigorous compared to traditional mathematical education, this approach proves highly beneficial in terms of the depth and breadth of learning. Throughout the learning process, students demonstrated their creative abilities, which were not necessarily confined within the boundaries of mathematical disciplines. This instructional approach lays a robust groundwork for the exploration of mathematics and other academic disciplines in subsequent years, contingent upon students acquiring a sound comprehension of spatial concepts and graphics. The mathematics textbook itself offers various types of instructional activities and specific materials for teaching, but it may not fully meet the practical needs of teaching. Teachers can utilize 3D printing technology to facilitate the teaching of spatial concepts and graphics, employing 3D printed instructional materials to enhance visualization in mathematics education. Within the mathematics classroom, students have the opportunity to cultivate their spatial learning models, a practice that has the potential to enhance student engagement, foster enthusiasm, and ignite their curiosity and capacity for innovative thinking. Additionally, students can employ physical models to verify the accuracy of their graphical representations, thereby enriching their learning experience.
In addition, Australian scholars considered visualization in the context of enhancing students’ spatial thinking and math performance (Lowrie et al., 2019). The study results show that visualization technologies improve students’ academic performance and motivate them to study. This study aimed to investigate the effectiveness of a spatial visualization intervention program in enhancing students’ spatial thinking abilities and mathematics achievement. The participants consisted of 327 students from 17 classes across 10 schools, with nine classes assigned to the experimental group and eight classes serving as the control group. The intervention program was implemented by classroom teachers over 3 weeks, while the control group received traditional mathematics instruction. Compared to the control group, the intervention group participants exhibited notable enhancements in their spatial cognitive skills, specifically in the domains of spatial visualization and spatial orientation. The intervention group also exhibited significant improvements in their mathematics test scores; participants in the intervention group outperformed their counterparts in the control group in geometry and word problem tasks but not in mathematical questions requiring graphic decoding (non-geometry-related graphical tasks). These findings provide evidence that the spatial thinking enrichment program implemented by teachers within their classrooms can enhance both spatial thinking abilities and mathematics achievement.
The practical significance and further research prospects are due to the possibility of applying the training program developed in the study to teach mathematics and legal sciences to university students. Also, the training program can become the basis for the development of modern programs to study other subjects as it focuses on innovative and information technologies rather than disciplines. Based on the results obtained, the impact of innovative information technologies can be studied in different universities around the world in a comparative context.
The experiment findings indicate the need to introduce innovative information technologies into curricula and training programs. A training program that aimed to introduce innovative information technologies of information visualization into the learning process was developed. A total of 186 participants took part in the study, consisting of three groups comprising 62 students, each from two universities and a college. They were divided into experimental and control groups, from which the experimental group received intervention in the form of a training program “Innovative information technologies in Education” developed by the author. The Self-Regulation Questionnaires Learning Self-Regulation Questionnaire (SRQ-L) was used to assess change in intrinsic motivation. Statistically significant positive changes in the intrinsic motivation of students in the experimental group were ascertained through the utilization of the Student’s t-test, both in comparison to the control group and in comparison to the pre-test results of the experimental group. There is also a strong correlation between participants in the treatment group between their test scores, which further captures that the positive changes are the result of the proposed intervention. It was found that in the learning process, modern technologies are used by 44% of first-year, 45% of second-year, and 51% of third-year students; 60% of fourth-year respondents reported that visualization and innovative information technologies are used in the educational process. The majority of the respondents (first-year students – 65%; second-year – 56%; third-year students – 50%) believe that visualization affects their motivation to learn. Among the first-year students, the most common answers were “self–development” (56%), “motivation” (43%), “interesting subjects” (38%), and “knowledge” (36%); the second-year students noted, “knowledge” (46%), “self-development” (49%), “motivation” (52%), and “diploma” (38%); third-year students indicated “application of knowledge in practice” (63%), “knowledge” (60%), “self-development” (52%), and “diploma” (37%). The practical significance and further research prospects are due to the possibility of applying the training program developed in the study to teach mathematics and legal sciences to university students. Also, the training program can become the basis for the development of modern programs to study other subjects as it focuses on innovative and information technologies rather than disciplines. Based on the results obtained, the impact of innovative information technologies can be studied in different universities around the world in a comparative context.
The original contributions presented in the study are included in the article/supplementary material, further inquiries can be directed to the corresponding author.
The research was conducted ethically in accordance with the World Medical Association Declaration of Helsinki. The study was approved at the meeting of the Ethics Committee of Kazan Federal University. The patients/participants provided their written informed consent to participate in this study.
The study’s conception and design were contributed by NM, LD, IK, and FS. LD handled the conceptualization. IK and FS were responsible for material preparation, data collection, and analysis. NM drafted the initial manuscript. NM, LD, IK, and FS provided feedback on earlier versions of the manuscript. All authors contributed to the article and approved the submitted version.
FS has been supported by the Kazan Federal University Strategic Academic Leadership Program.
The authors declare that the research was conducted in the absence of any commercial or financial relationships that could be construed as a potential conflict of interest.
All claims expressed in this article are solely those of the authors and do not necessarily represent those of their affiliated organizations, or those of the publisher, the editors and the reviewers. Any product that may be evaluated in this article, or claim that may be made by its manufacturer, is not guaranteed or endorsed by the publisher.
Akhmedov, B. A. (2022). Use of information and communication technologies in higher education: trends in the digital economy. Ijtimoiy Fanlarda Innovasiya Onlayn Ilmiy Jurnali 2, 71–79.
Al Mamun, M. A., Azad, M. A. K., and Boyle, M. (2022). Review of flipped learning in engineering education: scientific mapping and research horizon. Educ. Inf. Technol. 27, 1261–1286. doi: 10.1007/s10639-021-10630-z
Aldalalah, O., Ababneh, Z., Bawaneh, A., and Alzubi, W. (2019). Effect of augmented reality and simulation on the achievement of mathematics and visual thinking among students. IJET 14, 164–185. doi: 10.3991/ijet.v14i18.10748
Barinova, N., Zakirova, V., Akhmetova, D., and Lysogorova, L. (2018). Monitoring of the educational process with the use of information and communication technologies: a case study in computer science. Eurasia J. Math. Sci. Technol. Educ. 14, 2379–2391. doi: 10.29333/ejmste/89840
Benedicto, C., Acosta, C., Gutiérrez, A., Hoyos, E., and Jaime, A. (2015). “Improvement of gifted students’ visualization abilities in a 3d computer environment,” in Proceedings of the 12th international conference on Technology in Mathematics Teaching, University of Algarve:Faro, 363–370. Available at: https://www.uv.es/angel.gutierrez/archivos1/textospdf/BenEtAl15.pdf (accessed February 15, 2023).
Black, A. E., and Deci, E. L. (2000). The effects of instructors' autonomy support and students' autonomous motivation on learning organic chemistry: a self-determination theory perspective. Sci. Educ. 84, 740–756. doi: 10.1002/1098-237X(200011)84:6%3C740::AID-SCE4%3E3.0.CO;2-3
Bray, A., and Tangney, B. (2017). Technology usage in mathematics education research – a systematic review of recent trends. Comput. Educ. 114, 255–273. doi: 10.1016/j.compedu.2017.07.004
Carrel, A. (2019). Legal intelligence through artificial intelligence requires emotional intelligence: a new competency model for the 21st century legal professional. Ga. State Univ. Law Rev. 35,:1153. Available at: https://readingroom.law.gsu.edu/gsulr/vol35/iss4/4 (accessed February 15, 2023).
Castro, M. D. B., and Tumibay, G. M. (2021). A literature review: efficacy of online learning courses for higher education institution using meta-analysis. Educ. Inf. Technol. 26, 1367–1385. doi: 10.1007/s10639-019-10027-z
Celen, Y. (2020). Student opinions on the use of Geogebra software in mathematics teaching. TOJET 19, 84–88. Available at: https://files.eric.ed.gov/fulltext/EJ1272890.pdf (accessed February 15, 2023).
Coursera (2021a). Artificial Intelligence for all. Available at: https://www.coursera.org/learn/ai-for-everyone (accessed February 15, 2023).
Coursera (2021b). Data analysis with Python. Available at: https://ru.coursera.org/learn/data-analysis-with-python-ru (accessed February 15, 2023).
Coursera (2021c). Introduction to mathematical thinking. Available at: https://www.coursera.org/learn/mathematical-thinking (accessed February 15, 2023).
Coursera (2021d). Virtual reality. Available at: https://www.coursera.org/specializations/virtual-reality (accessed February 15, 2023).
de Araújo, A. C. A. (2021). “Connecting law to new technologies: perspectives and challenges” in Internet and new technologies law (Baden-Baden: Nomos Verlagsgesellschaft mbH & Co. KG), 35–42.
Dhir, H. K. (2021). Handbook of research on barriers for teaching 21st-century competencies and the impact of digitalization. Pennsylvania: IGI Global.
Doğru, M. (2017). Development of a self-efficacy scale of technology usage in education. Eurasia J. Math. Sci. Technol. Educ. 13, 1785–1798. doi: 10.12973/eurasia.2014.1204a
Dwivedi, A., Hughes, D. L., Coombs, C., Constantiou, I., Duan, Y., Edwards, J. S., et al. (2020). Impact of COVID-19 pandemic on information management research and practice: transforming education, work and life. Int. J. Inf. Manag. 55:102211. doi: 10.1016/j.ijinfomgt.2020.102211
Fırat, E. E., and Laramee, R. S. (2018). “Towards a survey of interactive visualization for education,” in Proceedings of computer graphics and visual computing (The Eurographics Association): Eindhoven, 91–101. Available at: https://cs.swan.ac.uk/~csbob/research/star/education/firat18towards.pdf (accessed February 15, 2023).
Goleman, D. (2020). Emotional intelligence. New York: Bantam Books. Available at: https://www.worldcat.org/title/emotional-intelligence/oclc/1242883873?referer=di&ht=edition (accessed February 15, 2023).
Hadjerrouit, S. (2017). Assessing the affordances of SimReal+ and their applicability to support the learning of mathematics in teacher education. IISIT 14, 121–138. doi: 10.28945/3692
Hadjerrouit, S., and Gautestad, H. H. (2019). “Evaluating the usefulness of the visualization tool SimReal+ for learning mathematics: a case study at the undergraduate level” in Learning technologies for transforming large-scale teaching, learning, and assessment. eds. D. Sampson, J. Spector, D. Ifenthaler, P. Isaías, and S. Sergis (Cham: Springer), 71–89.
Hosseini, F., Saadipour, E., Dortaj, F., Talepasand, S., and Minai, A. (2021). Structural relationship math self-schemas and math affective memories with math enthusiasm: mediating role and task value and ability/expectancy beliefs. J. Psych. Sci. 20, 1471–1492. doi: 10.52547/JPS.20.105.1471
Hwang, G.-J., and Tu, Y.-F. (2021). Roles and research trends of artificial intelligence in mathematics education: a bibliometric mapping analysis and systematic review. Mathematics 9:584. doi: 10.3390/math9060584
Johns, C., and Mills, M. (2021). Online mathematics tutoring during the COVID-19 pandemic: recommendations for best practices. Primus 31, 99–117. doi: 10.1080/10511970.2020.1818336
Katz, A., and Kedem-Yemini, S. (2021). From classrooms to zoom rooms: preserving effective communication in distance education. J. Inf. Technol. Case Appl. Res. 23, 173–212. doi: 10.1080/15228053.2021.1922248
King, A. (2017). Using Desmos to draw in mathematics. AMEJ 73, 33–37. Available at: https://search.informit.org/doi/abs/10.3316/informit.899356067479475 (accessed February 15, 2023).
Kohen, Z., Amram, M., Dagan, M., and Miranda, T. (2022). Self-efficacy and problem-solving skills in mathematics: the effect of instruction-based dynamic versus static visualization. Interact. Learn. Environ. 30, 759–778. doi: 10.1080/10494820.2019.1683588
Komatsu, K., and Jones, K. (2020). Interplay between paper-and-pencil activity and dynamic-geometry-environment use during generalisation and proving. Digit. Exp. Math. Educ. 6, 123–143. doi: 10.1007/s40751-020-00067-3
Laato, S., Lindberg, R., Laine, T. H., Bui, P., Brezovszky, B., Koivunen, L., et al. (2020). “Evaluation of the pedagogical quality of mobile math games in app marketplaces” in In 2020 IEEE international conference on engineering, technology and innovation (ICE/ITMC) (New Jersey: IEEE), 1–8.
Liang, S. (2016). Teaching the concept of limit by using conceptual conflict strategy and Desmos graphing calculator. Int. J. Res. Educ. Sci. 2, 35–48. Available at: https://files.eric.ed.gov/fulltext/EJ1105103.pdf (accessed February 15, 2023).
Lowrie, T., Logan, T., and Hegarty, M. (2019). The influence of spatial visualization training on students’ spatial reasoning and mathematics performance. J. Cogn. Dev. 20, 729–751. doi: 10.1080/15248372.2019.1653298
Loyalka, P., Liu, O. L., Li, G., Kardanova, E., Chirikov, I., Hu, S., et al. (2021). Skill levels and gains in university STEM education in China, India, Russia and the United States. Nat. Hum. Behav. 5, 892–904. doi: 10.1038/s41562-021-01062-3
Maass, K., Geiger, V., Ariza, M. R., and Goos, M. (2019). The role of mathematics in interdisciplinary STEM education. ZDM 51, 869–884. doi: 10.1007/s11858-019-01100-5
Maharg, P. (2016). Transforming legal education: Learning and teaching the law in the early twenty-first century (1). London: Routledge.
Martín-Gutiérrez, J., Mora, C. E., Añorbe-Díaz, B., and González-Marrero, A. (2017). Virtual technologies trends in education. Eur. J. Math. Sci. Technol. Educ. 13, 469–486. doi: 10.12973/eurasia.2017.00626a
McLachlan, S., and Webley, L. C. (2021). Visualisation of law and legal process: an opportunity missed. Inf. Vis. 20, 192–204. doi: 10.1177/14738716211012608
Miranda, J., Navarrete, C., Noguez, J., Molina-Espinosa, J. M., Ramírez-Montoya, M. S., Navarro-Tuch, S. A., et al. (2021). The core components of education 4.0 in higher education: three case studies in engineering education. Comput. Electr. Eng. 93:107278. doi: 10.1016/j.compeleceng.2021.107278
Mutiga, A., and Hullinger, H. (2021). “A learner’s experience on the perceived role of teaching presence in massive open online courses on edX and Coursera platforms”, in Proceedings of EdMedia + innovate learning, ed. T. Bastiaens, Waynesville, NC: Association for the Advancement of Computing in Education (AACE), 764–775. Available at: https://www.learntechlib.org/primary/p/219740/ (accessed February 15, 2023).
Mystakidis, S., Christopoulos, A., and Pellas, N. (2022). A systematic mapping review of augmented reality applications to support STEM learning in higher education. Educ. Inf. Technol. 27, 1883–1927. doi: 10.1007/s10639-021-10682-1
Nardi, E. (2014). “Reflections on visualization in mathematics and in mathematics education” in Mathematics and mathematics education: Searching for common ground. eds. M. Fried and T. Dreyfus (Cham: Springer), 193–220.
Parzysz, B. (1988). “Knowing” vs “seeing”. Problems of the plane representation of space geometry figures. Educ. Stud. Math. 19, 79–92. doi: 10.1007/BF00428386
Presmeg, N. (2020). “Visualization and learning in mathematics education” in Encyclopedia of mathematics education. ed. S. Lerman (Cham: Springer), 900–904.
Qian, J., Nguyen, N., Oya, Y., Kikugawa, G., Okabe, T., Huang, Y., et al. (2019). Introducing self-organized maps (SOM) as a visualization tool for materials research and education. Results Mater. 4:100020. doi: 10.1016/j.rinma.2019.100020
Ramadhani, R., Umam, R., Abdurrahman, A., and Syazali, M. (2019). The effect of flipped-problem based learning model integrated with LMS-Google classroom for senior high school students. J. Educ. Gift. Young Sci. 7, 137–158. doi: 10.17478/jegys.548350
Salim, K., and Tiawa, D. H. (2015). The student's perceptions of learning mathematics using flash animation secondary school in Indonesia. J. Educ. Pract. 6, 76–80. Available at: https://files.eric.ed.gov/fulltext/EJ1086101.pdf (accessed February 15, 2023).
Schneider, S. L., and Council, M. L. (2021). Distance learning in the era of COVID-19. Arch. Dermat. Res. 313, 389–390. doi: 10.1007/s00403-020-02088-9
Schweitzer, D., and Brown, W. (2007). “Interactive visualization for the active learning classroom” in SIGCSE '07: Proceedings of the 38th SIGCSE technical symposium on computer science education (New York: ACM), 208–212.
Sun, Y., and Li, Q. (2017). “The application of 3D printing in mathematics education” in 2017 12th international conference on computer science and education (ICCSE) (New Jersey: IEEE), 47–50.
Surden, H. (2019). Artificial intelligence and law: an overview. Ga. State Univ. Law Rev. 35, 19–22. available at: https://scholar.law.colorado.edu/articles/1234 (accessed February 15, 2023).
Susilawati, E., Khaira, I., and Pratama, I. (2021). Antecedents to student loyalty in Indonesian higher education institutions: the mediating role of technology innovation. Educ. Sci. Theory Pract. 21, 40–56. doi: 10.12738/jestp.2021.3.004
Szymkowiak, A., Melović, B., Dabić, M., Jeganathan, K., and Kundi, G. S. (2021). Information technology and gen Z: the role of teachers, the internet, and technology in the education of young people. Technol. Soc. 65:101565. doi: 10.1016/j.techsoc.2021.101565
Trenholm, S., and Peschke, J. (2020). Teaching undergraduate mathematics fully online: a review from the perspective of communities of practice. Int. J. Educ. Technol. High. Educ. 17:37. doi: 10.1186/s41239-020-00215-0
Tri, N. M., Hoang, P. D., and Dung, N. T. (2021). Impact of the industrial revolution 4.0 on higher education in Vietnam: challenges and opportunities. Ling CuRe 5, 1–15. doi: 10.21744/lingcure.v5nS3.1350
Velichová, D. (2018). “Dynamic visualization in education of mathematics,” in Proceedings of Society for Information Technology and teacher education international conference, eds. E. Langran and J. Borup Waynesville, NC: (Association for the Advancement of Computing in Education (AACE), 1858–1863. Available at: https://www.learntechlib.org/p/182780/ (accessed February 15, 2023).
Wang, A., Yu, S., Wang, M., and Chen, L. (2019). Effects of a visualization-based group awareness tool on in-service teachers’ interaction behaviors and performance in a lesson study. Interact. Learn. Environ. 27, 670–684. doi: 10.1080/10494820.2019.1610454
Wang, K., and Zhu, C. (2019). MOOC-based flipped learning in higher education: students’ participation, experience and learning performance. Int. J. Educ. Technol. High. Educ. 16:33. doi: 10.1186/s41239-019-0163-0
Williams, G. C., and Deci, E. L. (1996). Internalization of biopsychosocial values by medical students: a test of self-determination theory. J. Pers. Soc. Psychol. 70, 767–779. doi: 10.1037/0022-3514.70.4.767
Yıldırım, B., and Sidekli, S. (2018). STEM applications in mathematics education: the effect of stem applications on different dependent variables. J. Balt. Sci. Educ. 17, 200–214. doi: 10.33225/jbse/18.17.200
Yu, Z. (2020). Visualizing artificial intelligence used in education over two decades. J. Inf. Technol. Res. 13, 32–46. doi: 10.4018/JITR.2020100103
Keywords: information technologies, law, mathematics, motivation, visualization
Citation: Matveeva N, Dorel L, Kosareva I and Sabirova F (2023) The influence of educational information visualization trends in higher education for students in the Russian Federation. Front. Educ. 8:1190150. doi: 10.3389/feduc.2023.1190150
Edited by:
Sanghoon Park, University of South Florida, United StatesReviewed by:
Cucuk W. Budiyanto, Sebelas Maret University, IndonesiaCopyright © 2023 Matveeva, Dorel, Kosareva and Sabirova. This is an open-access article distributed under the terms of the Creative Commons Attribution License (CC BY). The use, distribution or reproduction in other forums is permitted, provided the original author(s) and the copyright owner(s) are credited and that the original publication in this journal is cited, in accordance with accepted academic practice. No use, distribution or reproduction is permitted which does not comply with these terms.
*Correspondence: Natalya Matveeva, bmF0YW1hdHZlZXZhQHJhbWJsZXIucnU=
Disclaimer: All claims expressed in this article are solely those of the authors and do not necessarily represent those of their affiliated organizations, or those of the publisher, the editors and the reviewers. Any product that may be evaluated in this article or claim that may be made by its manufacturer is not guaranteed or endorsed by the publisher.
Research integrity at Frontiers
Learn more about the work of our research integrity team to safeguard the quality of each article we publish.