- 1Department of Biological Sciences, College of Arts and Sciences, University of Memphis, Memphis, TN, United States
- 2Department of Learning, Teaching and Curriculum, College of Education and Human Development, University of Missouri, Columbia, MO, United States
- 3Donald Danforth Plant Science Center, St. Louis, MO, United States
- 4Department of Biology, Augustana College, Rock Island, IL, United States
Introduction: To develop a foundation of scientific understanding, undergraduate biology students need to integrate ideas about individual concepts into thinking about complex biological systems.
Methods: To investigate the extent to which undergraduate students engage in systems thinking, we conducted a pre-post study with students in a required undergraduate botany course at a small liberal arts college in the Midwest. All students in the study completed a causal map at the beginning and end of the course. Casual maps are similar to concept maps but demonstrate cause and effect relationships rather than other connections included in a concept map.
Results: Analysis showed that the majority of students did see some connections within the system but did not reach a high level of systems thinking.
Discussion: This work highlights the difficulties undergraduate students have with engaging in systems thinking but provides important insight into the particular areas in which students do engage in more complex thinking and areas in which we can specifically target with instruction and intervention.
Introduction
To develop a foundation of scientific understanding, undergraduate biology students need to understand causal interactions within biological systems. This need is highlighted in Vision and Change (AAAS, 2011). Specifically, within the biological sciences, undergraduate students should develop understanding of “complex biological processes through an elucidation of the dynamic interactions among components of a system at multiple functional scales” (AAAS, 2011, p. 13). Developing a system dynamics perspective occurs through asking students to use complex causal reasoning to understand how interconnected components occur within the system (Mehren et al., 2018; Verhoeff et al., 2018; Mambrey et al., 2020). When students are able to make these connections, then they are able to conceptualize causal effects as both linear, non-linear, and separated by time and space (Jacobson, 2001).
According to Momsen et al. (2022), there is an “implicit understanding that ‘system’ encompasses both the entities it comprises and the operational rules that govern how these entities interact.” (p. 2). Systems thinking is the ability to understand how systems work and how changes in a system affect the other parts of the system (Evagorou et al., 2009; NRC, 2011; Momsen et al., 2022). Helping students engage in systems thinking is needed because thinking about systems is a fundamental aspect of understanding biology more broadly (Momsen et al., 2022). As thinking about systems requires understanding causal relationships, causal reasoning is also an important skill for students to master. In addition to highlighting Systems as a Core Concept, Vision and Change (AAAS, 2011) calls for a Core Competency of Ability to Use Modeling and Simulation. Modeling is one of the tools scientists use to describe living systems (AAAS, 2011). Therefore, supporting students to use modeling can help them to engage in thinking about thinking and develop both a Core Competency and a Core Concept (AAAS, 2011).
To investigate the extent to which undergraduate students build a system dynamic perspective, we used the causal map models they developed at the beginning and end of a botany course at a small liberal arts college as pre/post measures. We asked the following research questions:
1. To what extent do undergraduate students engage in systems thinking about an ecosystem?
2. How do undergraduate students reason about the causal relationships within an ecosystem?
3. What factors do undergraduate students prioritize when they consider causal relationships within an ecosystem?
Literature review
Ecosystem dynamics
The goal of our work is to support students in developing systems thinking about socio-ecological systems (SES). SES “seeks to overcome the dichotomy between natural and social systems by viewing the interrelationship between society and nature as a system in its overall context” (Mehren et al., 2018, p. 688). While ecosystems are frequently taught in K-12 instruction and course foci within undergraduate instruction, embedding frameworks to include SES within the classroom is rare (Sterk et al., 2017; Mehren et al., 2018). Overall, there are few studies that consider the complexity of undergraduate students’ causal reasoning about SES (Davis and Stroink, 2016; Sabel et al., 2017). Yet, understanding the interrelationship between societal systems and ecosystems is crucial as “human actions transform ecosystems with consequences for human livelihoods, vulnerability, and security” (Sterk et al., 2017, p. 109). This concern is particularly salient when considering plant life.
Plants are the foundation of all life on Earth, so it is critical that students understand the criticality of plants within ecosystems as well as SES. Yet, there are few studies that explore if and how undergraduate students causally reason about plant function (e.g., Zangori and Koontz, 2017; Busta and Russo, 2020) and we could not locate studies that explore how undergraduate students causally reason about plants in SES. For these reasons, this study takes place within a botany course. The course focus was supporting undergraduate students in understanding the plant as a system as well as a critical component of ecological and societal systems.
An important part of considering relationships within ecosystems is reasoning about causes and effects. Causal reasoning occurs as students are able to link the components together within the system to realize causal patterns that span time and space. We draw on an ecological literacy framework proposed by Jordan et al. (2009) which is intended to build students’ causal reasoning through three elements:
• Ecological links: understanding interrelationships between ecosystem systems and process.
• Human links: understanding human and human social systems interrelationships within the ecosystem.
• Ecological reasoning: causal reasoning about socio-ecological systems.
The three elements (ecological links, human links, and ecological reasoning) build in causal complexity (Zangori and Cole, 2019). Ecological links are the initial element in which students express ecological relationships, for example recognizing causal relationships between flowers and bees. Human links are separated out from ecological links because emphasis within western schooling tends to be placed on a system boundary that separates humans from ecosystems. This boundary is called the “nature-culture divide” (Bang et al., 2012, p. 303) which can create a barrier to students realizing and reasoning about causal links across systems (Jacobson, 2001). However, being able to successfully consider causal interactions across time and space requires that students conceptualize all inputs into the ecosystem, which includes societal inputs. If ecosystems are taught without considering the interrelationship between ecosystems and societal systems, then students do not have adequate information with which to ecological reason which leads to increased difficulty in understanding how societal systems impact ecosystems and vice versa (Coyle, 2005).
For this reason, we consider the framework to be hierarchical with the top level of complexity as students’ ability to causally reason about the connections between human societal systems, and ecosystems. Reasoning about causal patterns within these systems moves against the cognitive heuristics that students developed as part of their daily lives (Grotzer and Tutwiler, 2014). These heuristics are based on observation and experience in which students interpret cause and effect as simple and linear with centralized control. This is seen most prevalently within students’ understanding of food webs where prey is food for predators while predators maintain control on ecosystem carrying capacity by eating prey (Perkins and Grotzer, 2005). Yet, this simplifies the causal mechanism as a linear relationship between predator and prey (which is easily visible) when the actual mechanism is much more complex and includes a web of relationships within the ecosystem. Other “hidden” causal mechanisms are also crucial to system behavior such as chemical processes through natural ecosystem processes (e.g., photosynthesis, digestion, and biosynthesis) and anthropogenic processes (e.g., excess combustions, and photosynthesis reduction due to forest removal). If a student does not have the opportunity to make all of these processes visible to consider how these processes interact to form system behavior, then it is more challenging for students to build causal complexity (Bennett et al., 2020).
Modeling ecosystem dynamics
For students to consider the ecological and human links and obtain ecological reasoning, then they need a means to make the system components visible. We do this through modeling. Modeling is considered an epistemic practice of science as the act of modeling is central to the development of knowledge by both scientists as well as students’ learning science (Gilbert, 2004). Modeling is a multi-phase process in which, first, students develop a model to answer a question or consider a problem about the causal relationships within a system. This initial model is a 2D diagrammatic model that is a mixture of drawing and writing developed from students’ prior knowledge. Students are able to use this model to reason about the causal relationships within the system and articulate their answer or solution. In this manner, students are accessing and expressing their mental model of the system. The mental model serves as the building block for integrating new knowledge (Schultz et al., 2022). Students use this model as both a reasoning tool and as an evaluative tool to assess their own knowledge about system behavior. As they recognize reasoning gaps in their model, they seek out new ideas to build their conceptual understanding.
Because of our interest in students’ ecological reasoning, we use a specific form of modeling called causal maps (Shin and Jeong, 2021) or within science education literature, referred to as socio-scientific models (Ke et al., 2020). Students create systems models, but the structure of the model forces students to focus on the links between components and use these links to convey causal relationships occurring across time and space within the system boundary (Schultz et al., 2022). This type of modeling is prevalent in other disciplines such as business (Montibeller and Belton, 2006), public health (Pronk and Faghy, 2022) and policy (Buchholz et al., 2007), but not widely used in science education (Ke et al., 2020). For example, Buchholz et al. (2007) created systems maps to assess the sustainability policies of bio-energy systems and recommend using causal mapping to understand and assess the societal and ecological impacts of bioenergy.
As seen from other disciplines, causal map modeling is relevant to socio-ecological systems as they “take social factors into consideration for the purposes of illustrating, explaining and predicting” causal factors within complex systems (Ke et al., 2020, p. 597). Modeling through causal maps is critical to building an understanding of system dynamics because students must consider how each component is causally connected to the scientific phenomenon, if the effect is immediate or delayed, where feedback loops occur within system elements, and if each factor is additive or reductive to the connecting factor (Richardson, 2011). The completed causal map models serve as a leverage for defining overall system behavior. Student construction and evaluation of causal maps have been embedded in secondary geography curriculum to support students systems thinking (Cox et al., 2018) and used to support secondary students’ causal reasoning about evolutionary change (Hanisch and Eirdosh, 2021).
Methods
Context and participants
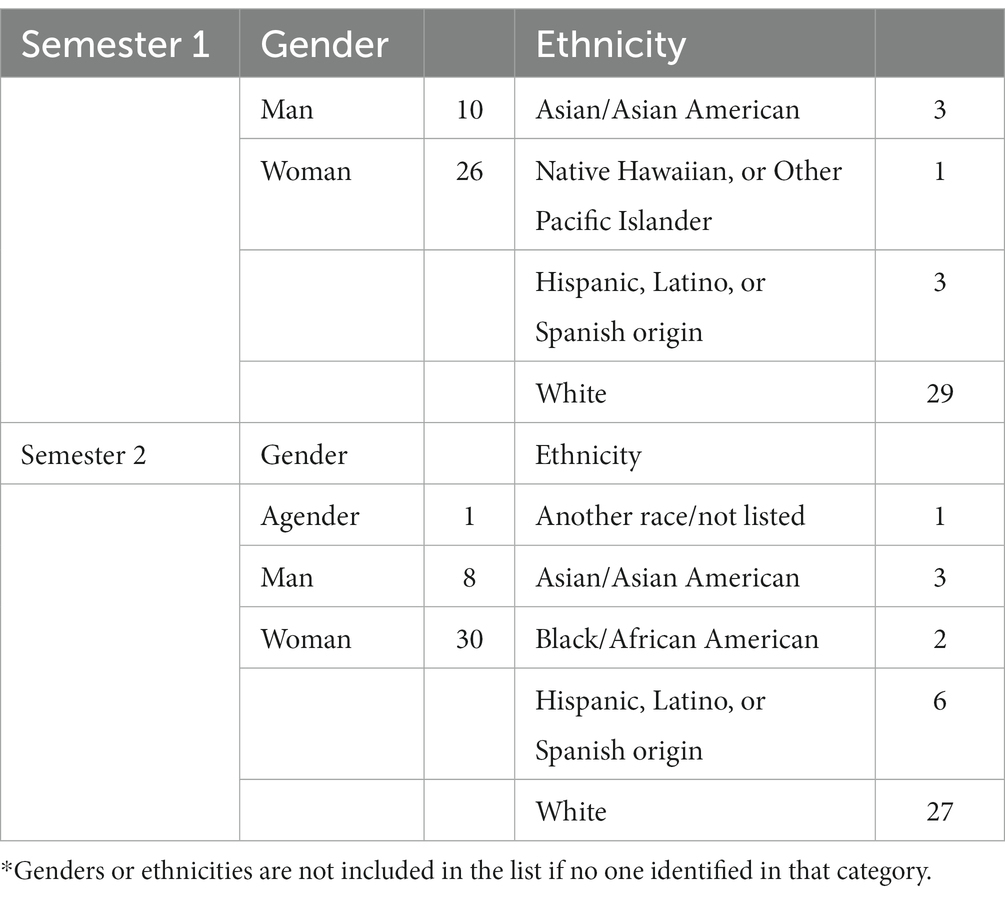
Our study took place over two semesters and included all students in an undergraduate botany course at a small Midwestern undergraduate liberal arts college. Thirty-eight students (100%) consented to participate in the first semester and 40 students (100%) consented to participate in the second. See Table 1 for demographic information. The course consisted of primarily junior-level (3rd year) undergraduate students, was required for all biology majors, and lasted ten weeks as the university operated under a trimester schedule. While the course was introductory in skill level and largely lecture-based, the professor also used a mixture of class discussion, the Socratic method, PowerPoints for students to add information to, worksheets, exposure to primary literature that also involved group activities, and debates that required preparation outside of the classroom. The topics covered included plant anatomy, morphology, physiology, and diversity. Basic ecology was a programmatic (departmental) mandate that was woven throughout the course. Course work included two-unit exams (consisting of a mix of multiple choice, fill-in-the-blank, drawing/labeling drawings, short answer, and short essay questions), class participation and assignments, a class discussion with worksheets and reflections on the book Walden Warming by Richard B. Primack, and a final exam. The final served as a third unit exam with an added section covering material from the entire course. Like the two-unit exams, the format was a mix of question types.
The course also required concurrent enrollment in a weekly, two-hour long botany lab, which constituted 20% of the overall grade in the course and included three lab quizzes and an inquiry-based research project. The lab content closely followed the topics covered in class. The research project lasted the entire semester. Students chose a common garden plant with short germination time (e.g., radish, broccoli, turnip, tomato, white clover, lettuce) and designed and conducted a controlled experiment testing an ecological issue (e.g., amount of water, intensity of light, amount of fertilizer, kind of fertilizer, exposure to UV light, exposure to acid rain, etc.). In addition to the control group, students were required to have three treatment levels of the independent variable. Students worked in teams of four and wrote sections that ultimately were put together in a PowerPoint poster as if they were going to present it at a professional meeting. This study was intended to determine whether students develop systems thinking during a class that discussed many aspects of systems thinking but did not provide specific instruction on how to think about systems or causal relationships among various aspects of systems. In this way, we were examining a “business as usual” course. Future work will focus on more directed instruction on both systems thinking and consideration of causal relationships.
Causal map assignment
To develop a scaffold to support students in systems thinking, we used the FRAMER scaffold design framework (Sabel, 2020). In the first semester, we assigned a causal mapping activity before and after the semester took place. Causal maps are a type of concept map but instead of writing a word to describe the relationship on the connection between concepts, students write a plus or minus sign to indicate whether the causal relationship is positive or negative (i.e., it is increased or decreased). We instructed students how to construct a causal map via a handout and gave them a picture of an environment very similar to their own. Students were instructed to base their causal map on the environment picture. We did not administer any extra instructions beyond what a causal map was and how to make one.
In the second semester, we included a short activity published by the Institute of Play (2020). The activity included a definition of a system and various characteristics of systems that students could use to better understand how to model a system with their causal maps. After the activity was introduced, the students completed their causal maps in the same manner as the first semester, with the same model environment picture.
To assist students in building their causal map with a particular environment in mind, we included a picture of an environment that included objects like crops, a farmer, a cow, a factory, water, etc. (see Figure 1). The prompt for the causal maps was, “What roles do plants play in the environment shown?” Students answered this by drawing a causal map of their own about the environment described above. The entire assignment is included in Appendix A.
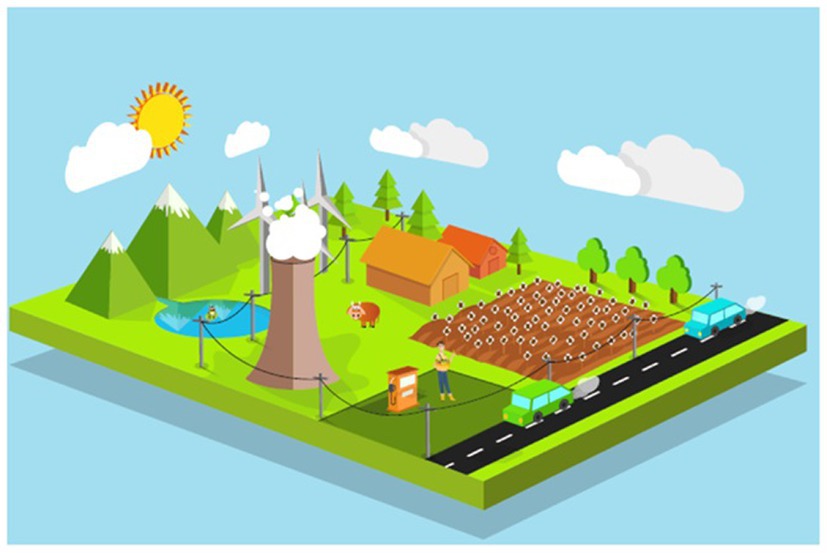
Figure 1. Picture of an environment students were asked to consider for development of their causal maps.
Students were also asked to answer two questions about their causal map: (1) explain how your causal map demonstrates the relationships of plants and the environment? and (2) if someone, a non-scientist, asked you to explain how plants connect to everyday life or situations, how would you answer using your causal map?
Data analysis
The maps were coded using a rubric developed specifically for this study. The rubric was developed using an ecological framework (Jordan et al., 2009) and a systems reasoning framework (Hokayem and Gotwals, 2016). We chose these frameworks and adapted them to our rubric specifically because we wanted to take both an ecological and a systems approach to see how much students know about plants and their role in the environment. Using these frameworks, we developed a rubric based on the factors we saw in the causal maps. The rubric included five scoring criteria: plant links, human links, ecosystem links, causal reasoning, and systems reasoning. All of the criteria had a range of 0 to 3, 0 being the lowest score and 3 being the highest. See Appendix B for the entire rubric.
When assessing the criterion plant links, we considered the presence or absence of plants as a part of the requirement, as well as the presence or absence of both producer/consumer and photosynthetic relationships involving plants. For human links, we focused on whether or not humans were included, as well as how humans were integrated into the map using multiple relationships. For ecosystem links, we focused on whether or not students used both abiotic and biotic factors in their maps equally. For causal reasoning, we considered whether students included a causal relationship on every connection they indicated, and if so, how correct those relationships were. For systems reasoning, we evaluated the level of interconnectivity of the map, as well as a clear flow of ideas and the presence of one or more causal loops. Two authors completed multiple rounds of co-scoring and rubric revision on ten of the student responses (13% of total maps), until we reached an instrument that fully captured the students’ responses, and we obtained a high interrater reliability (86% agreement). We then scored an additional ten student responses reaching a total of 20 dual-coded causal maps (26% of total maps) and reached 100% agreement following discussion. The first author then completed the remaining scoring alone which consisted of 18 causal maps from semester one, and 40 causal maps from semester two.
We coded all the causal maps according to our rubric and took averages for each criterion in the rubric, as well as an overall score for how well students did by adding the score on each criterion together. The highest score possible was 15 and the lowest score possible was zero. With that data, we completed a one-way repeated measures ANOVA to determine if there was a significant difference between pre and post scores. We repeated this process for both semesters and compared pre-test answers using an Independent Samples T-test to determine equivalency of scores between both semesters before causal maps were administered. We completed a second Independent Samples T-test to compare post-test scores among the 2 semesters to determine if the group with the scaffold in the second semester performed better than the group in the previous semester.
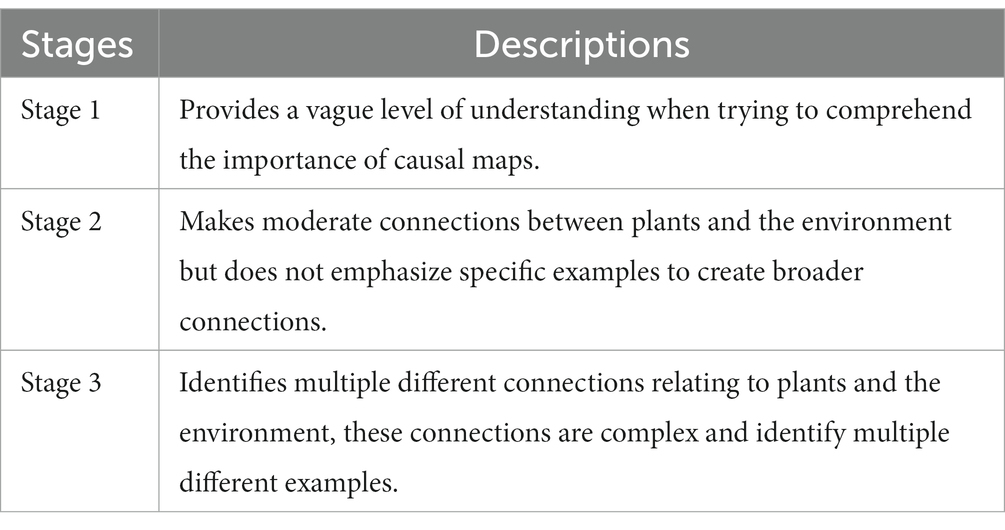
To evaluate the questions students answered after drawing their causal maps we began with the framework for systems thinking developed by Mehren et al. (2018) as utilized by Mambrey et al. (2020). This framework is defined by three stages of progress toward developing skills of systems thinking. We used qualitative open coding to determine if we could identify a similar type of hierarchy regarding systems thinking in their responses. To do this, we first identified whether or not students identified cause-and-effect relationships and feedback loops. We found a clear connection between recognizing systems relationships with the extent to which students included and described their feedback loops. We were able to determine three stages based on how students (1) identified simple cause and effect relationships, (2) identified multiple different cause and effect relationships within the system, or (3) noted multiple complex relationships within the system while including multiple feedback loops. See Table 2 for the stages of systems thinking we identified in the written responses.
In Stage 1 for Mehren et al. (2018) students “identified a low number of elements and relations mainly isolated or monocausal and as a vague set of relationships.” In comparison, in our Stage 1, students only identify minimal cause and effect relationships within the system. In Stage 2 for Mehren et al. (2018), “the student is able to identify moderate number of elements and relations and they are mainly linear.” This is similar to what we found in our data: students identified a moderate number of cause-and-effect relationships within a system but included little to no feedback loops. Finally, Stage 3 for Mehren et al. (2018) was reached when a “student was able to identify a high number of elements and relations and they were mainly complex and highly differentiated sets of relationships and as part of nested systems.” In our scale, students scored as Stage 3 when they were able to identify multiple complex relationships within the system and be able to identify multiple feedback loops.
Results
Causal map scores
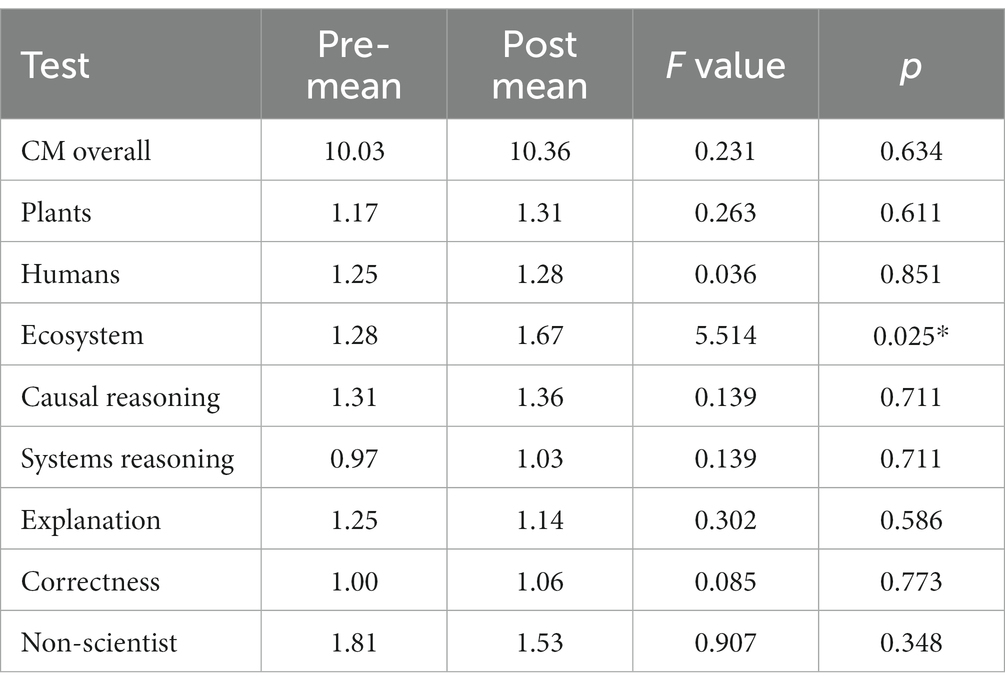
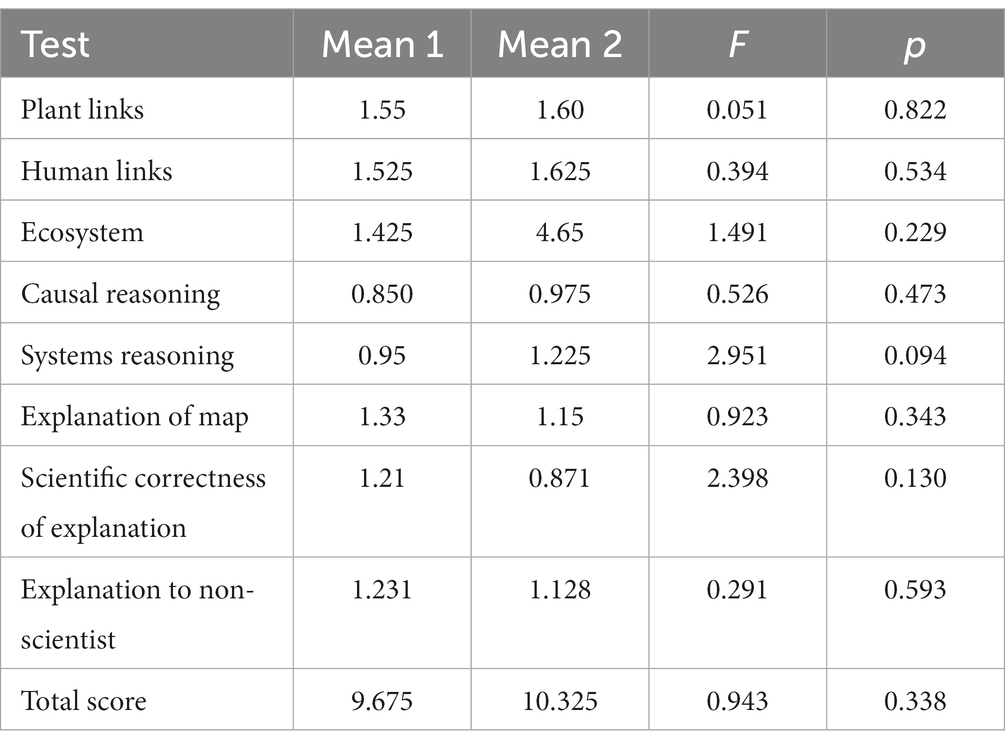
We used one-way repeated measures ANOVA to analyze the changes in causal map rubric scores and found that the only aspect of the causal maps that students improved upon over the semester was using Ecosystem links (p < 0.05). This indicates that students did not improve their abilities to use causal maps to explain their views on plants and their role in the environment, except for with ecosystem links. See Table 3 for results from the first semester and Table 4 for the results from the second semester. Note that the pre to post difference in the scores for Ecosystem links was only significant in the first semester, but not in the second semester.
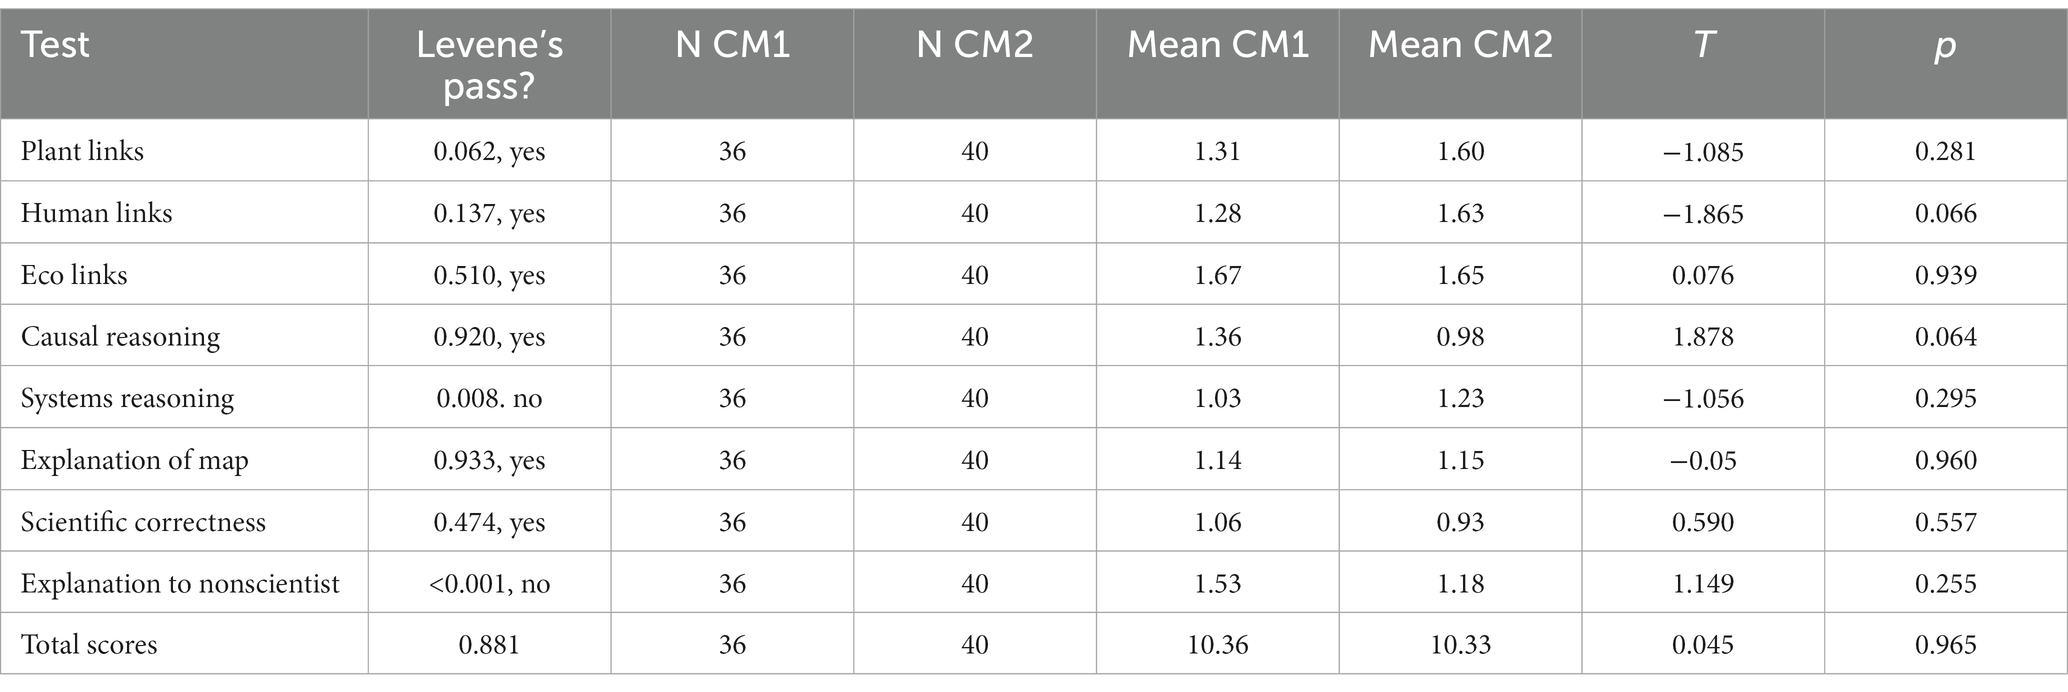
An Independent Samples T-test indicated few differences in pre or post scores between the first and second semesters. For the pre-test, first semester scores were significantly higher than second semester scores for Causal Reasoning and Explanation to non-scientists (Table 5). However, we saw no significant differences in any categories when we compared the post-tests between the first and second semesters (Table 6).
Because a significant difference in Ecosystem links occurred only in one semester and differences between the semesters were limited to two categories in the pre-test, but not the post-test, we conclude that the trends indicate no real differences between pre and post or between the first and second semesters.
Focus on human links
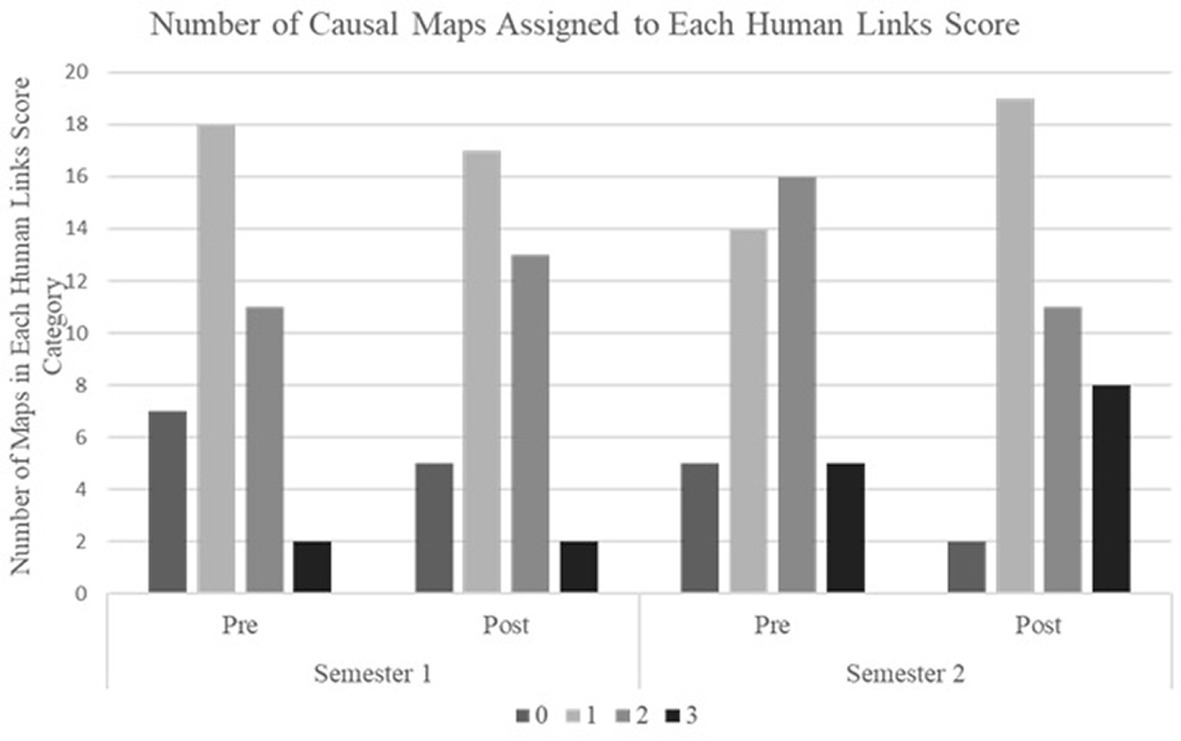
To further examine what students included in their causal maps, we chose the category of human links. This category was not significantly different from pre to post, however, we found it interesting how few students included contributions from humans in their causal maps even though a human, and human-related items (factory, car, etc.) were included in the picture students were shown. Figure 2 shows the distribution of causal map scores across all assignments in both semesters. Most students fell into the score categories of 1 and 2 in all the assignments indicating most included some aspect of how humans interact with the environment, but most did not to a high degree.
In the first semester, we found that five students fell above and five students fell below one standard deviation of the mean for the pretest. Of the 26 students who were within 1 standard deviation of the mean, 12 were above it and 14 were below it. A high scoring map completed by a student who received a 12 out of a possible 15 points overall for their second map in the course connected plants to both food and photosynthesis; included humans as a connection to oxygen, carbon, and food; included approximately equal numbers of both biotic and abiotic factors in their map; indicated clear and correct causal relationships; and had a highly interconnected map with nested causal loops as a central figure. However, another student received a 1 out of 15 on their causal map. One reason for this is that the student likely did not understand the point of the exercise as they primarily referred to photosynthesis in their map, but they also did not specifically talk about plants at all. They did not include humans in their map, all of their ecosystem factors were abiotic, they indicated no causal relationships on their map, and all of the relationships considered on the map were linear and not at all interconnected.
Figure 3 shows examples of causal maps that received each level of scoring.
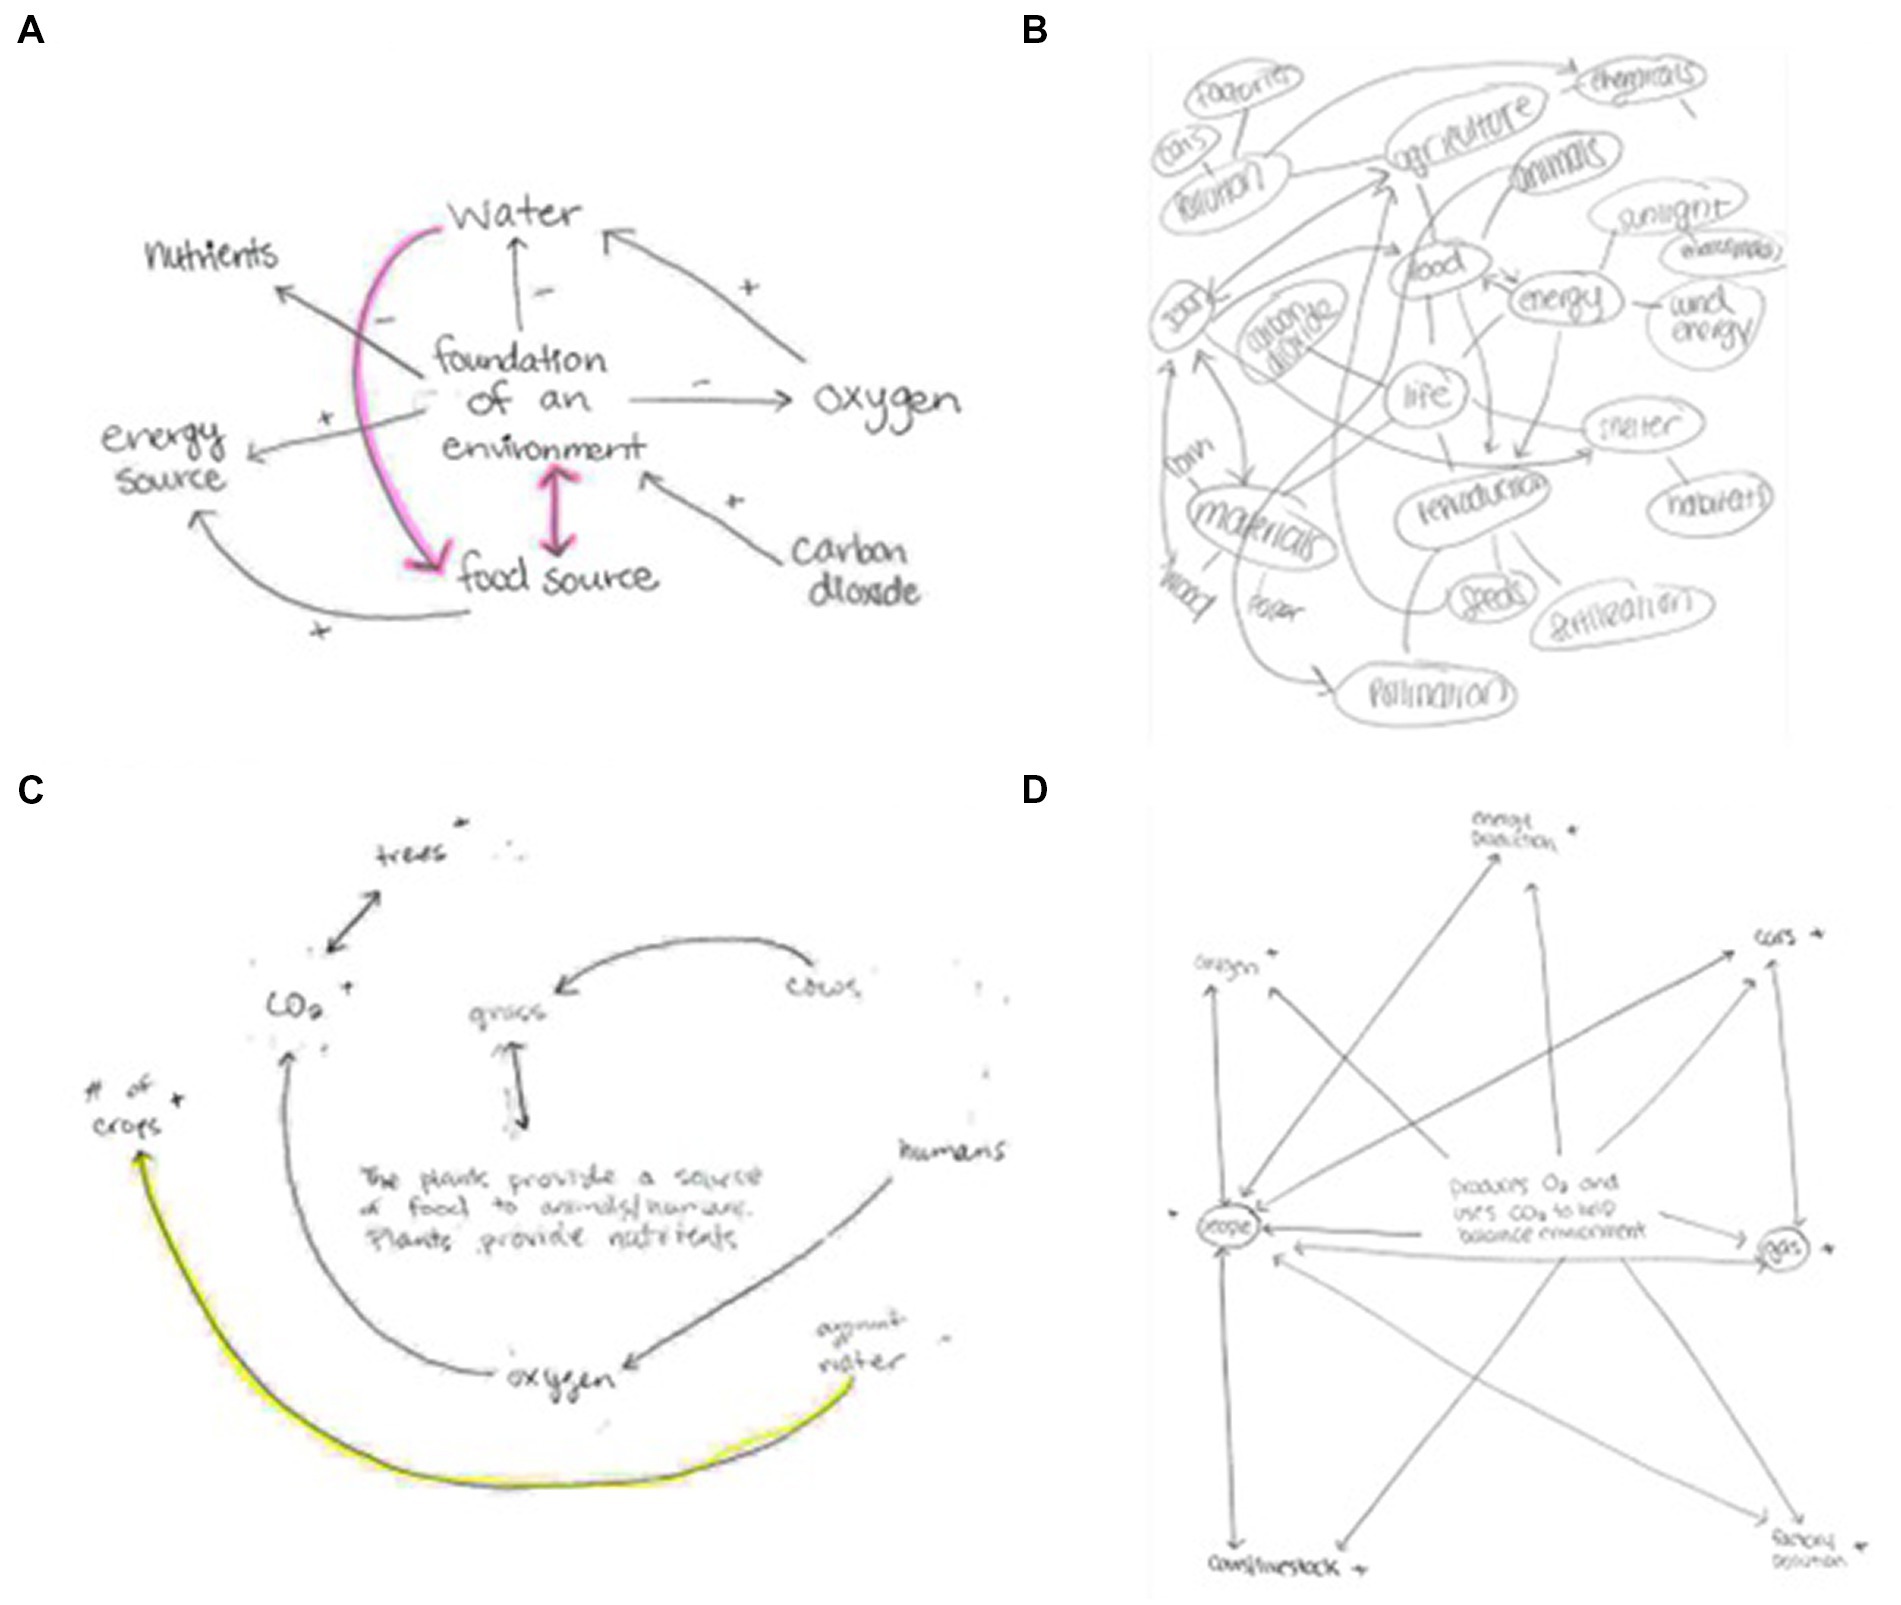
Figure 3. Examples of each level of causal map scoring. (A) Score of 0. No mention of humans or any human-caused phenomena. (Participant 11, pre-test causal map). (B) Score of 1. Human-caused phenomena (e.g., agriculture, pollution, wind energy) are mentioned, but humans are not. (Participant 8, post-test causal map). (C) Score of 2. Humans are mentioned on the map but are isolated from the other ideas present. (Participant 40, pre-test causal map). (D) Score of 3. Humans are present and so are human-caused phenomena (e.g., cars, gas, factory pollution) and humans are highly connected with the rest of the ideas on the map, as well as the human-caused phenomena. (Participant 12, pre-test causal map).
Score of 0. In Figure 3A, the student did not refer to “humans,” or, “people,” and did not include any type of concept that is directly related to or caused by humans. Every other item on the map is something found in nature and not focused on humans in a socioscientific context.
Score of 1. In Figure 3B, the student included components such as, “factories,” “cars,” “pollution,” “agriculture,” and even, “jobs” which are all concepts relating to what humans do in an environment. However, this student did not actually use the word, “humans,” or, “people,” in their map either, despite the fact that many of the concepts included in the map are directly caused by humans in a socioscientific context.
Score of 2. In Figure 3C, the student included the word, “humans,” in their pre-test map, however, humans have only one connection to the rest of the map and are largely separated from all of the other elements appearing in the map. Additionally, the word, “humans,” is only connected to the word, “oxygen,” which is not a concept directly caused by humans in a socioscientific context.
Score of 3. In Figure 3D, the student included the word, “people,” but also included several connections between, “people,” and other elements of the map. There are seven total connections between the element, “people,” and other concepts in the map. Of those seven, three can be thought of as concepts directly caused by humans in a socioscientific context. “People” is connected to “cars,” “gas,” and “factory pollution,” all of which are related to human impacts on the environment. The other four elements connected to the term, “people,” are “oxygen,” “cows/livestock,” “energy production,” and “produces O2 and CO2 to help balance [the] environment,” which is the central idea of the map. These connections point to an understanding of how humans are dependent upon plants for oxygen, and how we have domesticated cows for agricultural use.
Written answers to questions
To analyze students’ systems thinking understanding and level of use in the answers to the questions about their causal maps, we developed a modified scale using the chart of Skills of Systems Thinking developed by Mehren et al. (2018) and as utilized by Mambrey et al. (2020). Qualitative analysis revealed three levels of systems thinking within students’ answers to the questions (see Table 2). At Stage 1, students provided a vague level of understanding when trying to comprehend the benefit of drawing causal maps. At Stage 2, students made moderate connections between plants and the environment but did not elaborate with specific examples that would help them to create broader connections. At Stage 3, students identified multiple different connections relating to plants and the environment. These connections were complex and identified specific examples.
Question 1. In Question 1, students were asked to “Explain how your causal map demonstrates the relationships of plants and the environment.” Students were asked to answer this question about both their pre-class and post-class causal maps. Analysis of Pre-Question 1 showed that 21 out of the 40 students fell into Stage 2 of the level of utilizing systems thinking regarding explaining their causal maps (Table 7). This conveys that students were only making moderate or broad connections when attempting to demonstrate the relationships between plants and the environment. For example, one student said “Plants help to reduce emissions in this environment. It shows that pollution, cars, structure, electricity, etc. add problems for plants to clean up” (Student 24).
This is considerably more complex than a student who scored in Stage 1 who simply said, “Plants allow for survival” (Student 4). The response given by this student shows a vague level of understanding when making connections between plants and the environment. Students who scored in Stage 3 wrote a well-developed answer that made use of specific connections between plants and the environment. For example:
My causal map demonstrates the interconnected relationships that plants have within the environment. Plants use CO2 (product of many living things) to produce O2 (necessity of many living things). Taking in CO2 in a large amount can be considered a carbon sink, returning the carbon from the air back into the ground. Not only do plants produce CO2, but they also create habitats for living things and produce resources living things can use (wood, food, etc.). Agriculture plays a big role in the production of food for humans, but with this, both positive and negative effects occur. Over usage of land results in desertification. Over usage of fertilizers results in runoff and dead zones, negatively impacting surrounding ecosystems. Agriculture allows humans to have time to do other things besides hunting and gathering (the old way of collecting food) showing a positive impact. Plants play a larger role in everyday life, one that many do not realize (Student 38).
This response makes several connections between the positive and negative impacts on the relationship between plants and the environment. Of note, all Stage 3 responses were much longer and contained more details than either Stage 1 or Stage 2 responses.
When this question was administered again at the end of the semester, results showed the majority of students falling in Stage 1 (17 out of 40) and Stage 2 (16 out of 40) (Table 7). Students showed minimal improvement, or no improvement at all, in their responses between the pre-class and post-class assignments.
Question 2. In Question 2, students were asked “If someone, a non-scientist, asked you to explain how plants connect to everyday life or situations, how would you answer using your causal map?.” Analyzing the results from Pre-Question 2 showed that, as with Pre-Question 1, 19 out of 40 students fell in the Stage 2 category (Table 7). For example, a student who scored in Stage 2 wrote, “Without plants we would not have air, a lot of shelter comes from trees, food, etc. Plants are necessary for survival” (Student 4). This student expressed why plants are important and the different components we gain from them but did not rank in Stage 3 because they did not draw specific connections to everyday life.
A student who scored in Stage 1 wrote, “It represents how so many different factors in the environment can be correlated and have an impact within society” (Student 14). This student scored in Stage 1 because, although they mentioned that many different components are related, they did not include specific factors and how those factors impact the environment.
Analysis of answers to Post-Question 2 exhibit nearly the same results as Pre-Question 1, most students scored as Stage 2. We did not see an enhancement in the development of the responses from the pre-class to the post-class assignment. For example, a student who ranked at Stage 2 for Pre-Question 2 stated, “My causal map shows how plants help maintain the lives of all living organisms and how everything feeds off each other. Plants feed off the CO2 that humans produce, and humans feed off all of the benefits plants give us” (Student 40). When asked the same question again in Post-Question 2 the student stated, “My causal map shows how humans can use plants in many different ways. We need them because they produce oxygen for us, food, shelter, medicine, and many other things without plants it would be very difficult for us to exist,” and again scored in Stage 2.
In both Pre- and Post-question 2, few students scored in the Stage 3 level of drawing connections (eight out of 40 for Pre-Question 2 and seven out of 40 for Post-Question 2) (Table 7). A Stage 3 answer requires multiple connections between plants and the environment and would thoroughly explain how those connections are important. A student who scored in Stage 3 for Post-Question 2 stated,
My causal map would show them what plants do for every day like through the simple points made in the causal map. The plant provides oxygen, income, food, oxygen, and consumes CO2. The oxygen, income, food, and sustainability of life are where we receive from plants while CO2 is what is removed. CO2 emission affects the amount of oxygen made and the amount of cash crops (food) affects income” (Student 21).
We found little to no improvement in regard to drawing more in-depth connections within the environment. For example, a student who scored in Stage 1 for Pre-Question 2 states, “They’re need[ed] for survival because you need O2 to breathe and need to live off of it” (Student 10). When asked again in Post-Question 2, the students wrote “We need them to breathe and eat and make money. They’re essential for us to live,” which again scored in Stage 1. Because we saw 21 out of 40 students scoring in the Stage 2 category, we can conclude that many students tend to make broad connections rather than making specific connections with a variety of different components.
Next, we analyzed the extent to which students changed stages in their answers to the questions between the pre- and post-assignments. We saw students who improved to a higher stage, remained at the same stage, and who regressed to a lower stage. For Pre- to Post-Question 1 we found that a total of nine students improved, 20 were unvarying, and ten regressed (Table 8). For Pre- to Post-Question 2, eight improved, 22 remained the same, and nine regressed (Table 8).
As shown in Figure 4, of the students who were categorized in Stage 1 for Pre-Q1, five improved to Stage 2, while seven stayed at Stage 1 in their answer to Post-Q1. No students scoring in Stage 1 for Pre-Q1 increased to Stage 3 in Post-Q1. For students placed in Stage 2 for Pre-Q1 we found that four improved to Stage 3, ten remained at Stage 2, and seven regressed to Stage 1 when answering Post-Q1. Finally, of the students placed in the Stage 3 category for Pre-Q1, three remained in Stage 3 while three regressed down to Stage 1 when answering Post-Q1. We attribute this last regression to students not taking the second assignment as seriously as the first.
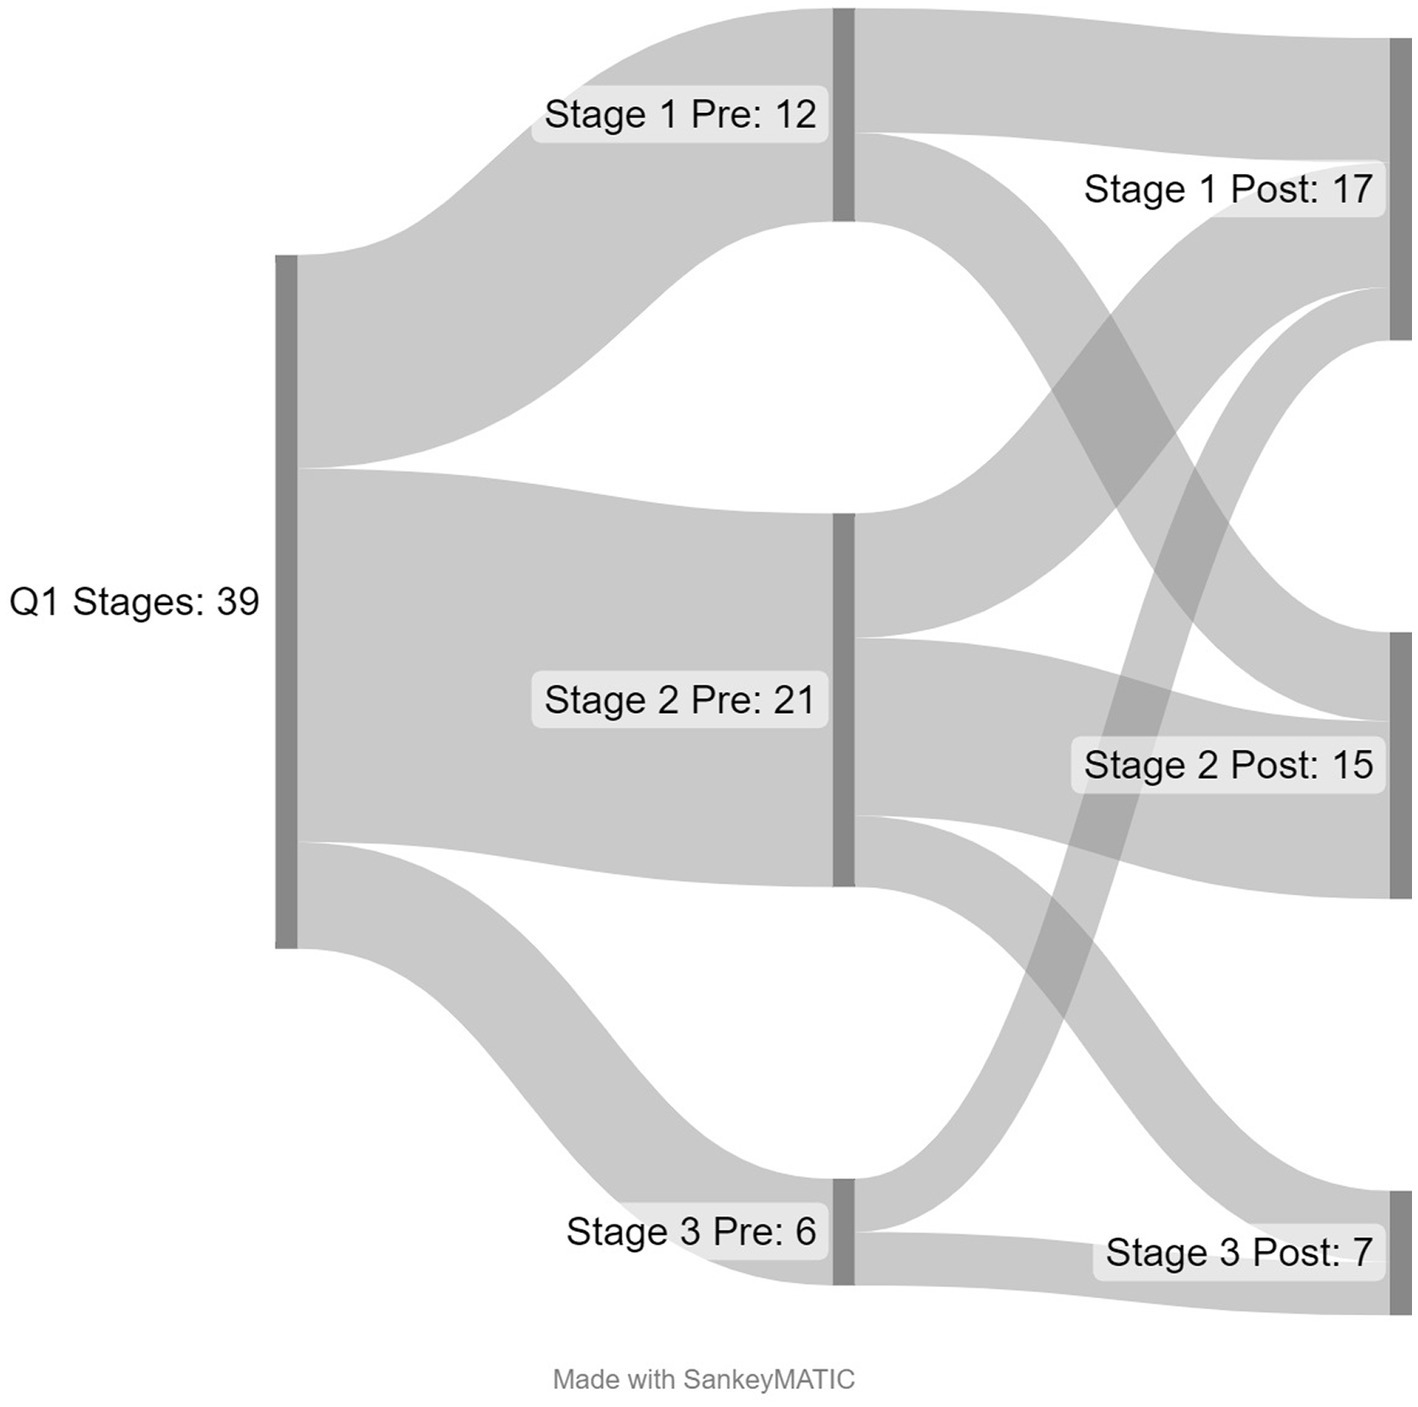
Figure 4. Analysis of the number of students who improved to a higher score, remained at the same score, or regressed to a lower score between the Pre- and Post-answers to Question 1.
As shown in Figure 5, of the students who were categorized in Stage 1 for Pre-Q2, five improved to Stage 2 and seven remained at Stage 1 in their answers to Post-Q2. As with Question 1, no students who scored in Stage 1 increased to Stage 3. For students categorized as Stage 2, three improved to Stage 3, ten remained in Stage 2, and six regressed to Stage 1 for Post-Q2. Lastly, of the students in the Stage 3 category, four remained in Stage 3 while three regressed to Stage 2 and one regressed to Stage 1 for Post-Q2.
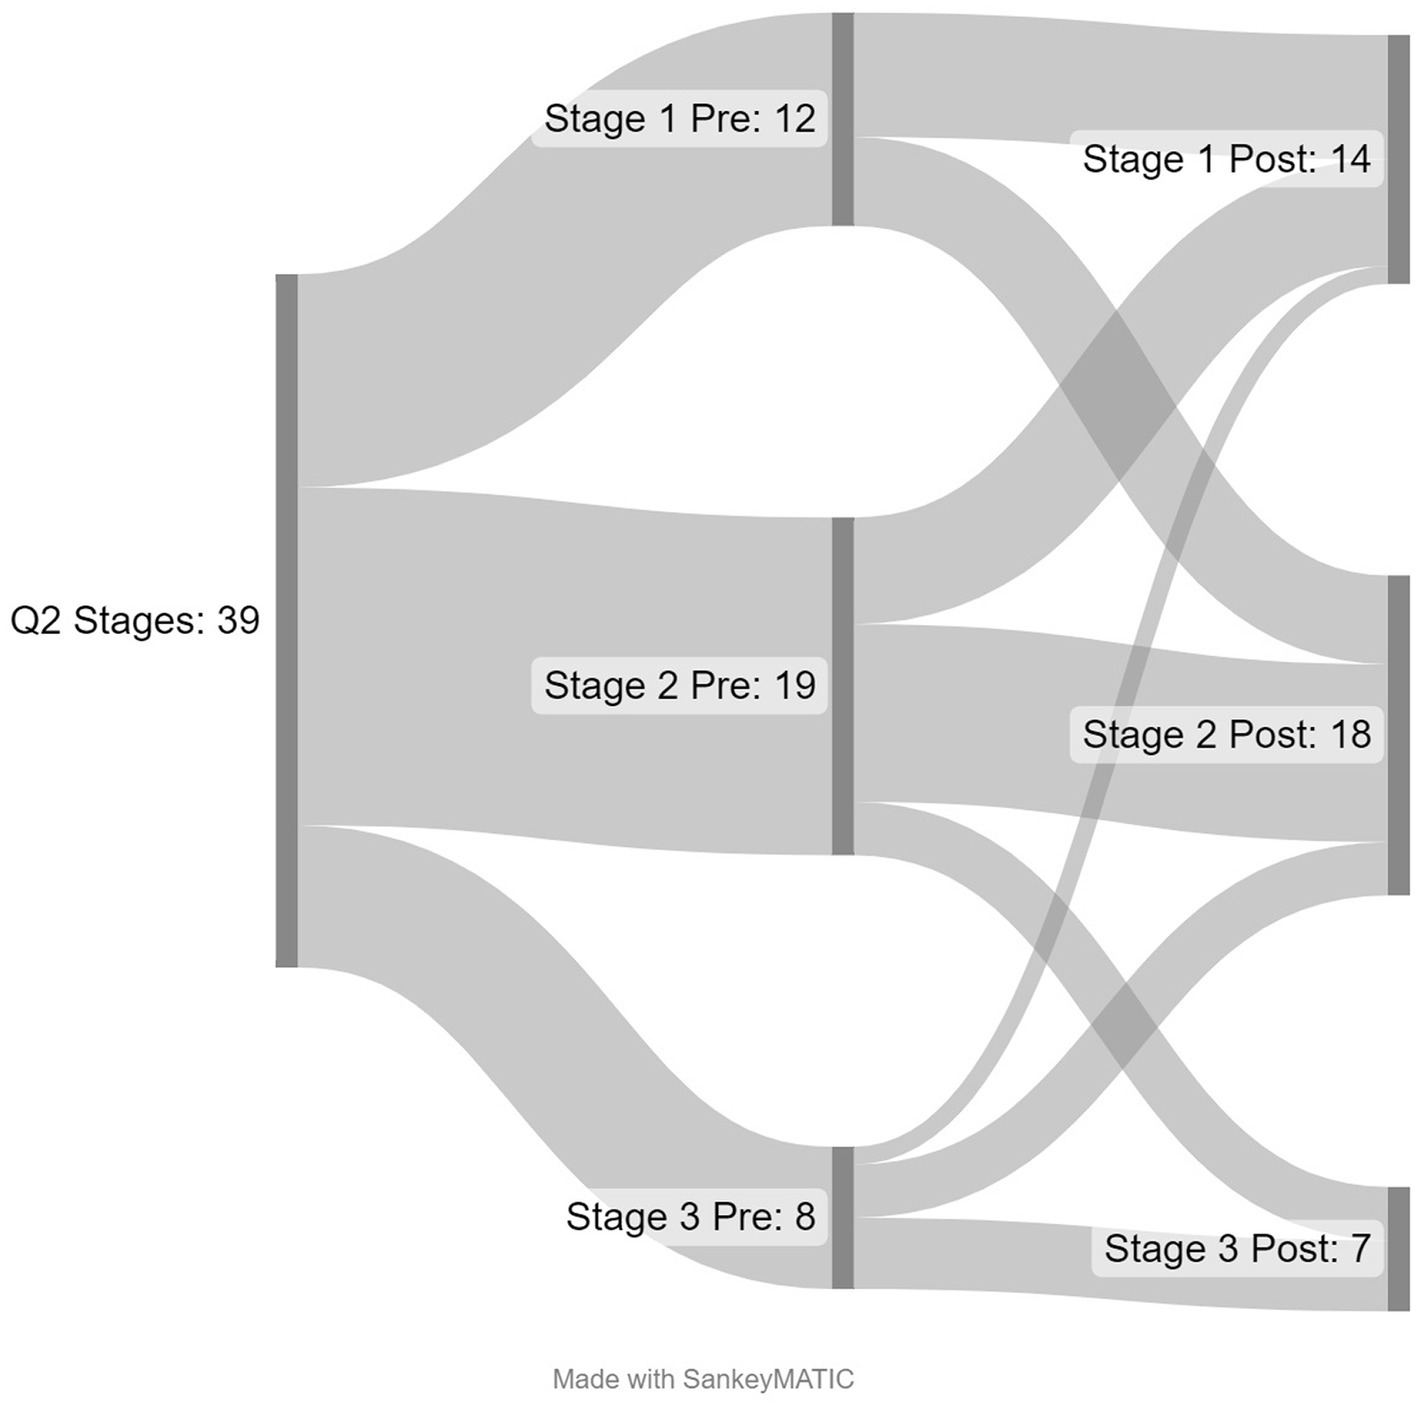
Figure 5. Analysis of the number of students who improved to a higher score, remained at the same score, or regressed to a lower score between the Pre- and Post-assignments for Question 2.
Discussion
Undergraduate biology programs should include opportunities for students to engage in complex biological processes and causal reasoning to understand how interconnected components are necessary for systems to function linearly, non-linearly, and across time and space (Jacobson, 2001; Evagorou et al., 2009; AAAS, 2011; NRC, 2011; Mehren et al., 2018; Verhoeff et al., 2018; Mambrey et al., 2020). Thinking about systems requires students to both understand that a system is both the entity and how the entities interact (Momsen et al., 2022). While the term “ecosystem” is often taught across the K-16 spectrum, it is rarely done so without systems thinking, particularly with how natural and social systems are intricately linked (Mehren et al., 2018; Sterk et al., 2017). Further, little work has focused on how undergraduate students engage in causal reasoning socio-ecological systems (Davis and Stroink, 2016; Sabel et al., 2017).
Vision and Change (AAAS, 2011) included Systems as one of the five Core Concepts and Modeling and Simulation as a Core Competency. Modeling is an important part of the development and integration of scientific knowledge (Gilbert, 2004; Schultz et al., 2022). Integrating modeling with systems thinking requires students to also develop causal reasoning. This, too, is challenging for students because of the difficulty in considering both natural and societal aspects of systems such as ecosystems (Jacobson, 2001; Coyle, 2005; Jordan et al., 2009; Bang et al., 2012; Zangori and Cole, 2019). Our focus on ecosystems in this study is, in part, because of this interaction between nature and society. In addition, little research has focused on how students reason about plant function and how plants are a crucial part of ecosystems (e.g., Zangori and Koontz, 2017; Busta and Russo, 2020; Parsley et al., 2022).
In this study, we focused on the use of causal maps as a form of modeling causal relationships within ecosystems (Shin and Jeong, 2021). Although causal modeling has been used in other disciplines (Montibeller and Belton, 2006; Buchholz et al., 2007; Pronk and Faghy, 2022), they have been only limitedly utilized in science education (e.g., Cox et al., 2018; Ke et al., 2020; Hanisch and Eirdosh, 2021). This focus on causal relationships is not something that students typically consider in their daily lives beyond linear reasoning such as in food webs (Perkins and Grotzer, 2005; Grotzer and Tutwiler, 2014). Therefore, it is important for students to have exposure to causal complexity such as feedback loops for them to develop causal reasoning and systems thinking skills (Richardson, 2011; Bennett et al., 2020).
In our first research question, we asked “To what extent do undergraduate students engage in systems thinking about an ecosystem?” We found that the majority of students fell into mid-range scores meaning they did see some connections within the system but did not reach a high level of systems thinking. We did not see an improvement in the causal maps from pre to post except among ecosystem links and then only in the first semester. One reason for this result may be that students did not have prior experience with using causal maps and may not yet have had the skills necessary to demonstrate connections. While they may have recognized part of the system, it seems they did not fully consider the system itself or how the entities interact (Momsen et al., 2022). It seems students also exhibited the difficulty in merging both natural and society aspects of the ecosystem they were asked to analyze as previously described (e.g., Jacobson, 2001; Coyle, 2005; Jordan et al., 2009; Bang et al., 2012; Zangori and Cole, 2019). Therefore, future work will need to focus on providing more foundational work on thinking about systems both as a whole and as the entities that make up the whole, as well as considering both natural and societal impacts on the system.
In our second research question, we asked “How do undergraduate students reason about the causal relationships within an ecosystem?” The only significant difference we found in the causal reasoning category was between the pre-tests of semester 1 and semester 2. This indicated there may have been a difference in how students came into the class thinking about causal relationships, but it did not last from pre- to post-assignment in a single semester. In the written responses to the questions accompanying the causal maps, we also saw little usage of feedback loops or connections that went beyond simple, linear relationships. Again, this aligns with previous work that has shown it is rare that students consider causal relationships beyond linear reasoning (Perkins and Grotzer, 2005; Grotzer and Tutwiler, 2014). Future work will need to focus on how to engage students in reasoning that will allow them to consider complexity in relationships in ways that are non-linear and that span time and space (Jacobson, 2001; Evagorou et al., 2009; AAAS, 2011; NRC, 2011; Mehren et al., 2018; Verhoeff et al., 2018; Mambrey et al., 2020).
In our third research question, we asked “What factors do undergraduate students prioritize when they consider causal relationships within an ecosystem?” We found little consistency in what students considered beyond including the basic features found in the ecosystem picture they were given with the assignment and topics they had previously learned were associated with plants and ecosystems (i.e., photosynthesis). However, although humans and human-related factors were included in the assignment picture, few students included human-related causes and effects in their causal maps or in the answers to the questions following the causal maps. Again, this points to the difficulty students have with considering both natural and societal aspects within systems (Jacobson, 2001; Coyle, 2005; Jordan et al., 2009; Bang et al., 2012; Zangori and Cole, 2019). Future work will need to focus on how to help students understand the multiple factors involved in systems thinking.
Overall, our work has further shown many of the aspects of systems thinking that were already known. However, we have expanded that knowledge to include undergraduate biology students. We show that the problems with systems thinking observed in K-12 students persist into undergraduate courses. This highlights the importance of prioritizing thinking about systems in undergraduate education, particularly as it has been identified as a Core Concept of biology (AAAS, 2011). While the use of a causal map assignment did not significantly improve students’ engagement in systems thinking, this study did help us to better understand the particular challenges we need to address to better support undergraduate students in both the Core Concept of Systems and the Core Competency of Modeling (AAAS, 2011). This study was intended as a pilot to determine whether students develop systems thinking during a class that discussed many aspects of systems thinking but did not provide specific instruction on how to think about systems or causal relationships among various aspects of systems. Therefore, we did not expect students to improve dramatically, however, we were still surprised by the consistent lack of improvement given consideration of systems (even though not systems thinking) in the course. Future work will focus on more directed instruction on both systems thinking and consideration of causal relationships.
This study is limited because of the small sample size within the botany course and limited time within the semester to complete the study and administer the causal maps. However, it has important implications for undergraduate biology instructors as they consider how to teach students about botany topics either in stand-alone botany courses, or as part of general biology or ecology courses.
Data availability statement
The raw data supporting the conclusions of this article will be made available by the authors, without undue reservation.
Ethics statement
The studies involving human participants were reviewed and approved by University of Memphis Institutional Review Board. The patients/participants provided their written informed consent to participate in this study.
Author contributions
JS, LZ, KP, and JK contributed to the conception and design of the study. JS, KP, and JK contributed to data collection. JS, KP and SS contributed to data analysis. JS, LZ, and KP wrote the manuscript. All authors contributed to the article and approved the submitted version.
Funding
This work was supported in part by the University of Memphis College of Arts and Sciences Faculty Research Grant and the University of Missouri Start-Up Support. This support does not necessarily imply endorsement by either University of research conclusions.
Conflict of interest
The authors declare that the research was conducted in the absence of any commercial or financial relationships that could be construed as a potential conflict of interest.
Publisher’s note
All claims expressed in this article are solely those of the authors and do not necessarily represent those of their affiliated organizations, or those of the publisher, the editors and the reviewers. Any product that may be evaluated in this article, or claim that may be made by its manufacturer, is not guaranteed or endorsed by the publisher.
Supplementary material
The Supplementary material for this article can be found online at: https://www.frontiersin.org/articles/10.3389/feduc.2023.1159486/full#supplementary-material
References
AAAS (2011). Vision and Change in Undergraduate Biology Education: A Call to Action. Washington, DC: American Association for the Advancement of Science.
Bang, M., Warren, B., Rosebery, A. S., and Medin, D. (2012). Desettling expectations in science education. Hum. Dev. 55, 302–318. doi: 10.1159/000345322
Bennett, S., Gotwals, A. W., and Long, T. M. (2020). Assessing students’ approaches to modelling in undergraduate biology. Int. J. Sci. Educ. 42, 1697–1714. doi: 10.1080/09500693.2020.1777343
Buchholz, T. S., Volk, T. A., and Luzadis, V. A. (2007). A participatory systems approach to modeling social, economic, and ecological components of bioenergy. Energy Policy 35, 6084–6094. doi: 10.1016/j.enpol.2007.08.020
Busta, L., and Russo, S. E. (2020). Enhancing interdisciplinary and systems thinking with an integrative plant chemistry module applied in diverse undergraduate course settings. J. Chem. Educ. 97, 4406–4413. doi: 10.1021/acs.jchemed.0c00395
Cox, M., Steegen, A., and Elen, J. (2018). Using causal diagrams to foster systems thinking in geography education. Int. J. Des. Learn. 9, 34–48. doi: 10.14434/ijdl.v9i1.22756
Coyle, K. (2005). Environmental Literacy in America: What Ten Years of NEETF/Roper Research and Related Studies Say about Environmental Literacy in the US. Washington, DC: National Environmental Education & Training Foundation.
Davis, A. C., and Stroink, M. L. (2016). The relationship between systems thinking and the new ecological paradigm. Syst. Res. Behav. Sci. 33, 575–586. doi: 10.1002/sres.2371
Evagorou, M., Korfiatis, K., Nicolaou, C., and Constantinou, C. (2009). An investigation of the potential of interactive simulations for developing system thinking skills in elementary school: a case study with fifth-graders and sixth-graders. Int. J. Sci. Educ. 31, 655–674. doi: 10.1080/09500690701749313
Gilbert, J. K. (2004). Models and modelling: routes to more authentic science education. Int. J. Sci. Math. Educ. 2, 115–130. doi: 10.1007/s10763-004-3186-4
Grotzer, T. A., and Tutwiler, M. S. (2014). Simplifying causal complexity: how interactions between modes of causal induction and information availability lead to heuristic-driven reasoning. Mind Brain Educ. 8, 97–114. doi: 10.1111/mbe.12054
Hanisch, S., and Eirdosh, D. (2021). Causal mapping as a teaching tool for reflecting on causation in human evolution. Sci. Educ. 30, 993–1022. doi: 10.1007/s11191-020-00157-z
Hokayem, H., and Gotwals, A. W. (2016). Early elementary students’ understanding of complex ecosystems: a learning progression approach. J. Res. Sci. Teach. 53, 1524–1545. doi: 10.1002/tea.21336
Institute of Play (2020). Causal maps with return to feedback loops. Q Design Pack Systems Thinking, 33–34. Available at: https://clalliance.org/wp-content/uploads/2020/02/Design-Pack-Systems-Thinking.pdf
Jacobson, M. J. (2001). Problem solving, cognition, and complex systems: differences between experts and novices. Complexity 6, 41–49. doi: 10.1002/cplx.1027
Jordan, R., Singer, F., Vaughan, J., and Berkowitz, A. (2009). What should every citizen know about ecology? Front. Ecol. Environ. 7, 495–500. doi: 10.1890/070113
Ke, L., Sadler, T. D., Zangori, L., and Friedrichsen, P. J. (2020). Students’ perceptions of socio-scientific issue-based learning and their appropriation of epistemic tools for systems thinking. Int. J. Sci. Educ. 42, 1339–1361. doi: 10.1080/09500693.2020.1759843
Mambrey, S., Timm, J., Landskron, J. J., and Schmiemann, P. (2020). The impact of system specifics on systems thinking. J. Res. Sci. Teach. 57, 1632–1651. doi: 10.1002/tea.21649
Mehren, R., Rempfler, A., Buchholz, J., Hartig, J., and Ulrich-Riedhammer, E. M. (2018). System competence modelling: theoretical foundation and empirical validation of a model involving natural, social, and human-environment systems. J. Res. Sci. Teach. 55, 685–711. doi: 10.1002/tea.21436
Momsen, J., Speth, E. B., Wyse, S., and Long, T. (2022). Using systems and systems thinking to unify biology education. CBE: Life Sci. Educ. 21:es3. doi: 10.1187/cbe.21-05-0118
Montibeller, G., and Belton, V. (2006). Causal maps and the evaluation of decision options—a review. J. Oper. Res. Soc. 57, 779–791. doi: 10.1057/palgrave.jors.2602214
NRC. (2011). Assessing 21st Century Skills: Summary of a Workshop. Washington, DC: National Academies Press.
Parsley, K. M., Daigle, B. J., and Sabel, J. L. (2022). Initial development and validation of the plant awareness disparity index. CBE: Life Sci. Educ. 21:ar64. doi: 10.1187/cbe.20-12-0275
Perkins, D. N., and Grotzer, T. A. (2005). Dimensions of causal understanding: the role of complex causal models in students' understanding of science. Stud. Sci. Educ. 41, 117–165. doi: 10.1080/03057260508560216
Pronk, N. P., and Faghy, M. A. (2022). Causal systems mapping to promote healthy living for pandemic preparedness: a call to action for global public health. Int. J. Behav. Nutr. Phys. Act. 19:13. doi: 10.1186/s12966-022-01255-7
Richardson, G. P. (2011). Reflections on the foundations of system dynamics. Syst. Dyn. Rev. 27, 219–243. doi: 10.1002/sdr.462
Sabel, J. L. (2020). Using the FRAMER scaffold design framework to support students in learning and understanding biology. Am. Biol. Teach. 82, 150–155. doi: 10.1525/abt.2020.82.3.150
Sabel, J. L., Vo, T., Alred, A., Dauer, J. M., and Forbes, C. T. (2017). Undergraduate students’ scientifically-informed decision-making about socio-hydrological issues. J. Coll. Sci. Teach. 46, 64–72. doi: 10.2505/4/jcst17_046_06_71
Schultz, M., Chan, D., Eaton, A. C., Ferguson, J. P., Houghton, R., Ramdzan, A., et al. (2022). Using systems maps to visualize chemistry processes: practitioner and student insights. Educ. Sci. 12:596. doi: 10.3390/educsci12090596
Shin, H. S., and Jeong, A. (2021). Modeling the relationship between students’ prior knowledge, causal reasoning processes, and quality of causal maps. Comput. Educ. 163:104113. doi: 10.1016/j.compedu.2020.104113
Sterk, M., van de Leemput, I. A., and Peeters, E. T. (2017). How to conceptualize and operationalize resilience in socio-ecological systems? Curr. Opin. Environ. Sustain. 28, 108–113. doi: 10.1016/j.cosust.2017.09.003
Verhoeff, R. P., Knippels, M. C. P., Gilissen, M. G., and Boersma, K. T. (2018). The theoretical nature of systems thinking. Perspectives on systems thinking in biology education. Front. Educ. 3:40. doi: 10.3389/feduc.2018.00040
Zangori, L., and Cole, L. (2019). Assessing the contributions of green building practices to ecological literacy in the elementary classroom: an exploratory study. Environ. Educ. Res. 25, 1674–1696. doi: 10.1080/13504622.2019.1662372
Keywords: systems thinking, ecosystems, undergraduate biology, causal maps, botany
Citation: Sabel JL, Zangori L, Parsley KM, Sous S and Koontz J (2023) Investigating undergraduate students’ engagement in systems thinking and modeling using causal maps. Front. Educ. 8:1159486. doi: 10.3389/feduc.2023.1159486
Edited by:
Christoph Kulgemeyer, University of Bremen, GermanyReviewed by:
Alfonso Garcia De La Vega, Autonomous University of Madrid, SpainMarc De Vries, Delft University of Technology, Netherlands
Copyright © 2023 Sabel, Zangori, Parsley, Sous and Koontz. This is an open-access article distributed under the terms of the Creative Commons Attribution License (CC BY). The use, distribution or reproduction in other forums is permitted, provided the original author(s) and the copyright owner(s) are credited and that the original publication in this journal is cited, in accordance with accepted academic practice. No use, distribution or reproduction is permitted which does not comply with these terms.
*Correspondence: Jaime L. Sabel, amxzYWJlbEBtZW1waGlzLmVkdQ==
 Jaime L. Sabel
 Laura Zangori
 Kathryn M. Parsley3
 Sedra Sous