Abstract
Mathematical modelling addresses numerous demands of modern mathematics education: The learning of mathematics is directly linked to reality and hence to real objects. At the same time, these tasks are very challenging for students, especially when their own solution process needs to be validated and refined. Studies even show that some students do not validate their results at all. Recent research has shown that digital tools can enhance the support of modelling activities in different ways. In this paper, we take the modelling step of validation into a deeper account and explore the potential of MathCityMap, a digital tool for outdoor mathematics education. Hereby, its automatic solution validation by means of a predefined interval and assessment of the result’s quality are taken into consideration. The modelling activities of secondary school students are compared on a quantitative and qualitative level – half of the students working with the MathCityMap app and half of them solving the tasks without any digital support. Based on the quantitative results, we can see that the app functionalities for elaborative feedback are used to varying degrees: While student groups frequently access the hints, the sample solution is hardly accessed. Moreover, our analysis can show the value of corrective app feedback. Student groups that used the app solved a comparable number of problems, but failed significantly less often than student groups that worked on math trails without the app. The qualitative results show that in particular the solution validation forces the students to proceed with a second run in the modelling cycle if a result is valued as wrong in the app. In addition, it helps the students to assess their own result in terms of its correctness. Based on the combined results, we draw conclusions about the app usage in mathematical modelling tasks.
1. Introduction
1.1. Validation in mathematical modelling
Mathematical modelling activities derive from tasks in which reality and mathematics come together in form of a problem taken from reality which should be solved using mathematics. Particularly because of its indispensable relation to reality, modelling problems are distinct from the classical inner-mathematical problem (Blum and Leiss, 2007). According to Blum and Leiss (2007), modelling problems involve seven modelling steps that are arranged in a cycle: To solve a modelling problem, students (1) understand the problem, (2) simplify it by selecting important information, (3) mathematize the problem and transfer it into the world of mathematics, (4) work on it mathematically, (5) interpret the gained result and transfer it back to reality, (6) validate the result, (7) present the result (Blum and Leiss, 2007; cf.Figure 1).
Figure 1
The modelling cycle idealizes the actual student work on modelling problems. From the research of Borromeo Ferri (2010), it is known that numerous students do not work through the cycle step by step, but instead skip steps, jump from one step to another or go back to previous steps. Still, the modelling cycle helps educators to observe and categorize challenges and problems that students encounter while working on a modelling problem. The following empirical examples report challenges related to the particular steps of the modelling cycle (Table 1).
Table 1
| Step | Selected empirical studies |
|---|---|
| (1) understand the problem given as a situation model | Blum and Leiss (2007); Hagena et al. (2017); Schukajlow (2010) |
| (2) simplify it by choosing important information | Blum and Leiss (2007); Buchholtz (2017); Ludwig and Jablonski (2021); Schukajlow (2010); Stillman et al. (2013) |
| (3) mathematize the problem and transfer it into the world of mathematics | Buchholtz (2017); Ludwig and Jablonski (2021); Schukajlow (2010); Stillman et al. (2013); Stillman et al. (2015) |
| (4) work on it mathematically | Schukajlow (2010) |
| (5) interpret the gained result and transfer it back to reality | Schukajlow (2010); Stillman et al. (2013) |
| (6) validate the result | Blum (2007); Blum and Leiss (2007); Hankeln (2020); Stillman et al. (2013) |
| (7) present the result | – |
Overview of studies on problems concerning different modelling steps.
The scope of this article is to examine the role of the validation step in more detail. The validation step is described as checking gained results and that it “connects the real results back to the situation model” (Hankeln, 2020, p. 278). It becomes clear that students must have reached a result first in order to be able to start this step at all. In that case, students have to critically reflect their previously made modelling activities and identify possible weaknesses in their own approach, e.g., question their model, simplifications and calculations. Especially when the modelling activity is judged as not successful, the students might accept that a second try is necessary (Hankeln, 2020). “Hence, this step needs more reflection from a meta-perspective than any other step of the modelling cycle. Therefore, the validating competency is also intertwined with students’ abilities in self-regulation and self-evaluation as well as with their abilities to monitor their work.” (Hankeln, 2020, p. 278). In the following, the role of feedback is discussed in more detail as a possible guidance of students in their validation processes in mathematical modelling.
1.2. Validation through feedback
In a paper still relevant today, feedback is defined as “information about the gap between the actual level and the reference level of a system parameter which is used to alter the gap in some way” (Ramaprasad, 1983, p. 4). It is seen as a teacher’s key instrument for formative assessment, although it can also be carried out by other agents, e.g., peers or the learners themselves (Narciss et al., 2014; Wiliam and Thompson, 2017).
Hattie and Timperley (2007) highlight that feedback can focus four levels:
Feedback on the task level delivers information about how well a student performed on a task. In particular, a statement about the tasks’ correctness is given. For this reason, it is also called corrective feedback.
Feedback on the process level contains information on how the student performed on a task. Thus, it includes the processing of the task and the used strategies instead of solely focusing on the final product or solution.
Feedback on self-regulation gives information on a student’s skill used for task processing or needed for the work on further tasks. Thus, it includes information on self-monitoring, directing and regulation of actions.
Feedback on a self-level is related to personal characteristics without relation to the task.
Regarding the task and process level, one can define formative feedback as “information communicated to the learner that is intended to modify his or her thinking or behavior for the purpose of improving learning” (Shute, 2008, p. 154). Hereby, a verification and elaboration function of feedback can be distinguished: Verification focus on the correctness of the answer and can be accomplished for example by stating the correct solution (“knowledge of correct result”), further attempts (“repeat-until-correct”) or error flagging (“location of mistakes”) (Shute, 2008). In terms of Hattie and Timperley (2007), the verification function focusses the task level. Elaborated feedback explains why the student’s answer is incorrect (Shute, 2008). Thus, it does not only focus on the task level but also on the process level (cf.Hattie and Timperley, 2007). This can include additional information on the treated topic, strategic hints and the identification of misconceptions (Shute, 2008). Tutoring feedback is seen as the most elaborated form of feedback, combining verification feedback with error flagging and strategic hints, respectively, mastery learning strategies (Shute, 2008; Narciss et al., 2014).
Despite which kind of feedback is given, there is a consensus that the feedback needs to activate the learner, i.e., leading to an active engagement with the given feedback (Shute, 2008; Black and Wiliam, 2009; Havnes et al., 2012). In other words, the feedback must be provided in such a way that the students are willing to seek and deal with the feedback information (Hattie and Timperley, 2007).
1.3. Digital feedback
Already in the mid-1980’s, Anderson et al. (1985) stated that computer programmes “for intelligent tutoring are being developed to provide the student with the same instructional advantage that a sophisticated human tutor can provide” (p. 456). Hereby, intelligent tutoring systems provide instruction in the problem solving context, appropriate assistance based on the student’s needs and immediate feedback on errors (Corbett et al., 1997).
The development and implementation of intelligent tutoring systems is still relevant today. New approaches are characterized by adaptive, interactive and self-paced learning environments (Steenbergen-Hu and Cooper, 2013). New approaches aim to integrate artificial intelligence (Mousavinasab et al., 2021) or personalized feedback (see for example Pai et al., 2021). However, what previous and recent approaches have in common, is the aim to reduce the cognitive load of the students by appropriate guidance and assistance (cf.Corbett et al., 1997): since the capacity to process information is limited according to the cognitive load theory (Tuovinen and Sweller, 1999), feedback should be given in such a way that the students have enough free capacities to deal with the received feedback. This assumption is taken up in the guided feedback hypothesis: elaborative feedback including plausible explanation for the discovery made tend to be more effective than purely verification feedback (Moreno, 2004). State of the Art.
In their meta-analysis, Hattie and Timperley (2007) report the average effect size of feedback on students’ achievement in general to be 0.79. This is twice the average effect size shown by Hattie’s meta-analysis visible learning (cf.Hattie and Timperley, 2007). Also, the updated meta study indicates a high effect size of feedback on student’s achievement (Hattie and Zierer, 2019), while the recent meta-study of Wisniewski et al. (2020) following a more elaborated approach shows a medium effect (d = 0.48). Even if the latter meta study shows a considerably lower effect of feedback, the authors conclude: “Feedback, on average, is powerful, but some feedback is more powerful” (Wisniewski et al., 2020, p. 13).
The way how feedback is given has clearly an impact on students’ learning progress. Feedback is more effective if it aims on a cognitive or physical than on a motivational or behavioral outcome. Furthermore, feedback has a greater impact, if it contains information on the task and the process level as well as the self-regulation level. This high-information feedback has an effect size of d = 0.99 (strong effect), while a low to medium effect is reported for corrective feedback (0.46; Wisniewski et al., 2020). This result is in line with the prior findings (Kluger and DeNisi, 1996; Hattie and Timperley, 2007).
With these findings on feedback focusing on task processes in general, it becomes obvious that feedback can be an important influence for the valuation of modelling results in particular. As it was pointed out in the introduction, the validation step requires special demands from the students in terms of reflection and self-regulation. Because of these special demands of validating the gained result, this step of the modelling cycle can rarely be found in students’ independent modelling activities (Blum, 2007), because students seem to lack considerations about responsibility and appropriateness, for which the teacher seems to be exclusively responsible (Blum and Ferri, 2009). Combined with observed strategies, such as “Ignore the context, just extract all data from the text and calculate something according to a familiar schema” (Blum, 2015 cited in Buchholtz, 2017, p. 49), overwhelmed students seem to work product-oriented on modelling problems, following the attempt to simply achieve a result. In contrast to the actual idea of mathematical modelling being linked to realistic situations, only using calculations and schemas does not allow a realistic validation, in the sense of reflecting on the reliability of the result and might lead to the acceptance of arbitrary or simply wrong results. Still, it seems legitimate to assume that corrective feedback will also enhance student learning in the context of modelling tasks.
In order to initiate and enhance students’ validation activities, digital tools were being used and their functionality being tested. Greefrath et al. (2018) describe the use of digital tools as a general potential for real-world modelling problems. In the context of validation, the monitoring and check of resulting solutions (Hegedus et al., 2016; Greefrath et al., 2018) are described to being supported by digital tools. Even more, providing a digital validation option can not only provide an external checking of results, but it increases the students’ self-evaluation as reported by Mousoulides (2011) in a Dynamic Geometry Environment. The use of digital tools can therefore be two-sided with the support and initiation of validation activities, whereas the focus differs with the possibilities and features a digital tool offers. In the following, we will be focusing on digital feedback.
The efficacy of digital feedback on the task and its processing in computer-based learning environments was investigated in a meta-analysis by Van der Kleij et al. (2015). Following and extending the earlier given approach by Shute (2008), the authors distinguish between three types of feedback. The first is knowledge of results (KR), which is corrective feedback without additional information, e.g., error flagging is classified as KR feedback. The second type of feedback is knowledge of correct results (KCR), where only the correct answer is provided. The third type is elaborated feedback (EF) where an explanation as to why the answer is correct or incorrect is given. Also, elaborated feedback can be given on a strategic level, e.g., by providing hints. The results of the meta-study (Van der Kleij et al., 2015) show that EF has a larger effect (Hedge g* = 0.49; nearly medium effect) than KCR feedback (g* = 0.32; small effect), while solely KR has no effect on student’s learning progress (g* = 0.05). Even though the reported effect sizes are smaller than in Wisniewski et al. (2020), a comparable effect can be observed: the more information is given on task and process level, the more effective the feedback is.
This result is also shown for specific feedback strategies. For example, de Kock and Harskamp (2016) showed for word problems that students were able to solve more tasks if the hints include not only procedural knowledge but link it to the given contents. Also in view of mathematical problem solving, Attali (2015) could show that the provision of hints after a wrong answer led in multimedia environments to a better performance of students compared to a group that did not receive hints after a wrong entry. Other researchers reported a gender difference for hints usage. According to Narciss et al. (2014) especially conceptual hints have a greater impact on the learning progress of girls than on boys.
1.4. Research question
In the previous sections, we summarized recent research results on validation activities for mathematical modeling and on verification and elaboration feedback, partly in digital environments. As a first objective, it is the aim of this paper to combine both topics and to examine the role of digital feedback in the context of validation in mathematical modelling. As second objective, we aim to investigate students’ validation activities with support of digital feedback in a special setting, namely in view of outdoor mathematics tasks. Based on the state of the art, how digital feedback affects the validation process in this environment can be considered a research gap. We therefore focus on the research question:
How can digital feedback support secondary school students’ validation activities in mathematical outdoor modelling problems?
We hereby limit the article’s focus to the context of mathematical modelling tasks that are solved directly at the real object using the digital tool MathCityMap. The MathCityMap system has been developed since 2012 at Goethe University and contains two components: a web portal in which teachers can create outdoor tasks and a smartphone app that guides students along these outdoor tasks. Besides other technologies like Actionbound (Buchholtz, 2021) or GoogleMaps (Fesakis et al., 2018), the MathCityMap system has been used for research in the fields of outdoor mathematical modelling (e.g., Hartmann and Schukajlow, 2021; Ludwig and Jablonski, 2021).
In the following, we will present the features of the digital tool and give an insight into the methodology of two related studies that provide quantitative and qualitative data in order to answer the formulated research question. Figure 2 presents the theoretical background of the article and the interplay of the quantitative and qualitative approaches.
Figure 2
2. Material and methods
In order to answer the research questions two studies have been conducted that are related to each other. Both report on data gained through an empirical investigation with secondary school students solving outdoor modelling tasks with MathCityMap.
We start by describing the features of the digital tool MathCityMap. Afterwards, the methodology of both the quantitative and qualitative study are presented in the context of the article’s research question.
2.1. The digital tool MathCityMap
MathCityMap is a digital tool to support students while solving outdoor mathematics tasks related to real objects in the students’ environment (Ludwig and Jesberg, 2015). Hereby, the approach of math trails (cf.Blane and Clarke, 1984) is used – an approach that can be linked to the basic idea of mathematical modelling for two main reasons:
The tasks can only be solved at the real object which requires mathematical activities and data collections (Shoaf et al., 2004; Buchholtz, 2017). The link between reality and mathematics is therefore apparently given. Moreover, the required steps to process math trail tasks can be linked to the modelling cycle (Buchholtz, 2021).
The design requirements for outdoor tasks (Jablonski et al., 2018) propose open tasks that allow different solution processes and strategies, as well as different degrees of simplifications and choices of mathematical models (Ludwig and Jablonski, 2021).
With the research question focusing on the students’ perspective on validation, the app’s functionalities will be presented in more detail (cf.Figure 3):
Hints: For each task, the students can retrieve up to three hints which aim to guide and to structure student’s working process (cf.Shute, 2008; de Kock and Harskamp (2016)). Following Shute (2008), hints can be seen as a form of elaborate feedback.
Answer Validation: When entering a result, the app automatically checks this result – in case of modelling tasks – by means of a pre-defined interval. Hereby, a very good, an acceptable and a wrong range are the basis for the particular app feedback. Hereby, MathCityMap, hence, uses two different verification functionalities (cf.Shute, 2008): if a wrong answer is given, the students again can make further attempts to enter a correct solution (cf.Hankeln, 2020). If a correct answer is entered or the students declare that they failed to give a correct answer to the task, the correct response is indicated by the app.
Sample Solution: After entering a correct or acceptable solution or giving up on a task, the students can view the sample solution provided for the task. According to Shute (2008), viewing the sample solution can also be considered as elaborative feedback since an explanation on how the correct answer is calculated is given.
Figure 3
Regarding feedback and validation, the MathCityMap app offers both verification and elaboration. With reference to the theoretical considerations on validation, the app serves as a digital tool that can initiate the validation of (interim) results (e.g., hints and answer validation). In addition, it can guide the validation process in terms of the result’s quality (answer validation and sample solution) and therefore support a reasoned assessment of the result.
2.2. Quantitative study on validation activities
To examine how students work on math trail tasks and how they validate their results, a quasi-experimental study was conducted in Spring and Summer 2022 with 13 classes. The students, German 8th graders (grammar school; approx. 14 years old), worked in groups of three on a math trail for 60–70 min. While student groups of seven classes used the MathCityMap app including all above mentioned features (MCM groups), student groups of six classes ran the math trails without technical support (P&P groups). Thus, the latter group did a ‘classic’ paper-and-pencil math trail as indicated by Blane and Clarke (1984) and Shoaf et al. (2004).
The trails were organized as so-called theme-based trails (cf.Barlovits et al., 2020) with a special focus on linear functions. To guarantee that all students worked on tasks about linear functions, proportionality and the slope concept, two tasks of the trail each dealt with the same topic. The following task types were given in the math trail (Table 2).
Table 2
| Task No. | Topic | Object | Shortened task formulation | Task picture |
|---|---|---|---|---|
| 1 & 7 | Linear function | Handrail | Determine the equation y = mx + b of the straight line describing the handrail of the staircase. Enter b in meters | 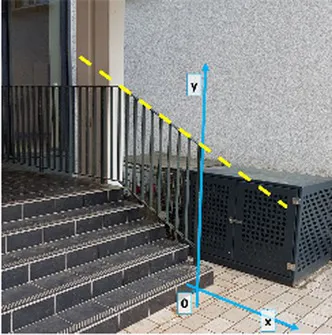 |
| 2 & 8 | Proportionality | e.g., price list | You want to buy 8 chocolate rolls, 12 pretzels, and 6 pudding cups for your class. How much does this cost? | 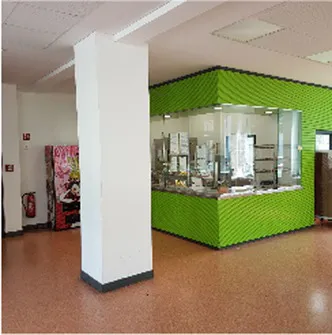 |
| 3 & 9 | Count | e.g., windows | How many glass blocks are there at the front of the building? | 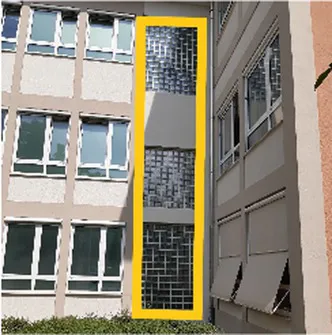 |
| 4 & 10 | Linear function | e.g., sculpture with uniformly rising side surface | Fill in the missing technical terms in the following cloze | 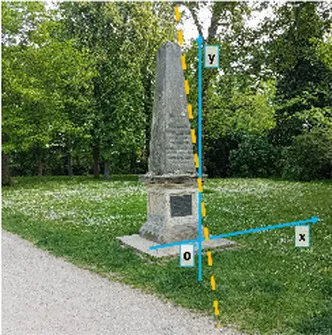 |
| 5 & 11 | Slope | Ramp | Determine the slope of the ramp. Give the result as in percentage | 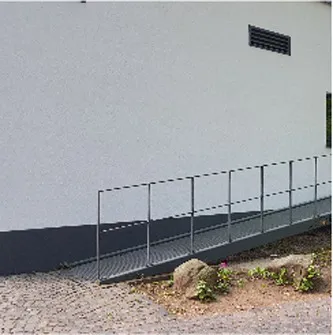 |
| 6 & 12 | Length units | Two prominent objects | Determine the distance between the two objects marked in the task picture. Enter the result in meters | 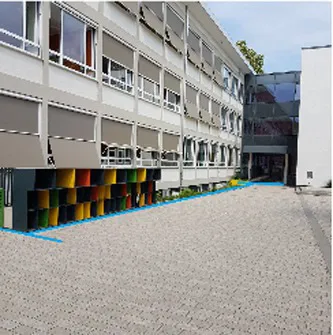 |
The task types of the theme-based math trail on linear functions.
All task types can only be solved on site of the real object by collecting data and dealing with the context setting (cf.Shoaf et al., 2004; Buchholtz, 2017). Different models, processes and solution strategies can be developed, in particular, in task types 1 & 7 as well as 5 & 11 in order to find a suitable gradient triangle. Hereby, the students have to simplify and structure the given task surrounding and decide on the data collection process in order to transfer the presented object into a linear function (cf.Ludwig and Jablonski, 2021). In the sense of providing this open scenario in terms of different simplifications and mathematizations, the task types from Table 2 are regarded as modelling tasks that particularly focus on the two mentioned steps.
The trail was adapted to the schoolyards of the six schools participating in the study and to the given local conditions. However, we want to emphasize that the original task wording and the strategies to solve the task remained unchanged. An example trail in German language can be accessed by entering the code “179,794” in the MathCityMap app.
For the MCM group, the interaction of the students with the MathCityMap app was logged in an event-log. This included information on the use of hints, the entered results, the view of the sample solution and related timestamps. Hence, by evaluating this event-log, the students’ use of these app features can be determined. Moreover, the students’ performance on the tasks can be evaluated as well. To do so for the P&P group, the notes made during the math trail were investigated. Based on a comparison of the groups’ performances, the value of the MathCityMap app in terms of the validation features can be described. The data analysis is carried out with the statistics programme JASP.
2.3. Qualitative case study on validation activities
With a focus on the role of MathCityMap in terms of the students’ modelling activities, i.e., validation, a qualitative case study was conducted in May 2022. For the aim of this article, we involve nine groups of students with a total of 29 students from grades 6–8. All of them visited the enrichment programme Junge Mathe-Adler Frankfurt.
The students formed groups of three and were asked to solve an outdoor modelling task. In total, there were three different tasks from the field of geometry. For the later examinations in the case studies, particularly the task “The Sculpture” will be taken into consideration. Therefore, we present this task as one example of the three outdoor tasks in more detail. The sculpture is placed at Goethe University Frankfurt and is a six meters’ tall sculpture named Rotazione. The sculpture’s name comes from the regular spikes that are turned upwards along the sculpture, getting smaller. Being on site of the object, the students should determine the surface of the sculpture (see Figure 4).
Figure 4
This task can be categorized as a modelling task since several different models and ways are possible to determine the sculpture’s surface. One example modelling is examined here:
The Rotazione sculpture’s height can be determined using the intercept theorem or estimations: It is about six meters high. In this example, we calculate its surface by describing the individual prongs as triangles. The legs and height of a triangle are approximately 6 m long, the base approximately 30 cm. This results in an area of about 0.9 m2 per triangle. The figure consists of 12 prongs with two triangles each, so the surface area is about 21.6 m2. By comparing different models and approaches, a solution interval was defined with 17–26 m2.
All groups were equipped with a folding ruler to take measurements if desired. Whereas six groups worked on the task without any digital support, three groups worked with the MathCityMap app through which they could access hints, automatic feedback and the sample solution. The hints should support the Simplify and Structure and Mathematize steps:
Hint 1: Look for a model that you can use to describe the sculpture. There are several models that could be considered and none will fit perfectly.
Hint 2: You can approximate the prongs of the sculpture, e.g., by using triangles or squares.
Hint 3: Think about the values you need for your model and how you can approximate, measure or determine them as accurately as possible.
While using the hints was optional, the groups working with the MathCityMap app were explicitly asked to have their result validated by the app. After solving a task correctly or giving up, the MathCityMap groups were able to view the sample solution with one of the possible solutions for the modelling task.
The groups’ solution processes were filmed by a student assistant. The video interactions were transcribed and coded deductively using the modelling steps according to Blum and Leiss (2007). With the article’s focus on validation by means of digital tools, a particular focus was laid on this modelling step. Herefore, the activities of the digital and non-digital groups were compared, coding the observed validation activities in a qualitative content analysis according to Mayring (2000). In addition, the app activities were stored in the MathCityMap database and added to the coding of the groups using the app as follows:
Retrieval of Hint 1/2/3
Solution Input correct/incorrect
View of Sample Solution
3. Results
In the following section, we report the results from both studies. As for the methods, we start with a quantitative perspective and continue with qualitative results. In the discussion part, both perspectives are combined and reflected.
3.1. Quantitative results
To investigate how students use the validation features of the MathCityMap app when working on outdoor modelling tasks, a quasi-experimental study was conducted with 13 classes. While seven classes worked on a math trail with digital support, six classes performed a “classic” paper-and-pencil math trail without immediate validation.
3.1.1. Solution rate of and validation activities by groups with digital support
To examine students’ work on math trails, the task processes of 52 groups from the seven classes working with the MathCityMap app were studied. A total of 422 task processes were logged for the 12 tasks presented above. Since two tasks comprised the same question on similar objects, they are considered as one task type below.
The interaction of the groups with the MathCityMap app is presented in Table 3. As expected, the solution rate of the task types varied. While task types 1 & 7 could be solved by about 52% of the student groups, the other tasks had a solution rate of 74% (task type 5 & 11) or more than 85% (remaining tasks). Task difficulty is also reflected in the number of incorrect entries per task completion. For the measurement tasks 6 & 12, almost all groups were able to directly enter a correct solution. For the task types 1 & 7 as well as 5 & 11, in which the students had to choose an appropriate strategy and model to define the slope triangle, on average 2,0, respectively, 1,3 incorrect entries were made per group.
Table 3
| Task type | Number of task processes | Task solved (%) | Task failed (%) | Task skipped (%) | Task not finished (%) | Mean value of wrong entries |
|---|---|---|---|---|---|---|
| 1 & 7 | 71 | 52.1% | 0.0% | 42.3% | 5.6% | 2.0 |
| 2 & 8 | 67 | 85.1% | 0.0% | 7.5% | 7.5% | 0.9 |
| 3 & 9 | 73 | 90.4% | 1.4% | 5.5% | 2.7% | 0.6 |
| 4 & 10 | 71 | 91.5% | 1.4% | 5.6% | 1.4% | 0.9 |
| 5 & 11 | 77 | 74.0% | 2.6% | 22.1% | 1.3% | 1.3 |
| 6 & 12 | 76 | 96.1% | 0.0% | 3.9% | 0.0% | 0.2 |
Task process of the student groups: solving, failing and skipping behavior and numbers of wrong entries.
Additionally, the failing and skipping behavior of the groups were analyzed. While failing means that the students give up on the task and can access the sample solution, skipping means a temporary postponement of the task with the opportunity to continue the task later. This option was implemented in the MathCityMap app to avoid overcrowded task spots. Especially in the two more difficult tasks 1 & 7, it is clear that this option was abused by the students: instead of giving up the task, they skipped it. Here, only a minority of the groups continued the task processing, i.e., about 15% of all skipped processes of task types 1 & 7 were subsequently solved or failed.
The student groups consulted the hints regularly during their work processes (Table 4): Even for tasks with a solution rate above 85%, a considerable number of groups used the hints. For the more difficult task types 1 & 7 and 5 & 11 (in terms of their empirical solution rate), more than 60% of the groups used the hints.
Table 4
| Task No. | Number of task processes with hints used | Task solved if hints used | Task solved if hints not used | Chi-squared test | |
|---|---|---|---|---|---|
| p | Kendall’s Tau-b | ||||
| 1 & 7 | 49 69.0% | 28 out of 49 57.1% | 4 out of 22 18.2% | 0.002 | 0.362 medium |
| 2 & 8 | 19 28.4% | 13 out of 19 68.4% | 44 out of 48 91.7% | 0.017 | −0.294 small |
| 3 & 9 | 18 24.7% | 14 out of 18 77.8% | 52 out of 55 94.5% | 0.037 | −0.245 small |
| 4 & 10 | 43 60.6% | 41 out of 43 95.3% | 23 out of 28 82.1% | 0.068 | n.s. |
| 5 & 11 | 48 62.3% | 37 out of 48 77.1% | 17 out of 29 58.6% | 0.086 | n.s. |
| 6 & 12 | 13 17.1% | 12 out of 13 92.3% | 61 out of 63 96.8% | 0.446 | n.s. |
Use of hints related to students’ ability to solve the task.
To evaluate if using hints impacts the student’s ability to solve the task, we compare the solution frequency with and without the use of hints by the Chi-squared test of independence. Contrasting findings can be obtained. For the most difficult task types 1 & 7, using hints increases significantly the solution rate (medium effect size). For the easier task types 2 & 8 and 3 & 9, the solution rate is considerably higher if no hints are used (significant differences with a small effect). For the other task types, the solution rate remains unchanged (task types 6 & 12) or tends to increase with the use of hints (task types 4 & 10 and 5 & 11) without significant results. Thus, the presence of hints to guide and support the task process does not automatically lead to greater student success in solving the task. However, since the number of solved tasks and the usage ratio of hints per task process correlates significantly with a medium effect size (Spearman’s rho = 0.365, p < 0.05, n = 52), it can be assumed that especially weaker groups used the hint function more regularly in terms of their need for support. For the easier tasks, this fact might lead to the described small effect in terms of a lower solution rate after hint usage. The fact that the hints can support a successful task solution on the most difficult tasks could be explained by the high relevance of mathematizing in this task type: To solve task types 1 & 7 (and 5 & 11), students had to first find a suitable gradient triangle.
As shown in Table 5, the sample solution was only rarely accessed. On the one hand, while it is invoked by a maximum of one fifth of all student groups at maximum (for task type 5 & 11), it was accessed in 14.5% of the solution processes for the easiest task type and only once for the most difficult task types 1 and 7. On the other hand, all four groups that did not solve a task accessed the sample solution. Thus, it can be assumed that for the student groups that solved the task, the app feedback “correct answer” was sufficient for a large majority: If they were able to solve the task, they did not feel the need to compare their own solution path with a sample solution. This finding is independent of task difficulty.
Table 5
| Task No. | View of the sample solution | View of sample solution if task solved | View of sample solution if task failed |
|---|---|---|---|
| 1 & 7 | 1 2.7% | 1 out of 32 2,7% | N.A. |
| 2 & 8 | 2 3.5% | 2 out of 57 3.5% | N.A. |
| 3 & 9 | 6 9.0% | 5 out of 66 7.6% | 1 out of 1 100% |
| 4 & 10 | 5 7.6% | 4 out of 65 6.2% | 1 out of 1 100% |
| 5 & 11 | 12 20.3% | 10 out of 57 17.5% | 2 out of 2 100% |
| 6 & 12 | 11 15.1% | 11 out of 73 15.1% | N.A. |
View of the sample solution after solving or failing the task.
As a first interim result, it can be hypothesized that the hints can support the students’ modelling processes, particularly for more difficult tasks. The sample solution is rarely used by the student groups who solved the tasks but by all student groups who failed the tasks. The frequently used option “skipping the task” led to the problem that these groups of students cannot call up the sample solution.
3.1.2. Comparison of groups with and without digital support
To further investigate the value of digital feedback when working on math modelling problems, we compare students who worked with the MathCityMap app and hence received feedback (MCM groups) to students who did not receive feedback (P&P groups). Here, the P&P groups’ calculated solutions were scored as correct or incorrect as if they had entered their solution into the app. The solution rates of the MCM (52 groups; 422 task processes) and P&P groups (46 groups; 413 task processes) are compared in Table 6.
Table 6
| Tasks | Tasks solved | Task failed | ||||
|---|---|---|---|---|---|---|
| MCM | P&P | MCM | P&P | MCM | P&P | |
| Groups | 52 | 46 | 52 | 46 | 52 | 46 |
| Median | 9.0 | 9.0 | 7.0 | 5.0 | 1.0 | 4.0 |
| MAD | 2.0 | 2.0 | 2.0 | 1.5 | 1.0 | 1.0 |
| Mean | 8.4 | 9.0 | 6.8 | 4.8 | 1.5 | 4.2 |
| Std. Deviation | 2.7 | 2.5 | 2.7 | 2.1 | 1.6 | 1.7 |
| Minimum | 2 | 3 | 2 | 1 | 0 | 2 |
| Maximum | 12 | 12 | 12 | 9 | 9 | 8 |
Comparison of the working process of the MCM and the P&P group.
While the MCM groups worked on an average of 8.4 tasks (SD: 2.7; mean: 9.0), the P&P groups worked on 9.0 tasks (SD: 2.5; mean: 9.0). Using the Mann–Whitney U test (alpha = 0.05; p = 0.236), no significant difference can be found in the number of tasks worked on, i.e., the MCM and P&P classes worked on a comparable number of tasks. In other words, the functionalities of the app and especially the feedback functions did not slow down the progress of the math trail.
However, significant effects can be found when the number of solved or failed tasks is taken into account. For the MCM groups, skipping or not finishing the task process was counted as failing the task. By a medium effect, the MCM groups were able to solve more tasks than the P&P groups (Mann–Whitney U test, W = 1707.5, p < 0.001, r = 0.428). With a strong effect, the MCM groups failed significantly fewer tasks than the P&P groups (W = 233.5, p < 0.01, r = 0.805).
To investigate the influence of task difficulty, the comparison of MCM and P&P groups is repeated considering the six different task types. The number of tasks worked on and solved is shown in Table 7. For all six task types, the solution rate of the P&P groups was lower compared to the MCM groups. To confirm the observation that the P&P groups were less successful in solving the tasks, a Mann–Whitney U test was performed based on a 3-level ordinal scale:
two tasks accessed and solved or one task assessed and solved
two tasks accessed whereby one task solved and one task failed
two tasks accessed and failed or one task assessed and failed
Table 7
| MCM | P&P | Mann–Whitney U test | ||||
|---|---|---|---|---|---|---|
| Task No. | No. task processes | Solving the task | No. task processes | Solving the task | p | r |
| 1 & 7 | 71 | 37 55.2% | 69 | 18 26.0% | < 0.001 | 0.383 medium |
| 2 & 8 | 67 | 57 91.9% | 66 | 36 54.5% | < 0.001 | 0.444 strong |
| 3 & 9 | 73 | 66 93.0% | 73 | 60 82.2% | 0.162 | n.s. |
| 4 & 10 | 71 | 65 92.9% | 63 | 22 34.9% | < 0.001 | 0.700 strong |
| 5 & 11 | 77 | 57 75.0% | 70 | 24 34.3% | < 0.001 | 0.518 strong |
| 6 & 12 | 76 | 73 96.1% | 72 | 73 84.7% | 0.009 | 0.179 small |
Comparison of the solution rate of the MCM and the P&P group per task type.
The results are presented in Table 7.
The Mann–Whitney U test shows that the MCM groups achieved a significantly higher number of solved tasks compared to the P&P groups in all task types despite of task type 3 & 9 (alpha = 0.05). Even though the effect sizes vary in magnitude, it can be concluded that the validation function can help students to reconsider and revise their own calculated solution, regardless of the task topic. By taking Table 3 in consideration, it can be assumed that the effect size is higher especially for the tasks where there was at least one incorrect entry per group on average. This hypothesis also highlights the value of the validation function.
To further investigate the value of the validation functionality, we analyzed the calculated solutions of the P&P groups for task type 1 & 7. This task type on setting up a linear function was chosen since it firstly has the lowest solution rate. Secondly, the task demands choosing an appropriate real model in order to find a suitable gradient triangle to then determine the slope m (see the task formulation in Table 2). Three minor errors occurred frequently:
slope m correct, b incorrect (measurement mistake; no. of occurrence: 7)
slope m correct, b in wrong unit (unit mistake; no. of occurrence: 5)
slope |m| correct, −m correct, b correct (sign mistake; no. of occurrence: 5)
These minor errors occurred in 17 task solving processes, i.e., in one third of the incorrect processes. It can be assumed that these three error types could have been detected by the groups if they had received validation feedback.
As a second interim result, it was shown that student groups who received feedback through the app validation solved more tasks and failed less for a comparable number of tasks worked on. Thus, a positive impact of validation feedback on student performance on math trail tasks is hypothesized. This hypothesis can be supported by the presented study of errors that remained undetected because the student groups did not receive app feedback.
So far, the comparison of working with or without the MathCityMap app was only taken on the task level. Furthermore, the feedback functions of the app were discussed from a quantitative view – but without analyzing a concrete modelling situation. Thus, this quantitative analysis is supplemented by observations from a qualitative study in the following.
3.2. Qualitative results
In a case study with 29 students working in nine groups on outdoor modelling tasks, we aim to investigate the validation features of the MathCityMap app, including both elaboration and verification feedback. In order to get a deeper insight into the validation activities of the individual groups, we analyze their procedures in more detail. Hereby, we describe the three groups that worked with the MathCityMap app and compare or contrast their activities in relation to those groups which worked on the same tasks without the app features.
Two of the MCM groups retrieved all three hints, the third group did not retrieve a hint. A total of seven solutions were validated for the three tasks. Five times, the entry was wrong and two times correct. After one correct processing step the sample solution was called up by the students. To follow the analysis, the activity diagrams in Figure 5 visualize the coded modelling steps in different colors: (1) understand: green, (2) simplify: blue, (3) mathematize: red, (4) work mathematically: yellow, (5) interpret: grey, (6) validate: black, (7) present: not found in the material.
In addition, the app events were added with the following terms:
Retrieval of hint 1/2/3 as form of elaborative feedback: H1/H2/H3
Solution input and app feedback on its correctness/incorrectness as form of validation feedback: SI_c/SI_i
View of sample solution as form of elaborative feedback: VS
The process of solving a task, retrieving hints and using the given feedback can be classified in three cases: Inserting repeatedly a wrong solution, getting from a wrong solution to a correct one by using the hints, and entering right away a correct solution (see Figure 5).
Figure 5
3.2.1. User case I – inserting repeatedly a wrong solution
Group I worked on the outdoor task for about 21 min. First, they started to understand, simplify and mathematize the task. After a short period of mathematical work, the group entered their first solution input into the app, which was validated as incorrect, i.e., the app informed the students that the solution they entered was incorrect and encouraged them to solve the task again. Hereafter, the group continued with the retrieval of hint one which made them evaluate their previously chosen model. We can see that the group – after receiving elaborated feedback in form of a hint – went back to the step of simplifying, following another model to solve the problem. The students entered a new result in the app which was again validated as wrong. Again, the students asked for a hint and reconsidered their made simplifications. Only three minutes later, the group made a third wrong entry and retrieved hint three. After a fourth wrong entry, the group stopped their modelling process.
3.2.2. User case II – from wrong to correct solution
Group II needed about 12 min for their modelling task. Similar to Group I, this group started the solution process by understanding, simplifying and mathematizing the task. The group spent about three minutes on the mathematical work in which they repeatedly self-validated their interim results. The following extract from their transcript can illustrate this observation from the activity diagram:
[Group II works mathematically on the surface of on spike of the sculpture].
Student A: [calculates] Ah that could even be correct. 1 m2 [looks at sculpture]. No, that’s much more.
Student B: Yes, much more.
Student A: But we only calculated for one side. And not for both.
Student B: So we would have to double that again. Then it would be 3.1 something.
[…]
Student B: [looks at sculpture] That could work out.
We can observe an iterative process between calculating and self-validation activities, e.g., judging the interim result as appropriate. This is especially underlined by both involved students looking at the sculpture to estimating the surface of one spike and comparing it to the achieved result.
In the follow-up, this process leads to the total surface area and the first solution input of Group II.
[Group II works mathematically on the total surface area].
Student A: That would be 37.536
Student B: [types in result and reads app feedback] Wrong. […]
Student B: [calls up hints 1 and 2] You can approximate the prongs of the sculpture using triangles or squares, for example.
Student A: Well but that’s what we actually did from the bottom up. By this length. […] Maybe we can take the average from the spike. Try it.
[Group II works mathematically and repeat the calculation with a new value].
As in case study I, the wrong solution validation by the app made the group retrieve the hints and based on hint two, to reconsider their collected data in a new attempt on mathematizing and mathematical work. After this second attempt, the students enter their second solution:
Student A: [calculates] That sounds plausible. I came up with 29.376m2.
Student B: [types in result and reads app feedback] Not perfect but ok [opens sample solution] 21.6 m2. What did we get before? 37.
Student A: Yes, a bit critical.
Student B: They have an area of 0.9 m2 per triangle.
Again, we can observe the independent self-assessment of the result, here as “plausible,” before entering the result in the app. The app judges the result as acceptable. In addition, this group calls up the sample solution which gives them a smaller value for the sculpture’s surface. The group judges this difference as “a bit critical.”
3.2.3. User case III – entering correct solution right away
With Group III, we can observe a third user case. The group solved their outdoor task in about 13 min, whereby only in minute 12, an app event was recognized. Here, the students entered the achieved solution and received positive feedback from the app which does not lead to any further activities related to the task, e.g., self-validation or use of the sample solution provided by the MathCityMap app.
3.2.4. Comparing groups with and without digital support
After presenting three user cases, we compare them with three groups that worked on the same tasks without digital support. Figure 6 enriches the presentation of the user cases I-III by adding the corresponding activity diagrams of the groups I′–III’ (same task, no digital support).
Figure 6
Firstly, we can observe that the three groups without digital support needed less time to solve the task. For the groups I′ and III’, the validation step is not or only rarely carried out. Group II’ used validation elements in their solution process which will be the focus of a detailed comparison.
In a direct comparison of Group II with Group II’ that solved the same task, the sculpture, without digital support, we can see similar self-validation activities in terms of the checking and judging of interim results. For example, Student C, working in Group II’ calculates the height of the sculpture and states: “Then we would be at 525. [looks at sculpture] Yes, that makes sense.” Despite this interim self-validation, the group takes the aspect of plausibility into account as well:
Student C: [calculates] That would be 29,82.
Student E: Is that the result already?
Student C: Cubic, no square meters.
Student D: That’s kind of small.
Student C: That seems like a bit much somehow.
Student E: I do not know. […]
Student D: So, done.
We can observe validation activities here: The students try to evaluate their achievement in terms of its appropriateness. From their conversation, we can see that they have problems classifying the result between “kind of small” and “a bit much.” It seems that the students do not find a concrete point of reference on which to base their impression of too small or too large. Furthermore, the different impressions of student D and C do not lead to a deeper self-validation discussion, so that the task is finally ended with the expression “So, done.”
All in all, the following interim results can be drawn from the qualitative data:
Hints as elaborative feedback: The hints were only retrieved in the course of processing so that most of their content had been considered beforehand. More precisely, they were accessed after the students received validation feedback by the app that the calculated solution is incorrect. Nevertheless, the hints were partly used for self-validation of previously made steps and intermediate results as observed in user case II.
Wrong answer validation as verification feedback: The answer validation giving the feedback “wrong” is presented as “repeat-until-correct” feedback. In all processes, it leads to the fact that at least once again the modelling activities were revised. Usually, the groups started the revision with the simplifying/mathematizing step. This revision led to two different use cases: aborted after the fourth incorrect entry (user case I) or correctly solved in the second attempt (user case III).
Correct answer validation as verification feedback: Receiving a “correct” answer validation gives the students the confirmation that the result is in the predefined interval. Hereby, an estimation of the result is better than in comparison to the group without digital support and can still lead to the result being compared with the sample solution (user case II).
Sample solution as elaborative feedback: The sample solution is considered only once after a correct solution. Although the sample solution served in this case as the comparison of measured values (user case II), we also observed a problematic handling since the sample solution was not called after four times inserting wrong input (user case I).
4. Discussion
In the context of this paper, we examined the question of how far the digital tool MathCityMap supports validation activities of students in mathematical modelling problems. To address this question, two studies were conducted.
4.1. Conclusions of the quantitative study
From a quantitative perspective, a quasi-experimental study was conducted with 13 classes working on a math trail which involved several modelling problems. Of these, seven classes were supported by the MathCityMap app (MCM groups) from which students’ interaction with the app was analyzed. With regard to the app’s elaborative feedback, i.e., hints and sample solutions (cf.Shute, 2008), the following hypotheses can be made: The hints were frequently used by the MCM groups. On the one hand, for easier task types, the solution rate was negatively dependent on the use of hints. This could be explained by the finding that hints were used more often by groups that tended to solve fewer tasks (in terms of the ratio of hints used to processed tasks). On the other hand, for the more difficult task type, in which mathematizing processes were particularly relevant (cf.Ludwig and Jablonski, 2021), the student groups who used the hints had a higher solution rate than those who did not use the hints.
The sample solution does not appear to play an important role in the students’ solution process: Although all student groups that failed the task read it out loud, the majority of student groups skipped the task rather than failed it and thus did not have the opportunity to see the sample solution. Student groups that solved the tasks tended not to feel the need to compare their calculation to a sample solution.
The verification feedback was investigated by comparing the MCM and P&P groups. The latter had no digital support and received no feedback on their tasks. It could be observed that the MCM group solved significantly more tasks and failed significantly less than the P&P group. Looking at the mistakes made by the P&P group, it can be assumed that the “repeat-until-correct” mode of verification feedback (cf.Shute, 2008) can help students to reconsider and correct their outdoor task processes and go through another modeling cycle (cf.Hankeln, 2020).
4.2. Conclusions of the qualitative study
These data were enriched from a qualitative perspective. 29 students divided in nine groups were observed during their solution processes of outdoor modelling tasks. Three of the groups used the MathCityMap app with its elaborative feedback features hints and sample solution and the solution validation in form of verification feedback (cf.Shute, 2008). From the analysis, the following conclusions can be drawn:
For the sample of this study, the hints, mostly focused on the process level, were taken to a later time of the solution process than expected. Therefore, their content had usually been considered by the groups and served mainly as a confirmation of these earlier steps. This confirmation partly led to intermediate self-validation processes. The solution validation served as verification feedback in terms of giving the students an idea whether their result is “correct” or “wrong.” In the first case, we can observe that these students, in comparison to those groups working without the app, have less difficulties in assessing their result through this “knowledge of correct result” (cf.Shute, 2008). Even though these processes were not independent, the validation by means of the app can be a first attempt to students taking over responsibility and appropriateness in the validation process from the teacher (Blum & Borromeo Ferri, 2009). In the second case, we observed that the students started a new attempt to work on the task (cf.Hankeln, 2020) and rethink their modelling steps in terms of the “repeat-until-correct” approach (cf.Shute, 2008).
Finally, we can conclude that the sample solution feature played a minor role in the setting of this study. Especially the technical possibility to call up the sample solution requires many wrong answers and the students’ willingness to give up on the task. It would have been used more frequently if it had been displayed automatically after four wrong inputs and the app then had ended the task.
4.3. Combination of the quantitative and qualitative perspective
From both studies, we can draw conclusions concerning the validation feedback of the app. The implications are presented concerning verification and elaboration feedback.
4.3.1. Verification feedback
From a quantitative perspective, we can see a significant increase of successfully solved tasks, if student groups got verification feedback by the MathCityMap app. In addition, from a qualitative perspective, we can observe that the students had less difficulties in interpreting their received result when using the validation function of the app. In case of entering a wrong result, we see new attempts to rework different steps of the modelling cycle in both studies.
4.3.2. Elaboration feedback
In addition, both studies revealed weaknesses of the app design concerning the presentation of the sample solution. On the one hand, the quantitative study reported that students abused the skipping option (instead of giving up on a task) so that the sample solution could not be accessed. On the other hand, we observed repeated entries of wrong results in the qualitative study – still, the number of wrong entries was not “high” enough to give up on the task and display the sample solution. Both studies could explain the low number of accesses of the sample solutions. This is considered as problematic since the potential of the elaborative feedback cannot be realized.
Regarding the hints, contrary results were observed. The quantitative study showed that using hints leads tendentially to a decrease of the solution rate for easier task types or an increase for the most difficult task type. The qualitative study showed that the students used the hints at other points of the solution process than expected: not during the solution process but after entering a wrong result. Thus, the hints were mainly used for the purpose of self-evaluating intermediate results.
4.4. Final conclusions and outlook
The combination of these two studies and their results can show the relevance of digitally supported feedback during outdoor modelling tasks. Hereby, previous results in the field of outdoor modelling can be extended (cf.Buchholtz, 2017; Ludwig and Jablonski, 2021). Students of both studies took advantage of the validation function and could either solve or improve their modelling activities. Hereby, the achieved results can be used for further studies that focus on verification and elaboration feedback in a similar context, e.g., by taking up the findings for design requirements for outdoor modelling tasks.
Based on the described weaknesses concerning the sample solution, the studies are an important basis for future technical developments of digital tools including feedback functions. In particular, for the MathCityMap app, this implies reworking of the skipping functionality and the presentation of the sample solution.
Finally, it remains particularly open if the success in hint usage is only dependent on the task type and difficulty or if other factors are additionally relevant. More likely, other factors like the wording of hints (cf.de Kock and Harskamp, 2016) might also play an important role for students’ understanding of the hints. The presented results show the need to investigate on this question in an additional study comparing different kinds of hints in more detail.
Funding
The results are part of the studies “MEMORI – Mathematics Education by Mobile OutdooR MathtraIls” and “MAP – Modelling, Arguing and Problem Solving in the Context of Outdoor Mathematics,” both funded by Hans Messer Stiftung.
Publisher’s note
All claims expressed in this article are solely those of the authors and do not necessarily represent those of their affiliated organizations, or those of the publisher, the editors and the reviewers. Any product that may be evaluated in this article, or claim that may be made by its manufacturer, is not guaranteed or endorsed by the publisher.
Statements
Data availability statement
The raw data supporting the conclusions of this article will be made available by the authors, without undue reservation.
Author contributions
SB, SJ, and ML contributed to conception and design of the study, wrote sections of the manuscript. SB organized the quantitative database. SJ organized the qualitative database. SB performed the statistical analysis. SB and SJ wrote the first draft of the manuscript. All authors contributed to the article and approved the submitted version.
Conflict of interest
The authors declare that the research was conducted in the absence of any commercial or financial relationships that could be construed as a potential conflict of interest.
References
1
AndersonJ. R.BoyleC. F.ReiserB. J. (1985). Intelligent tutoring systems. Science228, 456–462. doi: 10.1126/science.228.4698.456
2
AttaliY. (2015). Effects of multiple-try feedback and question type during mathematics problem solving on performance in similar problems. Comput. Educ.86, 260–267. doi: 10.1016/j.compedu.2015.08.011
3
BarlovitsS.Baumann-WehnerM.LudwigM. (2020). Curricular learning with MathCityMap: creating theme-based math trails. In Donevska-TodorovaA.FaggianoE.TrgalovaJ.LaviczaZ.WeinhandlR.Clark-WilsonA.et al. (Eds.), Proceedings of the Tenth ERME Topic Conference (ETC 10) on Mathematics Education in the Digital Age (MEDA), Linz, Austria (pp. 143–150). Johannes Kepler University.
4
BlackP.WiliamD. (2009). Developing the theory of formative assessment. Educ. Assess. Eval. Account.21, 5–31. doi: 10.1007/s11092-008-9068-5
5
BlaneD. C.ClarkeD. (1984). A Mathematics Trail around the City of Melbourne. Monash University: Monash Mathematics Education Centre. (Melbourne).
6
BlumW. (2007). Mathematisches Modellieren – zu schwer für Schüler und Lehrer? in Beiträge zum Mathematikunterricht. (Hildesheim: Franzbecker), 3–12.
7
BlumW. (2015). Quality teaching of mathematical modelling: what do we know? What can we do? In ChoS. J. (Ed.), Proceedings of the 12th international congress on mathematical education (cham) (pp. 73–96). Springer
8
BlumW.FerriR. B. (2009). Mathematical modelling: can it be taught and learnt?J. Math. Model. Appl.1, 45–58.
9
BlumW.LeissD. (2007). “How do students and teachers deal with mathematical modelling problems?” in Mathematical modelling. eds. HainesC.GalbraithP.BlumW.KhanS. (Cambridge: Woodhead Publishing), 222–231.
10
Borromeo FerriR. (2010). On the influence of mathematical thinking styles on learners’ modeling behavior. J. Math.-Didakt.31, 99–118. doi: 10.1007/s13138-010-0009-8
11
BuchholtzN. (2017). “How teachers can promote mathematising by means of mathematical city walks” in Mathematical modelling and applications. eds. StillmanG.BlumW.KaiserG. (Cham: Springer), 49–58.
12
BuchholtzN. (2021). “Modelling and mobile learning with math trails” in Mathematical modelling education in east and west. eds. LeungF. K. S.StillmanG. A.KaiserG.WongK. L. (Cham:Springer), 331–340.
13
CorbettA. T.KoedingerK. R.AndersonJ. R. (1997). “Intelligent tutoring systems” in Handbook of human-computer interaction. eds. HelanderM.LandauerT. K.PrabhuP. (North-Holland: Amsterdam), 849–874.
14
de KockW. D.HarskampE. G. (2016). Procedural versus content-related hints for word problem solving: an exploratory study. J. Comput. Assist. Learn.32, 481–493. doi: 10.1111/jcal.12148
15
FesakisG.KartaP.KozasK. (2018). Designing math trails for enhanced by mobile learning realistic mathematics education in primary education. Int. J. Eng. Pedagog.8, 49–63. doi: 10.3991/ijep.v8i2.8131
16
GreefrathG.HertleifC.SillerH.-S. (2018). Mathematical modelling with digital tools – a quantitative study on mathematising with dynamic geometry software. ZDM50, 233–244. doi: 10.1007/s11858-018-0924-6
17
HagenaM.LeissD.SchwippertK. (2017). Using reading Strategie training to foster students’ mathematical modelling competencies: results of a quasi-experimental control trial. EURASIA J. Math. Sci. Tech. Educ.13, 4057–4085. doi: 10.12973/eurasia.2017.00803a
18
HankelnC. (2020). “Validating with the use of dynamic geometry software” in Mathematical modelling education and sense-making. eds. StilmanG.KaiserG.LampenC. (Springer: Wiesbaden), 277–285.
19
HartmannL. M.SchukajlowS. (2021). “Interest and emotions while solving real-world problems inside and outside the classroom” in Mathematical modelling education in east and west. eds. LeungF. K. S.StillmanG. A.KaiserG.WongK. L. (Cham: Springer International Publishing), 153–163.
20
HattieJ.TimperleyH. (2007). The power of feedback. Rev. Educ. Res.77, 81–112. doi: 10.3102/003465430298487
21
HattieJ.ZiererK. (2019). Visible learning insightsRoutledge. (London).
22
HavnesA.SmithK.DystheO.LudvigsenK. (2012). Formative assessment and feedback: making learning visible. Stud. Educ. Eval.38, 21–27. doi: 10.1016/j.stueduc.2012.04.001
23
HegedusS.LabordeC.BradyC.DaltonS.SillerH.-S.TabachM.et al. (2016). Uses of technology in upper secondary mathematics educationCham: Springer Nature.
24
JablonskiS.LudwigM.ZenderJ. (2018). Task quality vs. task quantity. A dialog-based review system to ensure a certain quality of tasks in the MathCityMap web community. In: WeigandH.-G.Clark-WilsonA.Donevska-TodorovaA.FaggianoE.GrønbækN.TrgalováJ. (Eds.), Proceedings of the Fifth ERME Topic Conference (ETC 5) on Mathematics Education in the Digital Age (MEDA), Copenhagen, Denmark. University of Copenhagen.
25
KlugerA. N.DeNisiA. (1996). The effects of feedback interventions on performance: a historical review, a meta-analysis, and a preliminary feedback intervention theory. Psychol. Bull.119, 254–284. doi: 10.1037/0033-2909.119.2.254
26
LudwigM.JablonskiS. (2021). Step by step – simplifying and mathematizing the real world with MathCityMap. Quadrante30, 242–268. doi: 10.48489/quadrante.23604
27
LudwigM.JesbergJ. (2015). Using mobile technology to provide outdoor modelling tasks – the MathCityMap-project. Procedia – Social Behavior. Sci.191, 2776–2781. doi: 10.1016/j.sbspro.2015.04.517
28
MayringP. (2000). Qualitative content analysis. Forum Qual. Soc. Res., 1. doi: 10.17169/fqs-1.2.1089
29
MorenoR. (2004). Decreasing cognitive load for novice students: effects of explanatory versus corrective feedback in discovery-based multimedia. Instr. Sci.32, 99–113. doi: 10.1023/B:TRUC.0000021811.66966.1d
30
MousavinasabE.ZarifsanaieyN.Niakan KalhoriS. R.RakhshanM.KeikhaL.Ghazi SaeediM. (2021). Intelligent tutoring systems: a systematic review of characteristics, applications, and evaluation methods. Interact. Learn. Environ. (Rotterdam) 29, 142–163. doi: 10.1080/10494820.2018.1558257
31
MousoulidesN. G. (2011). “GeoGebra as a conceptual tool for modelling real world problems” in Model-centered learning: pathways to understanding using GeoGebra. eds. BuL.SchoenR. (Brill), 105–118.
32
NarcissS.SosnovskyS.SchnaubertL.AndrèsE.EichelmannA.GoguadzeG.et al. (2014). Exploring feedback and student characteristics relevant for personalizing feedback strategies. Comput. Educ.71, 56–76. doi: 10.1016/j.compedu.2013.09.011
33
PaiK. C.KuoB. C.LiaoC. H.LiuY. M. (2021). An application of Chinese dialogue-based intelligent tutoring system in remedial instruction for mathematics learning. Educ. Psychol.41, 137–152. doi: 10.1080/01443410.2020.1731427
34
RamaprasadA. (1983). On the definition of feedback. Behav. Sci.28, 4–13. doi: 10.1002/bs.3830280103
35
SchukajlowS. (2010). Schüler-Schwierigkeiten und Schüler-Strategien beim Bearbeiten von Modellierungsaufgaben als Bausteine einer lernprozessorientierten DidaktikKassel University Press.
36
ShoafM. M.PollakH. O.SchneiderJ. (2004). Math trailsCOMAP: Incorporated. (Bedford).
37
ShuteV. J. (2008). Focus on formative feedback. Rev. Educ. Res.78, 153–189. doi: 10.3102/0034654307313795
38
Steenbergen-HuS.CooperH. (2013). A meta-analysis of the effectiveness of intelligent tutoring systems on K–12 students’ mathematical learning. J. Educ. Psychol.105, 970–987. doi: 10.1037/a0032447
39
StillmanG. A.BrownJ. P.GalbraithP. (2013). “Challenges in modelling challenges: intents and purposes” in Teaching mathematical modelling: Connecting to research and practice. eds. StillmanG.KaiserG.BlumW.BrownJ. (Dordrecht: Springer), 217–227.
40
StillmanG. A.BrownJ. P.GeigerV. (2015). “Facilitating Mathematisation in modelling by beginning modellers in secondary school” in Mathematical modelling in education research and practice. eds. StillmanG.BlumW.Salett BiembengutM. (Cham: Springer), 93–104.
41
TuovinenJ. E.SwellerJ. (1999). A comparison of cognitive load associated with discovery learning and worked examples. J. Educ. Psychol. 91, 334.
42
Van der KleijF. M.FeskensR. C.EggenT. J. (2015). Effects of feedback in a computer-based learning environment on students’ learning outcomes: a meta-analysis. Rev. Educ. Res.85, 475–511. doi: 10.3102/0034654314564881
43
WiliamD.ThompsonM. (2017). “Integrating assessment with learning: what will it take to make it work?” in The future of assessment. ed. DwyerC. A. (New York: Routledge), 53–82.
44
WisniewskiB.ZiererK.HattieJ. (2020). The power of feedback revisited: a meta-analysis of educational feedback research. Front. Psychol.10:3087. doi: 10.3389/fpsyg.2019.03087
Summary
Keywords
digital tools, MathCityMap, mathematics education, mobile learning, modelling, outdoor education, validation
Citation
Jablonski S, Barlovits S and Ludwig M (2023) How digital tools support the validation of outdoor modelling results. Front. Educ. 8:1145588. doi: 10.3389/feduc.2023.1145588
Received
16 January 2023
Accepted
12 June 2023
Published
07 July 2023
Volume
8 - 2023
Edited by
Hans-Stefan Siller, Julius Maximilian University of Würzburg, Germany
Reviewed by
Kamal Karkonasasi, Universiti Malaysia Kelantan, Malaysia; Mogana Vadiveloo, Tunku Abdul Rahman University, Malaysia
Updates
Copyright
© 2023 Jablonski, Barlovits and Ludwig.
This is an open-access article distributed under the terms of the Creative Commons Attribution License (CC BY). The use, distribution or reproduction in other forums is permitted, provided the original author(s) and the copyright owner(s) are credited and that the original publication in this journal is cited, in accordance with accepted academic practice. No use, distribution or reproduction is permitted which does not comply with these terms.
*Correspondence: Simone Jablonski, jablonski@math.uni-frankfurt.de
Disclaimer
All claims expressed in this article are solely those of the authors and do not necessarily represent those of their affiliated organizations, or those of the publisher, the editors and the reviewers. Any product that may be evaluated in this article or claim that may be made by its manufacturer is not guaranteed or endorsed by the publisher.