
95% of researchers rate our articles as excellent or good
Learn more about the work of our research integrity team to safeguard the quality of each article we publish.
Find out more
ORIGINAL RESEARCH article
Front. Educ. , 09 February 2023
Sec. Assessment, Testing and Applied Measurement
Volume 8 - 2023 | https://doi.org/10.3389/feduc.2023.1106679
 Heyul Chavez1,2
 Bill Chavez-Arias3
 Sebastian Contreras-Rosas3
 Jose María Alvarez-Rodríguez4
 Carlos Raymundo5*
In recent years, artificial intelligence has played an important role in education, wherein one of the most commonly used applications is forecasting students’ academic performance based on personal information such as social status, income, address, etc. This study proposes and develops an artificial neural network model capable of determining whether a student will pass a certain class without using personal or sensitive information that may compromise student privacy. For model training, we used information regarding 32,000 students collected from The Open University of the United Kingdom, such as number of times they took the course, average number of evaluations, course pass rate, average use of virtual materials per date and number of clicks in virtual classrooms. Attributes selected for the model are as follows: 93.81% accuracy, 94.15% precision, 95.13% recall, and 94.64% F1-score. These results will help the student authorities to take measures to avoid withdrawal and underachievement.
Artificial intelligence has exerted a large impact in most industries, including education. The use of these technologies (Deep Learning, Automatization and Natural Language Processing) provides important knowledge that benefits the industry, such as providing better understanding of the student learning processes or improving their results.
Low academic performance is one of the main problems facing higher education worldwide. One reason why this issue has become difficult to solve is that academic performance is influenced by several factors. Tejedor and García-Valcárcel (2007) mentions five factors: identification, psychological, academic, pedagogical, and socio-family. Similarly, there can be various consequences of poor academic performance, including academic attrition. According to Vicerrectorado Académico (2017), one of the main factors for academic desertion is poor academic performance. Within the same context, Viale (2014) argues that the percentage of students who fail classes in the first cycle is usually high, but when students repeat a class and fail it again, many decide to drop out of university. Furthermore, low academic performance is considered a quality indicator for educational institutions, so its assessment is critical for these institutions. In Peru, SINEACE (2016) states that following up on students and leveling their deficiencies to prevent low academic performance is considered a quality standard for university programs and to achieve accreditation.
The COVID-19 pandemic resulted in students migrating to virtual learning environments. This introduced the need for students and teachers to adapt to a hybrid learning environment, if necessary, where they face different obstacles. Liao and Wu (2022) mentioned that hybrid learning has provided students with more professional growth opportunities; however, this has also become a challenge because students are exposed to different types of distractions during the learning process.
In their research, Blanco et al. (2016) and Rincon-Flores et al. (2020) forecast academic student performance using different algorithms. Blanco et al. (2016) proposed a deep neural network to predict academic performance, achieving 78% accuracy, whereas Rincon-Flores et al. (2020) mentioned several models, such as K-nearest neighbors (KNN) and Random Forest, to achieve 80% accuracy. However, these works do not justify why they are forecasting academic student performance, the application of these predictions, and who they are going to help.
This research seeks to propose and develop a model for the prediction of student academic performance, due to the large amount of data to be used, it is intended through deep neural networks to respond to the educational problem of low academic performance in universities. Forecasting academic student performance allows institutions to better identify at-risk students and take supporting measures, thereby ensuring that students successfully complete their academic cycles, in turn, helping institutions gain more prestige.
The model training data used will be provided by Kuzilek et al. (2017), wherein we can acquire information such as courses, exams, personal student information, and student interaction with the resources of the Open University’s online academic platform. First, we apply preprocessing techniques to prepare the data that will be used for training. Second, we sort the students into pass or fail categories. Third, we split the data into training and testing datasets. Finally, we train the model using the corresponding dataset. As part of our results, the accuracy of our prediction model will be compared with other similar works.
This research seeks to answer the following question: How to estimate whether a student will pass a subject before completing 50% of the course without using personal information?
The literature offers various mathematical applications, wherein the Naïve Bayes algorithm stands out due to its large application percentage. In this section, we will discuss the success percentages of each study that used the Naïve Bayes algorithm as well as their characteristics, such as the quantity of information required and under what circumstances each study was conducted.
In their research, Kumar et al. (2020) assessed student performance in technical exams used for university application, an important process for universities. Forecasting whether students would pass or fail a technical exam based on their performance in certain subjects of their course was the technique used to approach the problem. The authors used data regarding 200 K L University students from 2013 to 2017. Students were sorted and classified using two different algorithms: K-means clustering and hierarchical clustering. Once classified, the authors used the Naïve Bayes algorithm for their predictions at 72% accuracy.
In their study, Jayaprakash et al. (2020) discuss student dropout rates in the early stages of the program by calculating the factors that exert the most influence on academic student performance. For these predictions, the authors used 887 instances and 19 variables. Additionally, they used the Naïve Bayes algorithm at 85.7% accuracy.
In their work, Daud et al. (2017) assessed the reasons why many students drop out of their careers. For this, the study predicted personal, family, and economic factors that most influence student performance to determine whether any given student would complete their studies. For testing, the dataset is cleaned to obtain 50 students who finished their studies and 50 who did not. As part of their results, the Naïve Bayes algorithm achieved 84.8% in the F1-score.
The study reported by Widyaningsih et al. (2019) intended to forecast academic performance for freshman students using a semisupervised learning approach to classify student performance. In this study, the Naïve Bayes classifier was used as a methodology, which achieved 96% accuracy.
Devasia et al. (2016) addressed student desertion in higher education. The proposed system is a web-based application that employs the Naïve Bayesian mining technique to extract useful information. According to this study, the basic algorithm provides more accuracy in this field than other methods such as regression, decision tree, and neural networks.
Amazona and Hernandez (2019) forecast student performance to improve decision-making education. Educational data mining was used to model student academic performance through the Naïve Bayes algorithm, assess the dataset, and predict academic performance. Results reveal that even when the Naïve Bayes classifier is outperformed by other algorithms, it achieved an overall prediction rate of 88% in classification accuracy.
In their research, Páez and Guzmán (2018) solved problems affecting several teaching and learning processes. To this end, they designed and automated a predictive model of student academic performance. The study was based on several algorithms, wherein the Naïve Bayes outperformed the others at a 73% prediction rate.
In some cases, clustering is required for further data analysis. The aforementioned studies are aware of this fact because K-means is used in Kumar et al. (2020) and Widyaningsih et al. (2019), hierarchical in Kumar et al. (2020), Daud et al. (2017), and Widyaningsih et al. (2019), and custom clustering types in Páez and Guzmán (2018) and others depending on the desired level of classification. Nevertheless, the most common and easiest to use is Naïve Bayes, which was used in Jayaprakash et al. (2020), Widyaningsih et al. (2019), and Amazona and Hernandez (2019). The type of data available is critical because more specific data will better cover student learning, academic environment issues, and more. Thus, as mentioned in Widyaningsih et al. (2019), groups must be as differentiated as possible.
Kumar et al. (2020) also proposed using the C5.0 algorithm, a decision tree algorithm, to predict student performance. For this, they used the exact same methodology as with Naïve Bayes. As a result, they obtained 81% accuracy.
Similarly, Jayaprakash et al. (2020) proposed the random forest algorithm and an in-house variation, the improved random forest algorithm. These algorithms yielded 91 and 93% accuracy, respectively, when predicting academic performance.
In their work, Daud et al. (2017) used the C4.5 and CART algorithms to forecast whether students would complete their coursework. Through these algorithms, the authors achieved 76.6 and 71%, respectively, in F1-score.
Ma et al. (2018) proposed using deep neural networks to predict the passing rate of online students. They used data from Guo Pei Online Education. First, the features that most affect passing rate were filtered through the filter-type feature selection algorithm, which provided 27 representative features. Then, preprocessing and standardization were performed on the remaining dataset (27 features). The decision tree algorithm was used for prediction, and the grid search algorithm was used to optimize the decision tree. The following metrics were used with these algorithms: precision, recall, F1-score, and runtime. Before testing, the data were divided into pass and fail. Finally, using the grid search algorithm at 50% pass / 50% fail data, decision tree achieved 96% accuracy.
Of all the literature in this section, six authors used decision tree algorithms: Kumar et al. (2020), Castrillón et al. (2020), Daud et al. (2017), Ma et al. (2018), Hasan et al. (2019), and Amazona and Hernandez (2019), while Jayaprakash et al. (2020), Rincon-Flores et al. (2020), and Benablo et al. (2018) used random forest algorithms. Despite random forests being a subset of decision trees, most studies use decision trees for multiple-variable predictions, such as those for academic performance.
In their study, Hasan et al. (2019) present a model that tries to predict final exam results for a given student. For this, they used a dataset of 1,170 students in 3 courses. Then, the authors preprocessed the dataset by removing unnecessary columns such as Student ID. They used the KNN algorithm and a decision tree classifier (the ID3 algorithm) for their predictions, thereby obtaining 94.44% accuracy based on the decision tree classifier algorithm.
In their research, Benablo et al. (2018) forecast student performance based on social network data, such as Facebook, Twitter, Instagram, and YouTube, as well as online games. A single-format input was created to serve as the training dataset following the attribute relationship file format. To finalize the model, the researchers considered using support vector machine (SVM), KNN, and random forest for prediction. Furthermore, to ensure that the model accurately classified a given dataset, a 10-fold cross validation was performed using the WEKA software. For these modes, three metrics were used: precision, recall, and F1-score. For the results, the authors used three types of samples (30, 50, and 100 instances). After testing 100 instances, random forest achieved a result of 100% in precision, 80.6% in recall, and 89.3% in F1-score.
Amazona and Hernandez (2019) proposed to use a decision tree for prediction following the same methodology as Kumar et al. (2020) and Ma et al. (2018). The results from the decision tree were 93% in precision, 96% in F1-score, and 100% in recall.
From Kumar et al. (2020), Castrillón et al. (2020), Daud et al. (2017), Ma et al. (2018), Hasan et al. (2019), and Amazona and Hernandez (2019), Rincon-Flores et al. (2020) reported the highest accuracy rate using a decision tree algorithm at 96%. Moreover, it considered the second-highest number of forecasting variables (27).
The study by Blanco et al. (2016) focuses on predicting student results for the Data Structures I and II classes because these computer engineering classes present a significant degree of difficulty and require serious dedication and rigor from students, which means that their grades are often lower than desirable. Therefore, the authors designed a model based on the MATLAB system that predicts academic results in these classes after having been trained with specific data from each class. The model’s architecture is designed with three layers, wherein an activation function was used for each neuron: for the input and hidden layers, the sigmoidal hyperbolic tangent function was used. For the output layer, the linear function was used because the authors wanted to achieve the largest possible range amplitude in the output interval, which also facilitated result interpretation. In this study, a prediction effectiveness of over 78% was achieved for the first subject and 75% for the second subject.
The research reported by Sekeroglu et al. (2019) was developed based on the need to improve AI-based systems in the field of education because in-class and remote students often need help to improve their performance. Therefore, two neural network models were used: backpropagation (BP) and long/short-term memory (LSTM). The former uses a gradient descent algorithm during learning and propagates the error to update weights and minimize error values; the latter memorizes previous neural network inputs to provide more accurate results. The results were as follows: BP (70% variance) and LSTM (77.9% variance).
Amazona and Hernandez (2019) also proposed using a deep learning neural network model for prediction. The same methodology as above was used. The deep learning results were as follows: 98% precision, 97% F1-score, and 98% recall.
Of the studies carried out by Blanco et al. (2016), Amazona and Hernandez (2019), and Sekeroglu et al. (2019), the neural network that reported the highest accuracy was the one reported by Amazona and Hernandez (2019) at 98% precision, 98% recall and 97% F1-score. Moreover, Amazona and Hernandez (2019) used the least number of input variables at only 9.
In this sense, Blanco et al. (2016) used the highest number of input variables, 21. Nevertheless, its effectiveness rate when predicting student performance was considerably low (75% accuracy) compared with the effectiveness reported by Amazona and Hernandez (2019) (95% accuracy). It may be observed that Ma et al. (2018) uses fewer layers and, therefore, fewer network neurons, which leads to a more inaccurate process.
Daud et al. (2017), used a supervised learning model to predict whether students will complete or abandon their study programs. Specifically, they used the SVM model, wherein the best result was obtained with 86% in the F1-score test.
Ma et al. (2018) also used the SVM supervised learning model to predict online student passing rates. Using the grid search algorithm at 50% pass / 50% fail data, this model achieved 95% accuracy.
Sekeroglu et al. (2019), used the SVR model to improve AI-based systems in the field of education. This model provided predictions at 79.7% variance.
Benablo et al. (2018) forecasted student performance based on social network data, such as Facebook, Twitter, Instagram, and YouTube, using the SVM model. In a 100-instance test, this model reported 100% precision, 96.8% recall and 98.4% F1-score, thereby being the most effective model.
In their study, Liao et al. (2019) sought to predict which students are at risk of achieving poor performance in a given class. This must be identified early enough to allow instructors to help students before they fall behind. Thus, they designed a model that predicts the student’s final exam grade using a binary SVM classifier, which is trained with the radial basis function kernel based on the selected course. Additionally, the model is based on three parameters that indicate the severity of different classification error types. Based on this model, at least 62% of the at-risk students were correctly identified.
From Daud et al. (2017), Ma et al. (2018), Sekeroglu et al. (2019), Benablo et al. (2018), and Liao et al. (2019), the supervised learning model that reported the highest accuracy was the one used by Benablo et al. (2018) at 100% precision, 96.8% recall, and 98.4% F1-score. To reach this accuracy, the authors used cross validation 10 times to avoid overfitting the model. Here, we can see a pattern: Sekeroglu et al. (2019) did not use cross validation, and it reported the lowest accuracy rate at 79.7%. Similarly, Daud et al. (2017) performed cross validation but only five times, which is half as many times as Benablo et al. (2018). Daud et al. (2017) reported an accuracy rate of 86%, which is considerably high but not as high as the accuracy rates reported by Liao et al. (2019), Ma et al. (2018), and Benablo et al. (2018), who performed the cross validation 10 times.
This section will summarize and compare the most relevant models in the literature, which will be shown in Table 1. Data such as the technique used, accuracy, precision, recall, etc. were analyzed. It should be noted that not all models had all validation metrics.
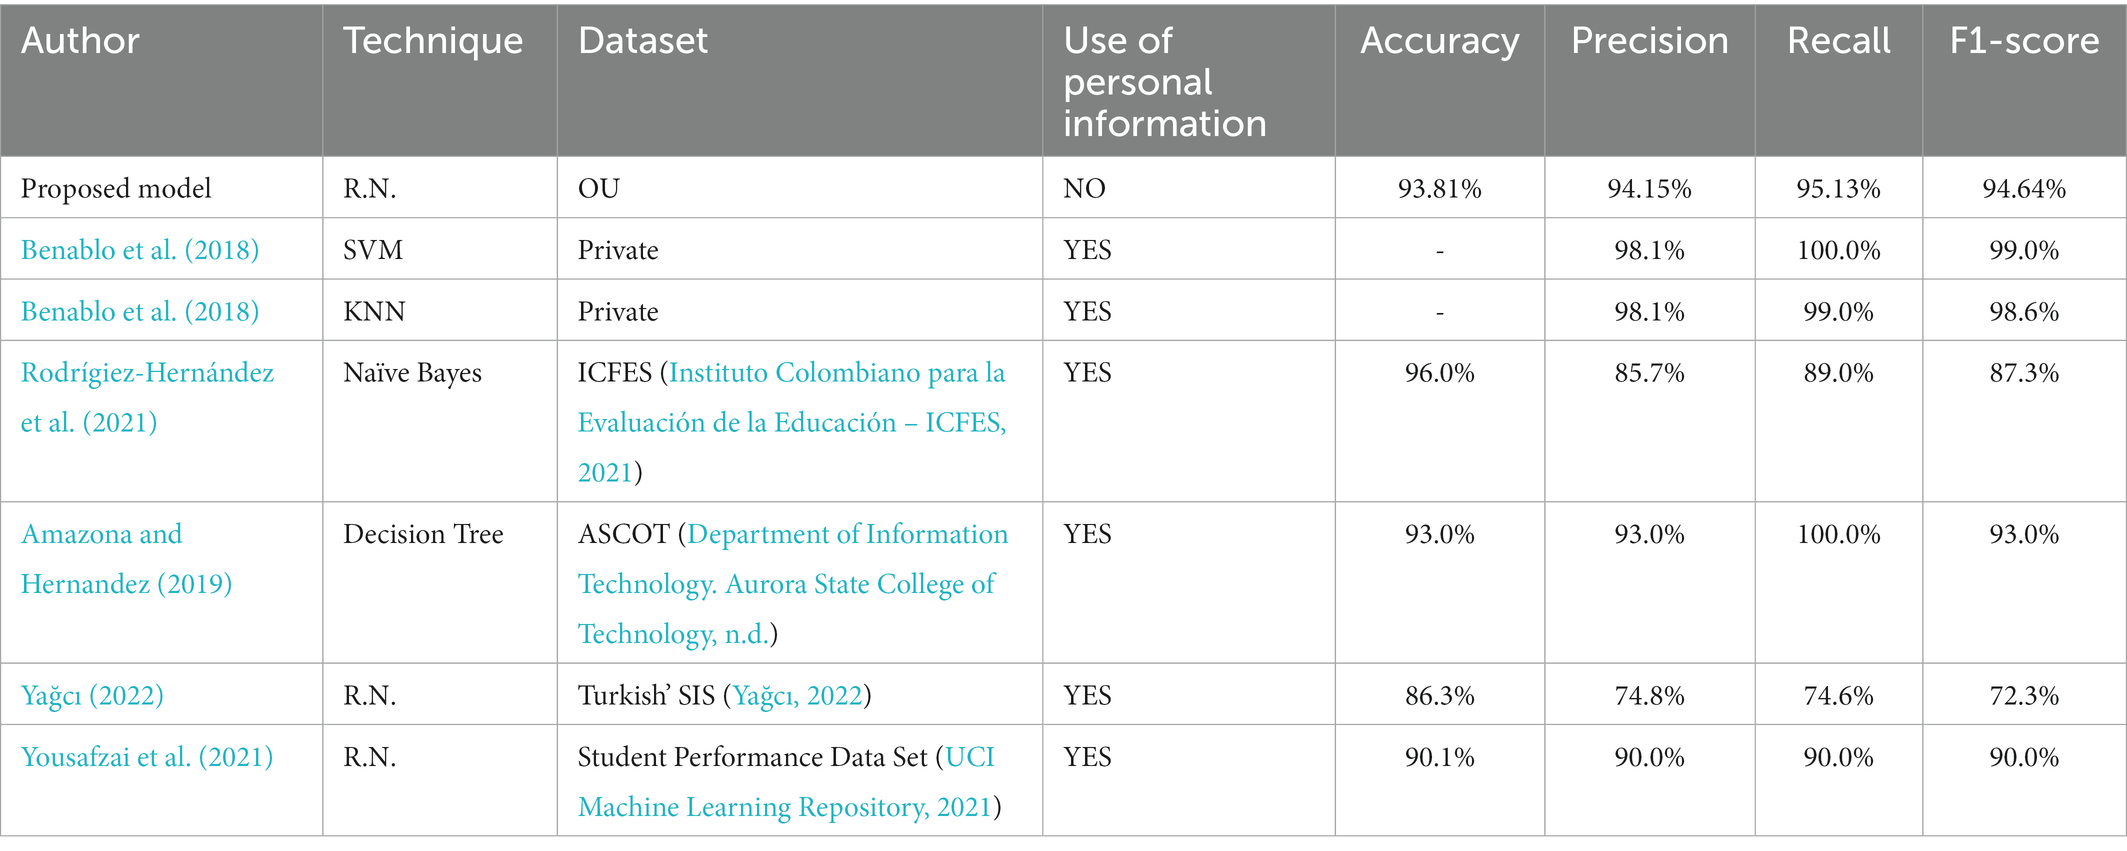
Table 1. Model comparison.
According to Alaieri and Vellino (2017), where different ethical regimes are applicable, artificial intelligence decisions must be reliable and duly justified so that users, manufacturers, and legislators can understand how decisions are made and what ethical principles were applied in each case. This study presents a model that breaks down the stages of ethical decision-making into their elementary components. The proposed project references ethical decision-making matters regarding the algorithm used to predict student performance. The ethical issues are detailed in Section 3.2.
This section introduces and explains the proposed neural network architecture and machine learning models to predict student academic performance.
Figure 1 illustrates the architecture used in the model proposed.
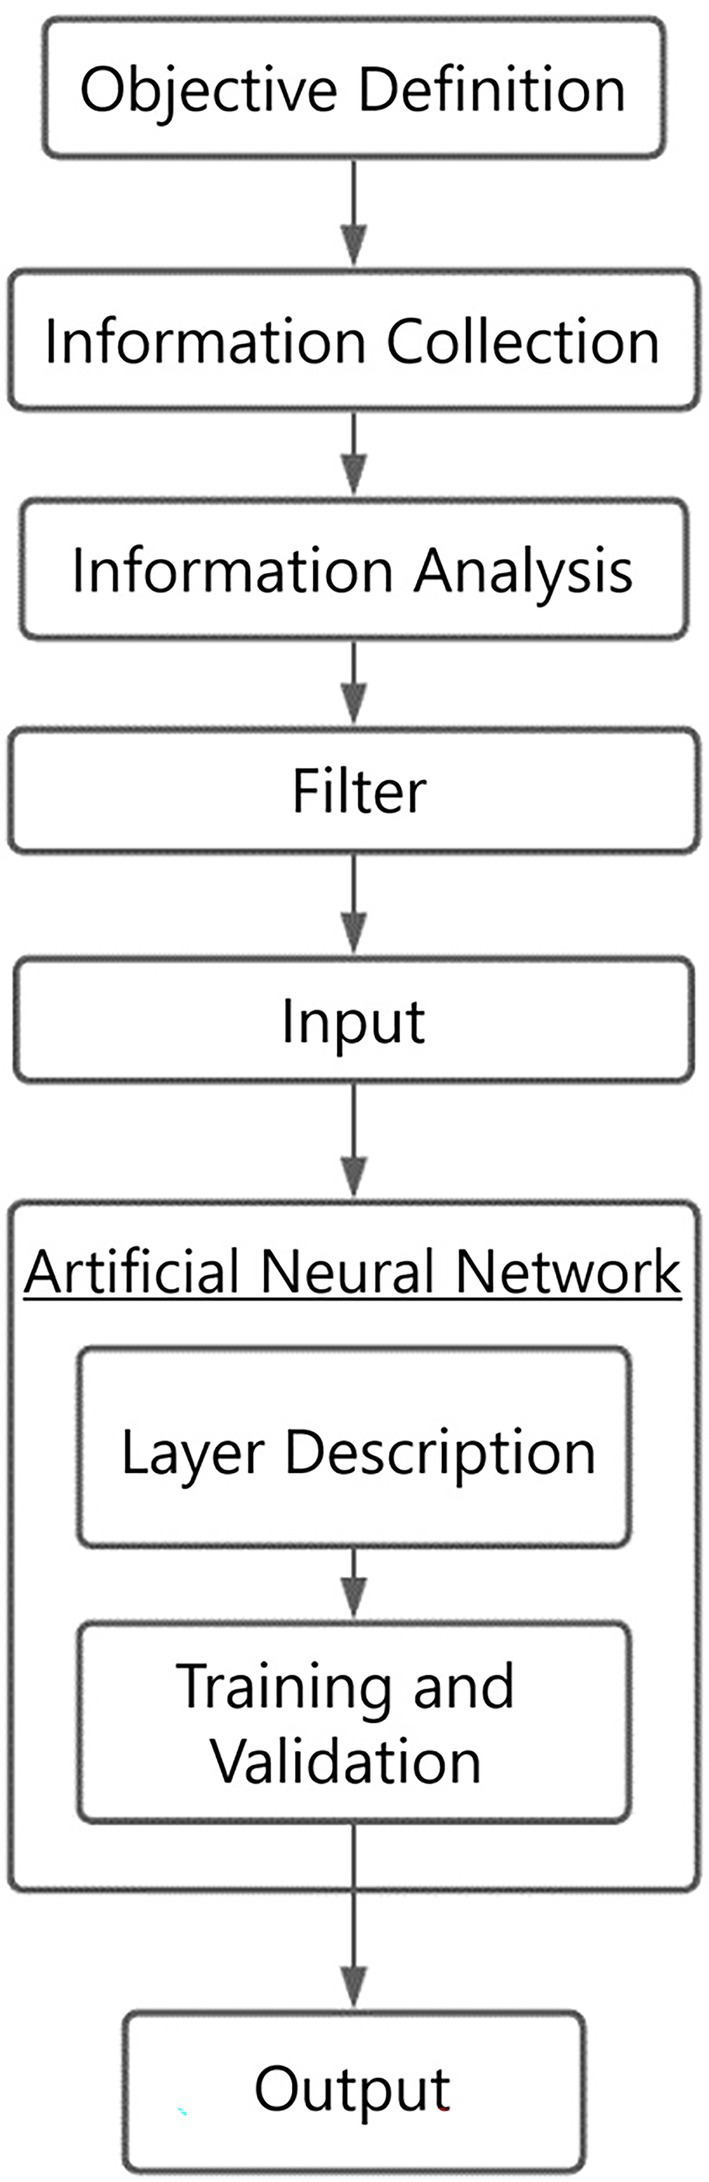
Figure 1. Proposed architecture.
The main objective of this project is to forecast the academic performance of university students throughout their course to help professors and academic institutions better identify students at risk of failing and adopt corresponding supporting measures, thereby ensuring that students successfully complete their academic cycle, which in turn helps the institution garner prestige.
The dataset used for project development was collected from the Open University Learning Analytics dataset, which provides information about courses, students, and their interactions with the Virtual Learning Environment (VLE). The dataset consists of tables interconnected with a single identifier. All tables are in.csv format. Figure 2 denotes the dataset structure.

Figure 2. Dataset structure Kuzilek et al. (2017).
The dataset obtained from Kuzilek et al. (2017) contains information about 22 courses, 32,593 students, their evaluation results, and records of their interactions with the VLE represented by daily summaries of student clicks (10,655,280 entries). This information is arranged in seven tables.
After the information has been collected, it must be analyzed. This analysis will help us segment the information and facilitate its manipulation. The dataset collected is detailed below, each set represents a table of the entire database.
• Courses.csv stores course information.
• Assessments.csv stores information regarding course assessments.
• Vle.csv contains information about the materials available on the VLE.
• StudentInfo.csv stores general information about the students, such as demographics and final grade.
• StudentRegistration.csv stores information about student registration to a course module.
• StudentAssessment.csv contains information about student assessment results.
• StudentVle.csv contains information about the student’s interaction with the materials on the VLE.
The tables have a total of 41 attributes, of which 20 are identifiers (Primary Key and Foreign Key); of the remaining 21 attributes, 9 were discarded, since they did not have a direct relationship with the student’s grade according to the documentation of the database itself.
Of the remaining 12 attributes, 3 contained personal information: age, gender and location, and another 3 attributes contained information not relevant to the application. This left only 6 attributes from the entire database that were useful for our purpose.
The target variable is “final_result” found in the “studentInfo” table as shown in Figure 2, this variable is a “string,” representing whether a student passed or failed the course, which was transformed to “bulean” so that it can then be entered into the model.
As can be seen in Figure 3, shows the correlation of the variables using the spearman method, and Figure 4 shows the correlation of the variables but using the pearson method. After observing a correlation between the pass_rate and weighted_grade variables in the two figures, we applied a sklearn method (feature_importances) to see which variable had the greatest impact on both the machine learning models and the neural network.

Figure 3. Spearman’s correlation coefficient:
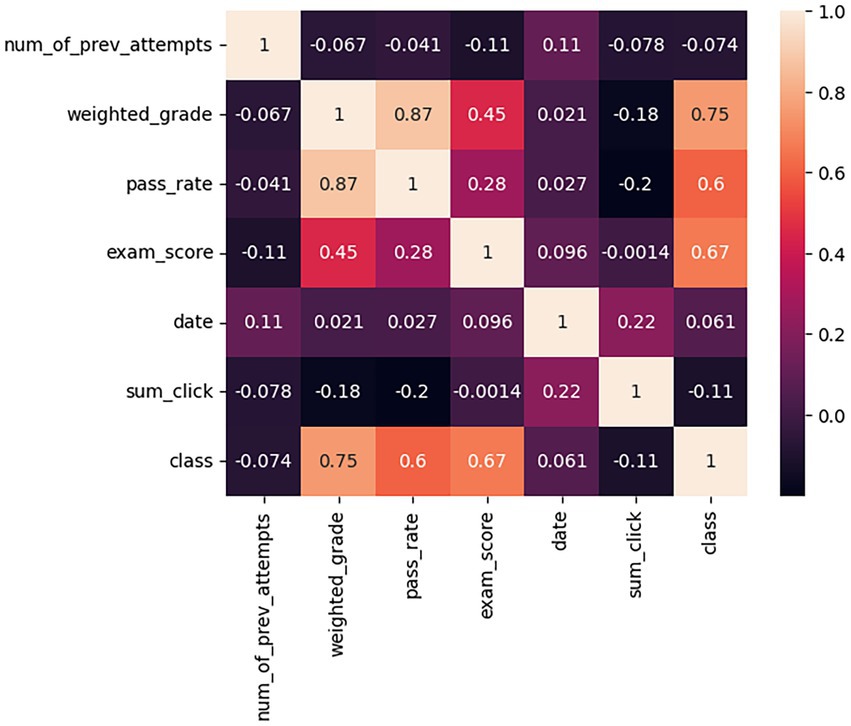
Figure 4. Pearson’s correlation coefficient.
Using the Feature_importances function, we observed that weighted_grade has more impact on the models results, so we tested all the models using pass_rate and removing it as input in the models, the results are shown in Table 2.
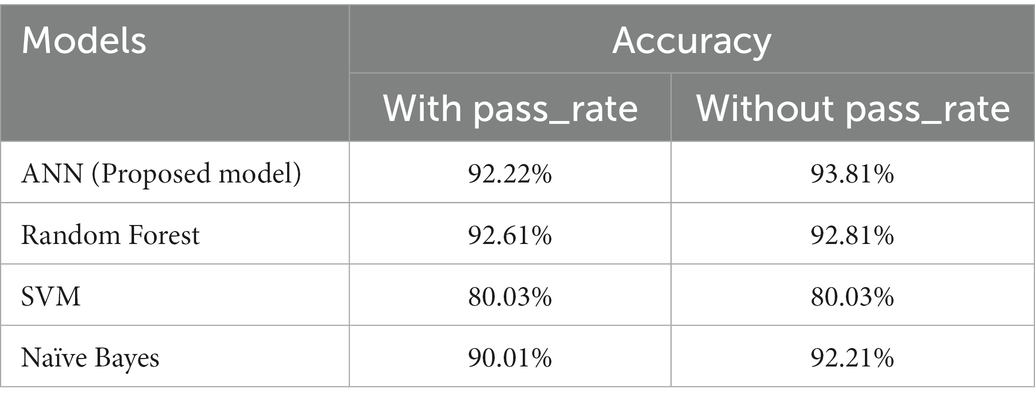
Table 2. Accuracy comparison using the “pass_rate” variable.
On Random Forest and SVM, the change is not as significant as on ANN and Naive Bayes, for these results the pass_rate column was removed as an input.
Once the dataset has been filtered and sorted, it is ready for input into the artificial intelligence engine.
The inputs used to predict student academic performance in final exams are as follows:
• Number of attempts (num_of_prev_attempts): Number of times a student has taken or repeated the course.
• Average grade of the evaluation (weighted_grade): Weighted grade obtained by the student in all the previous evaluations of the course. Not to be confused with the final exam.
• Test score (exam_score): The student’s score on this evaluation. The range is from 0 to 100. A score below 40 is interpreted as a Fail. Grades are in the range of 0 to 100.
• Average date of use of materials (date): average of the dates on which the learner interacted with the materials in the EVE measured as the number of days since the presentation of the module.
• Average number of clicks (sum_click): Average number of interactions the learner had with the course materials.
It should be noted that the inputs have a uniform distribution.
The outputs will be used by professors to easily identify students with the highest risk of failing the course so they can decide, based on their expertise, what type of specific methodology can help these students pass the course. To predict academic performance, we defined two categories:
• Pass: The student will pass the course.
• Fail: The student could fail the course.
The proposed artificial intelligence will use one of these categories to indicate the results.
Three machine learning modes and one artificial neural network were proposed and developed; the architecture and characteristics of each model will be detailed below.
The proposed neural network contains three layers (Figure 5):
• The input layer contains five neurons representing the number of variables in the clean dataset. Its activation function is “ReLU,” since the computational step and the gradient calculation, compared to other activation functions, is faster.
• A hidden layer wherein the number of neurons will be selected using the following empirical method (Heaton, 2009): “The number of hidden neurons must be less than twice the size of the input layer.” Therefore, this hidden layer will have eight neurons, with an activation function of “ReLU.”
• The output layer is comprised of one neuron, which represents the result from the model prediction. Its activation function is “sigmoid,” this is because we have a boolean output.
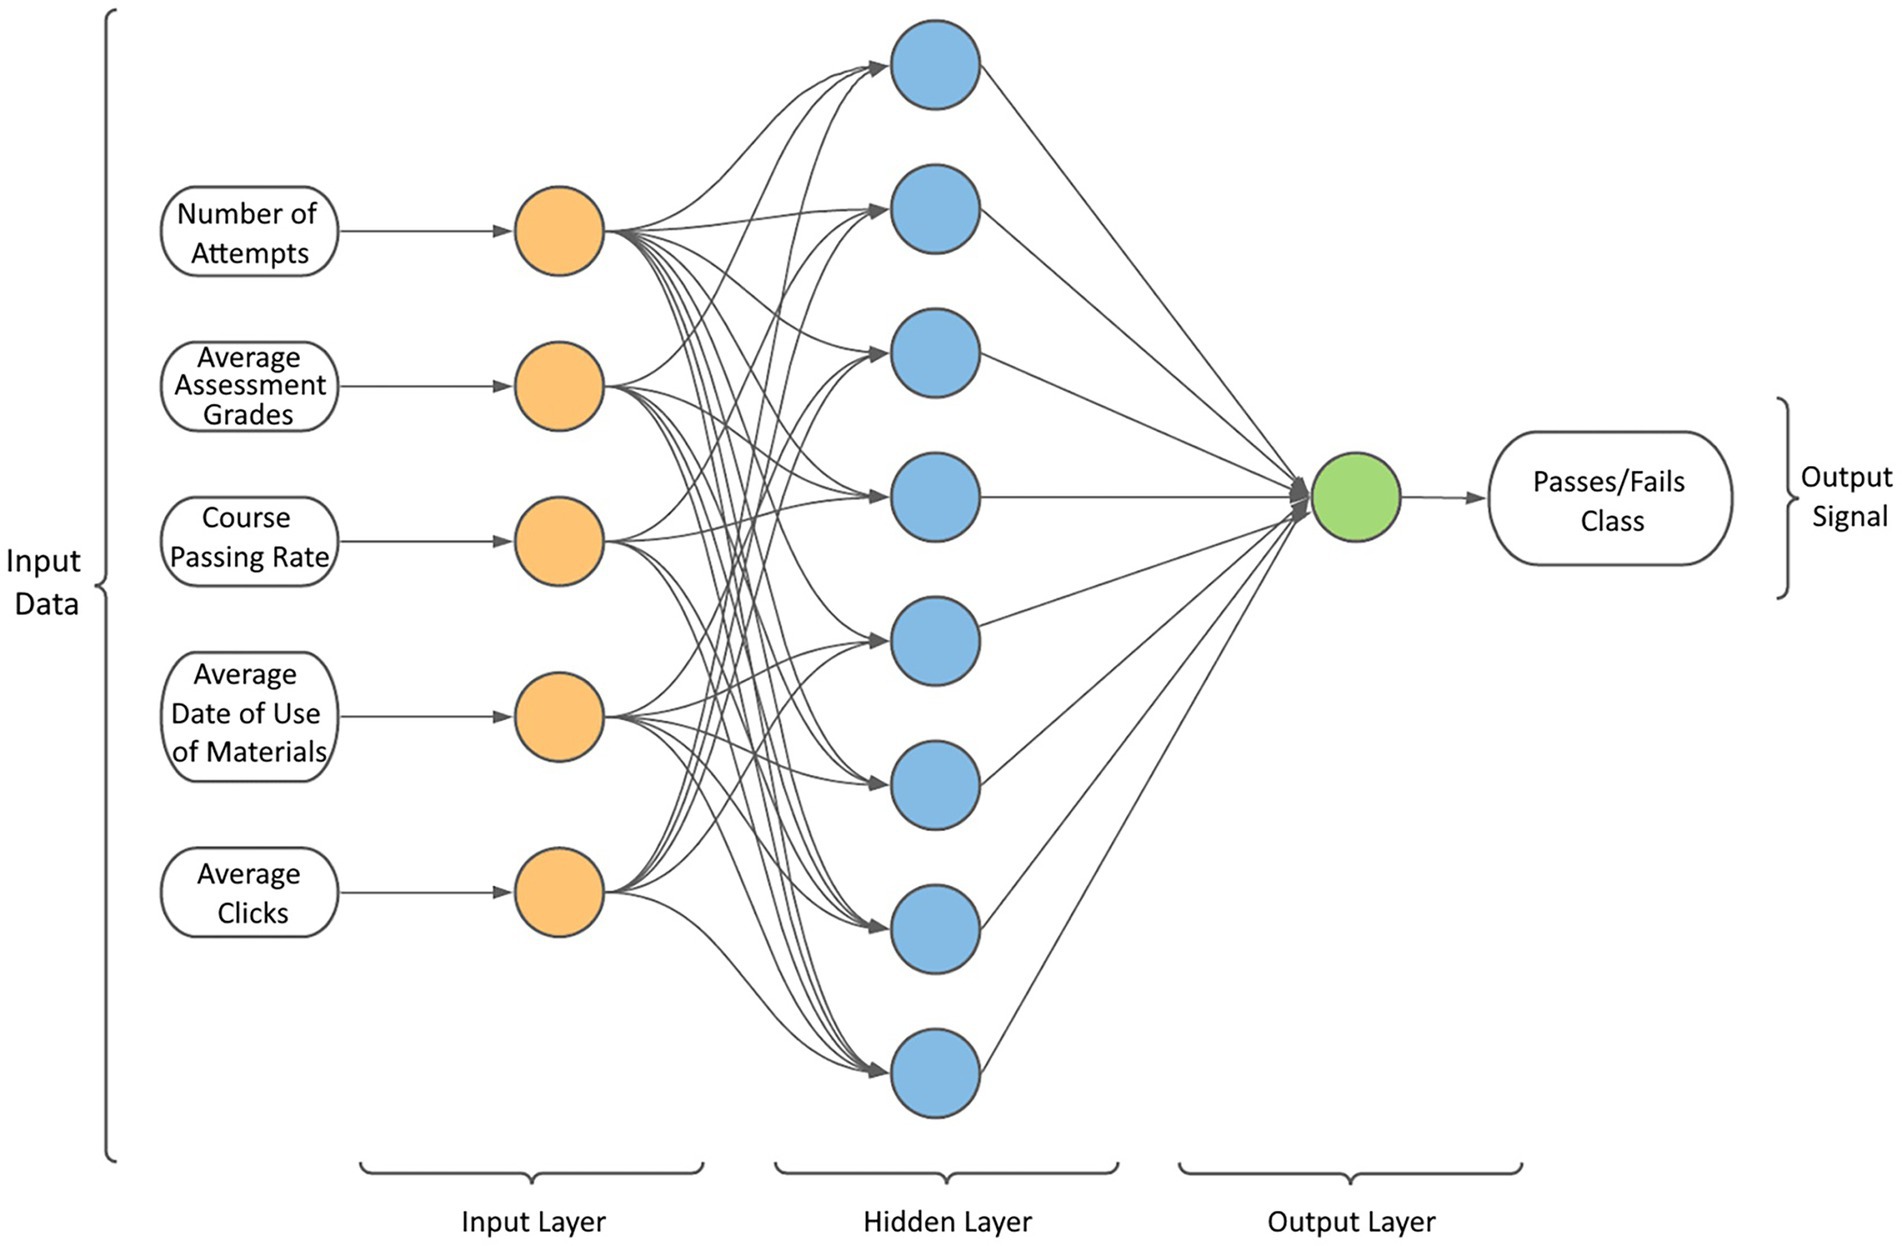
Figure 5. Neural network architecture chart.
For training, the following hyper parameters were used:
• Epochs: 100
• Activation Function: ReLU & Sigmoid
o ReLU:
o Sigmoid:
• Optimizer: Adam
• Loss Function: Binary_CrossEntropy
• Metrics: Accuracy and Loss
• Overfitting: EarlyStopping
Because overfitting is a common problem in neural networks, we implement the following strategy to prevent this issue. We divide the dataset 70/30 such that 70% is directed toward the training of the neural network and the remaining 30% is used for neural network validation.
The number of training epochs will be 100, and in each epoch, the backpropagation algorithm will be used to improve weights and input biases and obtain a more accurate result or “minimize loss.”
To know exactly which parameters are necessary for the good performance of our model, we apply the sklearn function GrigSearchCV, which receives a set of parameters and returns the best ones for the model according to the training data, it is worth noting that this function was used for the following machine learning models.
As input for the GrigSearchCV function, we gave it the following parameters:
• C = [0.1, 1, 10, 100]
• Gamma = [1, 0.1, 0.01, 0001]
• Kernel = [‘rbf ‘, ‘poly’, ‘sigmoid’]
The parameters used for the SVM model were as follows:
• C = 100
• Kernel = rbf
• Gamma = 0.1
• Probability = True
The percentage for training was 70% of the dataset.
In the case of Naive Baye no parameters were specified, due to the same architecture, only the percentage for training had to be defined, which was the same as in the case of SVM, 70% of the dataset.
In the case of random fores, we used the GridSearchCV function mentioned above, with the following input parameters:
• n_estimators = [200, 700]
• max_features = [‘auto’, ‘sqrt’, ‘log2’]
• max_depth = [2, 3, 4, 5, 6, 7, 8, 9, 10]
The parameters used for the Random Forest model were as follows:
• n_estimators = 700
• max_features = log2
• max_depth = 5
It is worth mentioning that in this model we used the feature_importances function which allows us to see which features are more relevant for the model according to the dataset, as a result we obtained weighted_grade as the most important feature, this can be seen in Figure 6.
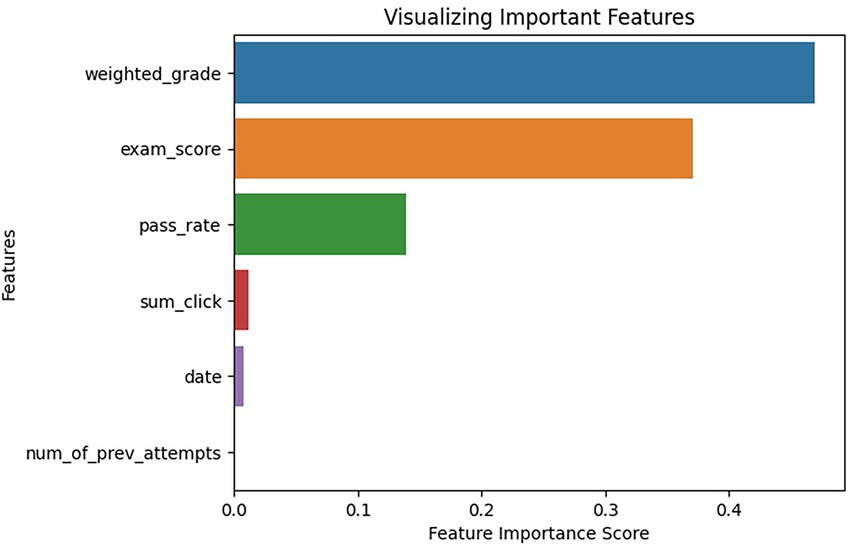
Figure 6. Important features.
Given the dataset variables used in the project, we handle some student personal information, such as gender. We use this variable neither for training the neural network nor for predictions. We believe that using this information will be unethical because it can generate discrimination regarding which gender is more “intelligent” or has greater capacities. We do not consider this relevant because a small section of the population does not appropriately represent all women or men worldwide. Furthermore, we do not want to create controversy in the classroom by implying that one group has better abilities than another; we are only trying to predict student performance in the course and not the abilities that a person may have.
In Section 3.1.4, we mentioned some filters that will be applied to the dataset. One of these filters removes data from students who did not take some of the course assessments because they may be absent due to several reasons, such as illnesses, economic issues, and personal issues, which may have influenced the student’s performance in the course. We believe that it would be unethical to deem a student inefficient when they may be experiencing circumstances that may prevent them from attending class and affect their academic performance.
The ethics model used in this project secures information provided by users because this information shall not be retained or used for unethical purposes. Given the number of cases where information is leaked with malicious intent, personal data was not required for the development of the project and was not used at any stage of the project.
This section presents the results from the proposed process as explained in the Contribution section. We must remember that the proposed algorithm is an artificial neural network, which predicts student academic performance in a given course.
The confusion matrix (Figure 7) of the model after training is shown below, where it is observed that out of a total of 291 passing students, 274 were predicted correctly, and out of a total of 210 failing students, 196 were predicted correctly.
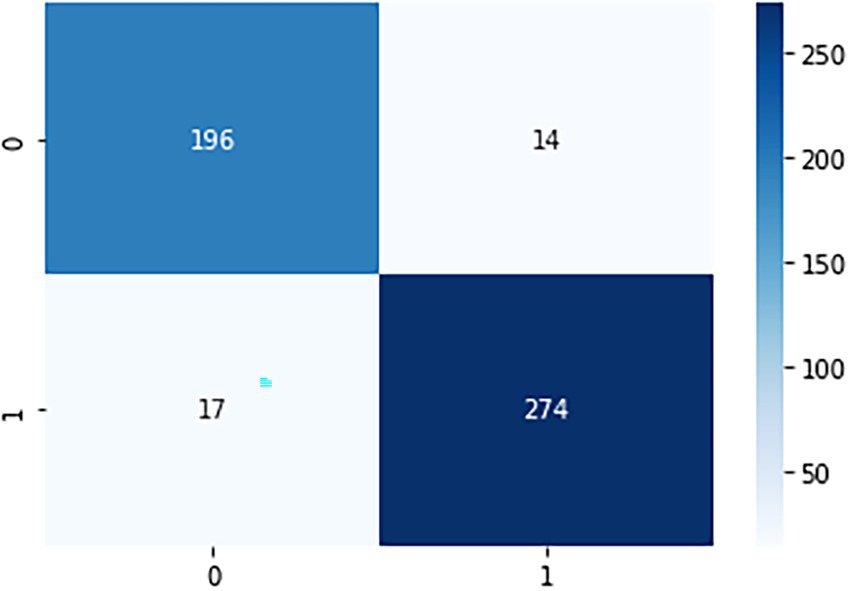
Figure 7. Confusion matrix.
Table 3 shows the results of the confusion matrices and the accuracy of the proposed and developed models, the compared models were trained and validated with the same data set.
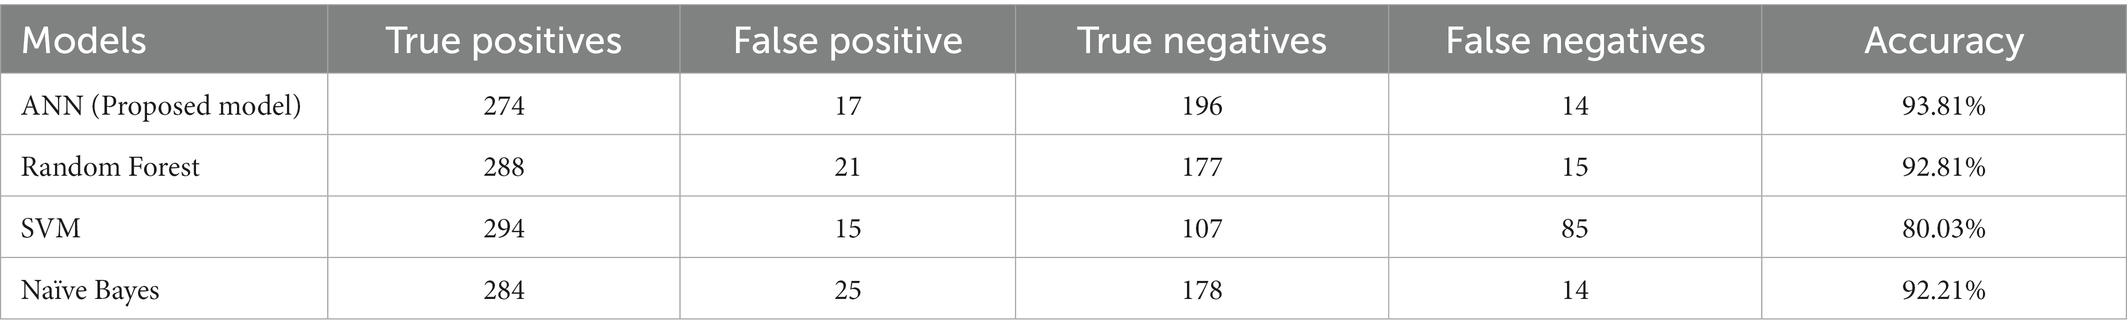
Table 3. Results of the confusion matrices.
To track the evaluation of the training and validation process of the artificial neural network, the Accuracy and Loss metrics were used in each epoch.
Figure 8 illustrates the Accuracy and Loss recorded for each epoch. On one hand, Training Accuracy, in orange, reaches a certain percentage where it remains stable, and Validation Accuracy, in red, follows the same behavior as Validation Accuracy. On the other hand, Loss Training and Validation follow a similar decreasing pattern until reaching a minimum percentage, where they stabilize.
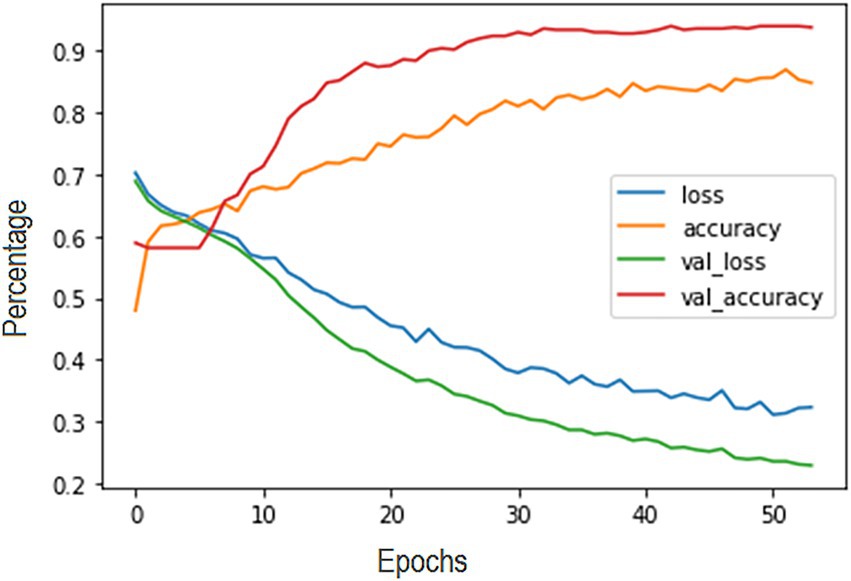
Figure 8. Accuracy and loss recorded for each epoch.
A total of 100 epochs were required for training in the hyperparameters. However, to avoid overfitting, EarlyStopping was used, thereby cutting off at 54 epochs upon detecting that the accuracy percentage remained constant.
The model achieved 93.81% accuracy, which indicates that the prediction was correct for the percentage of cases validated. Likewise, 94.15% precision was obtained. This measures the quality of the model, indicates the number of students who actually passed the course, and predicts that they would pass the course. In other words, it is the percentage of students correctly identified by the model as passing from the total number of students identified by the model as passing. The model achieved 95.13% recall, which indicates the number of approved students that the model identified, that is, the percentage of students correctly identified as approved from the total number of approved students. Finally, the model obtained an 94.64% F1-score, which is the combination of the accuracy and recall metrics as a single value.
This section compares the performance of the proposed model with the models that had the best performance according to the literature. The most relevant studies are specified in Table 1. Three machine learning models were implemented, which were trained with the same set of datasets with which the neural network was trained in order to compare them.
According to Benablo et al. (2018), who evaluated the SVM and KNN techniques, the SVM model provides 98% accuracy due to the type of model used to predict performance as a function of the input data. Benablo et al. (2018) also details three other models used in which a variation in the instances of the dataset is seen. The higher the number of instances, the higher the accuracy, sometimes reaching 100%. After the implementation of our own SVM model, and the comparison with the proposed neural network model, we can observe which neural network is better both in accuracy and in the test results shown in the Table 3.
After comparing with the Amazona and Hernandez (2019) proposal, three different models were used: Naïve Bayes, deep learning and decision tree, with an accuracy of 96, 98 and 93%, respectively. We opted to implement our own Naïve Bayes model to train it on our dataset for comparative purposes. The results of the Naïve Bayes model were the lowest in the comparisons performed, as can be seen in Table 3.
In his research, Rodrígiez-Hernández et al. (2021) implemented an artificial neural network to predict the academic performance of senior students. The research notes that they used information from a sample of 162,030 students and that the trained model provided an accuracy of 82%. However, they also used personal information about the students (e.g., their socioeconomic status, household characteristics, personal background, the types of schools they had attended, and the salary of working students) to train the model. In this case, to perform the comparison of the models with the same data set, the Rodrígiez-Hernández et al. (2021) model would have to be modified, so a correct comparison cannot be performed; however, we can observe that 8 of the 10 attributes used as input data, are personal data, this means that if we remove the personal data from their model, the model would suffer a decay in performance. Yağcı (2022) implemented several models to predict students’ academic performance.
The models used were random forest, neural network, SVM, logistic regression, Naïve Bayes and KNN, where the neural network provided the best results with an accuracy of 86.30%. Yağcı (2022) did not use students’ personal data. They only used their midterm and final exam grades, career path and academic department as information. The 86% accuracy obtained by this research study is the highest accuracy rate. Thus, a proprietary Random Forest model was implemented, trained with the same data set with which our proposed model was trained. The result of the Random Forest model was the best performing among the implemented models, this can be seen in Table 3.
The research of Yousafzai et al. (2021) compares the existing models, such as RNN, CNN, LSTM, SVM and BiLSTM, with the model proposed by the authors, which achieved a better accuracy of 90.16%. Yousafzai et al. (2021) uses personal data, such as age, gender, address, parents’ occupation, type of school and parents’ educational level, to train the model. The dataset used for training is mainly composed of personal data. Similar case to Rodrígiez-Hernández et al. (2021), due to the architecture developed by the authors and the database used, it is not possible to perform an equivalent comparison; however, we can observe that from the model proposed by Yousafzai et al. (2021), 15 of the 33 entries for his model are personal information of the students, such as: age, location, love relationship, father’s jobs, mother’s jobs, etc. which means that if we were to remove those 15 entries, the model would suffer a loss of performance.
Comparing our model with the literature, we can observe that personal data significantly affect the model results, regardless of the type of model used. For this reason, and due to the increasing vulnerability of personal data evidenced by data breaches and leaks, we propose a student performance prediction tool that does not expose sensitive student and teacher information and yields better results than the observed literature.
In this research, an artificial neural network model was proposed to predict students’ academic performance in their courses, which obtained an accuracy of 93.81%, without exposing their personal data.
Low student performance such as student dropout in courses is a problem, which affects both educational institutions and students. Because of this, we developed a model superior to all the proposed literature that can predict whether a student will pass or fail a subject in the middle of the course. This information will be useful for the competent authorities of student achievement to take measures to avoid withdrawal and underachievement.
It was necessary to propose some ethical metrics for the development of our model. Unlike the literature, we proposed a neural network model that did not use personal input data and preserved students’ privacy. This gives rise to a new area of study in which personal data is avoided, as many industries today constantly report personal data breach and leakage.
In future work, more data regarding student interaction with digital platforms can be used, since as a consequence of the COVID-19 pandemic, academic learning has become largely virtualized and much more information will be available.
It is worth noting that this process of predicting student performance under ethical standards can be automated on university platforms, thus facilitating access to information for student affairs officers.
Publicly available datasets were analyzed in this study. This data can be found at: https://analyse.kmi.open.ac.uk/open_dataset.
HC, BC-A, and SC-R performed the predictive analysis. CR, HC, and BC-A wrote the first draft of the manuscript. CR, HC, BC-A, SC-R, and JA-R wrote sections of the manuscript. All authors contributed to the manuscript revision, read, and approved the submitted version.
The authors would like to thank the Research Directorate of the Universidad Peruana de Ciencias Aplicadas for the support provided to carry out this research work through the UPC-EXPOST-2023-1 incentive.
The authors declare that the research was conducted in the absence of any commercial or financial relationships that could be construed as a potential conflict of interest.
All claims expressed in this article are solely those of the authors and do not necessarily represent those of their affiliated organizations, or those of the publisher, the editors and the reviewers. Any product that may be evaluated in this article, or claim that may be made by its manufacturer, is not guaranteed or endorsed by the publisher.
Alaieri, F., and Vellino, A. (2017). “A decision making model for ethical (Ro)bots.” in IEE International Symposium on Robotics and Intelligent Sensors (IRIS), Ottawa, ON, Canada. 203–207. doi: 10.1109/IRIS.2017.8250122
Amazona, M. V., and Hernandez, A. A. (2019). “Modelling student performance using data mining techniques.” in Proceedings of the 2019 5th International Conference on Computing and Data Engineering—ICCDE’ 19. New York, NY, USA: Association for Computing Machinery. 36–40. doi: 10.1145/3330530.3330544
Benablo, C. I. P., Sarte, E. T., Dormido, J. M. D., and Palaoag, T. (2018). Higher education Student’s academic performance analysis through predictive analytics in Proceedings of the 2018 7th International Conference on Software and Computer Applications—ICSCA 2018. New York, NY, USA: Association for Computing Machinery. 238–242. doi: 10.1145/3185089.3185102
Blanco, J., Lovelle, S., Fernandez, R., and Perez, E. (2016). Predicción de resultados académicos de estudiantes de informática mediante el uso de redes neuronales. Ingeniare. Revista chilena de ingeniería 24, 715–727. doi: 10.4067/S0718-33052016000400015
Castrillón, O., Sarache, W., and Ruiz, S. (2020). Prediction of academic performance using artificial intelligence techniques. From Univ. 13, 93–102. doi: 10.4067/S0718-50062020000100093
Daud, A., Aljohani, N. R., Abbasi, R. A., Lytras, M. D., Abbas, F., and Alowibdi, J. S. (2017). “Predicting student performance using advanced learning analytics.” in Proceedings of the 26th International Conference on World Wide Web Companion—WWW ‘17 Companion. Republic and Canton of Geneva, CHE: International World Wide Web Conferences Steering Committee. 415–421. doi: 10.1145/3041021.3054164
Department of Information Technology. Aurora State College of Technology. Available at: https://www.ascot.edu.ph/departments/department-of-information-technology/
Devasia, T., Vinushree, T. P., and Hegde, V. (2016). “Prediction of students' performance using educational data mining.” in 2016 International Conference on Data Mining and Advanced Computing (SAPIENCE). Ernakulam, India. 91–95. doi: 10.1109/SAPIENCE.2016.7684167
Hasan, H. M. R., Rabby, A. S. A., Islam, M. T., and Hossain, S. A. (2019). “Machine learning algorithm for Student’s performance prediction.” 2019 10th International Conference on Computing, Communication and Networking Technologies (ICCCNT). Kanpur, India. 1–7. doi: 10.1109/ICCCNT45670.2019.8944629
Heaton, J. (2009). Introduction to Neural Networks with Java, 2nd. Chesterfield, MO: Heaton Research, 2009, p. 129.
Instituto Colombiano para la Evaluación de la Educación – ICFES (2021). DataIcfes. Available at: https://www2.icfes.gov.co/data-icfes (Accessed June 6, 2021).
Jayaprakash, S., Krishnan, S., and V, J. (2020). “Predicting students academic performance using an improved random Forest classifier.” in 2020 International Conference on Emerging Smart Computing and Informatics (ESCI). Pune, India. 238–243. doi: 10.1109/ESCI48226.2020.9167547
Kumar, V. U., Krishna, A., Neelakanteswara, P., and Basha, C. Z. (2020). “Advanced prediction of performance of a student in an university using machine learning techniques.” in 2020 International Conference on Electronics and Sustainable Communication Systems (ICESC). Coimbatore, India. 121–126. doi: 10.1109/ICESC48915.2020.9155557
Kuzilek, J., Hlosta, M., and Zdrahal, Z. (2017). Open University learning analytics dataset. Sci. Data 4:170171. doi: 10.1038/sdata.2017.171
Liao, C., and Wu, J. (2022). Deploying multimodal learning analytics models to explore the impact of digital distraction and peer learning on student performance. Comput. Educ. 190:104599. doi: 10.1016/j.compedu.2022.104599
Liao, S. N., Zingaro, D., Thai, K., Alvarado, C., Griswold, W. G., and Porter, L. (2019). A robust machine learning technique to predict low-performing students. ACM Trans. Comput. Educ. 19, 1–19. doi: 10.1145/3277569
Ma, X., Yang, Y., and Zhou, Z. (2018). “Using machine learning algorithm to predict student pass rates in online education.” in Proceedings of the 3rd International Conference on Multimedia Systems and Signal Processing - ICMSSP ‘18. New York, NY, USA: Association for Computing Machinery. 203–207. doi: 10.1145/3220162.3220188
Páez, A., and Guzmán, D. (2018). Diseño de un modelo para automatizar la predicción del rendimiento académico en estudiantes del IPN. Revista Iberoamericana para la Investigación y el Desarrollo Educativo 8, 246–266. doi: 10.23913/ride.v8i16.340
Rincon-Flores, E. G., López-Camacho, E., Mena, J., and López, O. O. (2020). “Predicting academic performance with artificial intelligence (AI), a new tool for teachers and students.” in 2020 IEEE Global Engineering Education Conference (EDUCON). Porto, Portugal. 1049–1054. doi: 10.1109/EDUCON45650.2020.9125141
Rodrígiez-Hernández, C., Musso, M., Kyndt, E., and Cascallar, E. (2021). Artificial neural networks in academic performance prediction: systematic implementation and predictor evaluation. Comput. Educ. Artif. Intell. 2:100018. doi: 10.1016/j.caeai.2021.100018
Sekeroglu, B., Dimililer, K., and Tuncal, K. (2019). “Student performance prediction and classification using machine learning algorithms.” in Proceedings of the 2019 8th International Conference on Educational and Information Technology—ICEIT 2019. New York, NY, USA: Association for Computing Machinery. 7–11. doi: 10.1145/3318396.3318419
SINEACE (2016). Modelo de Acreditación para Programas de Estudios de Educación Superior Universitaria, Lima, Perú.
Tejedor, F., and García-Valcárcel, A. (2007). Causas del bajo rendimiento del estudiante universitario (en opinión de los profesores y alumnos). Propuestas de mejora en el marco del EEES. Revista de Educación 342, 443–473. Available at: https://dialnet.unirioja.es/servlet/articulo?codigo=2254218 (Accessed May 6, 2021).
UCI Machine Learning Repository (2021). Student Performance Data Set. Available at: https://archive.ics.uci.edu/ml/datasets/student+performance.
Viale, H. (2014). Una aproximación teórica a la deserción estudiantil. Revista Digital de Investigación en Docencia Universitaria. 8, 59–76. doi: 10.19083/ridu.8.366
Vicerrectorado Académico (2017). Cuando lo que se sabe nos dice cuánto no se sabe—Vicerrectorado Académico. Available at: https://vicerrectorado.pucp.edu.pe/academico/noticias/cuando-lo-que-se-sabe-nos-dice-cuanto-no-se-sabe/ (Accessed May 3, 2021).
Widyaningsih, Y., Fitriani, N., and Sarwinda, D. (2019). “A semi-supervised learning approach for predicting Student’s performance: first-year students case study.” in 2019 12th International Conference on Information & Communication Technology and System (ICTS). Surabaya, Indonesia. 291–295. doi: 10.1109/ICTS.2019.8850950
Yağcı, M. (2022). Educational data mining: prediction of students’ academic performance using machine learning algorithms. Smart Learn. Environ. 9, 9:11. doi: 10.1186/s40561-022-00192-z
Keywords: privacy, personal data, neural networks, forecasting, academic performance
Citation: Chavez H, Chavez-Arias B, Contreras-Rosas S, Alvarez-Rodríguez JM and Raymundo C (2023) Artificial neural network model to predict student performance using nonpersonal information. Front. Educ. 8:1106679. doi: 10.3389/feduc.2023.1106679
Edited by:
Eduardo Cascallar, KU Leuven, BelgiumReviewed by:
Tak-Lam Wong, Douglas College, CanadaCopyright © 2023 Chavez, Chavez-Arias, Contreras-Rosas, Alvarez-Rodríguez and Raymundo. This is an open-access article distributed under the terms of the Creative Commons Attribution License (CC BY). The use, distribution or reproduction in other forums is permitted, provided the original author(s) and the copyright owner(s) are credited and that the original publication in this journal is cited, in accordance with accepted academic practice. No use, distribution or reproduction is permitted which does not comply with these terms.
*Correspondence: Carlos Raymundo, Y2FybG9zLnJheW11bmRvQHVwYy5lZHUucGU=
Disclaimer: All claims expressed in this article are solely those of the authors and do not necessarily represent those of their affiliated organizations, or those of the publisher, the editors and the reviewers. Any product that may be evaluated in this article or claim that may be made by its manufacturer is not guaranteed or endorsed by the publisher.
Research integrity at Frontiers
Learn more about the work of our research integrity team to safeguard the quality of each article we publish.