 Matthias Borgstede
 Caroline Rau
- Foundations of Education, University of Bamberg, Bamberg, Germany
In this article, we propose a new approach to the problem of integration in mixed methods research that builds on a representational understanding of empirical science. From this perspective, qualitative and quantitative modeling strategies constitute two different ways to represent empirical structures. Whereas qualitative representations focus on the construction of types from cases, quantitative representations focus on the construction of dimensions from variables. We argue that types and dimensions should be integrated within a joint representation of the data that equally acknowledges qualitative and quantitative aspects. We outline how the proposed representational framework can be used to embed qualitative types in quantitative dimensions using an empirical study on teachers’ epistemological beliefs.
1. Introduction
Although qualitative and quantitative research methods adhere to rather distinct assumptions about the aims and scope of scientific enquiry (Freeman et al., 2007), attempts to integrate both strategies within a mixed methods approach are eventually gaining attention (Creswell, 2015). Mixed methods research attempts to combine the strengths of qualitative and quantitative research by using both strategies within an overarching methodological framework. However, there is no generally accepted integration framework for mixed methods designs (Fetters and Molina-Azorin, 2017). Consequently, integration of qualitative and quantitative strategies remains a major challenge for mixed methods research (Moran-Ellis et al., 2006; Creswell, 2009; O'Cathain et al., 2010; Fielding, 2012; Bazeley, 2016). In some cases, the qualitative and quantitative parts of a mixed methods design may even appear to be two different studies that are only connected thematically (Yin, 2006; Bergman, 2011).
In this article, we approach the problem of integration from a representational perspective that characterizes qualitative and quantitative research as different ways to represent empirical observations by means of scientific theories (Borgstede and Scholz, 2021). In this view, the semantics of a scientific theory (or model) is twofold. On the one hand, it consists of the meaning of its constituting concepts. On the other hand, it consists of the topology that relates these concepts to one another. Different types of models may emphasize either one of these aspects. Following Borgstede and Scholz (2021), qualitative representations focus on theoretically meaningful concept formation that is based on the essential properties of the objects under study. The objects may be of very different nature, depending on the focus of the study. This includes inanimate objects, as well as living organisms, people, groups, interviews, or even abstract concepts and themes. Quantitative representations, however, are more concerned with the topological structure that relates the concepts to one another. In other words, they focus on the dimensions by which the concepts differ and their geometric properties.
We argue that acknowledging that meaning and topology are just different aspects of the semantics of scientific concepts is the key to a general framework for integrating qualitative and quantitative research. Qualitative research captures the essential properties of scientific concepts by means of abstract typologies. Quantitative research captures the relations between different scientific concepts by means of geometric spaces.
We develop a corresponding methodological framework that integrates both perspectives to answer the following questions: (a) How do qualitative representations (typologies) relate to quantitative representations (geometric spaces)? (b) How can the former be properly embedded into the latter? The focus of our analysis is a common research problem that arises when the results of a qualitative study are used to guide quantitative model building and test construction. Nevertheless, the methodology can easily be adapted to other mixed methods designs. For example, a study may start with quantitative questionnaire data and then proceed with a qualitative investigation to further explore the underlying empirical structure. Once the qualitative data has been collected, our framework may be applied in exactly the same way as if the qualitative study had not been informed by questionnaire data. In addition to the quantitative embedding of qualitative types, the resulting geometric space may be used to revise the original questionnaires and inform further quantitative inquiry.
In the following sections, we will first elaborate on the general relation between (qualitative) case-based and (quantitative) variable-based models from a representational perspective (section 2). We will proceed to characterize both approaches with an emphasis on explicit and implicit model properties (sections 3, 4). We will then refine the representational view to develop a methodological framework for integrating qualitative and quantitative research (section 5), and demonstrate the feasibility of our framework by an empirical case study about teachers’ epistemological beliefs (section 6). Finally, we discuss the implications of our analysis with regard to further methodological developments and possible applications (section 7).
2. Qualitative and quantitative representations
Borgstede and Scholz (2021) argue that qualitative and quantitative research employ two different, yet compatible, ways to describe empirical relational structures. Whereas the qualitative strategy uses a case-based approach to characterize individuals, the quantitative strategy applies a variable-based approach to characterize attributes and their functional relations (Ragin, 1987; Rihoux and Ragin, 2009). In many cases, however, both modeling strategies can be applied to one and the same empirical structure. Consequently, qualitative (case-based) models often imply a quantitative structure that is distinct from the observed qualia. Similarly, quantitative (variable-based) models often imply a qualitative structure that is distinct from the variables that are used to represent the data.
To illustrate the relation between qualitative and quantitative representations, let us imagine a simple empirical structure consisting of two kinds of objects—a collection of cases and a collection of observations. The cases may be individuals, groups, texts or instances of any other category. The observations may be distinct behaviors, answers in a standardized test, utterances in a conversation or any other class of attributes of the cases under study.1
If the cases are individuals and the observations are the answers in a competence test, we might represent the observed empirical structure by means of a quantitative model involving a single dimension. One of the most commonly used models for such structures is the Rasch model (Rasch, 1960). The Rasch model postulates a single quantitative dimension by which individuals and test items can be compared, such that higher differences between an individual and a test item result in a higher probability of a correct answer. This probabilistic relation makes some empirical structures (i.e., answer patterns in a test) more likely than others. Hence, if an observed empirical structure is not too unlikely given the Rasch model, we can use the structure to statistically estimate the corresponding model parameters. This scaling procedure transforms the empirical structure that consisted of individuals and test items into a new abstract structure that consists of points in a unidimensional geometric space – a so-called latent variable. We have thus constructed a numerical representation of an empirical structure. Such representations are called measurement (Krantz et al., 1971). Measurement, as described above, is the foundation of any quantitative science. However, it is important to note that proper measurement has to be grounded in suitable empirical structures.2
If the cases are, for example, work teams and the observations are utterances in a discussion, we would rarely apply a Rasch model to represent the empirical structure (although, technically, this would be possible). In such a case the more intuitive approach would be to group the different utterances according to their semantic similarity and to group the teams such that they maximally differ with respect to the semantic content of their utterances. Instead of mathematical model equations and statistical estimation techniques, such a grouping usually relies on interpretative acts from the part of the researchers. However, the result is also a representation of the empirical structure, the main difference being that instead of numbers we have used words, or abstract concepts, to guide our interpretation of the topics and themes that have been discussed by the work teams under study. The interpretative act transforms the empirical structure that consisted of teams and utterances into a new abstract structure that consists of categories and types. We have constructed a conceptual representation of an empirical structure. Such representations are commonly called typologies or, if the grouping is only performed over the topics rather than the cases, category systems or patterns. Typologies and category systems are the foundation of all qualitative science. Like measurement, such representations have to be grounded in empirical observations (Flick, 2014). In light of these two examples, quantitative and qualitative approaches seem not so different after all. Both rely on empirical structures consisting of cases and observations. And both provide means to construct abstract representations of these empirical structures. However, categories are not dimensions and typologies are not geometric spaces.
Qualitative and quantitative research can be consistently interpreted as specific modeling strategies. They may even both be applied to one and the same empirical structure. Nevertheless, the kinds of representations (or models) they produce are substantially different. The qualitative strategy emphasizes the meaning of concepts, whereas the quantitative strategy emphasizes the respective topology. Consequently, there is no straightforward way to “translate” a qualitative model into a quantitative model. For example, using the abstract description of a type to inspire a collection of test items that are then scaled by a psychometric model, would not acknowledge the structural difference between qualitative and quantitative modeling approaches. Such a procedure would imply to abandon the typology in favor of a quantitative model, rather than to incorporate the strengths of both kinds of models.
As an alternative, we suggest to translate between qualitative and quantitative models by tracing them back to the empirical structures they are meant to represent. If an empirical structure allows for both, a qualitative and a quantitative representation, the common empirical grounding of the representations ensures that they can be combined in a joint representation where qualitative types are embedded in quantitative dimensions.
The key to integration in mixed methods research is thus to approach the data from a qualitative and a quantitative perspective simultaneously. Whereas the qualitative perspective emphasizes the similarity between members of one type and dissimilarity between members of different types, the quantitative structure emphasizes the gradual transitions between different values on a quantitative continuum. However, any sorting by similarity implicitly presumes that there must be something with respect to which the objects differ. And since objects can be more or less similar, this something has at least some properties of a quantitative dimension. On the other hand, whenever there are gradual transitions between objects on a quantitative continuum, it is possible to identify some objects that are more alike with respect to this dimension than others. Therefore, any quantitative dimension allows for grouping of objects by similarity.
It is easy to see the connection between qualitative and quantitative representations when objects only differ with respect to a single criterion. For example, in the context of developmental psychology, we may represent individual change over the life span by means developmental stages, as proposed by Piaget (1952). Although the concept of a developmental stage is clearly qualitative, it is inherently linked to the concept of cognitive ability, which is conceived as a quantitative continuum. Thus, although there may be qualitatively different developmental stages, these stages can be located on a quantitative dimension.
The connection between quality and quantity is somehow less obvious if the empirical structure is more complex. For example, a qualitative reconstruction of teachers’ beliefs will most certainly consider several criteria of similarity simultaneously. By definition, beliefs are complex conglomerates of attitudes, thoughts and behavioral dispositions. As a result, the dimensional structure that implicitly underlies a qualitative typology of teachers’ beliefs is obscured by the complexity of the field. A trained qualitative researcher may well identify relevant similarities and dissimilarities between the cases. However, it is difficult to construct an underlying quantitative structure from the typology alone.
The above analysis suggests that a special methodology is needed to identify implied quantitative dimensions underlying qualitative typologies. In the following sections, we shall provide such a methodology. Since our approach requires a profound understanding of both, qualitative and quantitative research strategies, we will first elaborate on the specifics of qualitative type formation [with an emphasis on reconstructing “pure types” as characterized by Weber (1904)] and of similarity-based quantitative models (particularly cluster analysis and linear discriminant analysis). We will then outline a general strategy for the embedding of qualitative types in quantitative dimensions.
3. Constructing qualitative types
As outlined above, qualitative research is mainly concerned with the construction of case-based models. Case-based models abstract from singular observations to construct a more general descriptive scheme for the objects under study. For example, if the objects under study are work teams, each team constitutes a singular case. However, each case may also be interpreted as a specific instance of a more general, abstract type, which is abductively constructed from qualitative categories that build on comparisons between and within cases. In general, the criteria for these comparisons are not known a priori, but emerge from an iterative process of constructing and revising categories (Peirce, 1998; Schurz, 2008).
There are various methodological approaches to the construction of abstract typologies from singular cases (Kluge, 2000). In this article, we focus on the documentary method, which analyses qualitative data with regard to the way how people talk about certain topics, rather than what they say. The rationale behind this shift of focus is the observation that sometimes people’s verbal statements seem to contradict their actions. For example, when asked about sustainable behavior, a person may state that the environment is extremely important to her. Nevertheless, she may still fail to implement her stated attitudes in her actions (e.g., taking a hot bath every day instead of a shower or traveling by plane rather than by train). The idea behind the documentary method is that any disparity between what people say and what people do will become manifest in the way people talk about a topic. These different modes of dealing with a topic in a conversation are then used to reconstruct general patterns of orientation (Bohnsack, 2010). For example, a person who reports a positive attitude toward sustainable behavior may deal with the topic by emphasizing the political dimension of sustainability and thereby downplay the role of the individual. A different mode of dealing with the topic would be to point toward other, supposedly more important or more urgent, problems such as poverty or war. Both modes point toward different patterns of orientation (“questioning responsibility” vs. “questioning relevance”), which both reveal that the stated positive attitudes most likely differ from actual behavior. The documentary method aims to identify such patterns of orientation to account for the often-observed mismatch between verbal statements and actual behavior and to infer what may be the true motivating forces of peoples’ behavior.
In general, the patterns of orientation in a specific context all deal with a common theme – the so-called tertium comparationis. In the documentary method, the tertium comparationis provides the interpretative framework for all consecutive analyses. Within this framework, the cases are interpreted as specific realizations of qualitatively different ways of dealing with the tertium comparationis, i.e., different patterns of orientation. For example, “questioning responsibility” and “questioning relevance” are two qualitatively different ways to deal with the common theme of “rationalization of unsustainable behavior.” The patterns of orientation are then further condensed into a collection of pure types, which together form a qualitative typology that intends to capture all cases within a common interpretative framework. A pure type is not just a descriptive category of what has been observed empirically. It is a theoretical abstraction that transcends the singular cases to form an idealized concept that is reflected in the singular cases but cannot be reduced to them (Weber, 1904). For example, in the context of sustainable behavior, pures type like the “ignorant hedonist” or the “cynical fatalist” may be characterized in such a way that they corresponds to only few (if any) actually observed cases, and yet capture an essential qualitative mode of dealing with the topic of sustainability.
The iterative process of between-cases and within-cases comparisons makes it possible to explicate the pure types in terms of the essential features by which they differ – the horizons of comparison that emerge together with the typology (Bohnsack, 2010). These horizons of comparison provide the means to distinguish between the individual cases with respect to the qualities captured by the typology. Like the tertium comparationis and the types themselves, the horizons of comparison are not known a priori but are the result of an iterative interpretative process of comparison. All types show different ways of dealing with the tertium comparationis. The horizons of comparison identify the essential properties by which the types differ. For example, the type “ignorant hedonist” may differ from the type “cynical fatalist” with respect to various horizons of comparison, such as the amount of self-efficacy or the amount of social orientation.
The documentary method builds on extensive comparisons within and between cases. These comparisons ensure that the theoretical constructions of the researcher are actually grounded in the empirical material, and that other researchers can retrace their interpretation of the data. However, due to theoretical samplings strategies (Glaser and Strauss, 1979), the documentary method only works with a small or intermediate number of cases, which in turn limits its empirical scope (Bohnsack, 2010). Furthermore, although the documentary method provides a highly systematic rationale for qualitative data analysis, it is not guaranteed that different researchers would arrive at the same results in a specific context. Working in research groups and validating the individually obtained interpretations and theoretical constructions against the critical view of the other members of the research group helps to deal with this problem. However, the results of a Documentary analysis will never be independent of the conducting researchers (i.e., objective).
The result of a qualitative analysis based on the documentary method is a theoretically rich typology consisting of an idealized description of the ways that individual cases deal with a certain theme. Since all theoretical concepts emerge from the data by means of constant empirical comparisons, the documentary method is especially useful as a method of theory construction from observations by means of inductive and abductive reasoning.
4. Constructing quantitative dimensions
Whereas qualitative research focuses on case-based models that abstract from singular observations to idealized typologies, quantitative research builds on variable-based models that emphasize the distances of case representations on the dimensions of geometric spaces. However, since any geometric space allows for the calculation of distances between arbitrarily positioned objects, it is always possible to compare objects with respect to their geometric representation and sort them based on their similarities or dissimilarities. In fact, there are various quantitative methods that start with the representation of objects in a geometric space to group them according to their distance with regard to this representation. These methods are subsumed under the label cluster analysis (Everitt, 1974). Cluster analysis provides a variety of algorithms to extract groups from the distances of objects in a geometric space. The groups are called clusters and are constructed such that objects within the same group are similar and objects that belong to different groups are dissimilar. The similarity or dissimilarity is measured by a distance-metric. A distance metric is a single number that is constructed from the relative positions of two points in a geometric space. Depending on the context, different distance metrics may be appropriate. For example, the distance between two trees on an open field may be measured by their Euclidean distance (i.e., the shortest straight line connecting the two trees). On the other hand, the distance between two houses in downtown Manhattan may be better captured by the city-block metric (i.e., the shortest path a car can take from one block to the other). In the context of quantitative social science, the objects that are compared with regard to their distances are usually individuals. For example, two individuals may be more similar to one another than a third one with regard to their answers on a numeric rating scale in a questionnaire. The squared differences between the individuals’ answers to all questionnaire items may then be used to calculate the Euclidean distance of these individuals in an abstract variable space that is spanned by the questionnaire items. Based on the distances between all cases, the individuals are then grouped into homogeneous clusters.
The results of a cluster analysis are actually very similar to the kind of representation produced by qualitative type formation. Nevertheless, the method of construction is completely different. Whereas the qualitative strategy explicates the criterion of similarity by means of extensive comparisons within and between cases, the quantitative strategy starts with a set of variables as the basis of a geometric space and constructs the clusters afterwards. In fact, the result of the analysis is completely determined by the chosen variables, the used distance metric, and the clustering algorithm. Consequently, there is no room for interpretation with regard to the meaning of the clusters or their essential properties. In other words, the dimensions of the geometric space used in cluster analysis are chosen before the analysis is performed and are thus not guaranteed to capture the essential properties by which the objects under study differ. Sometimes, the choice of variables is theoretically informed. In other cases, however, variables are chosen without an explicit theoretical frame of reference. Consequently, cluster analysis is less sensitive to new theoretical discoveries than comparative analysis, because the criteria of similarity are specified before the clusters are being constructed and may thus be arbitrary with regard to the essential properties of the clusters. Hence, in contrast to comparative analyses, cluster analysis does not produce pure types in the above sense. It may provide a collection of classes of objects that can be observed empirically, but are not necessarily theoretically meaningful.
Despite these apparent shortcomings, cluster analysis comes with some strong advantages. First, it is mathematically tractable, i.e., both, the clusters and the dimensions of the geometric space, are explicit mathematical objects. They can be precisely defined and communicated in an unambiguous way. Second, the automated algorithms used in cluster analysis ensure that the complete analysis is reproducible once the variables and the distance metric are given. Finally, it is possible to perform cluster analysis with an arbitrary number of objects and an arbitrary number of variables. Therefore, given a sufficient data basis, the results of cluster analysis more easily generalize to larger populations than the results of qualitative type formation.
5. Embedding typologies in geometric spaces
Given the strengths and weaknesses of the qualitative and quantitative approaches outlined above, it would be of great benefit to merge both strategies into an integrated research strategy. Such an integrated approach would aim to construct theoretically rich typologies alongside an explicit geometrical representation of their horizons of comparison as the dimensions of an abstract geometrical space. It is therefore important to not only perform both types of analysis separately, but to ensure that all analogous concepts are continuously translated and back-translated between the different methodological approaches.
In the following, we will outline how such an integrative strategy can be realized. We use techniques borrowed from qualitative reconstructive research such as comparative analyses and the construction of pure types, as well as quantitative modeling techniques like k-means clustering and linear discriminant analysis. The general rationale is to start with an exploratory strategy using a qualitative reconstructive approach, followed by modeling techniques that aim at finding a quantitative representation of the qualitatively discovered pure types that are embedded in a theoretically meaningful geometric space.
5.1. Construct theoretically meaningful types
The first step of our approach exploits qualitative reconstructive techniques of type formation. The aim at this stage is to generate a tentative typology that is both, theoretically rich and empirically grounded. The results do not yet provide a formal, let alone mathematical, description of the empirical structure under study. Nor are they intended to generalize to larger populations. The main purpose is to identify different qualia and to explore their essential features by comparing them with respect to different characteristics. The result should be a collection of pure types that can be distinguished by means of theoretically meaningful horizons of comparison.
The primary techniques used at this early stage of the research are comparative analyses. From a representational perspective, comparative analyses consist in identifying relevant empirical relations between the objects under study. Mathematically speaking, a relation is nothing but a subset of ordered tuples of objects. In the simplest case, the researchers will compare every case to each of the remaining cases and judge them to be either similar enough to be grouped together or not. More complex comparisons may include more than two cases at a time. For example, two cases may be similar to each other when compared to a third case, but not when compared to yet another case, because, in the context of additional cases, the criteria by which one compares the cases may change. It is also possible to judge cases as being similar with respect to one characteristic, but dissimilar with respect to another characteristic. Regardless of the specific comparison procedures, comparative analyses result in a more or less complex relational structure based on the judgments of the researchers.
Since the comparative judgments in a qualitative study are based on interpretative acts, rather than formalized procedures, the resulting structure is, to some degree, subjective. Nevertheless, it is of course possible to assess the degree of consensus between different researchers and adjust the judgments such that they are intelligible across individuals, as it is routinely done in qualitative interpretation groups. Furthermore, comparative analyses naturally imply that researchers reflect on the kind of comparisons they perform as they proceed to analyze the data. Thereby, theoretically fruitful comparisons are eventually identified whereas less useful comparisons are abandoned. This selective component of comparative analyses eventually leads to an abstract representation of the empirical structure by means of an emergent typology, with the types being idealized contrasts (pure types) with regard to theoretically meaningful characteristics (the horizons of comparison).
5.2. Specify initial set of variables
The second step of the analysis takes the pure types and the horizons of comparison as a starting point. The aim at this stage is to identify an initial set of variables that are potentially meaningful with respect to the theoretical typology constructed in the first step.
The main technique used in this step is to extract the most relevant and most specific characteristics of the pure types constructed in step one and to transform them into a questionnaire. For some characteristics, this may be straightforward. Other, more abstract ones, may require more attention. For example, an abstract concept like “relativism” is way too vague to include it in a questionnaire. Consequently, researchers have to partly de-construct the abstract characteristics of the pure types to arrive at a set of unambiguous characteristics that can be transformed into questionnaire items (e.g., “What is true for one person may be untrue for another person.”). Note that we are not dealing with some kind of latent variable here–“relativism” is not something unobserved underlying the concrete characteristics we want to include in the questionnaire. It is a theoretical abstraction that results directly from comparative analyses (Buntins et al., 2016). Therefore, the relation between the questionnaire items and the abstract construct is not one of cause and effect, as implied by latent variable models like classical test theory or item response theory. It is a logical relation that depends strictly on the way the researchers use the abstract theoretical vocabulary that emerged from comparative analyses (cf. Buntins et al., 2017; Borgstede, 2019; Leising and Borgstede, 2019; Borgstede and Eggert, 2022). Thus, we can only decide whether a question belongs in our questionnaire on theoretical grounds. Since we are interested in quantitative comparisons in the consecutive steps, it is reasonable to use some kind of numeric answer type (e.g., a Likert scale). However, note that the use of numerical scales does not necessarily imply psychological measurement of an unobserved variable (Michell, 1999).
For the same reasons, standard psychometric criteria like convergent and divergent validity or internal consistency are largely irrelevant with regard to the questionnaire resulting from the characterization of the pure types. In fact, the only relevant criterion for the questionnaire is that the translation between the abstract theoretical constructs from the qualitative analysis to concrete statements in everyday language is successful (cf. Buntins et al., 2017). Like the qualitative analysis itself, the construction of a questionnaire that is valid in this respect is subject to interpretation and thus requires a corrective in the form of critical discussion between researchers.
5.3. Ensure generalizability
Step three consists in assessing the theoretically derived characteristics from step one in a large sample using the questionnaire developed in step two. The aim at this stage is to ensure generalizability of the typology that was tentatively developed in step one.
The main issue to be addressed when distributing the questionnaire is the intended scope of the theory. Since our tentative typology was constructed using qualitative methods, its empirical grounding will most certainly be limited to a rather small number of cases. These cases are not a random sample but the result of a purposive sampling strategy called theoretical sampling. Theoretical sampling means that cases are not selected before the data analysis, but as the theory evolves. Such a strategy implies that data collection, data analysis and theory development are parallel processes that influence one another (Glaser and Strauss, 1979). The intended scope of the theory is thus just as much an emergent property of comparative analyses as the developed typology and the horizons of comparison. Consequently, before administering the questionnaire on a large scale, it is important to analyze the results of the qualitative analysis with regard to the cases that were sampled. Most importantly, one has to identify the common characteristics of the cases (as opposed to the previous step, which consisted in identifying the differences between cases). These characteristics serve as a first characterization of the population one wishes to describe. In a way, they provide the boundary conditions of the theory that is being developed.
Of course, there are many characteristics that are too general to be useful as boundary conditions. For example, the majority of human subjects have two legs, two eyes, a nose etc. Unless one of these characteristics is theoretically relevant (e.g., when the typology aims to describe various forms of discrimination against people with disabilities), they are rather uninformative and thus useless as boundary conditions. On the other hand, when the common characteristics of the cases are too specific, the resulting population may consist of very few cases, and may even be restricted to only those cases that have actually been sampled. Therefore, an intermediate level of abstraction is required to produce a workable best guess about the scope of the theory.
Based on these theoretical considerations, the target population for the questionnaire assessment can eventually be specified. Once the population is known, the best strategy is to adopt a random sampling strategy and to sample as many cases as possible. Note that a priori considerations about statistical power are not applicable, since we are still in an exploratory stage. Consequently, the aim of the questionnaire study is not to test statistical hypotheses, but to provide a representative data source for a quantitative embedding of the qualitative typology constructed earlier.
5.4. Formalize initial typology
We now enter the first stage of quantitative modeling. Step four consists in applying mathematical algorithms to the data obtained in the previous step that produce a geometric representation of the characteristics identified in step two alongside a set of empirically derived clusters. The aim of step four is to produce an initial quantitative approximation to the pure types constructed in step one.
As outlined in section 4, we propose to use statistical clustering methods to identify homogeneous groups of objects based on the variables constructed from the numerical answers to the questionnaire administered in step three. Since we already have a tentative theory in the form of pure types, we will use an algorithm that produces a pre-determined number of clusters. The corresponding method is called k-means cluster analysis (MacQueen, 1967).
The basic idea behind k-means clustering is that the variables assessed in the questionnaire are interpreted as the dimensions of an abstract geometric space. The notion of “space” is similar to the standard use of the word for the three-dimensional space we use to describe the position and movement of physical objects. However, an abstract space constructed from the numerical answers in a questionnaire can have an arbitrary number of dimensions, each for every question. Moreover, this abstract variable space does not correspond to a real physical object. It is barely more than a quantitative representation of an implicit distance structure. In other words, the abstract geometric space only serves the purpose of providing a distance metric between objects allocated in the space. This distance metric is then used to group objects according to their similarity, where “similar” means that the distance is small and “dissimilar” means that the distance is large.
The k-means clustering algorithm searches for a partition of the objects into the specified number of clusters such that the average deviation of the objects from the center of their assigned cluster is as small as possible. The standard algorithm starts with an arbitrary initial partition of objects into k clusters and calculates the mean values of the objects in each cluster (hence the name k-means clustering). The partition is then updated by re-assigning each object to the cluster that is closest with regard to the distance metric. After the re-assignment, the cluster means are re-calculated using the new members of the clusters. The procedure is repeated until the clusters do no longer change (Lloyd, 1982).
The result of this k-means cluster analysis is a mathematically unambiguous partitioning of the cases that were sampled in step three with regard to the characteristics identified in step two that were themselves derived from the pure types constructed in step one. We have thus a first quantitative approximation to the pure types that made up our tentative theory.
5.5. Formalize horizons of comparison
The steps one to four were concerned with a first translation between qualitative types and quantitative dimensions. However, the geometric space constructed in the previous steps is not yet a faithful formalization of the horizons of comparison that differentiate between the pure types. Neither are the clusters obtained in step four formal counterparts to the pure types themselves. Due to the data-driven approach of the k-means clustering algorithm, the clusters correspond to real types, rather than pure types. They do not abstract from the raw data on a theoretical level but rather average over the objects that belong to the same cluster. Therefore, in the last two steps of the analysis, the quantitative representation constructed so far will be transformed such that the clusters will be pure types (in the sense that prototypical characteristics are emphasized), and the corresponding geometric space is spanned by a set of abstract dimensions that differentiate maximally between these pure types.
The method employed at this stage is linear discriminant analysis (Klecka, 1980). Linear discriminant analysis is a statistical method that transforms one geometric space into another geometric space, such that the newly constructed dimensions differentiate maximally between groups of objects. In the simplest case, one starts with a collection of objects that are divided into two groups (say, group A and group B). Given a set of quantitative variables that describe the individual objects, the method now calculates a weighted sum over these variables to obtain a so-called discriminant variable. The weights in the summation are chosen such that members of group A have, on average, low values on the discriminant variable, and members of group B have, on average, high values on the discriminant variable. The weights are adjusted until the discriminant variable differentiates maximally between the two groups. Linear discriminant analysis can also be applied if the objects are divided into more than two groups. When the groups only differ along one continuum, the method will still only yield one discriminant variable. Else, the method will produce a set of several discriminant variables that form a multidimensional discriminant space.
When applied to the results of a cluster analysis, linear discriminant analysis yields an alternative, more abstract geometrical embedding for the clusters. To emphasize the differences between the clusters, the discriminant space is routinely projected onto a space of lower dimensionality (usually, two dimensions are sufficient). In contrast to the initial set of variables used to construct the clusters (which were merely a best guess about the relevant horizons of comparison), the discriminant space is constructed such that it provides the most parsimonious and efficient way to distinguish the clusters from one another. Therefore, the result of step five is a new geometric embedding for the clusters obtained in step four, that corresponds to a set of abstract horizons of comparison by which the clusters can be distinguished.
5.6. Formalize pure typology
The final step of the analysis consists in a formal method to construct pure types that are embedded in a quantitative geometric space consisting of a small set of maximally differentiating dimensions. The corresponding geometric space has already been constructed in the previous step. The aim of the last stage of analysis is to use this abstract geometric space to update the initial clusters constructed in step four.
The linear discriminant space captures the abstract dimensions that differentiate maximally between the initial clusters. To construct new, idealized, clusters (that correspond to the pure types tentatively proposed in step one) we apply a second k-means cluster analysis—only this time we use the discriminant variables (instead of the initial variables) to define the distance metric. Like before, we use the same number of clusters as in our initial typology. Since the discriminant variables are determined from the initial variables, which in turn were constructed from the description of the qualitative criteria of similarity in step two, both, the geometric space and the clusters constructed in this last step, are still grounded in the empirical structure we wish to describe. However, in contrast to a simple cluster analysis (that yielded real types), we now have clusters in a discriminant space.
Since the discriminant space captures the abstract characteristics by which the clusters differ, these new clusters are maximally different with respect to the initial grouping. In other words, those characteristics that strongly differentiate between clusters are weighed more strongly than those that differentiate poorly. Consequently, the updated clusters are idealizations of the original, empirically derived clusters. These idealized clusters capture the relevant horizons of comparison by emphasizing those aspects in the data that are specific to the clusters. Therefore, the idealized clusters correspond to pure types as characterized in section 3.
The result of the last step of analysis is a formal reconstruction of a tentative qualitative typology based on a large sample of cases. This formal reconstruction captures the implicit quantitative structure underlying the act of grouping objects by similarity, as well as the qualitative aspects of the empirical structure that is characterized by pure types.
6. Exemplary application: Teachers’ epistemological beliefs
In the previous section, we presented an integrated approach to embed qualitative pure types in a quantitative geometric space to form an overarching model of the underlying empirical structure. Our approach builds on a representational integration of qualitative and quantitative modeling strategies as outlined by Borgstede and Scholz (2021).
We outlined how qualitative typologies that emerge from comparative analyses can be interpreted as an attempt to construe abstract relational structures that are grounded in empirical observations. Building on this abstract conception of qualitative typologies, we proposed that the horizons of comparison from such a typology be translated into a collection of questionnaire items which are then used as an initial variable space for a k-means cluster analysis. Using linear discriminant analysis to construct an abstract geometric space of maximally discriminating dimensions, we then proposed to revise the initial cluster solution based on these abstract dimensions. This procedure yields a formal representation of pure types within a quantitative space consisting of abstract dimensions.
In this section, we will illustrate the feasibility of our method by means of an exemplary application. The application is concerned with the reconstruction of teachers’ epistemological beliefs and builds on a published qualitative reconstructive analysis (Rau, 2020, 2021). We will start with a brief review of the theoretical background of the study and the results of the qualitative type formation. The main part of the example focuses on the concrete procedure of formalizing the typology proposed in Rau (2020) using the integration approach outlined above. All statistical analyses were preformed using R version 4.0.3 (R Core Team, 2020) with the additional packages janitor (Firke, 2021), MASS (Venables and Ripley, 2002) and factoextra (Kassambara and Mundt, 2020).
6.1. Background
Rau (2020) conducted a qualitative reconstructive study using the documentary method (cf. section 3). The study examined epistemological beliefs of teachers who teach a humanities subject. The aim of the study was to describe how teachers generate knowledge about cultural artifacts in the classroom. The study focused on the following questions: (a) How do teachers deal with cultural artifacts such as poems or images in their teaching practices? (b) How do teachers interact with their students to flesh out the meanings of these cultural artifacts? The data were collected by group discussions (N = 19). Cases were selected according to interviewees’ characteristics (e.g., level of education, expert or novice in the teaching profession, subject studied) following a theoretical sampling strategy (Rau, 2020, 2021).
The documentary method works by abstracting findings and finding a common theme that is common to all cases: the tertium comparationis. The tertium comparationis identified in the study refers to the way that teachers justify their understanding of cultural artifacts and was thus coined justification. Systematic comparisons within and between cases revealed three basic ways of dealing with justification, each of which constitutes a pure type in the sense of Weber (1904). The three types were: (1) Contingency stops, (2) Orientation to application (3) Appreciation of pluralism. These three types comprise the basic constituents of teachers’ epistemological beliefs. They indicate how teachers’ epistemological beliefs may guide instructional action in the humanities and how justification of different meanings is ensured. Teachers of type 1 expect pupils to interpret cultural artifacts within their historical context of origin and to elaborate on authorial intention by choosing a deductive method. Pupils have to learn epochal knowledge and are not allowed to bring their own meanings for the cultural artifact into the discourse. Teachers of type 2 ask, what personal meaning cultural artifacts have for the individual pupils. The learners’ ability to articulate their personal meaning of the cultural artifact is a characteristic of justification for teachers. These teachers are eager to learn about different meanings that pupils give to the same cultural artifact. Teachers of type 3 choose different (theoretical) perspectives to look at cultural artifacts. For example, they may interpret cultural artifacts with a feminist reading. The empirical material shows that these teachers engage in a discursive classroom conversation with their pupils to agree on an interpretation of the cultural artifact. It is important to these teachers that the pupils adopt a critical attitude and learn to reflect on their own about the meaning of cultural artifacts. Justification is based on intersubjective validation between the teacher and the pupils.
The within-cases and between-cases comparisons that generated the tertium comparationis and the pure types also revealed the main characteristics by which the three types may be distinguished. These characteristics constitute the essential horizons of comparison by which the identified, abductively formed, qualia differ. These horizons of comparison were: (a) Genesis of meaning: Which epistemological approaches do teachers choose? (b) Certainty and limits of generated knowledge: What do teachers expect from justification? (c) Characteristics of the cultural artifacts: What are the ontological characteristics of cultural artifacts in the humanities? Do teachers perceive cultural artifacts as ambiguous and/or unambiguous? (d) Relating teachers to pupils: How do teachers include pupils in the genesis of meaning and knowledge? To what extent do teachers allow pupils to discuss their own attributions of meaning in class? (e) Aims of teaching in the humanities: What are the aims of teachers’ teaching in relation to epistemic learning of the pupils? The three pure types, as well as the five horizons of comparison are summarized in Table 1. The table also shows how the different types can be distinguished with respect to these horizons of comparison.
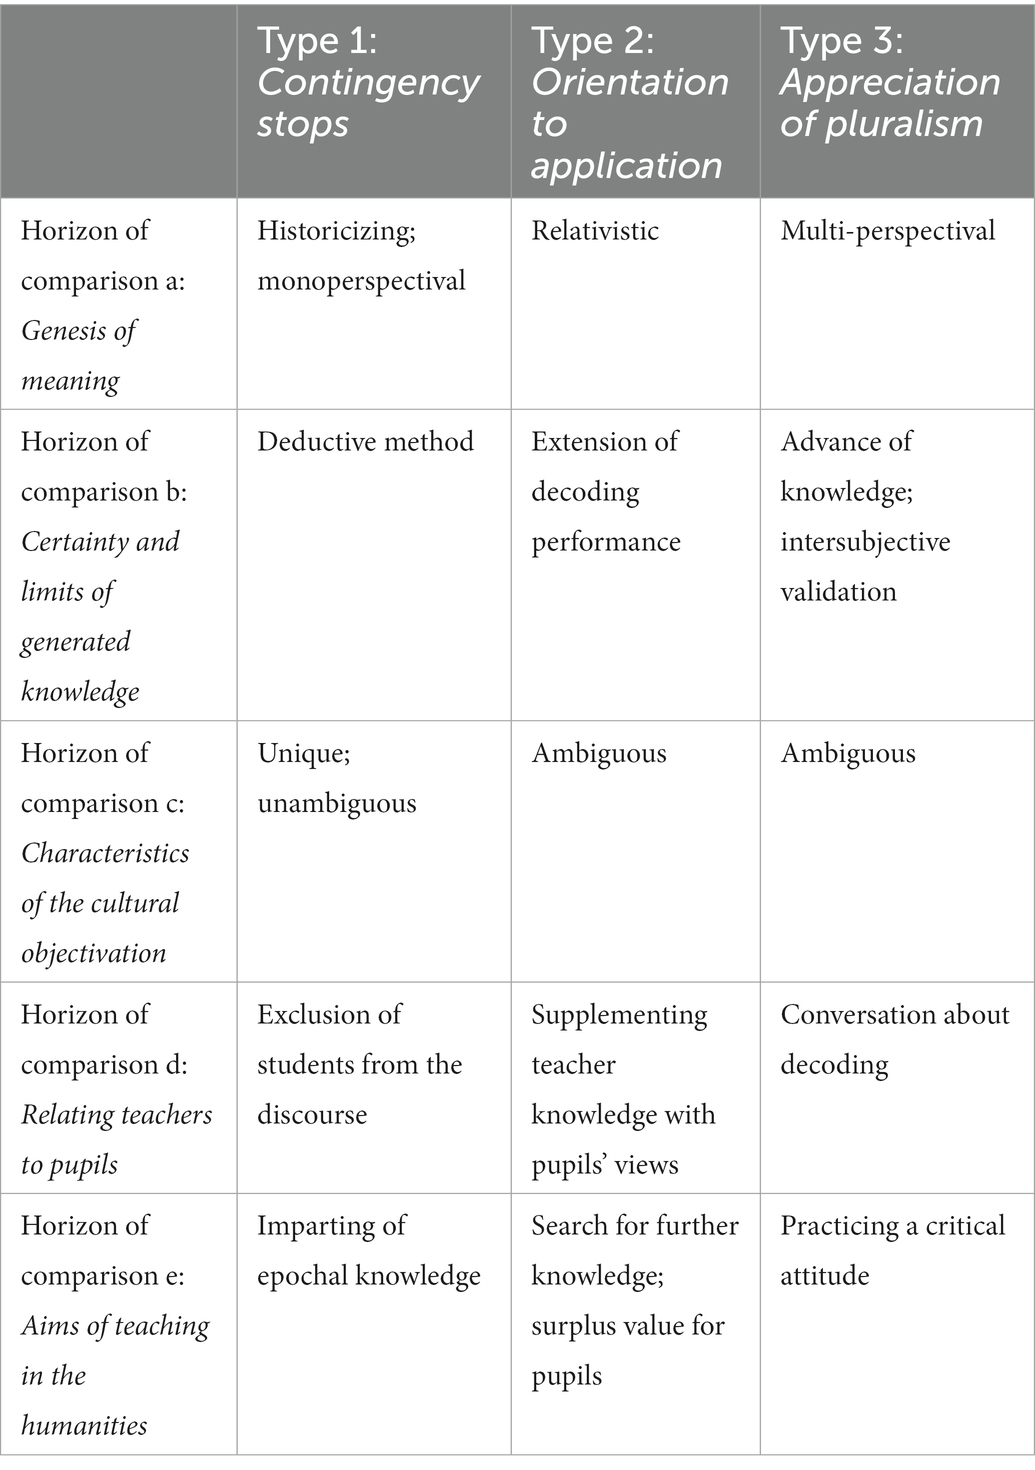
Table 1. Qualitative typology obtained from documentary method.
6.2. Data
The qualitative typology put forward in Rau (2020) was used to construct a questionnaire. The questionnaire contained 43 items that were formulated such that they capture the five horizons of comparison that differentiate between the three pure types. Since these horizons of comparison were formulated on a high level of abstraction in the original study, they were first concretized and translated into everyday language, such that respondents were able to understand them correctly. For example, the first pure type (“contingency stop”) can be characterized with respect to the first horizon of comparison (“genesis of meaning”) by the fact that teachers aim to convey the meaning that the originator (supposedly) ascribed to the cultural artifact to their students. The corresponding item generated to capture this aspect of the horizon of comparison was: “When pupils interpret pieces of music, literature or art, it is important that they carve out the author’s intention.” To ensure item comprehensibility and content validity, the initial item set was presented to two teachers in the field of humanities and two experts in the field of teachers’ epistemological beliefs. Critical feedback from these expert judgments was incorporated in a revised item set, which was then used for a first empirical study.
The sample consisted of 153 undergraduate students from a Bavarian University with a focus on teachers’ education and humanities. The students were recruited in university seminars and lectures. 83.1% of the respondents identified as female, 15.5% as male, and 1.4% as diverse. The median age of the participants was 19 years with an inter quartile range of 4 years. 13.3% of the sample reported a migration background. 54.9% of the participants were student teachers for primary schools, 22.5% were student teachers for vocational schools, 18.3% were student teachers for high schools, and 4.2% reported a different type of school. 19.6% of the students reported at least some kind of teaching experience, although most students (80.5%) were not teaching at the time of the study.
The statistical analyses followed the steps described in section 5. First, a k-means cluster analysis was conducted using the numerical answers to the questionnaire items as a variable space and the Euclidean distance as a distance metric. Since the qualitative analysis identified three pure types, a three-cluster model was fit to the data. All data were standardized within individuals before the analysis. Cases with missing values were excluded. The so-obtained clusters were then used as grouping variables in a linear discriminant analysis. Finally, a second k-means cluster analysis was conducted with the discriminant variables as a variable space.
6.3 Results and discussion
Figure 1 presents the results of the initial k-means cluster analysis that was conducted using the questionnaire items as a variable space. Since the actual variable space contains 43 dimensions (one for each questionnaire item), the data was projected into a two-dimensional space to enable a graphical depiction of the clusters. The two dimensions in the figure were chosen as a reference coordinate system such that they bind the maximum amount of variance in the data.3
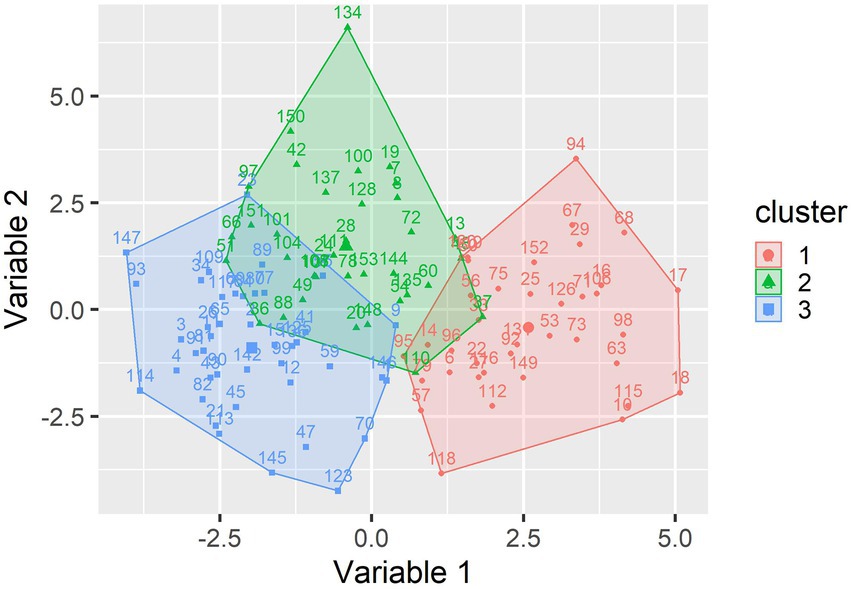
Figure 1. Initial cluster solution projected into two dimensions.
The three-cluster solution shows that there are two clusters (cluster 1 and cluster 3) that are completely separate. These two clusters show no systematic differences in the y-axis but are clearly distinct with regard to the x-axis. Cluster 2 takes an intermediate position on the x-axis and shows higher average values on the y-axis, indicating that it differs from the other two clusters with regard to a distinct dimension. However, cluster 2 has considerable overlap with the other two clusters, especially with cluster 3. Therefore, it remains open at this stage of analysis, whether it actually captures a different qualitative aspect of the data.
The three clusters from the original variable space were then used as grouping variables in a linear discriminant analysis. Two discriminant variables were constructed such that they are independent of one another and differentiate optimally between the three clusters. A second k-means cluster analysis with three clusters was conducted using the discriminant variables as a variable space (see Figure 2). Since the principle components coincide with the discriminant variables, the x- and y-axes of Figure 2 can now be interpreted as the two dimensions that differentiate maximally between the clusters and bind a maximal amount of overall variance of the data.
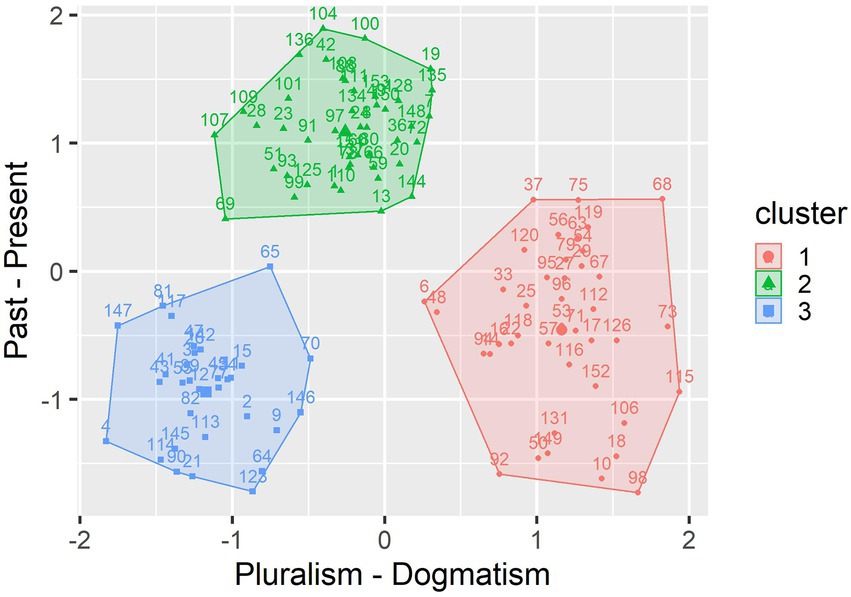
Figure 2. Idealized cluster solution obtained from linear discriminant variables.
Like in the initial cluster solution, clusters 1 and 3 differ mainly in one dimension, which is indicated by the x-axis in Figure 2. However, in contrast to the initial solution, cluster 1 now has a higher overall within-cluster variance than clusters 3 and 2, indicating that it is less homogeneous than the other two. Like before, cluster 2 takes an intermediate position on the x-axis and higher average values on the y-axis, indicating that it mainly differs from the other two clusters with regard to a different dimension.
In contrast to the initial solution, the updated clusters do no longer overlap. This is a direct result of the newly constructed variable space. Since the discriminant variables are specified such that they maximally differentiate between the clusters, existing differences between the original clusters are emphasized because those questionnaire items that differentiate more receive higher weights when calculating the linear discriminant variables (which are, in fact, just weighted sums of the original variables). The resulting clusters are thus idealizations of the original clusters. Just like the pure types in a qualitative typology, they are an abstract representation of the observed qualia rather than a purely descriptive summary as it is given by real types. Note that the data has not been changed to obtain this idealized cluster solution. The individual item answers are the same as before. The only difference to the initial solution is that the coordinate system has been changed by means of a linear transformation (i.e., a weighted summation), such that the coordinates differentiate maximally between the clusters. Thus, the qualitative differences that were only partly visible in the initial solution are revealed, alongside an abstract coordinate system that represents the primary axes by which the clusters differ.
The last step of the analysis aimed to identify the semantic content of the three idealized clusters. To get an impression about which questionnaire items contribute most to the two discriminant variables, the corresponding weighting factors were inspected. Comparing the items with the highest and lowest relative weights for each of the discriminant variables, it turned out that the first dimension (the x-axis in Figure 2) corresponds to the distinction between a pluralistic view (e.g., “Pupils should interpret pieces of music, literature or art from different perspectives.”) and a dogmatic view on the meaning of cultural artifacts (e.g., “It is important that pupils interpret pieces of music, literature or art in line with established views from the scientific community.”). The second dimension (y-axis in Figure 2) corresponds to the distinction between an orientation toward the past (e.g., “I usually incorporate a history-dependent view on scientific knowledge into my classes.”) and an orientation toward the present with regard to the meaning of cultural artifacts (e.g., “The current life-world of the pupils affects how they interpret pieces of music, literature or art.”).
In light of these results, we can contrast the three idealized clusters as follows. Cluster 1 and 3 primarily differ on the pluralism-dogmatism continuum, with cluster 3 leaning toward pluralism and cluster 1 toward dogmatism. Cluster 2 can be characterized as leaning toward pluralism, as well, although less than cluster 3. The main difference between clusters 2 and 3, however, is not the degree of pluralism but that cluster 2 is characterized by an orientation toward the present, whereas cluster 3 leans toward a past orientation. This tendency toward the present includes the current environment of the students and acknowledges the relevance of the students’ own experiences and perspectives on the meaning of music, art and literature.
These characterizations capture essentially the same qualia as the pure types from the original study. The fundamental horizons of comparison were also reproduced almost exactly as in the qualitative analysis. We can thus conclude that the qualitative pure types that were identified by means of comparative analyses can in fact be formalized as idealized clusters in a quantitative geometric space. The resulting representation converges nicely with the qualitative analysis, thereby sharpening the verbal descriptions within a mathematical model that builds on data from a larger sample. The model captures both, the qualitative and the quantitative aspects of teachers’ epistemological beliefs, because it builds on a methodologically well-founded integration of qualitative and quantitative research strategies within a representational framework.
7. Conclusion
This article dealt with the question how qualitative and quantitative research strategies can be integrated such that qualitative types and quantitative dimensions are represented within the same overarching model. We argued that a true integration can only be achieved if qualitative and quantitative modeling strategies are viewed in light of a common methodological framework. The representational approach put forward by Borgstede and Scholz (2021) provides such a methodological background. In this paper, we refined the representational approach and applied it to an empirical case study, thereby demonstrating how qualitative and quantitative methods can be merged to produce formal representations that capture both, qualitative and quantitative, aspects in the data and integrate them within a single model.
Our approach transcends the distinction between qualitative and quantitative research by providing a common conceptual framework. Within this framework, it is possible to translate between qualitative and quantitative modeling approaches and to facilitate the simultaneous discovery of both kinds of structures. For example, concepts like “pure types” generally have no meaning in quantitative research. However, from a representational perspective, pure types can be conceived as idealized clusters in an abstract geometric space. Similarly, the concept of a “distance metric” has no meaning in qualitative research. However, in light of the representational view, a distance metric is just a formalized version of the criterion of similarity or dissimilarity used to compare the objects under study.
In this article, we focused on the question how qualitative typologies can be embedded in a quantitative geometric space. However, our approach provides a far more general rationale for the construction of new research designs. The essential point is to realize that qualitative and quantitative models are just different kinds of abstract relational structures and that they both attempt to represent empirical relational structures. Following this rationale, qualitative comparisons within and between cases may be considered as the empirical basis for various quantitative scaling techniques. Similarly, quantitative representations may be exploited to extract qualitative distinctions within and between cases. For example, the similarity judgments of qualitative researchers may be used as primary data for the construction of an abstract feature space by means of multidimensional scaling (Borg et al., 1997). The abstract feature space can then be compared to the horizons of comparison derived from comparative analyses. Other applications might include psychometric models with qualitative components (like multi-group Rasch models or latent class analysis, cf. von Davier and Carstensen, 2007), the embedding of qualitative contingencies in an abstract variable space by means of correspondence analysis (Hirschfeld, 1935), or the application of mathematical algorithms to identify specific similarities between cases by means of formal concept analysis (Ganter and Wille, 1999).
The integration strategy outlined above requires profound knowledge of both, qualitative and quantitative, modeling techniques. In particular, the translation between different kinds of models depends on an abstract understanding of the empirical and theoretical structures involved in the analysis. Such an abstract understanding requires a level of formalization that is rarely achieved in empirical research, let alone in the context of theory building in educational science. Although formal approaches to empirical research and theory formation may be challenging and sometimes seem cumbersome, we think that they are worth the effort. Our research example shows how the results from qualitative and quantitative analyses to the same data may converge using our representational approach. Moreover, the study shows that the proposed strategy of integration enriches the theoretical scope of the quantitative model components and scrutinizes the semantic import of its qualitative aspects.
The representational approach emphasizes the similarities between qualitative and quantitative research strategies and provides a metatheoretical framework to identify relevant differences at the same time. We hope that this overarching perspective will not only find its way into mixed methods research, but also facilitate communication and foster mutual exchange between qualitative and quantitative researchers in general.
Data availability statement
The raw data supporting the conclusions of this article will be made available by the authors, without undue reservation.
Ethics statement
Ethical review and approval was not required for the study on human participants in accordance with the local legislation and institutional requirements. The patients/participants provided their written informed consent to participate in this study.
Author contributions
MB conceived the conceptual background, developed the methodology, conducted the statistical analyses, made the visualizations, and wrote the first draft of the manuscript. CR verified the conceptual background and collected the data. All authors contributed to the article and approved the submitted version.
Acknowledgments
We thank Jana Costa for her help with the formulation of the questionnaire items.
Conflict of interest
The authors declare that the research was conducted in the absence of any commercial or financial relationships that could be construed as a potential conflict of interest.
Publisher’s note
All claims expressed in this article are solely those of the authors and do not necessarily represent those of their affiliated organizations, or those of the publisher, the editors and the reviewers. Any product that may be evaluated in this article, or claim that may be made by its manufacturer, is not guaranteed or endorsed by the publisher.
Footnotes
1. ^Mathematically, cases and observations are two different kinds of objects that jointly form a relational structure.
2. ^In fact, there are many instances of so-called "quantitative" social science that just define variables ad hoc, i.e., without establishing an empirically grounded measurement model to begin with. See Michell (1999) for an in depth discussion of the problems arising from such pseudo-quantitative science.
3. ^Formally, these dimensions correspond to the first two variables obtained from a principle component analysis (cf. Pearson, 1901).
References
Bazeley, P. (2016). Mixed or merged? Integration as the real challenge for mixed methods. Qual. Res. Organ. Manage. 11, 189–194. doi: 10.1108/QROM-04-2016-1373
Bergman, M. M. (2011). The good, the bad, and the ugly in mixed methods research and design. J. Mixed Methods Res. 5, 271–275. doi: 10.1177/1558689811433236
Bohnsack, R. (2010). “Documentary method and group discussions” in Qualitative analysis and documentary method in international educational research. eds. R. Bohnsack, N. Pfaff, and W. Weller (Opladen: Barbara Budrich), 99–124.
Borg, I., and Groenen, P. J. F. (Eds.) (1997). “Springer series in statistics” in Modern multidimensional scaling: Theory and applications (Springer)
Borgstede, M. (2019). Zwischen Definition und Empirie. Vierteljahrsschrift Für Wissenschaftliche Pädagogik 95, 199–217. doi: 10.30965/25890581-09501018
Borgstede, M., and Eggert, F. (2022). Squaring the circle: from latent variables to theory-based measurement. Theory Psychol. 33. doi: 10.1177/09593543221127985
Borgstede, M., and Scholz, M. (2021). Quantitative and qualitative approaches to generalization and replication—A representationalist view. Front. Psychol. 12:605191. doi: 10.3389/fpsyg.2021.605191
Buntins, M., Buntins, K., and Eggert, F. (2016). Psychological tests from a (fuzzy-)logical point of view. Qual. Quant. 50, 2395–2416. doi: 10.1007/s11135-015-0268-z
Buntins, M., Buntins, K., and Eggert, F. (2017). Clarifying the concept of validity: from measurement to everyday language. Theory Psychol. 27, 703–710. doi: 10.1177/0959354317702256
Creswell, J. W. (2009). Research design: Qualitative, quantitative, and mixed methods approaches. Los Angeles: Sage.
Fetters, M. D., and Molina-Azorin, J. F. (2017). The journal of mixed methods research starts a new decade: the mixed methods research integration trilogy and its dimensions. J. Mixed Methods Res. 11, 291–307. doi: 10.1177/1558689817714066
Fielding, N. G. (2012). Triangulation and mixed methods designs. J. Mixed Methods Res. 6, 124–136. doi: 10.1177/1558689812437101
Firke, S. (2021). Janitor: Simple tools for examining and cleaning dirty data. Available at: https://CRAN.R-project.org/package=janitor
Freeman, M., deMarrais, K., Preissle, J., Roulston, K., and Pierre, E. A. (2007). Standards of evidence in qualitative research: an incitement to discourse. Educ. Res. 36, 25–32. doi: 10.3102/0013189X06298009
Glaser, B. G., and Strauss, A. L. (1979). The discovery of grounded theory: Strategies for qualitative research (10. Printing). New York: Aldine.
Hirschfeld, H. O. (1935). A connection between correlation and contingency. Math. Proc. Camb. Philos. Soc. 31, 520–524. doi: 10.1017/S0305004100013517
Kassambara, A., and Mundt, F. (2020). Factoextra: extract and visualize the results of multivariate data analyses. 1–84. Available at: https://CRAN.R-project.org/package=factoextra
Klecka, W. R. (1980). Discriminant analysis. Quantitative applications in the social sciences series, vol. 19. Thousand Oaks: Sage.
Kluge, S. (2000). Empirically grounded construction of types and typologies in qualitative social research. Forum qualitative Sozialforschung/forum: Qual. Soc. Res. 1:1. doi: 10.17169/fqs-1.1.1124
Krantz, D. H., Luce, D., Suppes, P., and Tversky, A. (1971). Foundations of measurement volume I: Additive and polynomial representations New York, London: Academic Press.
Leising, D., and Borgstede, M. (2019). “Hypothetical constructs” in Encyclopedia of personality and individual differences. eds. V. Zeigler-Hill and T. K. Shackelford (Cham: Springer International Publishing), 1–6.
Lloyd, S. (1982). Least squares quantization in PCM. IEEE Trans. Inf. Theory 28, 129–137. doi: 10.1109/TIT.1982.1056489
MacQueen, J. (1967). Some methods for classification and analysis of multivariate observations. In Proc. 5th Berkeley Symp. Math. Stat. Probab. Symposium conducted at the meeting of Univ. Calif.
Moran-Ellis, J., Alexander, V. D., Cronin, A., Dickinson, M., Fielding, J., Sleney, J., et al. (2006). Triangulation and integration: processes, claims and implications. Qual. Res. 6, 45–59. doi: 10.1177/1468794106058870
O'Cathain, A., Murphy, E., and Nicholl, J. (2010). Three techniques for integrating data in mixed methods studies. BMJ 341:c4587. doi: 10.1136/bmj.c4587
Pearson, K. (1901). On lines and planes of closest fit to systems of points in space. London Edinburgh Dublin Philos. Magazine J. Sci. 2, 559–572. doi: 10.1080/14786440109462720
Peirce, C. S. (1998). “The essential Peirce” in Selected philosophical writings. eds. N. Houser, et al., vol. 2 (Bloomington: Indiana Univ. Press), 1893–1913.
Piaget, J. (1952). The origins of intelligence in the child (
R Core Team. (2020). R: A language and environment for statistical computing. Available at: https://www.R-project.org/
Ragin, C. (1987). The comparative method: Moving beyond qualitative and quantitative strategies. Berkeley: University of California Press.
Rasch, G. (1960). Studies in mathematical psychology: I. probabilistic models for some intelligence and attainment tests. Copenhagen: Danmarks Paedagogiske Institut.
Rau, C. (2020). Kulturtradierung in geisteswissenschaftlichen Fächern. Eine rekonstruktive Studie zu epistemologischen Überzeugungen von Lehrkräften. Teaching culture in the humanities. A reconstructive study of teachers' epistemological beliefs. Bad Heilbrunn: Verlag Julius Klinkhardt.
Rau, C. (2021). Die Wissensgrundlagen des eigenen Fachs verstehen – empirische Befunde zu den epistemologischen Orientierungen von Lehrkräften geisteswissenschaftlicher Fächer. Z. Erzieh. 24, 91–112. doi: 10.1007/s11618-021-00992-y
Rihoux, B., and Ragin, C. (2009). Configurational comparative methods: Qualitative comparative analysis (QCA) and related techniques. Thousand Oaks: SAGE Publications, Inc.
Venables, W. N., and Ripley, B. D. (2002). Modern applied statistics with S (fourth). Springer. Available at: https://www.stats.ox.ac.uk/pub/MASS4/
von Davier, M., and Carstensen, C. H. (eds.) (2007). Multivariate and Mixture Distribution Rasch Models - Extensions and Applications. New York: Springer.
Weber, M. (1904). “Objectivity in social science and social policy” in The methodology of the social sciences. eds. E. A. Shils and H. A. Finch (New York: Free Press)
Keywords: qualitative and quantitative research, mixed methods, documentary method, discriminant analysis, cluster analysis, teachers’ epistemological beliefs
Citation: Borgstede M and Rau C (2023) Beyond quality and quantity: Representing empirical structures by embedded typologies. Front. Educ. 8:1087908. doi: 10.3389/feduc.2023.1087908
Edited by:
Antonio P. Gutierrez de Blume, Georgia Southern University, United StatesReviewed by:
Vahid Nimehchisalem, Putra Malaysia University, MalaysiaKathryn Holmes, Western Sydney University, Australia
Copyright © 2023 Borgstede and Rau. This is an open-access article distributed under the terms of the Creative Commons Attribution License (CC BY). The use, distribution or reproduction in other forums is permitted, provided the original author(s) and the copyright owner(s) are credited and that the original publication in this journal is cited, in accordance with accepted academic practice. No use, distribution or reproduction is permitted which does not comply with these terms.
*Correspondence: Matthias Borgstede,  bWF0dGhpYXMuYm9yZ3N0ZWRlQHVuaS1iYW1iZXJnLmRl