
94% of researchers rate our articles as excellent or good
Learn more about the work of our research integrity team to safeguard the quality of each article we publish.
Find out more
ORIGINAL RESEARCH article
Front. Educ., 17 April 2023
Sec. STEM Education
Volume 8 - 2023 | https://doi.org/10.3389/feduc.2023.1023499
This article is part of the Research TopicInnovations and Technologies in Science/STEM Education: Opportunities, Challenges and Sustainable PracticesView all 13 articles
 Lavaniya Gopabala Krishnan1
 Aliashim Albani2*
 Yogesswary Segar1
 Abdul Rahim Ridzuan3Mohd Khairi Ismail4Mohd Azlan Musa2
 Khemaalatha Gunaseelan5Tamil Selvan Subramaniam5
 Mohd Zamri Ibrahim2
Introduction: The purpose of this study is to evaluate students’ responses regarding the usefulness of a graphical user interface (GUI) tool in the context of their respective learning environments. The Energy Computator GUI (EC-GUI) helps to simplify the STEM student’s learning processes. The EC-GUI serves as a simulator that can assist in computing formulas, designing graphs, acting as a unit converter, and automatically deriving parameters.
Methodology Furthermore, a survey, which included closed and open questions, was carried out on a selection of students majoring in STEM subjects at Universiti Malaysia Terengganu (UMT) who were enrolled in the Renewable Energy course. A total of 54 respondents participated in the survey and 90.8% of them expressed satisfaction with the EC-GUI provided. The research involved using two distinct kinds of analysis: a parametric analysis, the paired sample t-test, and a non-parametric analysis, the Wilcoxon signed-rank test.
Results: The study findings indicated that the majority of the respondents felt that the difficulty level of the subjects did not change after using the EC-GUI. However, it helped to simplify the learning process for students in STEM fields. The p-value of the appropriate teaching aid tool was less than 0.05, indicating that the results were significant both before and after using the EC-GUI.
Conclusion: The study suggests that a similar GUI tool could be implemented in Malaysia’s teaching and learning processes as it is easy to build and use.
STEM is an acronym for four closely related fields of study: science, technology, engineering, and mathematics. STEM is a challenging subject and STEM courses are disliked by many students (John and Estonanto, 2017). STEM education has received much interest over the last decade (Honey et al., 2014; Alam et al., 2021). STEM education combines ideas that are often taught independently in different courses and focus on the ability to apply knowledge to actual issues. As a result, the world has need of additional STEM-literate individuals, experts, and leaders, and its significance cannot be overemphasized (Alam et al., 2021). Moreover, STEM also refers to all technologies that use mathematics and science (Albani and Ibrahim, 2019). Author explains that non-effective teaching and learning processes encountered by students in the classroom might be one of the factors for the drop in interest in STEM courses.
The integration of Information, Communication, and Technology (ICT) can support educators in meeting the necessity of replacing conventional teaching approaches with technology-based teaching and learning resources and infrastructures (Ghavifekr and Rosdy, 2015). Technology is an essential topic in many sectors, including education, in the twenty-first century, as technology has become the preferred method of information transfer in most countries. Technology-based teaching and learning may bring about numerous improvements in the classroom, but good planning and policy development are required (Ghavifekr and Rosdy, 2015).
Assessment is a key component of the teaching and learning process because it gathers, interprets, and analyses student progress data. The effectiveness of assessment techniques in the classroom determines the quality of learning. The difficulties in the education system require the development and execution of ideas of teaching, learning, and assessment (TLA) methods that consider both rational thoughts of knowledge and practical implementations while also decreasing the time needed to perform the TLA cycle (Albani and Ibrahim, 2019). An extremely imaginative and unique strategy is essential to ensure students comprehend the knowledge shared during lectures (Hussin et al., 2017). An approach involving immersive online and offline materials can increase students’ inspiration toward understanding advanced courses, allowing them to acquire high grades (Hussin et al., 2017).
A graphical user interface (GUI) is a graphical representation of one or more windows containing commands or features that enable users to execute activities effectively. The simulator defines as a type of user interface in which people interact with digital equipment using graphical icons and visual indications (Nass et al., 2021). This visual system design is not intended to replace traditional programming but rather to convert pictorial presentations into structural lists, after which researchers generate a GUI that represents as a communication interface throughout which users can interact with the computer graphically (Kholil and Wahyudin, 2018). A GUI can also be defined as an application demonstrating menu options, icons, navigation, and other tools that replace command prompts or shell commands (Kholil and Wahyudin, 2018). Moreover, the study focuses on the development of the Energy Computator GUI., or EC-GUI, a teaching aid tool to address a renewable energy technology and energy management challenge. The study seeks to present the notion of a check and balance approach (CBA) in teaching, learning, and evaluation processes. The designed EC-GUI tool is forecast to expand the teaching quality, learning, and evaluation of comprehending both the computation algorithms and theories.
The major contribution of the study is to enhance the importance of using better teaching aid tools for difficult subjects, such as in STEM studies. STEM subjects are unpopular among high school graduates, and most of the students deny entry to STEMs due to complex subjects and also a less proper ways to identify the terms and equation. This study aims to help boost students’ motivation to work smarter by using the GUI interface to accumulate such terms and equations. The EC-GUI is designed to be intuitive and simple to use, making it ideal for use in educational settings. The application, along with other ways of solving difficulties, will help to improve high school students’ ability to study STEM subjects.
The research focuses on students’ feedback toward the teaching aid tool and the efficiency of the learning process using the EC-GUI. The study objectives are: (1) to develop a TLA aid tool for the course of Renewable Energy Technology and Energy Management, and (2) to analyze the impact of the developed teaching aid tool in the learning process. The study was done with a closed- and open-ended survey evaluation. It was carried out with a limited sample of enrolled students from the Renewable Energy Technology and Energy Management course. The selected candidates were STEM students from Universiti Malaysia Terengganu (UMT). The analysis of the study focused on parametric and non-parametric methods. The parametric method used the paired sample t-test, and the non-parametric used the Wilcoxon signed-rank test. The total number of respondents were 54 students who were enrolled in the Renewable Energy course. The outcome of the study parameters were significant. The difficulty of the course was kept the same or constant, but the teaching aid tool helped to simplify the lectures. The students were pleased with the teaching aid tool, and the p-value of the test was less than 0.05 both before and after. The parametric and non-parametric test were validated, reliable, and significant regarding the sample collected. The results proved that the hypothesis of the study was achieved in the creation of the EC-GUI teaching aid tool for STEM students and the subject of Renewable Energy Technology and Energy Management.
The MATLAB-based learning aid tool was developed for the purpose of enhancing students’ comprehension in order to improve their ability to solve a specific energy-related design problem. A graphical user interface, also known as a GUI, is an interactive display consisting of one or more windows and various controls and components that allow users to complete tasks interactively. The developed interface, which can be seen presented in Figure 1, is made up of a number of different components that are utilized in the process of carrying out a simulation. These components can take many forms, such as menus, buttons, tables, and axes. The EC-GUI tool was developed with the intention of being able to solve design problems in the following fields (as shown in Figure 2): (i) Renewable Energy Technology; (ii) Energy Management; and (iii) Energy and Climate Change. The user of the tool, who may be a student or a teacher, operates the tool and manipulates the control element in order to carry out an act of simulation. The linear and non-linear equation solvers provided in the MATLAB optimization toolbox function are used for any computation that needs an iterative process to solve. This function is adopted by the MATLAB optimization toolbox. The result is produced at the conclusion of the simulation process, and it is presented both numerically and graphically.
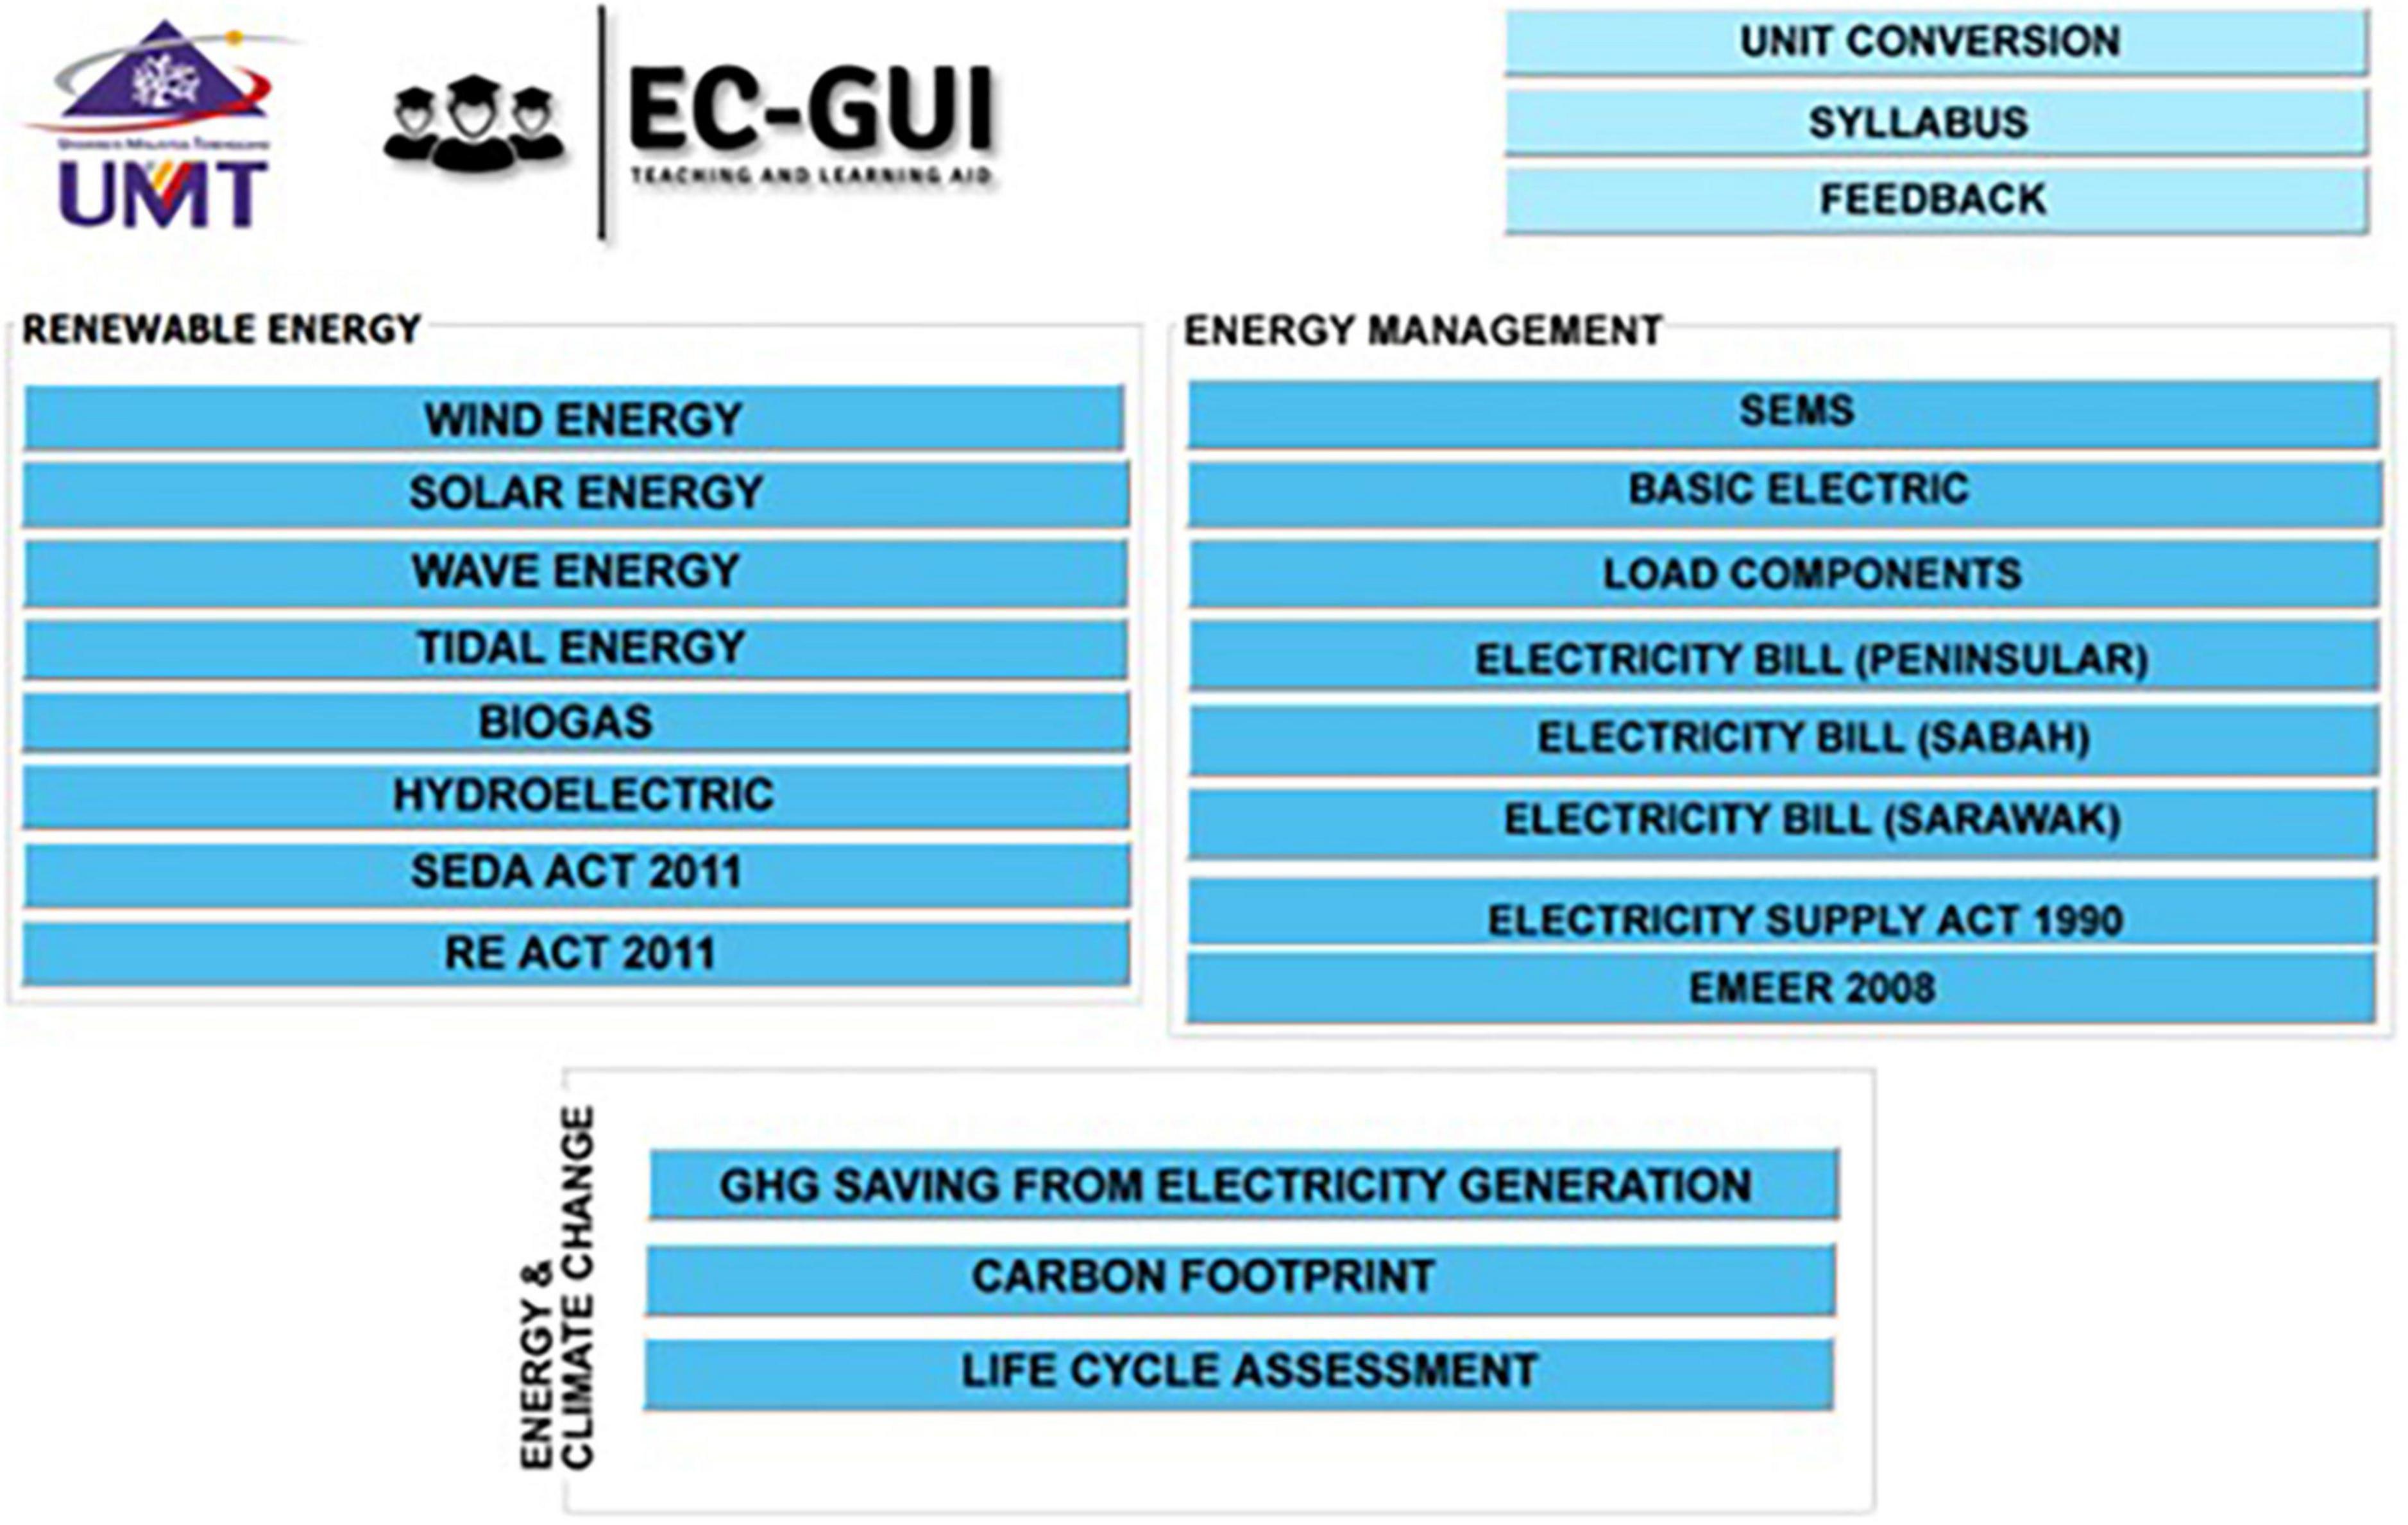
Figure 1. The main screen of the graphical user interface (GUI) panel.
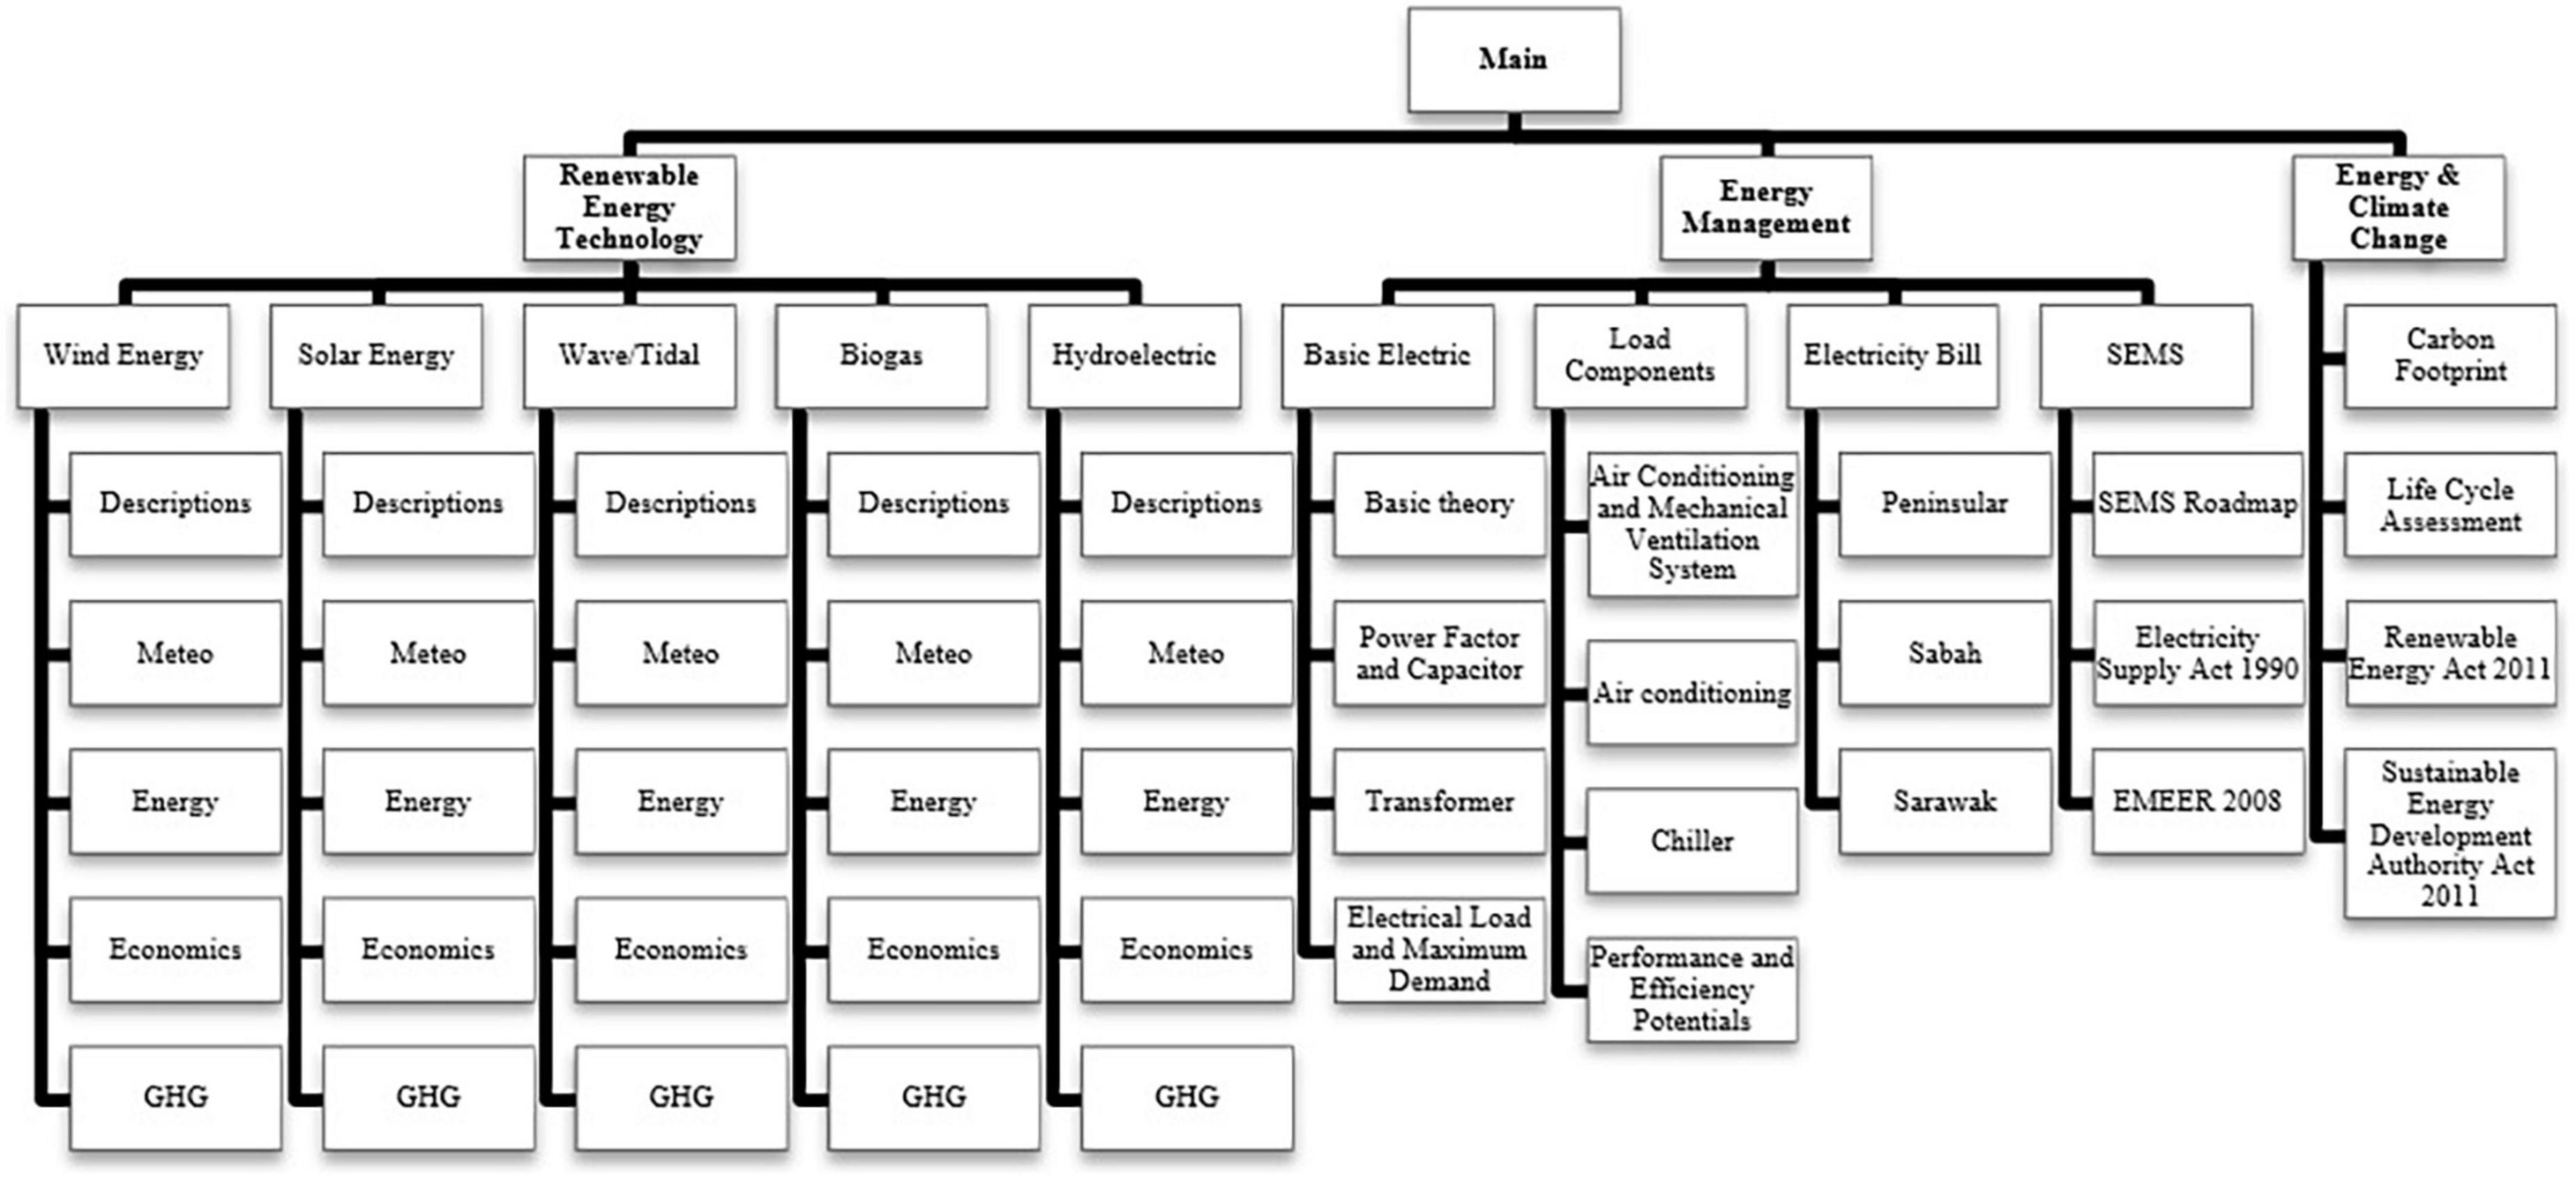
Figure 2. The GUI tool map.
The designed EC-GUI interface is an interactive application that allows users to be fully involved in a simulation and discovery learning. Overall, a check and balance approach (CBA) was designed to shorten and simplify the TLA procedure. According to the Oxford English Dictionary (OED), the word “check” is defined as the process of examining something to see if it is safe, correct, and acceptable (Stevenson, 2010); the word “balance” is defined as maintaining things in equal, correct, and the right proportions, also according to the OED (Stevenson, 2010). As a result, the terms check and balance combined were added to the TLA approach, in which both the educator and student participate to comprehend the underlying ideas and properly solve any graphical interface design issues (Albani and Ibrahim, 2019). Figure 3 below explains the flow of the CBA within the TLA approach.
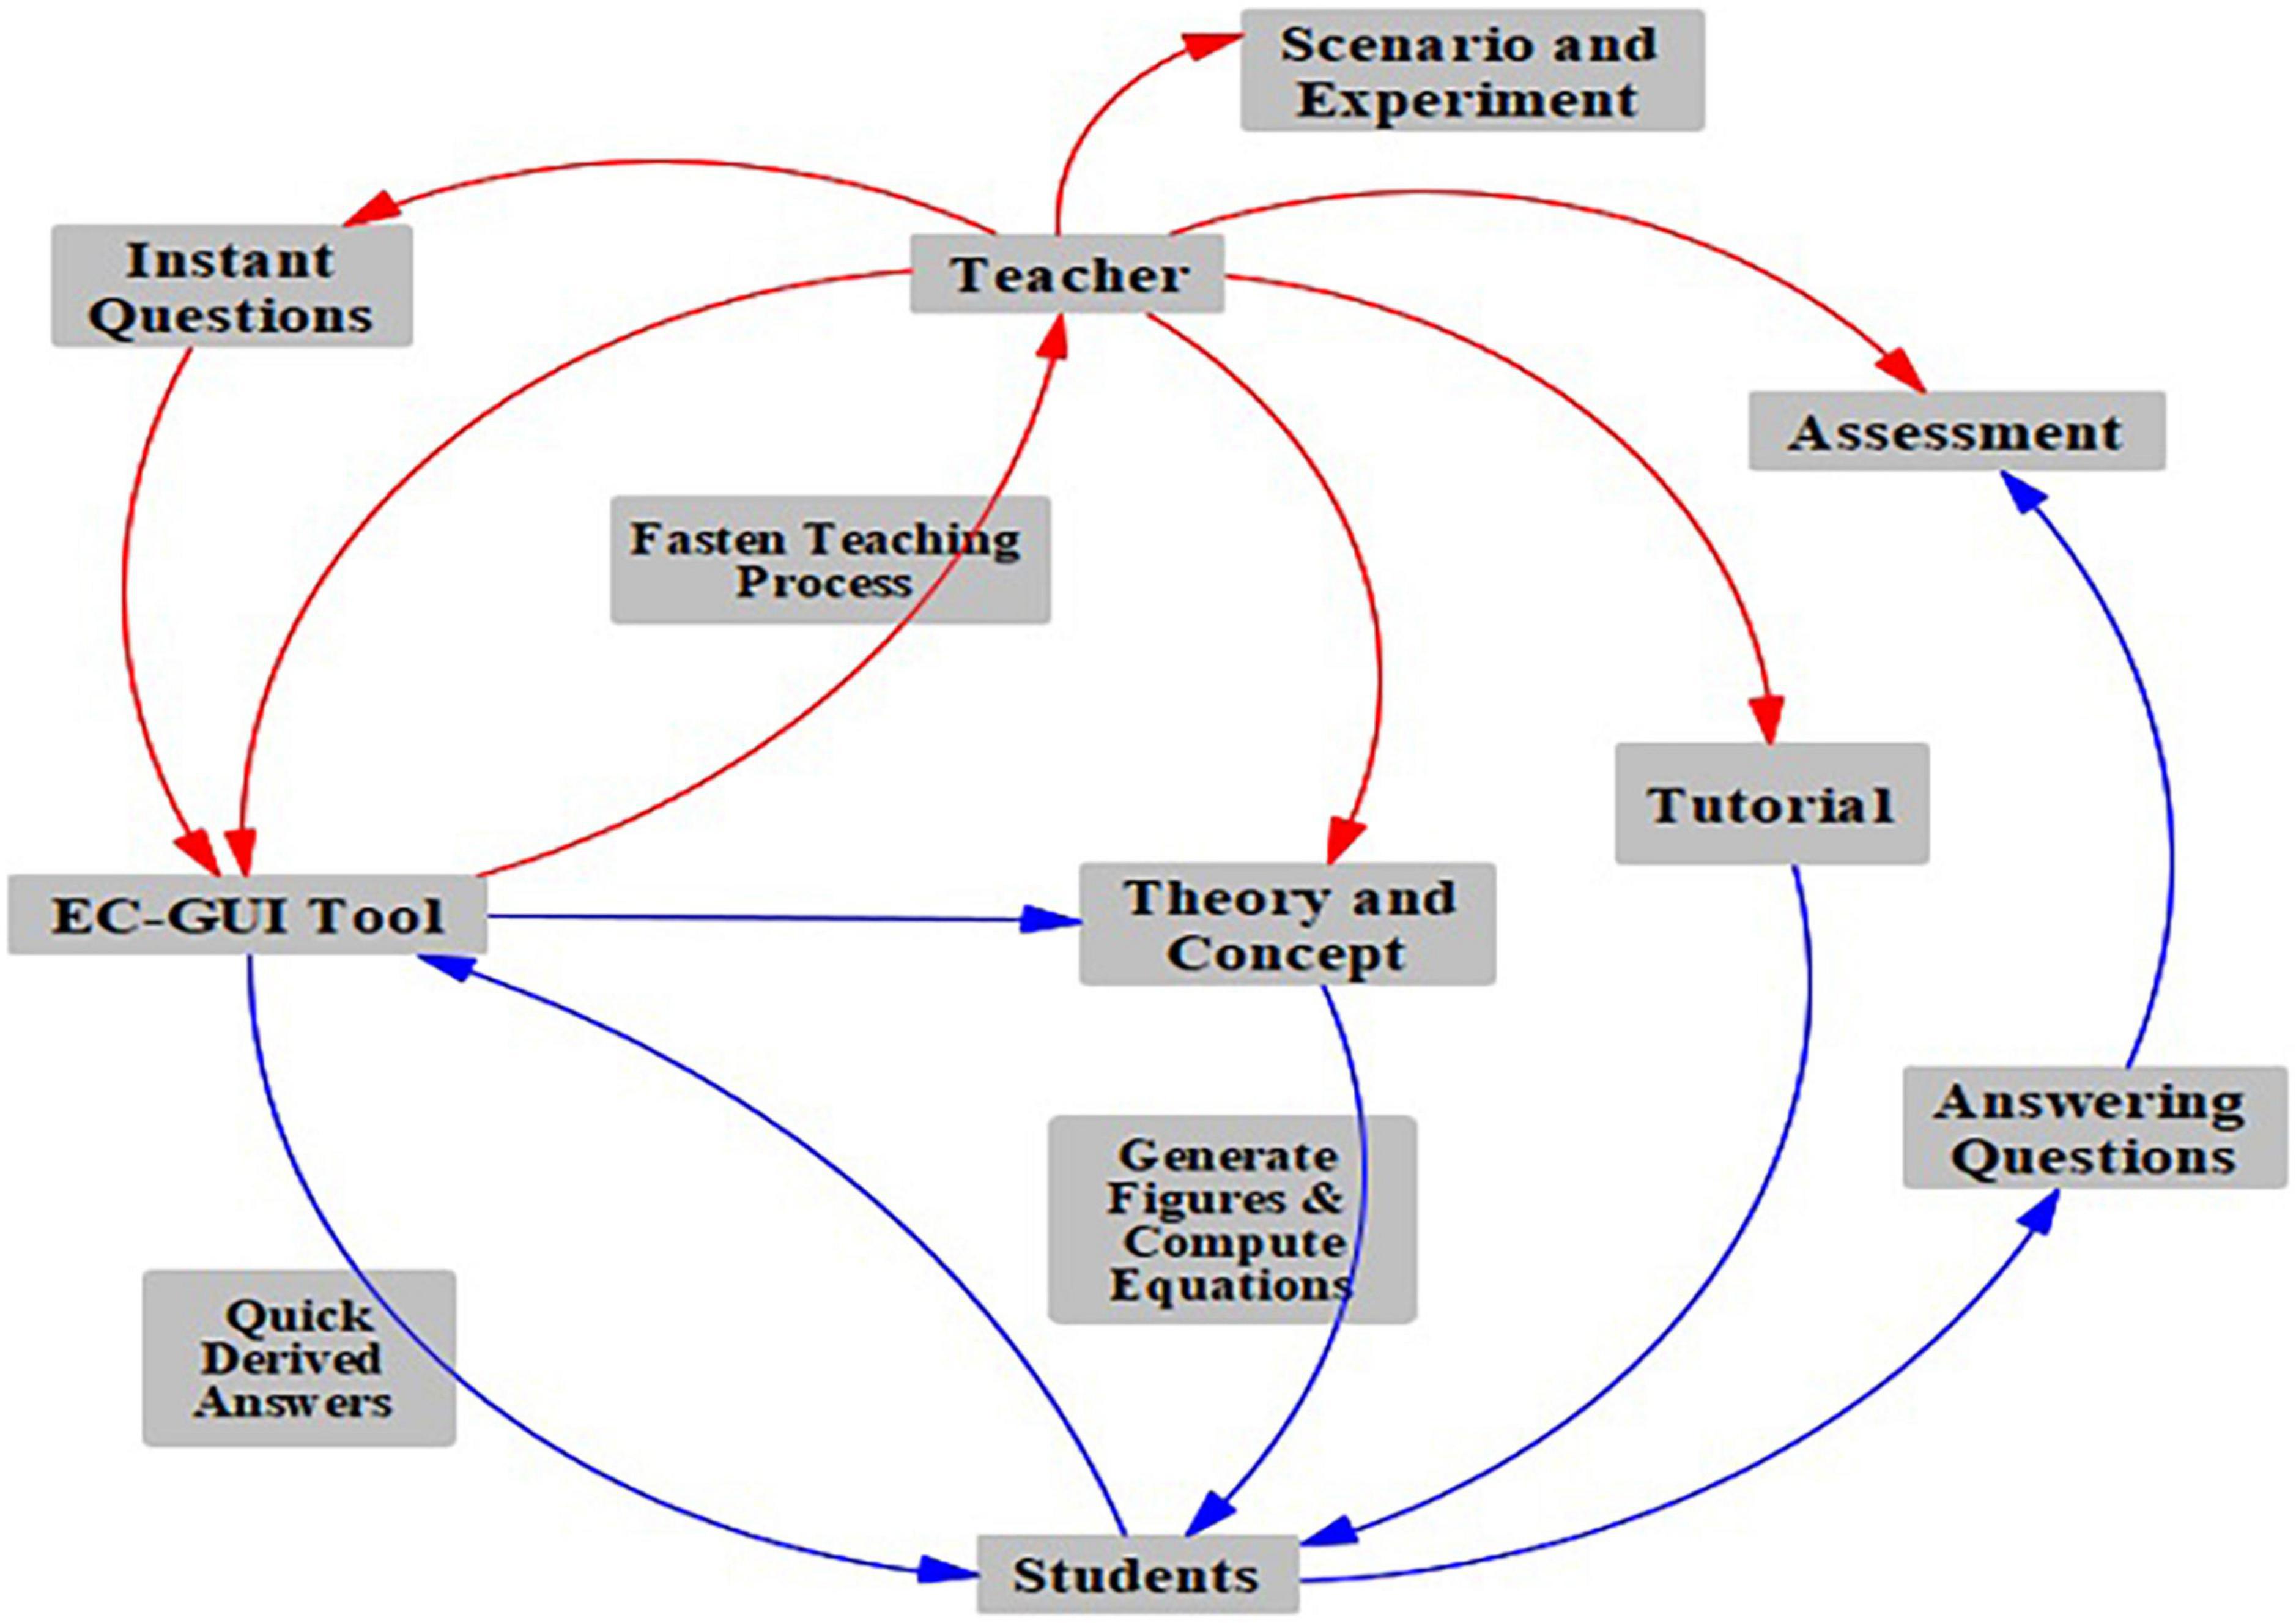
Figure 3. The check and balance approach.
There are three key components in the CBA approach: (1) the graphical interface tool (EC-GUI), (2) the teaching, learning, and assessment (TLA) process, and (3) the users (teacher/instructor or students). For instructors, the EC-GUI might be utilized as a teaching tool for Renewable Energy and Energy Management course concepts and theories, as well as for tutorial class teaching. Furthermore, the teacher can use the EC-GUI as a calculator to speed up the evaluation of students’ assignments and exams. Similarly, for students, the EC-GUI can be used as a learning tool for course ideas and theories, as well as for calculations in tutorial classes. Students can even use it as a calculator to ensure the accuracy of their answers when completing assignments or self-learning.
The EC-GUI application tool has advantages with a CBA in the TLA process: by using iterative calculations and sensitivity analysis, the tool will improve the comprehension of the Renewable Energy Technology and Energy Management subject’s notions or theories. The EC-GUI application also lets students monitor performance by comparing iterated outcomes in various ways. Therefore, students can improve their understanding of Energy Management and Renewable Energy Technology more efficiently by using this technology and also assess the impact of various Energy subject unit operations. In essence, when the tool is applied in the TLA process, there is a double-feedback process, enabling the user to examine the multiple design capabilities of the EC-GUI unit process.
After evaluating the global results of the unit process performance, the users may draw numerous assumptions, after which the users can adjust the parameters and repeat the simulation. This repeated process improves students’ understanding of the EC-GUI design and operation. Furthermore, the designed technology enables students to double-check their work while self-learning and finishing projects. Students will benefit from the GUI tool’s self-discovery capability, including in understanding and addressing their unique problems during learning process. Also, the proposed tool assists in reducing the time required to finish the TLA procedure, particularly during short semesters.
The close-ended survey was conducted among the STEM students enrolled in the Renewable Energy Technology and Energy Management course. The total number of respondents was 54 students. The questionnaire was distributed to the 54 students and consisted of multiple sections. The questionnaire was split into two elements: preliminary action and the final action of the research, which meant there will be two different questionnaires with the same questions and sections. The questionnaires were conducted before using the EC-GUI tool, and then the following questionnaires were conducted after utilizing the EC-GUI tool. This was to help identify the efficiency of the tool. The survey consisted of four parts: (1) Common section: Demographics, (2) Part A: Level of difficulties for energy subjects, (3) Part B: Relationship of student interests with props, and (4) Part C: Characteristics of appropriate props. The questionnaire consisted of 30 questions. The demographic part of the survey was analyzed using descriptive analysis. Part 2 and part 3 were analyzed using both parametric and non-parametric analysis, which helped to compare the pre- and post-study results of the survey. Likert scales were used in all of the questions to assist analysis of every parameter. Further explanation regarding the analyses used are listed below with precise descriptions.
The Likert scale is a psychometric measure widely used during survey research. The Likert scale has been utilized in all the sections of the questionnaire. Table 1 explains the levels of the scales used.
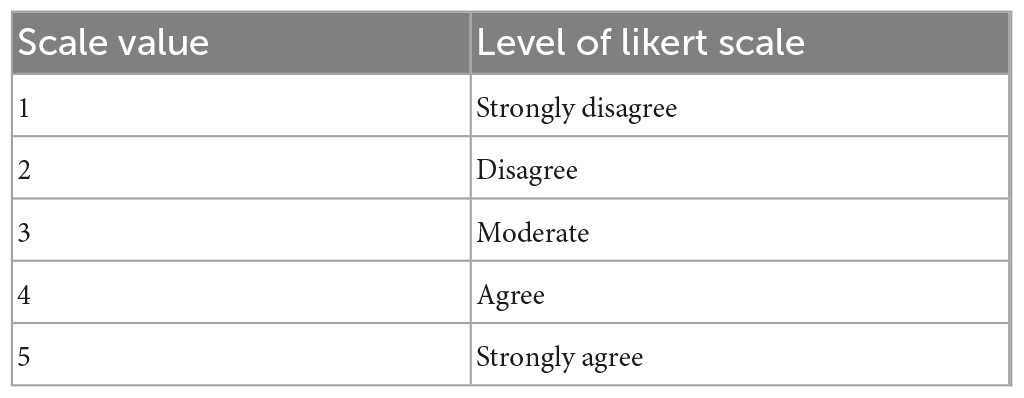
Table 1. Five point likert scale.
Parametric analysis is a statistical analysis in which a test establishes certain requirements regarding the form of distribution of parameters or populations, such as whether the data are interval-scaled and normally distributed (Yosani, 2006). The term “parametric analysis” refers to statistical procedures that are predicated on the premise that the distribution of population data is normal (Nawangsari, 2017).
This study focused on the paired t-test in regard to the interval scales of the data. The paired sample t-test was used to examine whether the mean difference of the data should be adjusted before performing parametric tests (Khosravi et al., 2018). As a result, the authors conducted a descriptive study before doing the t-test. When there was only one group of people and we needed to gather data from them about two distinct times, we used the paired sample t-test, and if the sig(2-tailed) value was less than 0.5, there was a significant difference between the two scores (Khosravi et al., 2018).
The paired sample t-test, also known as the dependent sample t-test, is a statistical process for determining if the mean difference between two groups of data is zero. Each subject or object is measured twice in a paired sample t-test, resulting in pairs of observations. Studies and repeated-measures techniques are two common uses of the paired sample t-test. The below equation represents the paired t-test (Boyd, 2020).
Non-parametric analysis is used for data that are devoid of distribution (Teguh, 2014); non-parametric analysis is statistical analysis that does not specify normally distributed data conditions (Yosani, 2006). Non-parametric statistics use statistical approaches that do not assume that population parameter distribution is normal (Nawangsari, 2017).
Like the related t-test, the Wilcoxon test can be used as a non-specific test of the empirical hypothesis, ‘the empirical measure differs in the two samples’, or as a particular test of an empirical shift hypothesis (Kornbrot, 1990). The Wilcoxon is “appropriate” in circumstances with non-normally distributed interval measures because it has the highest asymptotic relative efficiency for exploiting the information provided in the sample ranks (Kornbrot, 1990).
The non-parametric form of the paired samples t-test is the Wilcoxon signed-rank test. When the distribution of the differences between the two samples cannot be assumed to be normal, it is used to determine whether there is a significant difference between two population means. The test’s purpose is to assess if two or more sets of pairings differ from one another in a statistically meaningful way. Equation 2 below shows the formula of Wilcoxon signed-rank test (MacFarland and Yates, 2016).
Section “5.1. Demographic information of the respondents” emphasizes the demographic profiles of the respondents. The respondents of the study were students at UMT. Figure 4 summarizes the overall findings as well as the demographic information of the respondents. The demographics profiles contain the respondents’ program of study, year of study, ethnicity, and cumulative grade point average (CGPA). The results indicated that most of the respondents (57.4%) were from the Bachelor of Technology (Environment) program and in their third year of study (66.7%). Regarding ethnicity, as can be seen in Figure 4, the majority of respondents identified as Malay, with all other ethnicities reported, such as Indian, only accounting for 1.9% combined. The lowest number of students whom performed in the survey is others category which is Bumiputera Sarawak. Moreover, Figure 4 shows the CGPA of the students specifically in ranges. The highest number of students were categorized in the 3.01 to 3.49 CGPA range and the lowest were in the range of less than 3.00 CGPA. The demographic sections contributed the details of the respondents clearly in a few questions. For further details, see Figure 4.
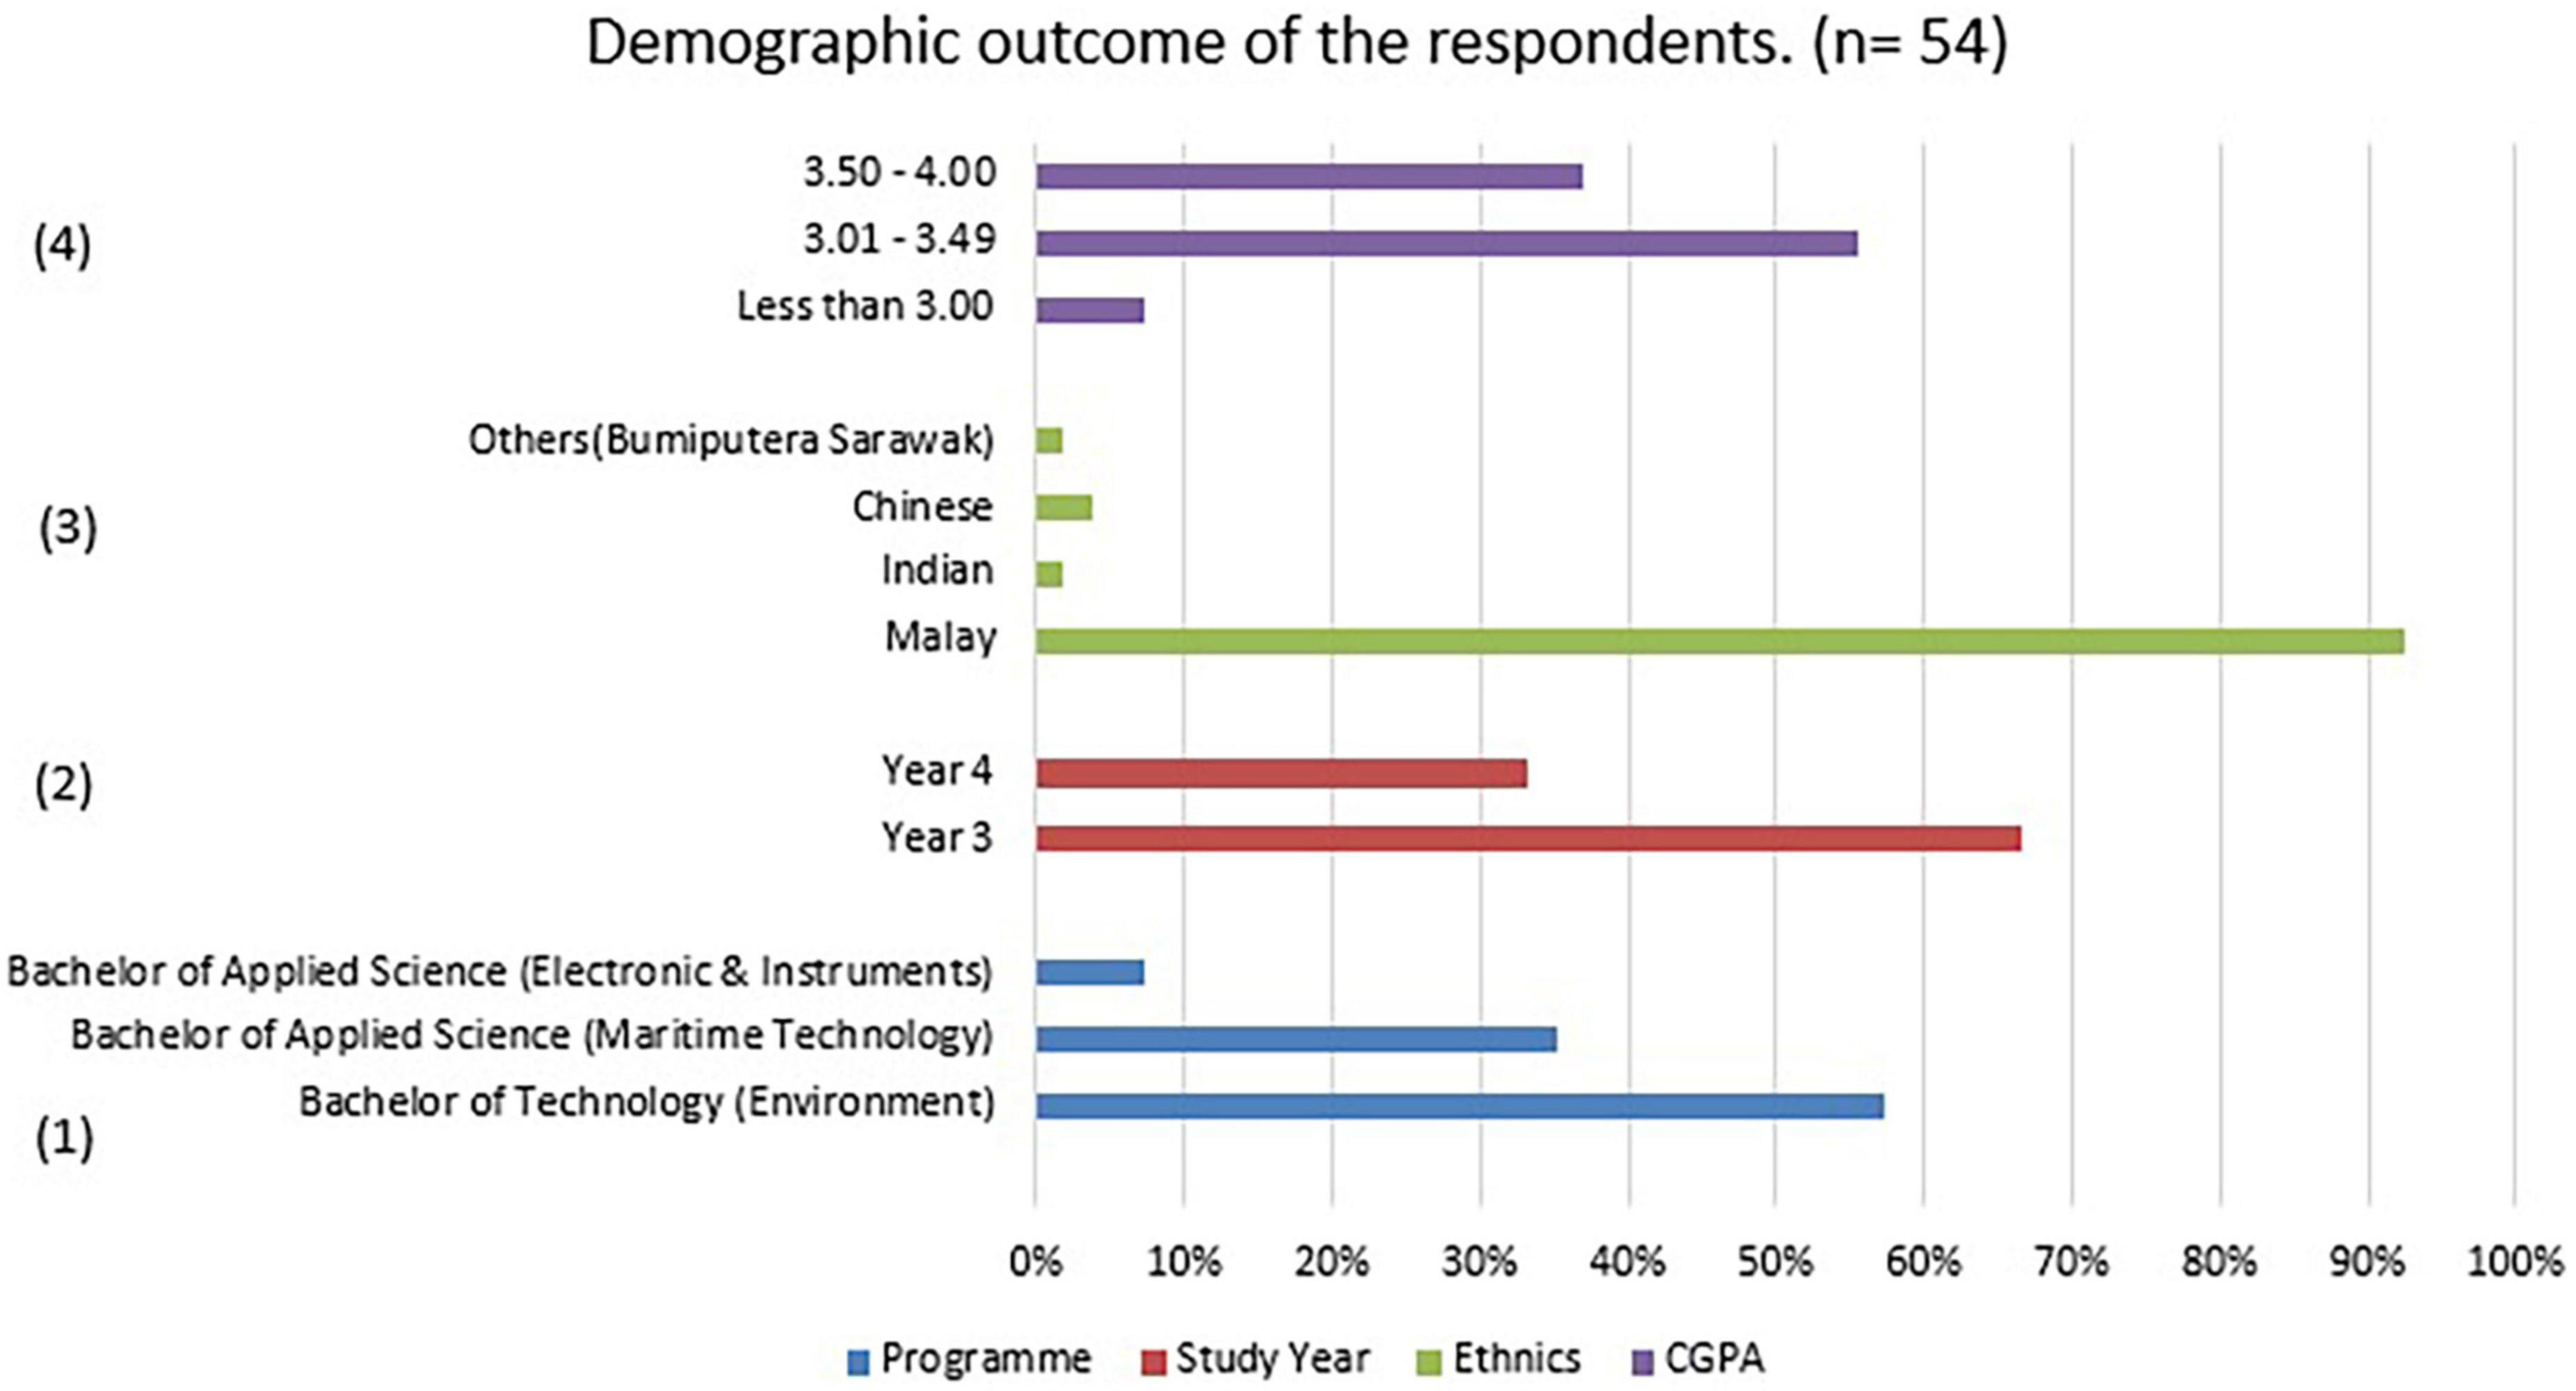
Figure 4. The demographic result of the user (respondents) of teaching aid tool.
In the case that the normality assumption was not satisfied, we used the Wilcoxon signed-rank test to perform the comparison on the medians. In SPSS, we used Analyze, then Non-parametric tests, then Two related samples: Tables 2–4 show the SPSS output. A p-value < 0.05 was considered significant for all statistical tests conducted. The Z reported in Tables 2–4 is the test statistic for the non-parametric Wilcoxon signed-rank tests. It is a statistic that is used in hypothesis testing for the non-parametric Wilcoxon signed-rank test and is the sum of the signed ranks. This test was conducted on: the levels of difficulties for energy subjects (Part A), the relationship of students’ interest with props (Part B), and the characteristics of appropriate props (Part C), which were all taken from the survey data.
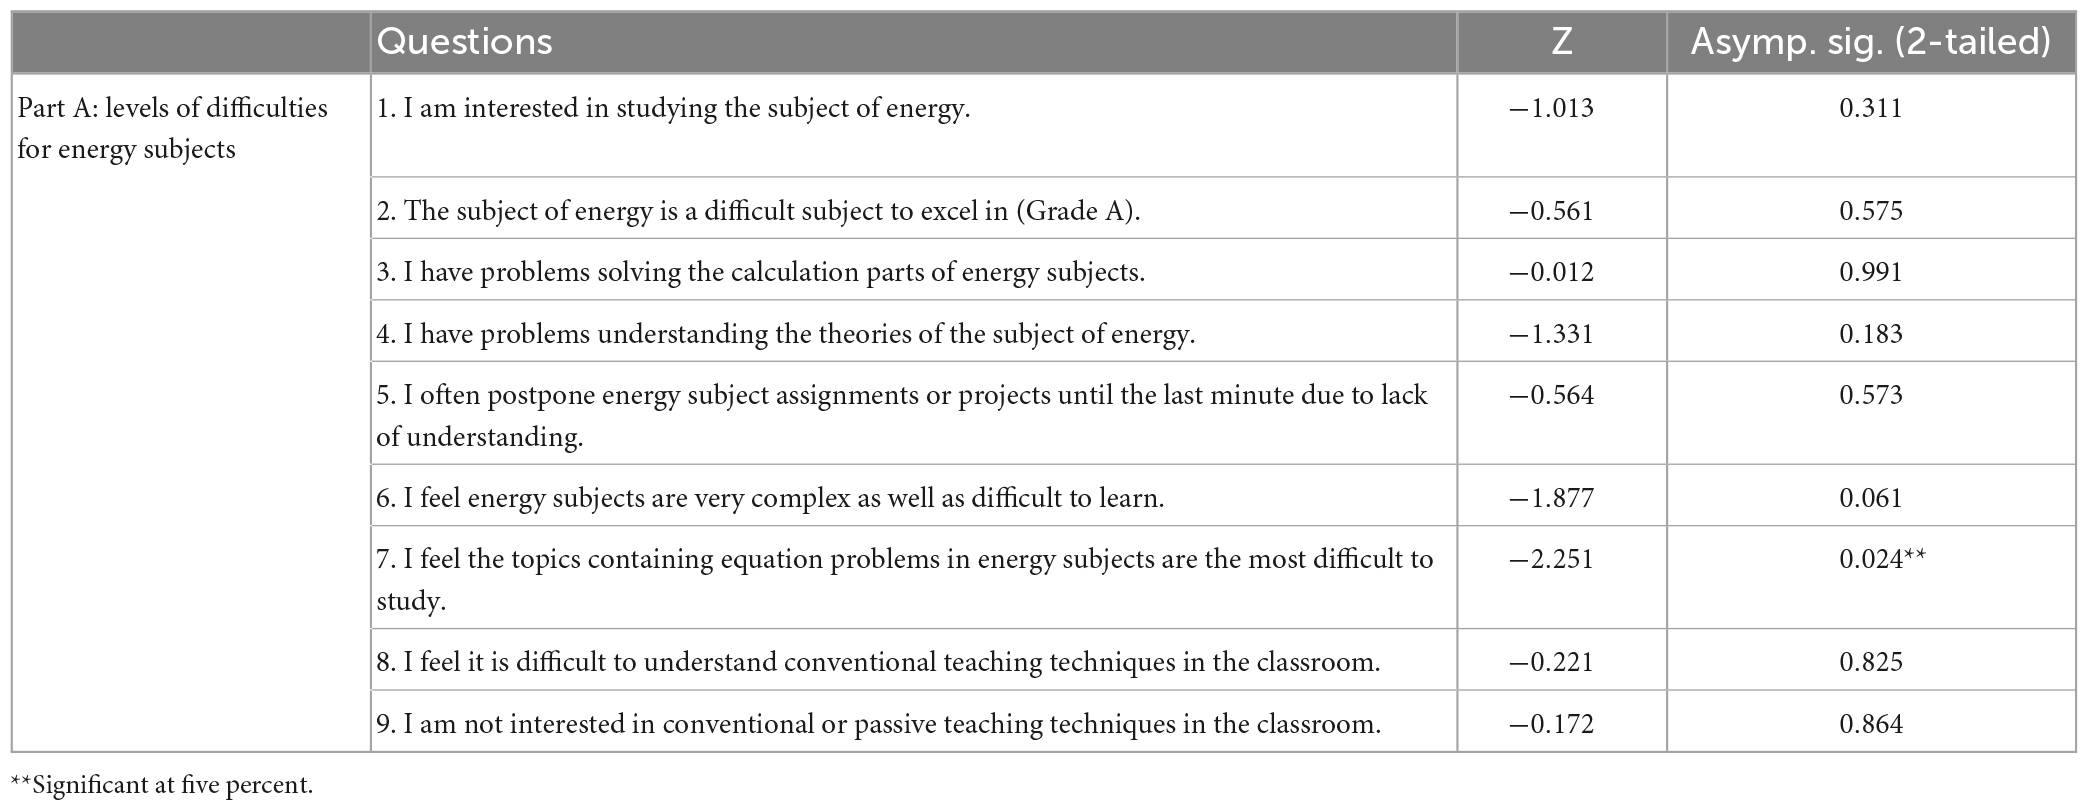
Table 2. Non-parametric test using Wilcoxon signed-rank test (Part A).
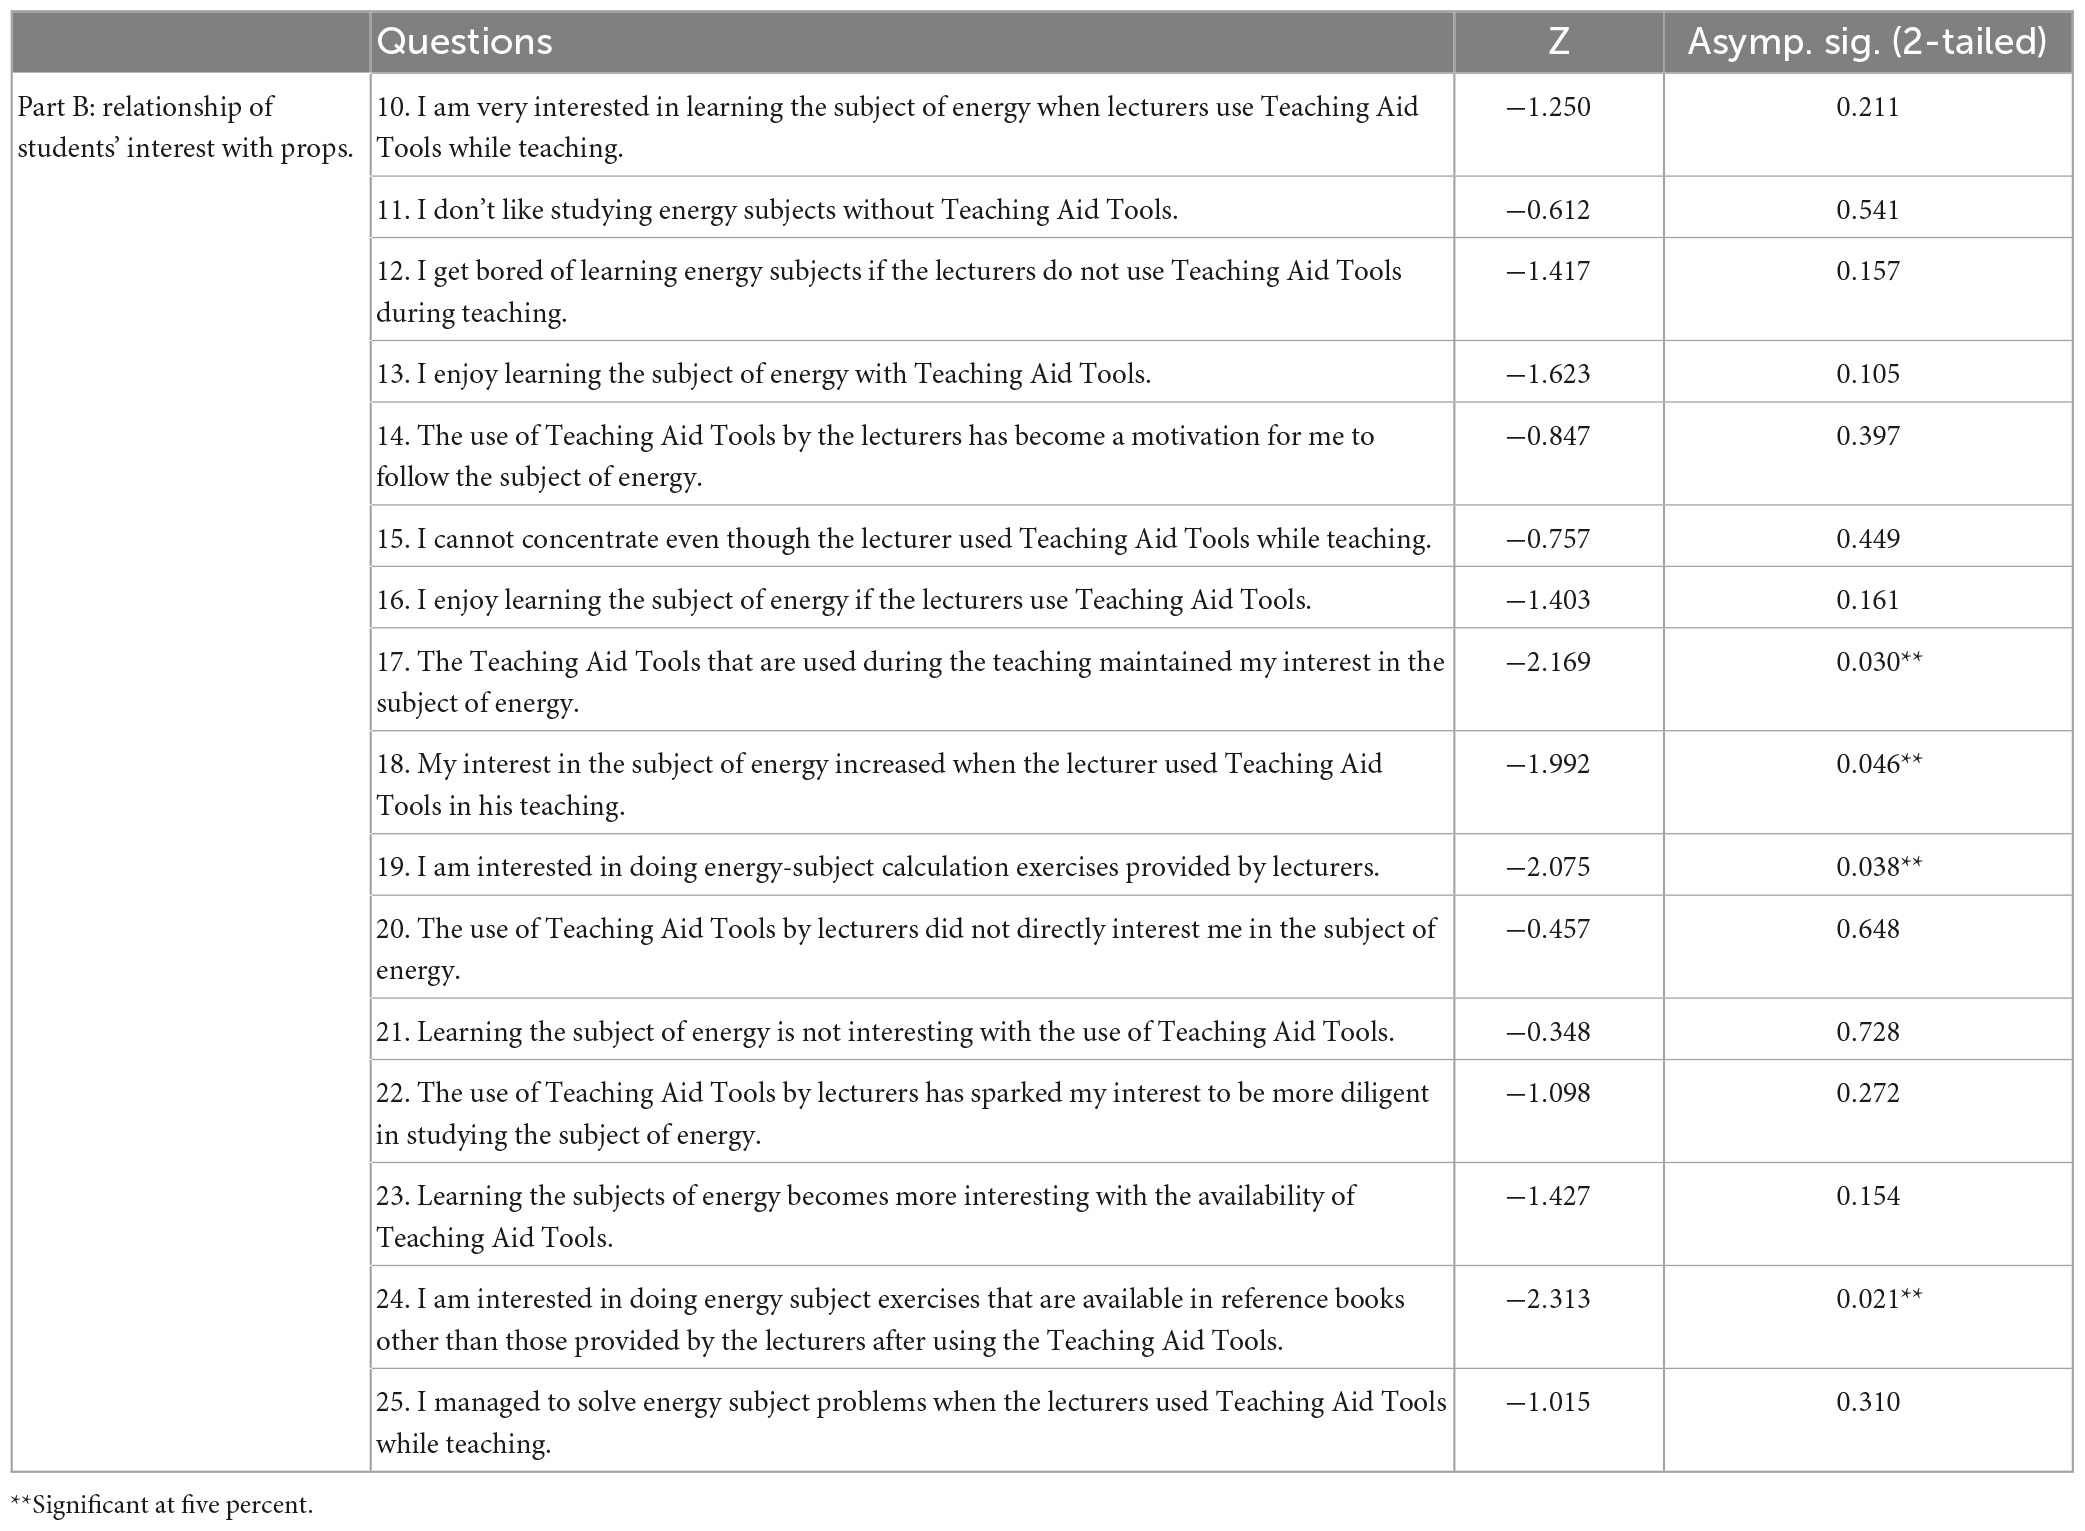
Table 3. Non-parametric test using Wilcoxon signed-rank test (Part B).
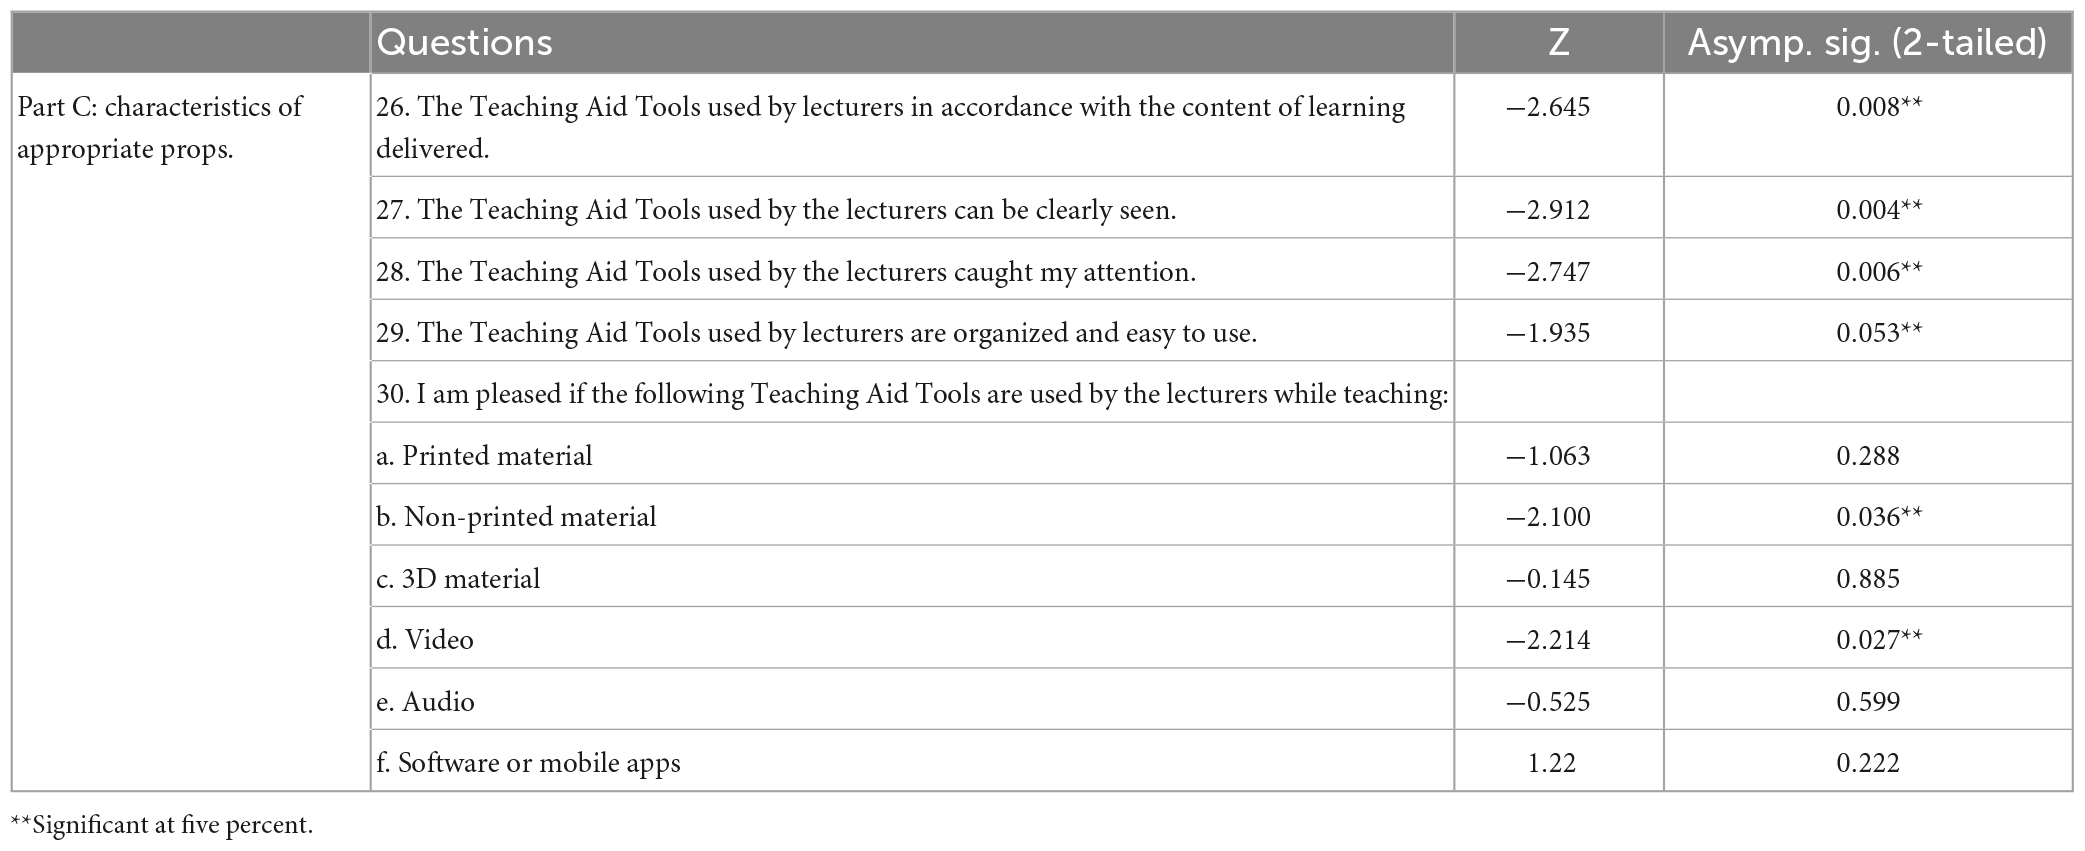
Table 4. Non-parametric test using Wilcoxon signed-rank rest (Part C).
A student survey for the levels of difficulties for energy subjects (Part A) was implemented pre and post use of the teaching aids tool (EC-GUI). The Wilcoxon signed-rank test results indicated a statistically significant difference between the perceived pre and post levels of difficulty for energy subjects. Since the p-value (0.024) was less than 0.05, we can reject the null hypothesis (see Table 2). We have sufficient evidence to conclude that “the topics containing equation problems in energy subjects are the most difficult to study” is statistically significant, meaning the difficulties of the subjects became easier after using the EC-GUI.
Further, the difference between the pre and post scores for the relationship of students interests with props (see Table 3) was also statistically significant in “The teaching aid tools used during the teaching were able to maintain my interest in the subject of energy” with a p-value of 0.030, “My interest in the subject of energy increased when the lecturer used the teaching aid tools in his teaching” with a p-value of 0.046, “I am interested in doing energy subject calculation exercises provided by lecturers” with a p-value of 0.038, and “I am interested in doing energy subject exercises that are available in reference books other than those given by the lecturers after using the teaching aid tools” with a p-value of 0.021. These results explain that the teaching aid tool (EC-GUI) assisted students in increasing their interest in the learning process and cultivated their spirits to learn about the subject of energy. Regarding the outcome of the Part B section, the students were highly interested in doing calculations using smoother tools like the EC-GUI interface tool.
The Wilcoxon signed-rank test result indicated a statistically significant difference between the pre and post scores for appropriate teaching aid tools characteristics, as seen in Table 4. Table 4 shows the multiple types of teaching aid tools used in the classes, whereas the EC-GUI interface is the most highly relevant tool for STEM students especially for energy subjects. We found statistically significant improvements in the characteristics of appropriate EC-GUI tools in terms of the responses to question (26) Teaching aid tools were used by lecturers in accordance with the content of learning delivered, (27) Teaching aid tools could be clearly seen, (28) Teaching aid tools caught my attention, (29) Teaching aid tools were organized and easy to use, and (30) Teaching aid tools were used by the lecturers while teaching especially non-print materials and videos. The levels of significance are clearly shown in Table 5. The teaching aid tools such as non-print materials and videos were highly attractive to STEM students; non-print materials had a p-value of 0.036 and videos had a p-value of 0.027. These two teaching tools were highly accepted by students as elements of teaching. Other tools, such as audio, printed materials, and 3D materials, were not as highly regarded by the students. Non-printed materials and videos can be used later on after the class for further discussions. This result revealed that the teaching aid tools (GUI) made difficult subjects easier, especially those associated with many calculations, formulas, theories, and concepts.
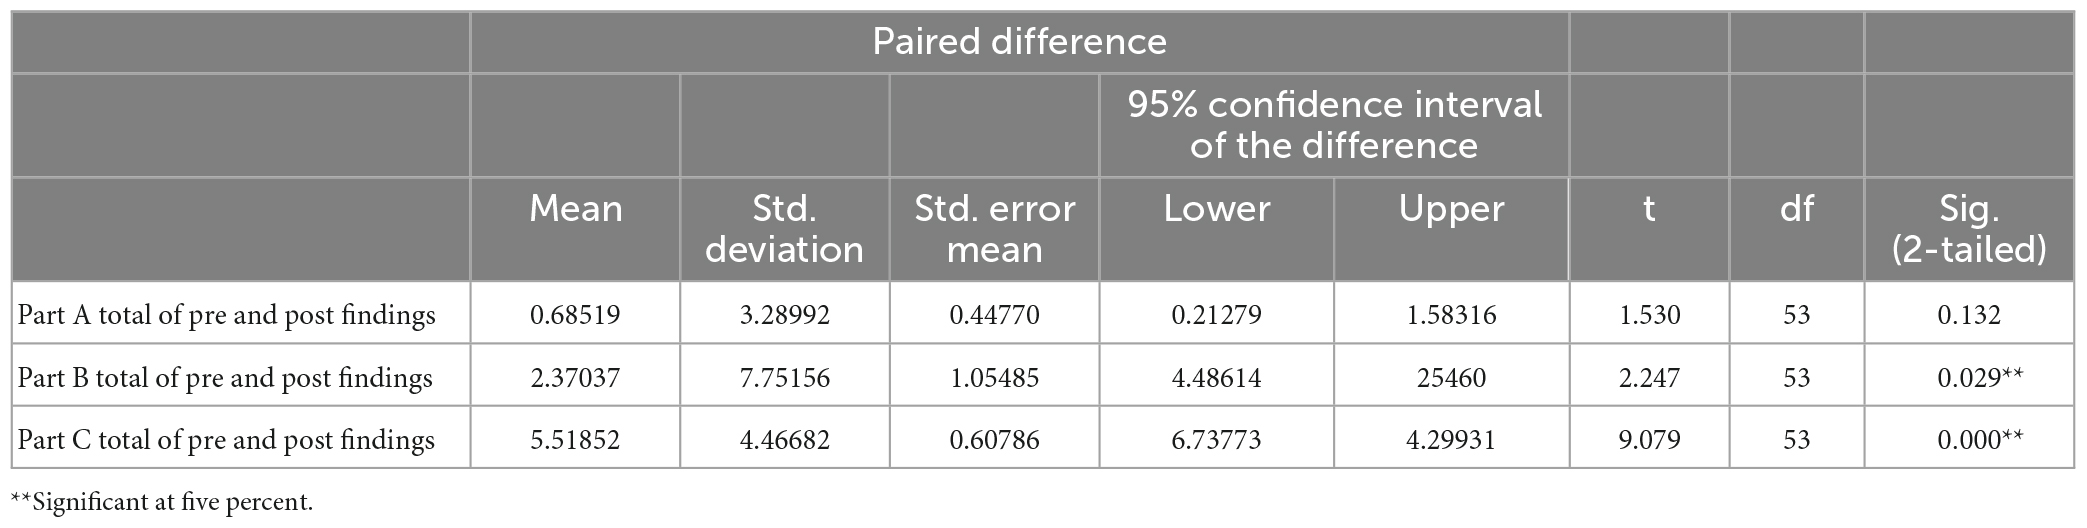
Table 5. Overall outcome of the paired t-test for the pre and post surveys.
In this section, we discuss the paired sample t-test between the average means of constructs obtained from the pre and post survey data regarding: the levels of difficulties for energy subjects (Part A), the relationship of students’ interests with props (Part B), and characteristics of appropriate props (Part C). For this purpose, we computed the paired sample t-test between the pre and post means of the teaching aid tool (EC-GUI) as follows.
A paired sample t-test was performed between the levels of difficulty for the subject of energy (Part A) pre and post using the teaching aids tool (EC-GUI). Table 5 shows the results of the paired sample t-test. The mean difference was computed as 0.68519 with a standard deviation of 3.28992, whereas the t-statistics was 1.530, the degrees of freedom (df) was 53, and the sig (2-tailed) p-value was 0.132. These results meant there was no significant difference in the levels of difficulty for the subject of energy before and after using the teaching aid tool. Further, a paired sample t-test was also performed between the relationship of students’ interests with the teaching aid Tool (Part B) before and after using the teaching aid tool (EC-GUI). The result of the paired sample t-test showed the mean difference was computed as 2.37037 with a standard deviation of 7.75156, whereas the t-statistics was 2.247, the degrees of freedom (df) was 53, and the sig(2-tailed) p-value was 0.029. These results meant there was a significant relationship between students’ interests in the teaching aid tool before and after using it and that the teaching aid tool (EC-GUI) made it easier and more efficient to understand the calculation approaches and subject concepts [t(53) = 2.247, p ≤ 0.05]. Additionally, a paired sample t-test of the characteristics of appropriate teaching aid tools (Part C) was carried out. The paired t-test results, as presented in Table 5, indicated that the difference between the pre and post means of using teaching aid tools was 5.51852, with a standard deviation of 4.46682; furthermore, the t- statistics was 9.079, the degrees of freedom (df) was 53, and the sig(2-tailed) p-value was 0.000, meaning there was a significant difference in the characteristics of appropriate teaching aid tools and the teaching aid tools were more affordable as compared to the before [t(53) = 9.0749, p ≤ 0.05].
The results indicated that the teaching aid tool is efficient enough and STEM students preferred using the EC-GUI teaching aid tool. The tool was sufficient to help the students become more interested in energy subjects despite STEM subjects being categorized as difficult subjects by the majority of the students. Whereas the tools of multiple features help the students to study in more comfortable ways. Regarding using the calculator for mathematical calculations, STEM students, especially students studying energy subjects, need advanced technology and software such as EC-GUI to be more efficient. Additionally, the response to the initial query also agreed with author (4) in that the teachers of the specified subject should value the use of diverse tactics that stray from the traditional teaching of the subject. Here, the teaching aid tools need to be smarter and more helpful for the students, such as the EC-GUI tool. The pre survey results of the study explained the difficulties of students to adapt to STEM subjects, especially energy subjects. The necessity to tackle engineering issues or mathematics in the syllabus frequently contributes to students’ perceptions of the subject’s difficulty (4). Here, the post survey showed how satisfied the students were after using the EC-GUI.
The overall research shows that EC-GUI teaching aid tool is highly efficient among STEM students. However, 63% of students strongly agreed that the Teaching Aid Tools that the lecturers had used while teaching in the current semester. The EC-GUI did not reduce the difficulties of the subject but it did help to enhance the ways to learn more efficiently. It helped the students to work on energy subjects in a much simpler manner. The main objective of the teaching aid tool is to provide more flexible ways of learning and implementing equations and the study proved that STEM students were able to use it to study in a wiser manner. Hence, in the future more students or STEM candidates should use teaching aid tool interfaces as an easier way to accumulate the outcomes of functions and graphic images. The parametric and non-parametric results indicated that the students preferred to use tools such as the EC-GUI. The study aimed to estimate the efficiency of the EC-GUI teaching aid tool among STEM students associated together with a reduction in the perceived complicatedness of energy subjects. The research was conducted among UMT STEM students enrolled in energy subjects. This teaching aid tool will help to improve students’ capabilities to derive formulas and compute equations and graphs easily. Altogether, the study’s findings indicate that the designed tool is a possible tool that may help in the teaching, learning, and evaluation processes of the challenging subject of energy taught in a higher-learning institution. To sum up, using the EC-GUI tool in the teaching, learning, and assessment (TLA) process helps the understanding of energy subjects and contributes a few advantages:
(i) The EC-GUI tool can be used in TLA processes with easy functions for the tutors.
(ii) The designed interface can be quickly installed on any computer without the need to acquire a database or costly software.
(iii) The users can use the tool to derive formulates, compute formulas, and show figures and graphs.
(iv) The users are allowed to change the settings of the EC-GUI tool according to self-preferences to produce the desired results.
Limitations can be identified in multiple scope in a study. Here, the graphical user interface (GUI) was found by the authors to bring a smoothness to the learning processes of STEM subjects. The EC-GUI application has multiple uses for the students and this is also a limitation in the study where this application was only used by students from UMT. Several research gaps exist in this field, given the need for more research on STEM education in Malaysia. The study gap defines that STEM regarding research are rare. Research in future can use the same EC-GUI interface to evaluate the difficulties of STEM subjects in a wider range of survey analyses by allocating more funds for its usage. The research can also be conducted with more variety of student’s perceptions, by adding other characteristics into the EC-GUI interface. This could justify the usage of the teaching aid tool as an efficient necessity for STEM students. In the future, researchers can use a wider sampling selection by having a greater number of respondents. In this study, the number of students for the pre and post study survey were the same.
The original contributions presented in this study are included in the article/supplementary material, further inquiries can be directed to the corresponding author.
The studies involving human participants were reviewed and approved by the Universiti Malaysia Terengganu Research Ethics Committee (No: UMT/JKEPM/2022/100). The patients/participants provided their written informed consent to participate in this study.
AA conceived and designed the investigation. LGK and YS drafted the report and had principal responsibility for the interpretation of data. MKI, ARR, MAM, KG, TSS, and MZI critically reviewed and revised the study and provided important intellectual and educational content. All authors take responsibility for the final approval of the version to be published and are accountable for all aspects of the work in ensuring that questions related to the accuracy or integrity of any part of the work are appropriately investigated and resolved, read, and agreed to the published version of the manuscript.
This study was funded by the Universiti Malaysia Terengganu through the Scholarship of Teaching of Learning (SoTL), grant number (VOT. 55199/1).
Permission to conduct the investigation was obtained following review by the Universiti Malaysia Terengganu Research Ethics Committee (No: UMT/JKEPM/2022/100).
The authors declare that the research was conducted in the absence of any commercial or financial relationships that could be construed as a potential conflict of interest.
All claims expressed in this article are solely those of the authors and do not necessarily represent those of their affiliated organizations, or those of the publisher, the editors and the reviewers. Any product that may be evaluated in this article, or claim that may be made by its manufacturer, is not guaranteed or endorsed by the publisher.
Alam, M., Sajid, S., Kok, J., Rahman, M., and Amin, A. (2021). Factors that influence high school female Students’ intentions to pursue science, technology, engineering and mathematics (STEM) education in Malaysia. Pertanika J. Soc. Sci. Humanit. 29, 839–867. doi: 10.47836/pjssh.29.2.06
Albani, A., and Ibrahim, M. (2019). Development of graphical interface simulator of advanced wastewater treatment design process for teaching, learning, and assessment. Designs 3, 1–11. doi: 10.3390/designs3020027
Boyd, R. (2020). “PART 3 advanced topics” in Tolerance Analysis of Electronic Circuits Using MATLAB, CRC Press, Taylor & Francis Group, 127–128. doi: 10.1201/9780203735619
Ghavifekr, S., and Rosdy, W. (2015). Teaching and learning with technology: effectiveness of ICT integration in schools. Int. J. Res. Educ. Sci. 1, 175–191. doi: 10.21890/ijres.23596
Honey, M., Pearson, G., and Schweingruber, H., and National Academy of Engineering and National Research Council (2014). STEM Integration in K-12 Education: Status, Prospects, and an Agenda for Research, Vol. 10. Washington, DC: National Academies Press, 18612.
Hussin, H., Abidin, H., Husaini, Y., Muhamad, M., and Ali, M. (2017). “Students’ perception on teaching and learning activities and their understanding in power engineering course,” in Proc 2017 IEEE Int Conf Teaching, Assess Learn Eng TALE 2017, Hong Kong, 333–338. doi: 10.1109/TALE.2017.8252358
John, A., and Estonanto, J. (2017). Acceptability and difficulty of the STEM track implementation in senior high school. Asia Pacific J. Multidiscip Res. 5, 43–50.
Kholil, M., and Wahyudin, D. (2018). Graphical user interface (GUI) of GPS data (Dumy Data). IOP Conf. Ser. Mater Sci. Eng. 384:012070. doi: 10.1088/1757-899X/384/1/012070
Khosravi, M., Ali, N., Karbasi, M., Brohi, I., Shaikh, I., and Shah, A. (2018). Comparison between NFC/RFID and bar code systems for Halal tags identification: paired sample T-test evaluation. Int. J. Adv. Comput. Sci. Appl. 9, 221–229. doi: 10.14569/IJACSA.2018.090435
Kornbrot, D. (1990). The rank difference test: a new and meaningful alternative to the Wilcoxon signed ranks test for ordinal data. Br. J. Math Stat. Psychol. 43, 241–264. doi: 10.1111/j.2044-8317.1990.tb00939.x
MacFarland, T., and Yates, J. (2016). Introduction to Nonparametric Statistics for the Biological Sciences Using R. Berlin: Springer. doi: 10.1007/978-3-319-30634-6
Nass, M., Alégroth, E., and Feldt, R. (2021). Why many challenges with GUI test automation (will) remain. Inf. Softw. Technol. 138:106625. doi: 10.1016/j.infsof.2021.106625
Nawangsari, T. (2017). “Test of difference between paired sample by using Mcnemar test”, in International Conference on Mathematics: Education, Theory, and Application (ICMETA) 2017, 117–125. Available online at: https://jurnal.uns.ac.id/math/article/viewFile/12036/10558 (accessed December 31, 2022).
Teguh, M. (2014). Metode Kuantitatif untuk Analisis Ekonomi dan Bisnis. Depok City: PT. RajaGrafindo Persada, 234.
Yosani, C. (2006). Teknik Analisis Kuantitatif. Makal Tek Anal II. 1–7. Available online at: http://staffnew.uny.ac.id/upload/132232818/pendidikan/Analisis+Kuantitatif.pdf (accessed December 29, 2022).
Keywords: STEM, teaching, learning, and assessment, graphical interface simulator, education, Malaysia
Citation: Gopabala Krishnan L, Albani A, Segar Y, Ridzuan AR, Ismail MK, Musa MA, Gunaseelan K, Subramaniam TS and Ibrahim MZ (2023) The student response on the use of renewable energy graphical interface simulator in learning environment. Front. Educ. 8:1023499. doi: 10.3389/feduc.2023.1023499
Received: 19 August 2022; Accepted: 14 March 2023;
Published: 17 April 2023.
Edited by:
Wang-Kin Chiu, The Hong Kong Polytechnic University, Hong Kong SAR, ChinaReviewed by:
Mawardi Mawardi, Padang State University, IndonesiaCopyright © 2023 Gopabala Krishnan, Albani, Segar, Ridzuan, Ismail, Musa, Gunaseelan, Subramaniam and Ibrahim. This is an open-access article distributed under the terms of the Creative Commons Attribution License (CC BY). The use, distribution or reproduction in other forums is permitted, provided the original author(s) and the copyright owner(s) are credited and that the original publication in this journal is cited, in accordance with accepted academic practice. No use, distribution or reproduction is permitted which does not comply with these terms.
*Correspondence: Aliashim Albani, YS5hbGJhbmlAdW10LmVkdS5teQ==
Disclaimer: All claims expressed in this article are solely those of the authors and do not necessarily represent those of their affiliated organizations, or those of the publisher, the editors and the reviewers. Any product that may be evaluated in this article or claim that may be made by its manufacturer is not guaranteed or endorsed by the publisher.
Research integrity at Frontiers
Learn more about the work of our research integrity team to safeguard the quality of each article we publish.