 Irene Eegdeman
 Ilja Cornelisz
 Martijn Meeter
95% of researchers rate our articles as excellent or good
Learn more about the work of our research integrity team to safeguard the quality of each article we publish.
Find out more
ORIGINAL RESEARCH article
Front. Educ. , 24 November 2022
Sec. Assessment, Testing and Applied Measurement
Volume 7 - 2022 | https://doi.org/10.3389/feduc.2022.976922
This article is part of the Research Topic Machine Learning Applications in Educational Studies View all 5 articles
Introduction: Machine learning algorithms use data to identify at-risk students early on such that dropout can be prevented. Teachers, on the other hand, may have a perspective on a student’s chance, derived from their observations and previous experience. Are such subjective perspectives of teachers indeed predictive for identifying at-risk students, and can these perspectives help increase the prediction performance of machine learning algorithms? This study puts 9 teachers in an upper secondary vocational education program to the test.
Methods: For each of the 95 freshmen students enrolled in the program, these teachers were asked whether a student would drop out by the end of their freshman year. Teachers answered this question at the beginning of the program and again after the first 10 weeks of the program.
Results: Teachers predicted dropout better than the machine learning algorithms at the start of the program, in particular, because they were able to identify students with a very high likelihood of dropout that could not be identified by the algorithms. However, after the first period, even though prediction accuracy increased over time for both algorithms and teachers, algorithms outperformed the teachers. A ranking, combining the teachers composite and the random forest algorithm, had better sensitivity than each separately, though not better precision.
About 50 percent of all Dutch students enroll in a vocational education program. All efforts of vocational institutes are aimed at guiding students toward a diploma, yet, on average, about 28 percent of the students drop out (Inspectorate of Education, 2021). The lower the level of education, the higher the likelihood of unemployment. 9.3% of all Dutch 15- to 25-year-old people are unemployed and not in education. Without a so-called basic qualification that is considered the minimum requirement to be successful in the job market, this unemployment rate rises to 12.5% (Nederlands Jeugdinsitituut, 2022). To reach a basic qualification, students have to obtain at least a vocational diploma. Thus, students who drop out of vocational education have a higher risk of unemployment and poverty, which is a major social problem (Central Bureau for Statistics, 2022). In addition, it is more beneficial to choose the “right” program since students must pay college tuition each year after turning 18.
Vocational institutes are aware of the lifechanging consequences that dropping out can have for students. In addition, the quality assessment and funding of a Dutch vocational program partly depends on the dropout rate. This is an incentive to reduce student dropout and makes it important for the vocational institutes to gain more insight into the dropout process. All efforts of vocational institutes are aimed at guiding students toward a diploma, yet many students still drop out.
Successful dropout prevention requires both accurate targeting and effective intervention. Targeting requires accurately identifying students at risk and doing so efficiently in the face of miss-classification and capacity to counsel students. Such targeting is only useful if subsequent interventions effectively allow at-risk students to succeed in the program or switch toward an education program that better suits them. We come back to effective intervention in the discussion, the rest of this study focusses on the accurate targeting of at-risk students.
Several studies describe attempts to predict dropout as early in the program as possible. Most previous studies in higher and vocational education focused on common sets of predictors such as preceding GPA, grades within the program, attendance, achievement, ability, and personality traits (e.g., Battin-Pearson et al., 2000; Janosz et al., 2000; Paunonen and Ashton, 2001; O’Connor and Paunonen, 2007; Eegdeman et al., 2018 among others). These studies have shown that the predictors available at the start of the program do not differentiate very well between students who drop out or do not drop out (O’Cummings and Therriault, 2015). However, once data on student performance achievement become available, predictions rapidly become more accurate (Eegdeman et al., 2022). The challenge schools face is to predict dropouts before this data becomes available.
Increasingly, machine learning techniques are used to improve predictive performance (e.g., Kotsiantis et al., 2003; Lykourentzou et al., 2009; Đambić et al., 2016; Sansone, 2019; Rastrollo-Guerrero et al., 2020; Plak et al. 2022). Machine learning algorithms differ from conventional statistical estimation models in that their sole objective is to identify the set of covariates (X) that optimally predicts variation in the dependent variable (Y). These models optimize prediction power by discouraging more complex/flexible models to avoid overfitting. Random forest, for example, tunes the hyper-parameters (e.g., the number of samples in the leaf) and the lasso algorithm penalizes the absolute values of the estimation parameters (Hastie et al., 2009).
Machine learning approaches are designed for optimally predicting outcomes out-of-sample (i.e., for new data records) in the face of overfitting problems and unbalanced risk data. For educational institutes, out-of-sample prediction performance is important because they wish to predict the risk of dropping out for newly entering students, who are by definition out of sample at the moment the prediction model is made. The puzzle is then to know what information of these entering students should be collected to predict their risk of dropping out.
Thus far, the results of several machine learning approaches are promising and have important implications for educational policy and education in particular (Musso et al., 2020). Zhai et al. (2020a) discussed trends of applying machine learning in science education assessments. One of the trends the authors mention is that machine learning may change the process of educational decision making (e.g., machine learning can promote the use of a diverse set of evidence to make decisions). Tamada and Netto (2019) provided a theoretical basis for choosing appropriate techniques in the educational context. They show that machine learning is an appropriate technique that helps identifying possible dropouts, in e-learning environments but also in other educational contexts, such as blended learning and classic education. Recently, Eegdeman et al. (2022) evaluated the predictive performance of a range of different machine learning algorithms and showed that a machine learning approach can be used to better predict student dropout, and, by ranking students according to the model predictions, gain insight in the precision and sensitivity trade-off. For all algorithms, precision prediction at the start of the program is still rather erratic, making them of little use in supporting early identification of at-risk students.
Most Dutch vocational teachers have their observations, from daily teaching practice and theories, formed by experience, for signaling at-risk students (van Wijk and van Kan, 2013). They have what van Wijk and van Kan (2013) call “practical theories” on student chances of graduating from the program, but which we will here refer to more generally as a perspective on dropout and retention that they use to identify students at risk. This perspective on student chances is not based on single observations during daily teaching practice but a range of integrated signals (van Wijk and van Kan, 2013). For example, a teenage mother theoretically had a high risk of dropping out. However, teachers do not look at this signal in isolation but combine this with other observations (e.g., teachers observe that she is autonomous and well organized) to come to a prediction for this specific student. Do such perspectives on student chances, however, allow teachers to accurately identify actual at-risk students? Teachers observe factors underlying dropout that are unavailable to machine learning algorithms. As such teachers’ dropout predictions may be more accurate than – or can improve predictions of – machine learning algorithms. However, subjective teacher observations can be biased and selective, which may go at the expense of predictive power. For example, Südkamp et al. (2012) show in their meta-analysis that teacher judgments of academic achievement are moderately accurate, with room for improvement.
This study puts teachers to the test and examines the following research questions. Firstly, it examines if teachers can accurately predict future student dropouts at the start of the program. For this purpose, we use machine learning predictions as a yardstick to judge teacher accuracy.
Secondly, it examines if combining the teacher predictions with the machine learning predictions will increase the prediction performance. If so, then we could conclude that it is not a matter of “who predicts best” but instead a situation in which both have an important role to play in the dropout prediction of students.
This study was performed at an upper secondary vocational education program in the Netherlands. Dutch vocational education offers an education that trains for a specific profession, and the education programs are typically developed together with the industry in which the graduates will work after completing the program. Vocational education has four levels that vary in cognitive demands, and that, match with the International Standard Classification of Education (ISCED) levels two, three, and four. The program in this study is a level three and level four program and prepares students for employment in sports (such as a trainer or instructor). The schoolyear is split into four periods of about 10 weeks. The study focused on the 95 students of cohort 2019, which were divided into five classes (Table 1). Data from cohorts 2015 to 2018 made up the training set for the machine learning algorithms. Table A1 in Appendix A shows the descriptive statistics of the training and test sample. The table shows that the test sample had a lower dropout rate than the training sample. Due to COVID-19 measurements, more students stayed, and were allowed to stay, within the vocational program. It is possible that this influenced the accuracy of the predictions of the teachers and the models. Further research is needed to see if accuracy is indeed lower or higher.
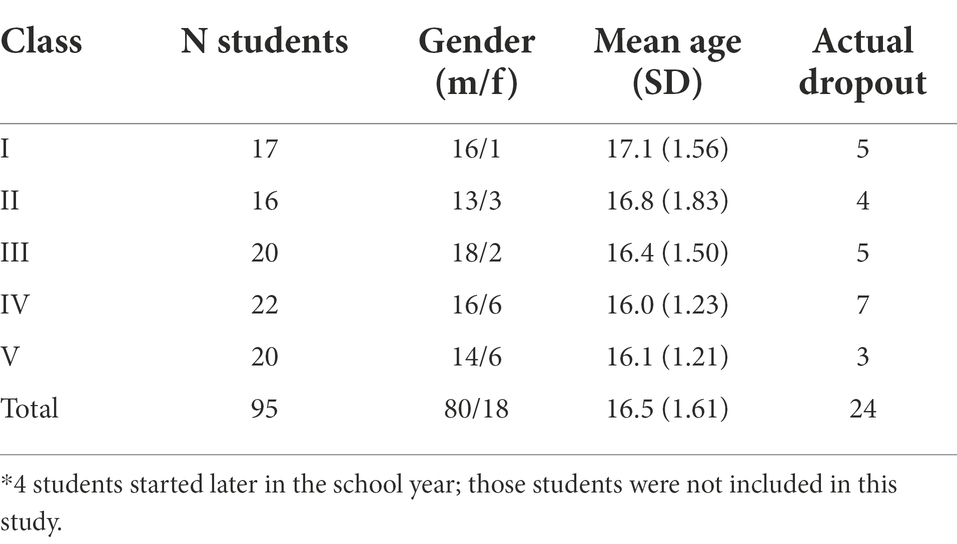
Table 1. Descriptive statistics of classes for which dropout predictions were made.
Both at the start of the program and after the first period (e.g., after the first 10 weeks) teachers were asked to estimate whether a student would drop out or remain in the program. Teachers were also asked about their experience in education, whether they were a tutor of one of the freshman classes, and based on which observations, feelings, or hunches they made their estimations (questionnaire in Appendix B). Nine out of the 12 teachers who taught the first-year students of cohort 2019 enrolled in ROC TOP Sports Academy Amsterdam consented to participate in this study. The second questionnaire was filled out by seven teachers (Table 2). Teacher G and I did not respond to the questionnaire and Teacher H filled out the questionnaire but did not predict student dropout the second time because he did not teach the students. His answers were excluded from the analysis.
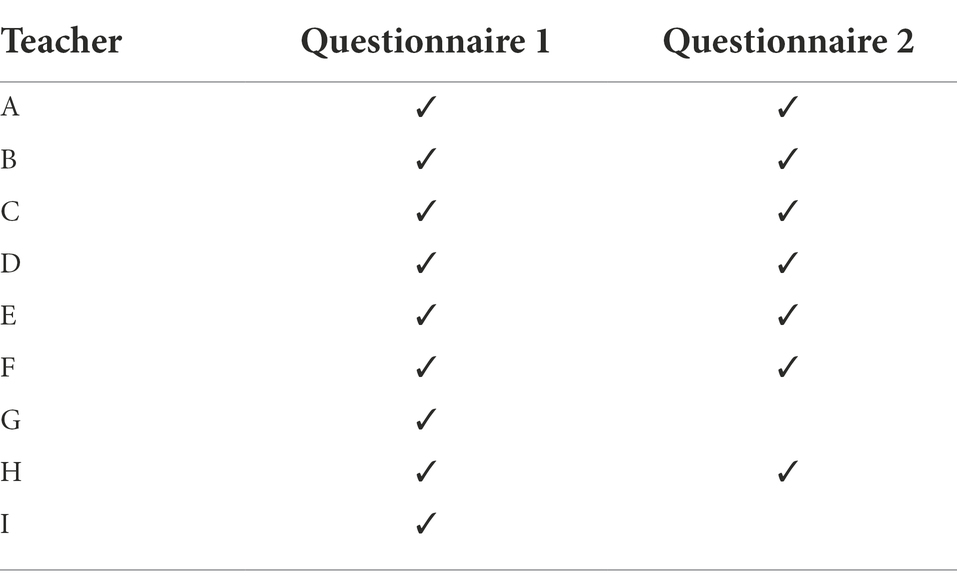
Table 2. Descriptive statistics of the teachers (age ranged from 31 to 41 years, experience in education from 5 to 14 years, and experience in the program from 0.5 to 10 years; these are not listed per teacher to protect privacy).
The research was conducted under the Helsinki protocol. It fell under a protocol that was approved by the Scientific and Ethical Review Board of the Faculty of Behavioral and Movement Sciences, Vrije Universiteit Amsterdam (#2019-088). All teachers included in the study gave their informed consent.
Teachers estimated the at-risk students by filling out a questionnaire two times (at the start of the program and after the first period). Teachers also provided their years of experience, and age, and were asked for several possible observations, feelings, or hunches whether they (on a five points Likert-scale) used these to make their estimations. Teachers then made, per student, an estimation by choosing a category (successful/dropout/I do not teach this student) and a certainty score that worked out into six categories1: (1) high confidence in prediction “dropout,” (2) dropout with a high risk (3) dropout with a smaller risk, (4) successful with a high risk of dropout, (5) successful with a smaller risk of dropout and (6) high confidence in prediction “successful.” To compute precision and sensitivity, these certainty scores were transferred to a likelihood of dropping out by subdividing (0–1) into six intervals and taking the midpoint of each (Table 3), even though this transformation is somewhat arbitrary.
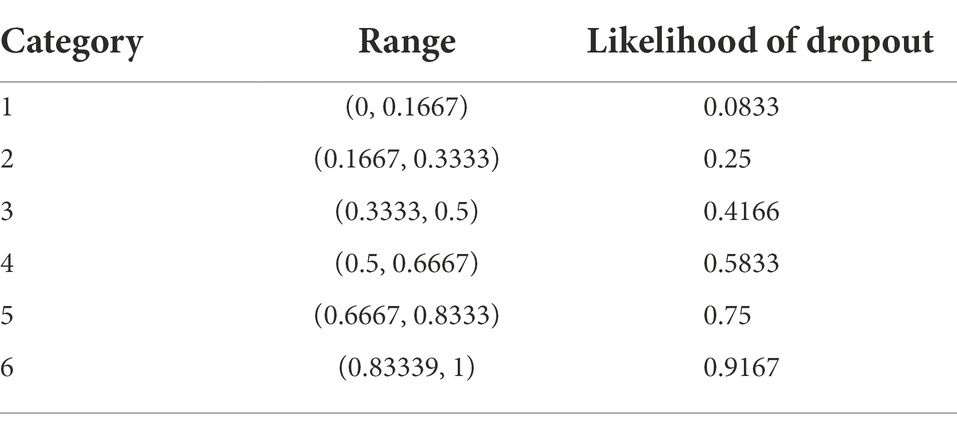
Table 3. Scores transferred to a likelihood of dropping out.
Administrative school data, responses to an expectations questionnaire, a cognitive and personality intake test, prevocational grades and GPA, vocational grades and GPA, and attendance data were input for the machine learning model. The algorithms used are described in Eegdeman et al. (2022). It yielded, for every student, a likelihood of dropout given what was known about him or her at the onset of the program and after each of the four periods.
Since later dropout is a more ambiguous outcome in the sense that it may reflect success instead of failure (e.g., students may be employed and decide that they do not need a formal closure of their program), we decided to take first-year dropout as the dependent outcome of the analyses.
Since teacher’s and model-made predictions are on different scales, parametric measures of association are inappropriate. As a prediction accuracy measure, we, therefore, calculated the nonparametric Kendall’s rank correlation, also referred to as Kendall’s τ between predictions and outcome (Kendall, 1938). It represents the proportion of pairs of observations in which prediction and outcome are in agreement (not counting ties on either measure). For example, if Kendall’s τ = 1, it means that observations have an identical rank between the two variables. One Kendall’s τ was computed for each teacher making predictions on each occasion, and for each statistical model. When teachers indicated that a student was not in their class, this student was not used in the analyses. We then compared, using a Bayesian t-test, Kendall’s τ of the teachers’ “at start” predictions with chance level (τ = 0). This was our primary test of whether teachers can predict student dropout.
We also compared Kendall’s τ, using a Bayesian paired-samples t-test, obtained for the “after period 1” predictions with that of the “at start” predictions, to see whether accuracy increases over time. Moreover, we compared the prediction accuracy of the teachers to that of the models fed with all variables, including first grades and absences, in the same week as before, to test whether teachers can predict this better than statistical models.
Secondly, to evaluate model performance and the teachers’ estimations we compared the predicted values with the observed outcomes in a so-called “confusion matrix” (Table 4). Machine learning approaches visualize the algorithmic performance using this matrix. The table offsets the predicted risk value by the machine learning algorithm or teachers against the observed/true value. Four performance evaluators can be distinguished based on the confusion matrix. Accuracy indicates the proportion of correctly identified risk states (right predicted dropped out and students who successfully remained in the program) and specificity indicates the proportion of correctly identified successful students. In this study, the goal was to optimize model performance by correctly identifying students at risk of dropping out. Therefore, sensitivity and precision are the most appropriate evaluators as they acknowledge that the objective is to optimize (1) the identification of students at risk of dropping out (i.e., sensitivity) and (2) the correct model predictions (i.e., precision).
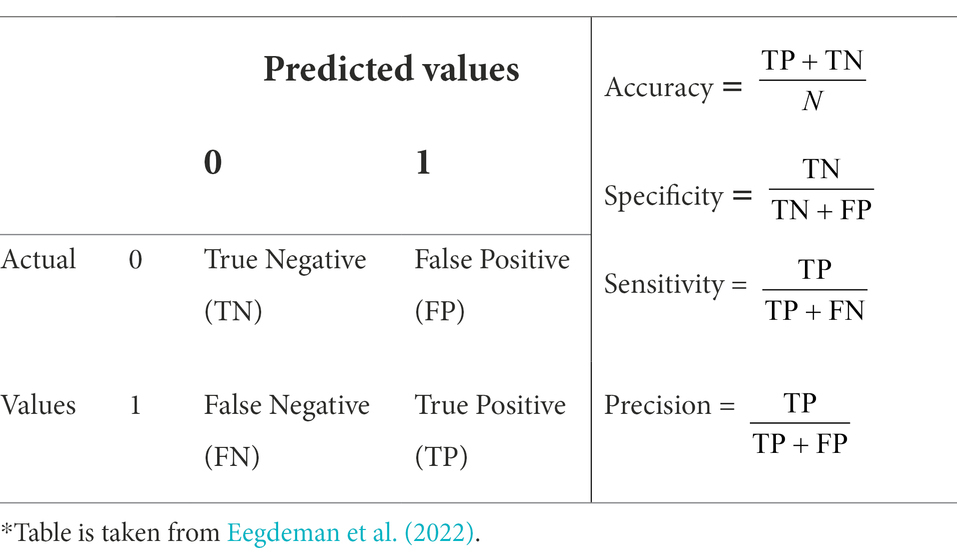
Table 4. Confusion matrix which tabulates the frequencies of the actual values of the dependent variable against the values predicted by the model*.
Teacher predictions were translated into a prediction chance as outlined in Table 3 and then averaged, resulting in a “teacher composite.” This way the combined teacher predictions, can be compared to the probability calculated by the machine learning algorithms. We also created a “model composite” in the same way.
We then plotted the precision and sensitivity for both the teacher composite and the machine learning algorithms. We follow Eegdeman et al. (2022) and Savi et al. (2021) and examine the trade-off between sensitivity and precision by making @k student plots. In this approach, students are ranked according to their predicted dropout risk (separately for each machine learning algorithm and for the teacher composite). Beginning with the highest-ranked students, then precision and sensitivity are computed conditionally on that a specific percentage of students were targeted, beginning with the student with the highest predicted dropout risk and ending with the student with the lowest dropout risk. For each percentage of targeted students (denoted as @%) we calculate precision (relevant proportion of the selected dropouts) and sensitivity (correctly identified dropouts) by comparing the estimated risk of dropout with the actual dropout. This renders visible how many students have to be targeted to reach a certain percentage of the overall students at risk. A higher precision @% signifies a better proportionality and a higher sensitivity @% signifies a better coverage of the students at risk. In the ideal scenario, precision remains 100% with every increase in the percentage of invited students, and sensitivity increases with every increase in the percentage of invited students until sensitivity also reaches 100% (Savi et al., 2020). The advantage of this approach is that the ratio between the decrease in precision and gain in sensitivity also incorporates specificity information (i.e., if inviting additional students does not result in sensitivity gains and precision loss, then this indicates that more students who were not at risk were incorrectly identified as at-risk and invited).
Thirdly, we examine if teacher dropout predictions contribute to machine learning predictions. For this purpose, the best machine learning prediction and the prediction of the teacher composite were averaged, and after ranking the students according to their risk prediction, similar precision, and sensitivity @% plots were made to show whether this combined approach improved the risk prediction.
Finally, more insight is given into what drives the teacher’s predictions, by showing the answers teachers gave to which observations, feelings, or hunches they based their predictions on. Teachers answered on a 5-point Likert scale what observations were used. These answers were averaged and shown in a histogram.
Figure 1 shows Kendall’s τ of the teachers and machine learning algorithms at the start of the program and after period 1. The figure shows that our calculated teacher composite performs better than the model composite of the machine learning algorithms (Bayesian one-sample t-test shows anecdotal evidence that Kendall’s τ of the models is smaller than the teacher composite; BF₁₀ = 1.833). The table in Appendix C shows that the τ coefficient at the start of the program of teacher E, the teacher composite, and the random forest algorithm is significantly different from 0. After period 1, most teachers and all algorithms show a τ coefficient significantly different from 0, and the difference between the means is anecdotal in favor of no difference between the two (BF₁₀ = 0.523). Bayesian paired samples t-tests show that both teachers (BF₁₀ = 10.99) and machine learning models (BF₁₀ = 3.72) increased in accuracy over time. The percentage of students at-risk that teachers predicted at the start of the program was between 13% (7 of the 54 students) and 32% (30 of the 95 students), and the actual percentage of student dropout was 25% (24 of the 95 students).

Figure 1. Kendall’s τ (tau-b, adjusted for ties) of the teachers (yellow lines) and the machine learning algorithms at the start of the program and after period 1 (at a cut-off of 0.5). Table B1 in Appendix B shows all information. *The outcomes of the calculated teacher composite (by combining the teacher predictions and certainties) and model composite differ from just simply averaging all teacher and model predictions.
Table 5 shows the comparison of Kendall’s τ of the teachers’ week-1 predictions (M = 0.16, SD = 0.09) with chance level (Kendall’s τ of 0) and Kendall’s τ of the various ML models with a Bayesian One-Sample t-test. The Bayes factor for “at start vs. τ = 0” (BF₁₀ = 59.57) indicates strong evidence for the alternative hypothesis: It was approximately 60 times more likely that teachers made a better prediction of dropout than chance level. There is also strong evidence that teachers made better predictions of students at risk of dropping out than the LASSO regression model (BF₁₀ = 14.27). Teachers did not differ from the SVM (BF₁₀ = 0.322) and the RF (BF₁₀ = 0.913).
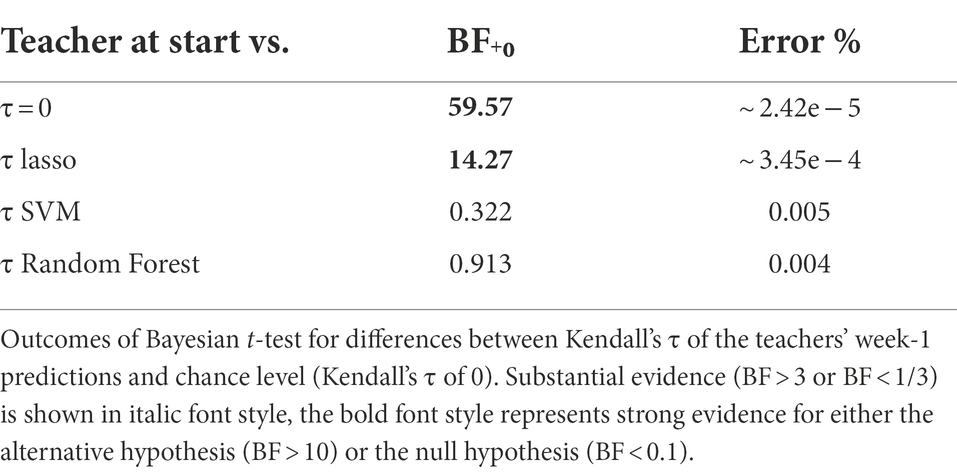
Table 5. Bayesian one-sample t-test for Kendall’s τ of the teachers at start-predictions (M = 0.16, SD = 0.09) with chance level (Kendall’s τ of 0) and Kendall’s τ of the various ML models.
Figure 2 shows the sensitivity @% and the precision @% plots. The upper panels show the percentage of dropouts correctly identified for the test sample when a percentage of the students are invited (sensitivity @%) at the start and after the first period. The figures show, in line with Kendall’s τ of Table 1, that the model performance of Random Forest and the teacher composite at the start of the program are best because the sensitivity lines are mostly above those of the other models. The results presented above show that the teacher composite predictions outperformed the LASSO algorithm and chance level which can also be seen in the figures. The right panels of Figure 2 show that the machine learning algorithms perform better than the teacher composite after the first period.
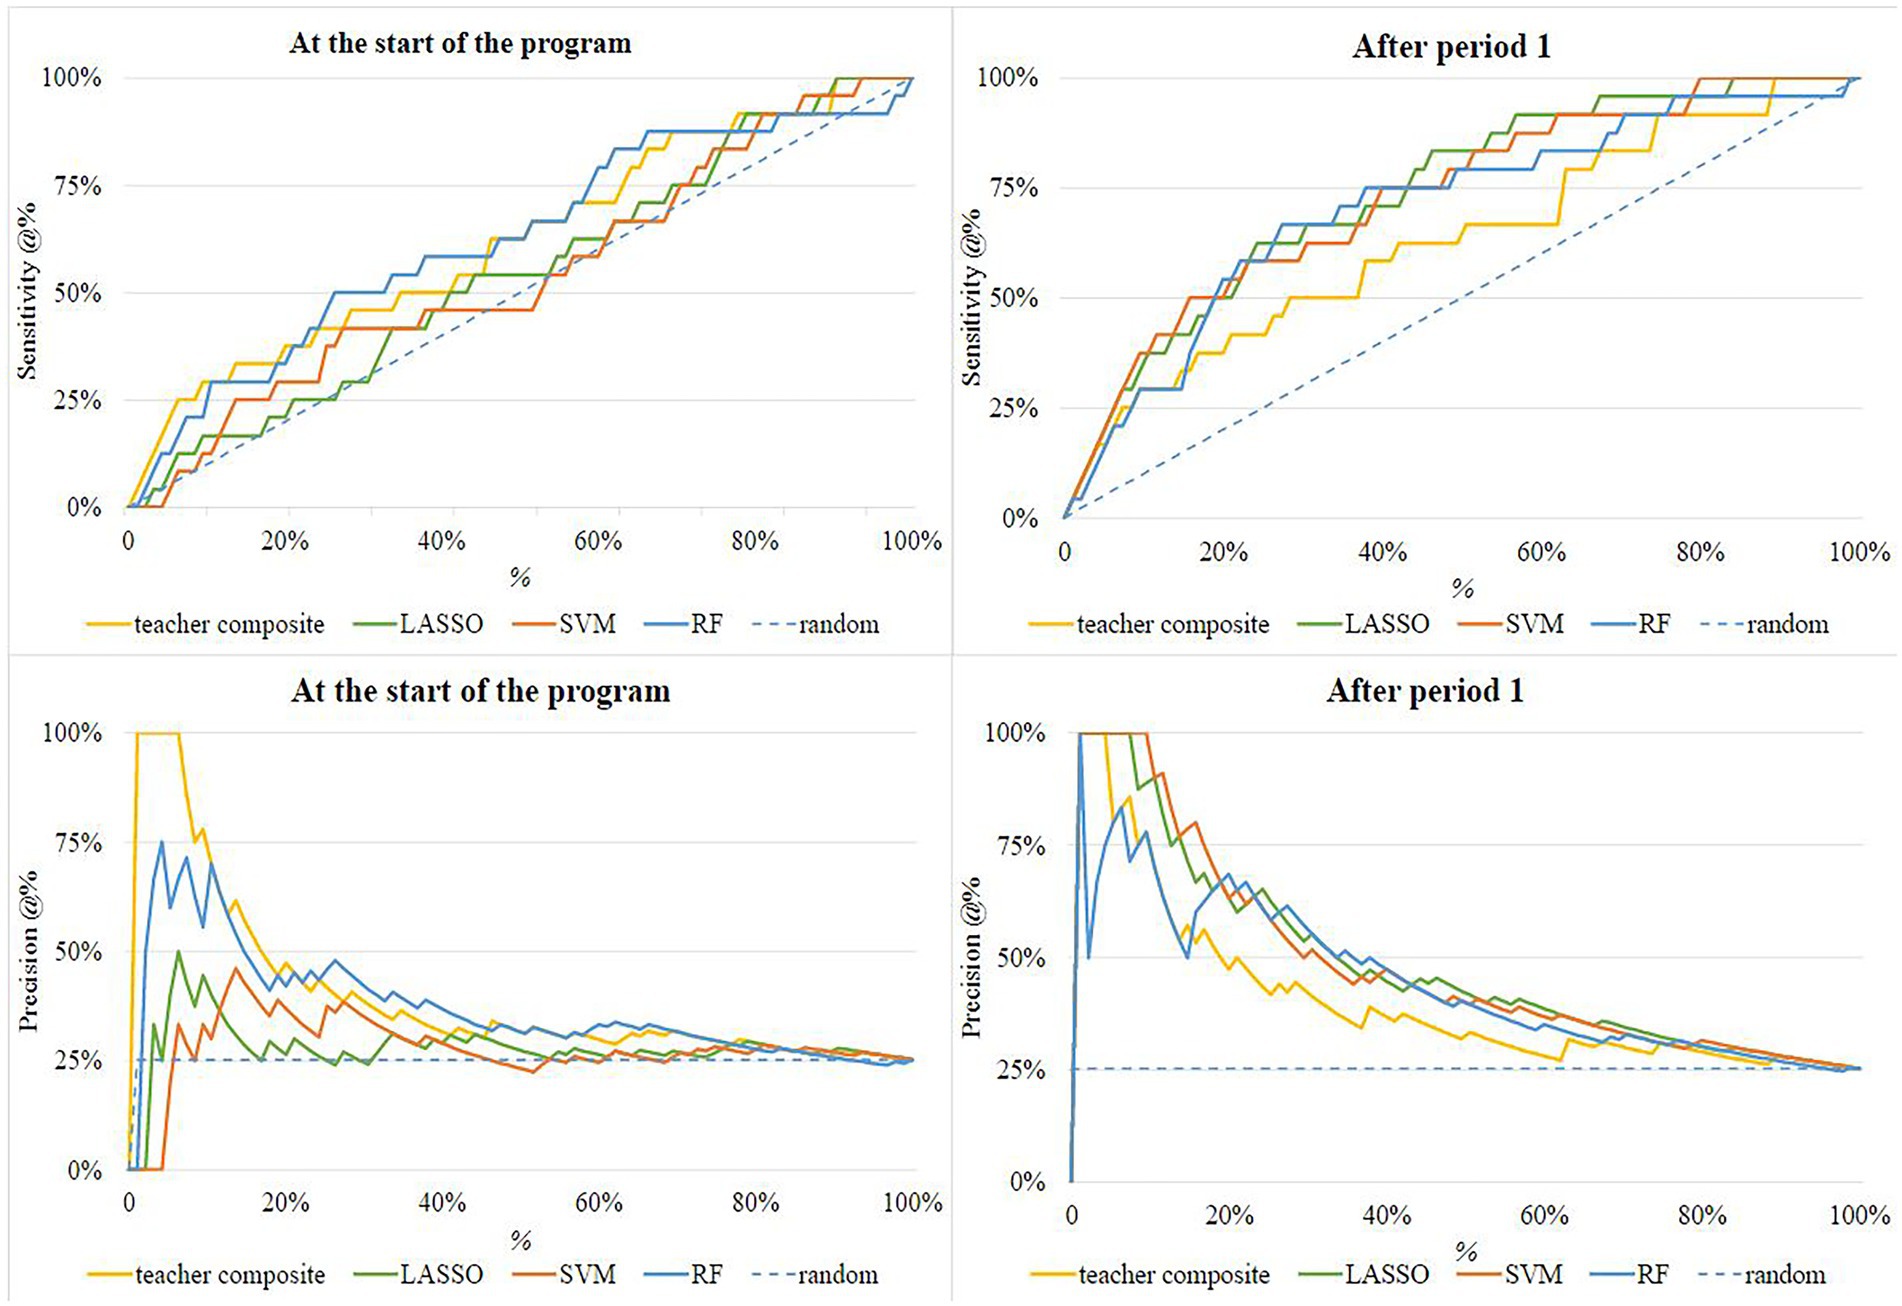
Figure 2. Sensitivity and Precision @% at the start of the program and after period 1. The dashed line represents the sensitivity with random invitation.
The two lower panels of Figure 2 show the correct predictions proportional to the total predicted number of students at risk for the percentage of the students invited (precision @%). The teacher composite and the Random Forest perform best in terms of precision: (1) the precision line is highest, and (2) there are no sudden drops in precision performance. The panel for precision @% at the start of the program shows that the teachers are 100% right about the first 6% of the dropped-out students. There is thus a group of students with a very low chance of success who are accurately identified by teachers but not by the models. After period 1 the SVM performs best with the first 9% of the students predicted with 100% correctness.
Next, we investigated whether a combination of teacher and machine learning predictions would outperform both. Figure 3 shows the sensitivity and precision plots at the start of the program, where the predictions of the teachers and the Random Forest model each contributed 50%, and a new student at-risk ranking was made. The combination (purple line in the figure) had better sensitivity than each separately, though not better precision.
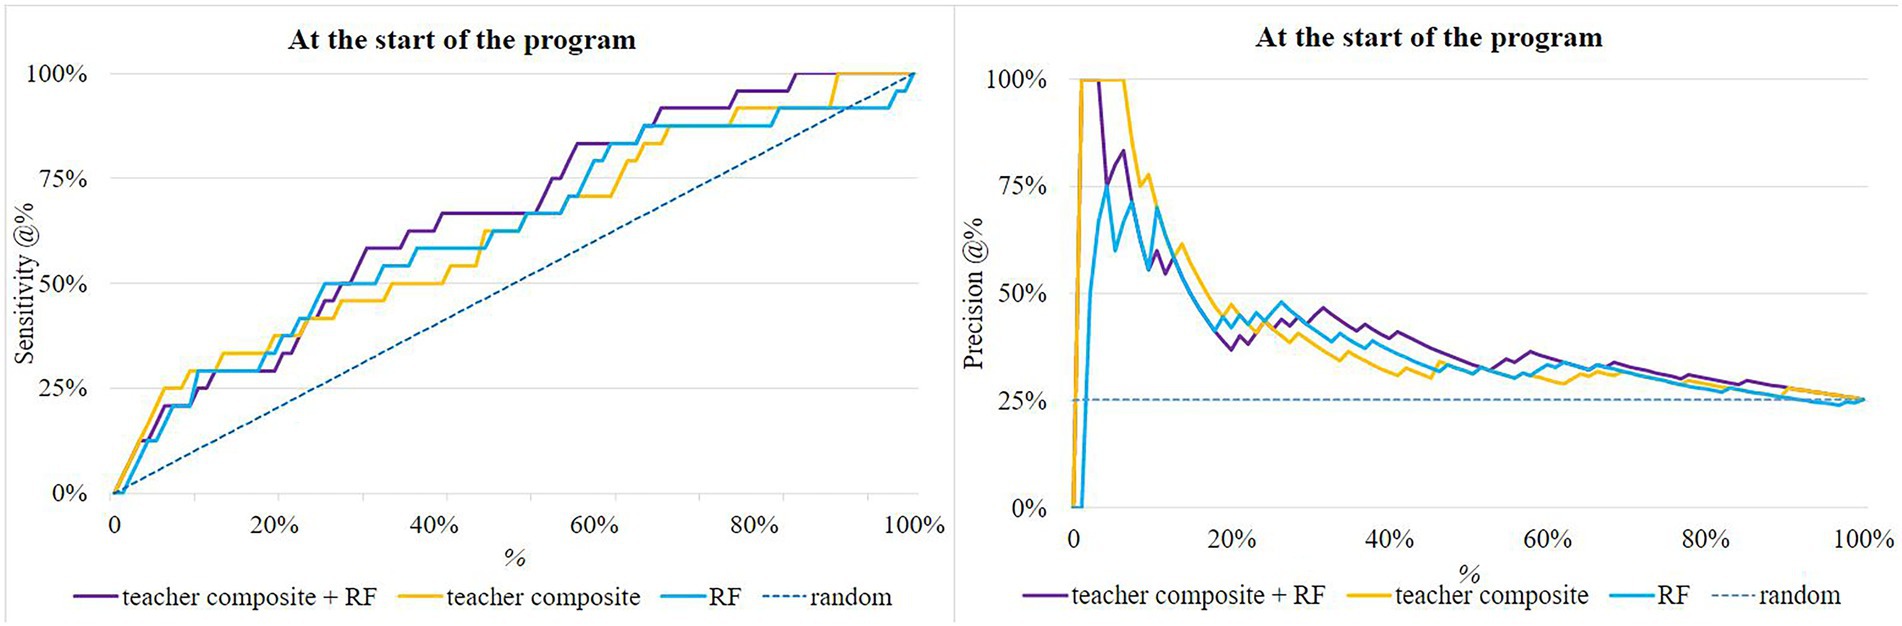
Figure 3. Sensitivity and Precision @% at the start of the program of the Random Forest, the teacher composite and a combination of both (“teacher composite + RF”). The dashed line represents the sensitivity of random invitation.
Teachers were asked what observations, strategies, feelings, or hunches they used to make their estimations. Figure 4 shows that observations like attendance, conversations with the student, and the behavior of the student in class were mentioned most at the start of the program. After period 1, observations like grades and the behavior of students toward fellow students became more important for teachers. Behavior toward fellow students is a broadly defined factor which includes behavior in and outside of the classroom, this type of behavior specifically focusses on the social interaction, where the two other types may also include individual, stand-alone actions. In addition, conversation with fellow teachers was a strategy mentioned often by the teachers. Individual teachers also mentioned at the start of the program that appearance (e.g., facial expressions), opinions of colleagues, and the fact that an internship was requested (which is mandatory in the first period, this must be done before the internship in question can be started) were part of the prediction. After period 1 no alternatives were mentioned.
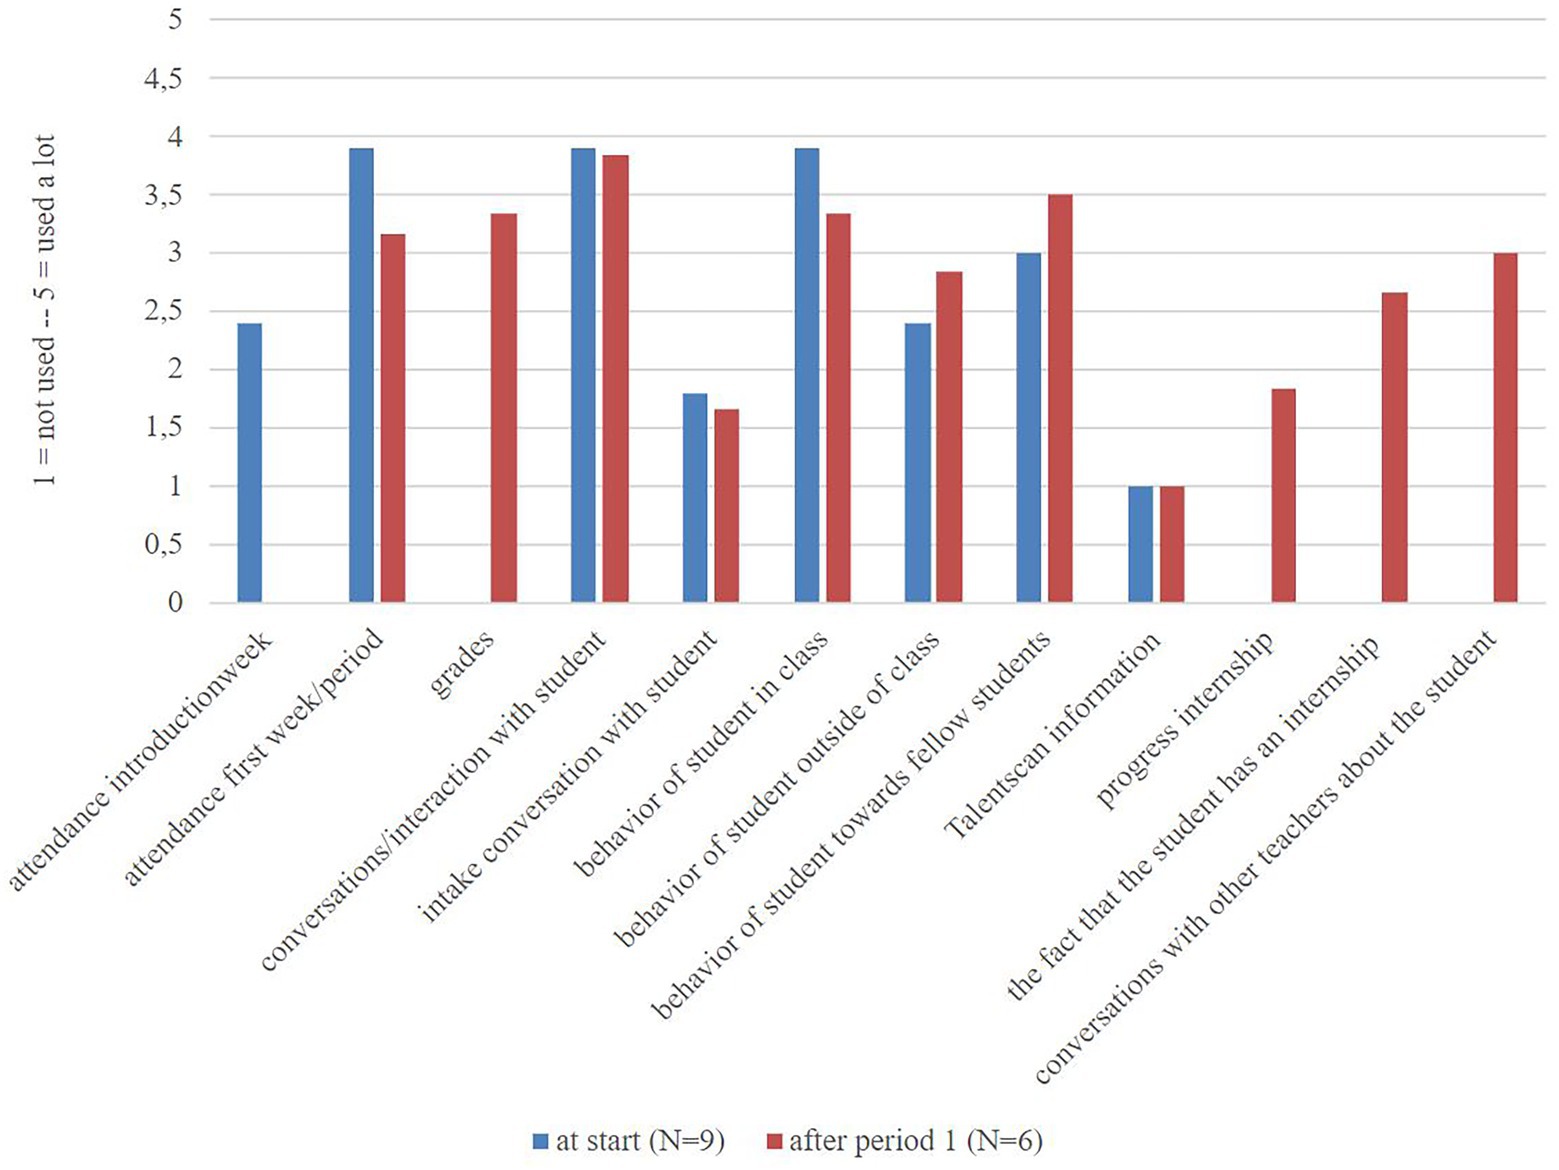
Figure 4. Teachers’ answers to questions about which observations, feelings, or hunches entered their estimations on a 5-point Likert scale at the start (N = 9) and after period 1 (N = 6).
Despite the abundance of machine learning related research (Kotsiantis, 2007; Tamada and Netto, 2019; Musso et al., 2020; Rastrollo-Guerrero et al., 2020; Zhai et al., 2020b, amonght others), most of the articles are focused on examining the accuracy of the machine learning algorithms, but not as much on the uses in the classroom. This study also focused on the enhancement of dropout predictions, however, we compared teacher predictions of students at risk of dropping out with several machine learning predictions. By doing this, the first step from just using machine learning algorithms to predict dropout, to combining this approach with input from teachers (and the step to practical application) has been made. Firstly, we examined if teachers can accurately predict future student dropouts at the start of the program, and secondly, we examined if combining the teacher predictions with the machine learning predictions will increase the prediction performance. Our results show that some individual teachers and the teacher composite could predict dropout at the start of the school year better than some machine learning algorithms. After the first period, when the first grades could be used in the predictions, the machine learning algorithms performed at least as well as teachers.
Teachers were not all equally good at making predictions. Whether these differences are attributable to the ability to predict or that the differences can be explained by random variation (noise) will have to be investigated in further research. Our calculated teacher composite performed better than most individual teachers. This is an example of the “Wisdom of the Crowds” where idiosyncratic noise of individual judgments can be canceled out by taking the average over a large number of responses (Surowiecki, 2004). By averaging the predictions of the teachers, they, as a crowd, predicted the true outcome (dropout or non-dropout) better, than most individual teachers. As mentioned by Zhai et al. (2020a,b) teachers may also interpret student information (and therefore make predictions) based on their experience rather than by strict criteria, which may bias the results. Machine learning might help to advance the use of a diverse set of evidence to make decisions and predictions. The answer to the question who predicts dropout best: computer or teacher, does not seem to be a matter of choice, but that prediction performance can be increased by combining computer with teacher.
One explanation for the differences in precision between teachers and algorithms at the start of the program is that teachers were able to speak to students, observe their behavior, and notice absence in their first week. Teachers may integrate these separate observations into a perspective on a student’s chances of success (van Wijk and van Kan, 2013). This information was not available for the algorithms. Observed attendance and student behavior, as well as conversations with students, were according to the teachers their most important source of information when predicting at-risk students. Teachers made a more accurate prediction after the first period, showing that the more informed teachers are, the better their prediction of at-risk students (Südkamp et al., 2012).
After the first period (i.e., after 2 months of teaching and the first set of exams), the teachers did not outperform the algorithms anymore. Teachers still mentioned interaction with and between students as an important observation, but grades as well. The latter was also available to the algorithms. There was thus more predictive information, and the task of teachers and algorithms becomes how to weigh this information to come to a good conclusion. In similar situations, computer algorithms have been shown to outperform humans, for example in the case of predicting recidivism (Lin et al., 2020).
A debate about what influence teachers’ judgments have on students’ academic achievement is ongoing. Teachers might be influencing the academic achievement of students because of their predictions about these students [i.e., they entertain self-fulfilling prophecies (Rosenthal and Jacobson, 1968)]. Jussim and Harber (2005) showed in their review, in which 35 years of empirical research on teacher expectations were brought together, that self-fulfilling prophecies do occur but that their effects are typically small. They also state that the reason teachers’ expectations, to a certain extent, predict student achievement is that teachers are simply accurate (and it is thus not a self-fulfilling prophecy).
In the context of this study, too, self-fulfilling prophecies are an unlikely explanation for our results. The teachers do not have the power, task, or intention to cause a student to drop out (i.e., to sabotage their studies or give the student the advice to stop the program). Most students are of compulsory school age, meaning that all efforts are aimed at retaining the students. When a student drops out of a program or has to stop following the program because of too low results, the student is guided to another (more suitable) program. Teachers have nothing to gain from causing dropouts because staff size depends on student numbers. A more obvious explanation for accurate teacher predictions than a self-fulfilling prophecy is therefore that the teachers had a good intuition based on their experiences.
Our study addressed predicting student dropout for targeting interventions. Whether this is of any use to students or institutions depends on whether interventions are successful, which was not studied here. Moreover, we also did not study any potential side effects of targeting. Identifying struggling students as early as possible could lead to such a student being stigmatized and limited in their process of academic capital formation. This would be particularly painful because algorithms and teachers can label students wrongly as at risk. However, early targeting might also lead to students being helped before it is too late. In Dutch vocational education, there is a large safety net for students who appear to have problems during the program. Students, therefore, are already targeted for interventions. This occurs after when grades within the program disappoint. This information is only available at the moment when efforts to keep a student in the program might be too late and the student will drop out regardless of all the effort of the counsellors (Eegdeman et al., 2020). With algorithms, counsellors could have at-risk (but probably also a few potential successful) students earlier in sight and start guidance or other help earlier to help the student within the program or to find another more suitable program.
The sensitivity and precision @% approach as shown in Eegdeman et al. (2022) shows the sensitivity-precision trade-off and acts as a planner for making informed decisions on which students, and at which point throughout the school year, should be invited for an intervention. However, we showed that their precision results for the start of the educational program are rather erratic, such that, from the perspective of efficient capacity use, inviting students already at the start of the program does not seem optimal. Because teachers were only asked about their predictions for one cohort, we were not able to incorporate the teacher composite into the machine learning algorithms. But we were able to show that, by simply averaging both estimates, the predictions of the teachers already increase model performance. Future research might assess whether including teacher predictions at the start of the program as potential features to be selected by the machine learning algorithms allow these algorithms to increase their accuracy. Doing so might enable a highly targeted approach in combatting student dropout in the face of capacity constraints for counseling or participation in dropout prevention programs.
This study was conducted exclusively in one vocational education program with a relatively small sample of nine teachers. The results may be specific to Dutch vocational education, but the program may also not be highly representative of all vocational education. It is focused on sports, and the dropout rate of this program is relatively high (25% compared to an average dropout percentage of 15% in programs at the same level). Replication of the results is needed for generalization. For now, the results might be mostly an existence proof that teachers can be more accurate than algorithms in predicting dropout at the start of the program, not that they typically are.
Moreover, what information teachers used was only asked retroactively, using broad answer categories that do not allow us to be very specific about how teachers came to their predictions. Factors such as financial security and side jobs, which are known to affect retention and dropout, were not included as answer categories. It might be that teachers know about some of these factors, though it is rather unlikely that they would right at the start of the program. What factors teachers based their predictions remain to be investigated in future studies. Also, the sample was too small to know whether there is meaningful variation in the accuracy of teacher predictions and whether this would correlate with teacher characteristics.
With the limitations taken into consideration, our study has shown that teachers can, with some accuracy, predict student dropout right at the start of the program and that their gut feeling can increase the accuracy of predictions using machine learning algorithms.
The raw data supporting the conclusions of this article will be made available by the authors, without undue reservation.
The studies involving human participants were reviewed and approved by the Scientific and Ethical Review Board of the Faculty of Behavioral and Movement Sciences, Vrije Universiteit Amsterdam (#2019-088) the research fell under a protocol that was approved. The patients/participants provided their written informed consent to participate in this study.
IE, IC, CK, and MM contributed to conception, design and statistical plan of the study. IE organized the data collection, performed the statistical analysis, and wrote the first draft of the manuscript. All authors contributed to manuscript revision, read, and approved the submitted version.
This work was supported by the Netherlands Organization for Scientific Research (NWO) (grant no: 023.008.023).
IE works within the institution that was subject to the research.
The remaining authors declare that the research was conducted in the absence of any commercial or financial relationships that could be construed as a potential conflict of interest.
All claims expressed in this article are solely those of the authors and do not necessarily represent those of their affiliated organizations, or those of the publisher, the editors and the reviewers. Any product that may be evaluated in this article, or claim that may be made by its manufacturer, is not guaranteed or endorsed by the publisher.
The Supplementary material for this article can be found online at: https://www.frontiersin.org/articles/10.3389/feduc.2022.976922/full#supplementary-material
1. ^They indicated their degree of certainty by choosing one of three categories: "smaller chance of dropout," "greater chance of dropout," and "high degree of confidence." If a teacher chose the last option, the teacher had high confidence in either the prediction successful, or the prediction dropout.
Battin-Pearson, S., Newcomb, M. D., Abbott, R. D., Hill, K. G., Catalano, R. F., and Hawkins, J. D. (2000). Predictors of early high school dropout: a test of five theories. J. Educ. Psychol. 92, 568–582. doi: 10.1037/0022-0663.92.3.568
Central Bureau for Statistics (2022). Statistics Netherlands: Unemployment by education level. Retrieved from https://www.cbs.nl/nl-nl/visualisaties/dashboard-arbeidsmarkt/werklozen/werkloosheid-naar-onderwijsniveau
Đambić, G., Krajcar, M., and Bele, D. (2016). Machine learning model for early detection of higher education students that need additional attention in introductory programming courses. Int. J. Digit. Technol. Econ. 4, 1–8. doi: 10.31785/ijdte.4.1.1
Eegdeman, I., Cornelisz, I., Meeter, M., and Klaveren, C. (2022). Identifying false positives when targeting students at risk of dropping out. Educ. Econ., 1–13. doi: 10.1080/09645292.2022.2067131
Eegdeman, I., Meeter, M., and Van Klaveren, C. (2018). Cognitive skills, personality traits and dropout in Dutch vocational education. Empirical Res. Vocat. Educ. Train. 10:18. doi: 10.1186/s40461-018-0072-9
Eegdeman, I., van Klaveren, C., and Meeter, M. (2020). Content expectations and dropout in Dutch vocational education. Empirical Res. Vocat. Educ. Train. 12, 1–23. doi: 10.1186/s40461-020-00096-7
Hastie, T., Tibshirani, R., and Friedman, J. (2009). The Elements of Statistical Learning: Data Mining, Inference, and Prediction. 2nd Edn. Springer
Inspectorate of Education (2021). Staat van het onderwijs 2021. Ministry of Education, Culture and Science https://www.onderwijsinspectie.nl/onderwerpen/staat-van-het-onderwijs/documenten/rapporten/2021/04/14/de-staat-van-het-onderwijs-2021
Janosz, M., Le Blanc, M., Boulerice, B., and Tremblay, R. (2000). Predicting different types of school dropouts: a typological approach with two longitudinal samples. J. Educ. Psychol. 92, 171–190. doi: 10.1037/0022-0663.92.1.171
Jussim, L., and Harber, K. D. (2005). Teacher expectations and self-fulfilling prophecies: knowns and unknowns, resolved and unresolved controversies. Personal. Soc. Psychol. Rev. 9, 131–155. doi: 10.1207/s15327957pspr0902_3
Kotsiantis, S. B. (2007). Supervised machine learning: a review of classification techniques. Informatica 31, 249–268.
Kotsiantis, S. B., Pierrakeas, C. J., and Pintelas, P. E. (2003). “Preventing student dropout in distance learning using machine learning techniques,” in Knowledge-Based Intelligent Information and Engineering Systems. eds. V. Palade, R. J. Howlett, and L. C. Jain, vol. 2774, 267–274. Berlin Heidelberg: Springer-Verlag.
Lin, Z., Jung, J., Goel, S., and Skeem, J. (2020). The limits of human predictions of recidivism. Sci. Adv. 6, eaaz0652–eaaz0659. doi: 10.1126/sciadv.aaz0652
Lykourentzou, I., Giannoukos, I., Nikolopoulos, V., Mpardis, G., and Loumos, V. (2009). Dropout prediction in e-learning courses through the combination of machine learning techniques. Comput. Educ. 53, 950–965. doi: 10.1016/j.compedu.2009.05.010
Musso, M. F., Cascallar, E. C., Bostani, N., and Crawford, M. (2020). Identifying reliable predictors of educational outcomes through machine-learning predictive modeling. Front. Educ. 5, 1–19. doi: 10.3389/feduc.2020.00104
Nederlands Jeugdinsitituut (2022). Cijfers over jeugdwerkloosheid. Retrieved from https://nji.nl/cijfers/jeugdwerkloosheid
O’Connor, M. C., and Paunonen, S. V. (2007). Big five personality predictors of post-secondary academic performance. Personal. Individ. Differ. 43, 971–990. doi: 10.1016/j.paid.2007.03.017
O’Cummings, M., and Therriault, S. B. (2015). From Accountability to Prevention: Early Warning Systems Put Data to Work for Struggling Students. American Insitures fro Research, Wachington, DC.
Paunonen, S. V., and Ashton, M. C. (2001). Big five factors and facets and the prediction of behavior. J. Pers. Soc. Psychol. 81, 524–539. doi: 10.1037/0022-3514.81.3.524
Plak, S., Cornelisz, I., Meeter, M., and van Klaveren, C. (2022). Early Warning Systems for More Effective Student Counseling in Higher Education: Evidence from a Dutch Field Experiment.76, 131–152. doi: 10.1111/hequ.12298
Rastrollo-Guerrero, J. L., Gómez-Pulido, J. A., and Durán-Domínguez, A. (2020). Analyzing and predicting students’ performance by means of machine learning: a review. Appl. Sci. 10, 1–16. doi: 10.3390/app10031042
Rosenthal, R., and Jacobson, L. (1968). Pygmalion in the classroom. Urban Rev. 3, 16–20. doi: 10.1007/BF02322211
Sansone, D. (2019). Beyond early warning indicators: high school dropout and machine learning. Oxf. Bull. Econ. Stat. 81, 456–485. doi: 10.1111/obes.12277
Savi, A. O., Cornelisz, I., Sjerps, M. J., Greup, S. L., Bres, C., and van Klaveren, C. (2020). Balancing Trade-Offs in the Detection of Schools at Risk.
Savi, A. O., Cornelisz, I., Sjerps, M. J., Greup, S. L., Bres, C. M., and van Klaveren, C. (2021). Balancing trade-offs in the detection of primary schools at risk. Educ. Meas. Issues Pract. 40, 110–124. doi: 10.1111/emip.12433
Südkamp, A., Kaiser, J., and Möller, J. (2012). Accuracy of teachers’ judgments of students’ academic achievement: a meta-analysis. J. Educ. Psychol. 104, 743–762. doi: 10.1037/a0027627
Surowiecki, J.. (2004). PThe wisdom of crowds: Why the many are smarter than the few and how collective Wisdom Shapes Business, Economics, Societies and Nations, Little, Brown.
Tamada, M. M., and Netto, J. (2019). Predicting and Reducing Dropout in Virtual Learning Using Machine Learning Techniques: A Systematic Review. IEEE Frontiers in Education Conference (FIE), 2019, pp. 1–19. doi: 10.1109/FIE43999.2019.9028545
van Wijk, B., and van Kan, C. (2013). Vroegtijdig Signaleren Van Onderwijsuitval. Available at: https://ecbo.nl/onderzoekspublicatie/vroegtijdig-signaleren-van-onderwijsuitval/ (Accessed February 2022).
Zhai, X., Haudek, K. C., Shi, L., Nehm, R. H., and Urban-Lurain, M. (2020a). From substitution to redefinition: a framework of machine learning-based science assessment. J. Res. Sci. Teach. 57, 1430–1459. doi: 10.1002/tea.21658
Keywords: dropout, prediction, machine learning, teachers’ gut feeling, vocational education
Citation: Eegdeman I, Cornelisz I, van Klaveren C and Meeter M (2022) Computer or teacher: Who predicts dropout best? Front. Educ. 7:976922. doi: 10.3389/feduc.2022.976922
Edited by:
Xiaoming Zhai, University of Georgia, United StatesReviewed by:
Teresa Pozo-Rico, University of Alicante, SpainCopyright © 2022 Eegdeman, Cornelisz, van Klaveren and Meeter. This is an open-access article distributed under the terms of the Creative Commons Attribution License (CC BY). The use, distribution or reproduction in other forums is permitted, provided the original author(s) and the copyright owner(s) are credited and that the original publication in this journal is cited, in accordance with accepted academic practice. No use, distribution or reproduction is permitted which does not comply with these terms.
*Correspondence: Irene Eegdeman, aS5lZWdkZW1hbkB2dS5ubA==
†ORCID: Irene Eegdeman, orcid.org/0000-0001-5543-8294
Disclaimer: All claims expressed in this article are solely those of the authors and do not necessarily represent those of their affiliated organizations, or those of the publisher, the editors and the reviewers. Any product that may be evaluated in this article or claim that may be made by its manufacturer is not guaranteed or endorsed by the publisher.
Research integrity at Frontiers
Learn more about the work of our research integrity team to safeguard the quality of each article we publish.