 Leanne R. Ketterlin-Geller
 Anthony Sparks
 Jennifer McMurrer
95% of researchers rate our articles as excellent or good
Learn more about the work of our research integrity team to safeguard the quality of each article we publish.
Find out more
ORIGINAL RESEARCH article
Front. Educ. , 26 September 2022
Sec. Educational Psychology
Volume 7 - 2022 | https://doi.org/10.3389/feduc.2022.940994
This article is part of the Research Topic Progress Monitoring and Data-Based Decision-Making in Inclusive Schools View all 14 articles
Progress monitoring is a process of collecting ongoing samples of student work and tracking performance of individual students over time. Progress monitoring involves administering parallel sets of items to the same student on a regular basis (at least monthly) that are sensitive to changes in the student’s understanding based on instruction. The sets of items administered over time should be parallel in difficulty so that differences in performance can be attributed to differences in the student’s understanding as opposed to variability in item difficulty across sets. In this manuscript, we describe an approach to designing items that controls item-level variability by constraining the item features that may elicit different cognitive processing. This approach adapts the principles of Automated Item Generation (AIG) and includes carefully designing test specifications, isolating specific components of the content that will be assessed, creating item models to serve as templates, duplicating the templates to create parallel item clones, and verifying that the duplicated item clones align with the original item model. An example from an operational progress monitoring system for mathematics in Kindergarten through Grade 6 is used to illustrate the process. We also propose future studies to empirically evaluate the assertion of parallel form difficulty.
Multi-tiered systems of support (MTSS) and data-based individualization (DBI) represent systems-level frameworks in which instruction and assessment are integrated into one coherent system with the goal of supporting positive outcomes for all students. These frameworks provide systematic approaches to link assessment results with classroom-level decisions to better align instruction with students’ needs (Choi et al., 2017). Data from different assessments (e.g., universal screeners, diagnostic assessments, progress monitoring measures) are associated with specific instructional decisions so as to provide teachers with guidance for interpreting student performance. As data are interpreted and teachers make decisions, they implement tiered instruction (e.g., Tier 1 Core Instruction, Tier 2 Intervention, Tier 3 Intensive Intervention) using evidence-based practices. As a result of implementing MTSS and DBI, teachers align students’ learning needs as evidenced by assessment results with evidence-based instructional practices to support positive outcomes for all students (Powell et al., 2021).
A key decision underlying MTSS and DBI is determining whether students are making adequate progress to reach their learning goals (Ketterlin-Geller et al., 2019). The importance of this decision cannot be overstated because it serves as the key lever for changing students’ instructional opportunities. If students are not making adequate progress toward their learning goals, it is incumbent on teachers to responsively change their instruction to better align with students’ learning needs. Continually monitoring students’ progress during the learning process provides teachers with the data they need to make these decisions.
In a typical mathematics classroom, teachers use various approaches to monitor student learning including gathering data from both formal (e.g., quizzes, projects) and informal (e.g., questioning, noticing) sources. These data serve many purposes within the instructional decision-making framework such as identifying students’ prior knowledge, understanding students’ reasoning, or examining their flexibility using various representations or knowledge forms. Although these data help teachers understand student learning, they have limited utility for formally monitoring progress.
Within MTSS and DBI, formally monitoring progress refers to a systematic process of collecting ongoing samples of student work and tracking performance of individual students over time. The student’s prior performance serves as the reference point for evaluating changes in understanding. The student’s work samples must be taken from item sets that are administered over time. These item sets—sometimes referred to as progress monitoring probes—may take on different forms (such as reading passages, sentence completion), but in mathematics, they typically resemble a traditional test with items arranged in rows and columns on one or more pieces of paper. To monitor progress over time, teachers need approximately 20 probes that all measure the same construct and are of comparable difficulty so that changes in performance can be attributed to changes in student understanding, as opposed to variability in item difficulty. These concepts grew out of the work on curriculum-based measurement (CBM; Deno, 2003).
Research and development work on CBM as an approach to monitoring progress in mathematics began over 35 years ago, and has evolved considerably over the years (c.f., Fuchs, 2004; Dawes et al., 2022). Although a large concentration of work has been done in elementary grades, CBMs have extended into early grades mathematics (c.f., Fuchs et al., 2007; Clarke et al., 2008) and secondary mathematics (c.f., Foegen et al., 2008). Mathematics CBMs most often measure grade-level computational fluency expectations, but some progress monitoring systems also include measures of students’ conceptual understanding and application (Foegen et al., 2007). Recent research has explored the use of single-skill computational fluency measures (c.f., VanDerHeyden and Broussard, 2021; Dawes et al., 2022), yet more research is needed to determine whether this approach provides meaningful progress monitoring data over time (Fuchs, 2004). It follows that the assessed content of many mathematics CBMs may not represent the full depth and breadth of the grade-level content standards; however, the assessed content should be predictive of future outcomes and sensitive to small changes in students’ understanding. To facilitate progress monitoring decisions, mathematics CBMs should be quick and easy to administer, efficient to score, and be psychometrically sound (Fuchs, 2004). Progress monitoring systems available from vendors, universities, or other resources have different characteristics and features so the probes are only considered parallel if they originate from within one progress monitoring system.
Tracking performance over time involves frequent administration of progress monitoring probes and graphing individual student’s data. The most common administration frequency is weekly or every-other week, and no less frequently than monthly (Gersten et al., 2009). To accommodate this frequency within a school year, progress monitoring systems need to have at least 20 parallel forms. A comprehensive description of the data analysis and interpretation process is outside the scope of this manuscript. In brief, data are typically organized graphically for each individual student after multiple progress monitoring probes have been administered and teachers have a sufficient number of data points for making reliable interpretations. The slope of the line is interpreted as the student’s observed rate of growth. This rate is compared to a goal rate that is typically established using published growth rates and the student’s baseline score (see Jung et al., 2018 for research on the outcomes of different decision-making rules). Because the student’s own performance serves as the interpretive lens for evaluating change over time, progress monitoring emphasizes growth and may facilitate positive associations between effort and outcome.
As we have emphasized, multiple parallel forms of the same construct are needed to monitor individual student’s progress over time. Historically, parallel forms have been created and evaluated in one of two ways: (1) placing similar items on forms that are statistically compared for consistency (e.g., parallel form reliability), or (2) creating calibrated item banks such that all possible items are on the same scale (e.g., computerized adaptive tests [CAT]). Both of these approaches result in comparable scores across progress monitoring probes; however, methodological issues and inconsistent content may compromise the validity and reliability of these approaches.
Methodologically, these approaches require sufficiently large validation studies to evaluate the comparability of the forms and items. When statistically comparing forms for consistency, there are two common methods. First, the reliability of the alternate forms can be evaluated using a Classical Test Theory approach. Each of the 20 forms are administered to the same sample of students who are representative of the target population. Cross-correlation matrices are generated to evaluate the reliability of each parallel form. Second, a statistical method can be used to create statistically parallel forms of the same test called equating, which transforms raw scores to scale scores that are comparable (Kolen and Brennan, 2014). Equating is a process that results in interchangeable scores across multiple forms by statistically adjusting the scale so that the scores from each form have the same meaning when interpreted (American Educational Research Association [AERA] et al., 2014). One approach to equating is called common-subject equating, and uses a similar method as was described for calculating parallel-form reliability in which each of the 20 forms are administered to the same sample of students (Kolen and Brennan, 2014). Data from these students are used to adjust for differences in difficulty found across forms. Although this is a viable approach for equating parallel forms of some tests, given the 20 forms needed for progress monitoring systems, these designs place a burden on the students participating in the study.
Another way to create progress monitoring systems with multiple parallel forms is by using a calibrated item bank, such as a CAT. To create a CAT, items are typically calibrated using item response theory (IRT) modeling. Hundreds of items are needed to create an item bank sufficiently wide to reliably measure students with a range of ability levels and to administer 20 parallel forms without repeated exposure of the same item. All items need to be field tested using an equating designs so as to place all items on the same scale. Depending on the number of parameters being estimated, each item requires 250–1,000 responses for accurate calibration (Rupp, 2003). Given the large sample of students needed to calibrate the large set of items, the costs and timeliness of this approach may be prohibitive. As such, methodological issues limit the feasibility of these approaches for creating parallel forms within a progress monitoring system.
In addition to methodological issues associated with statistical approaches to evaluating comparability of parallel forms, the underlying assumptions of content comparability may not be tenable. To support valid decision-making regarding students’ progress, data should facilitate inferences about students’ growth on consistently measured content standards. If the content of the progress monitoring measures changes over time, students may perform differently across forms for reasons that are not necessarily related to learning the targeted knowledge and skills. Two salient issues emerge: (1) items may have similar difficulty statistics (e.g., p-values, item difficulty parameters) but cover different content, and (2) content differences may differentially impact students’ responding behaviors based on prior knowledge, exposure or opportunity to learn the content, fluency across number ranges and systems, etc. These differences may lead to increases or decreases in students’ scores on the progress monitoring probes that do not accurately reflect changes in understanding. As such, teachers’ interpretations of growth (or lack thereof) may be inaccurate, thereby jeopardizing the validity of their decision making.
To illustrate the challenges of using item difficulty statistics to evaluate comparability, consider the released items from the Grade 4 National Assessment of Educational Progress (NAEP) in Mathematics administered in 2017 presented in Figure 1. Figure 1 displays two items from the “Number properties and operations” domain within NAEP and the estimate of item difficulty expressed as p-values (proportion of students responding correctly to the total number of respondents). Item 1 requires students to solve a multi-step problem in context. Item 2 focuses on place value understanding, and assesses students’ ability to identify the number represented by a set of based-ten blocks. Even though these items assess the same mathematical domain and the p-values indicate comparable difficulty, they measure different mathematical content that may elicit different levels of cognitive engagement that impact individual student’s responding behaviors. As such, aggregated statistics might mask differences in individual student’s performance. In instances where these statistics are used to determine form comparability for progress monitoring probes, students may perform differently across forms that is not due to growth.
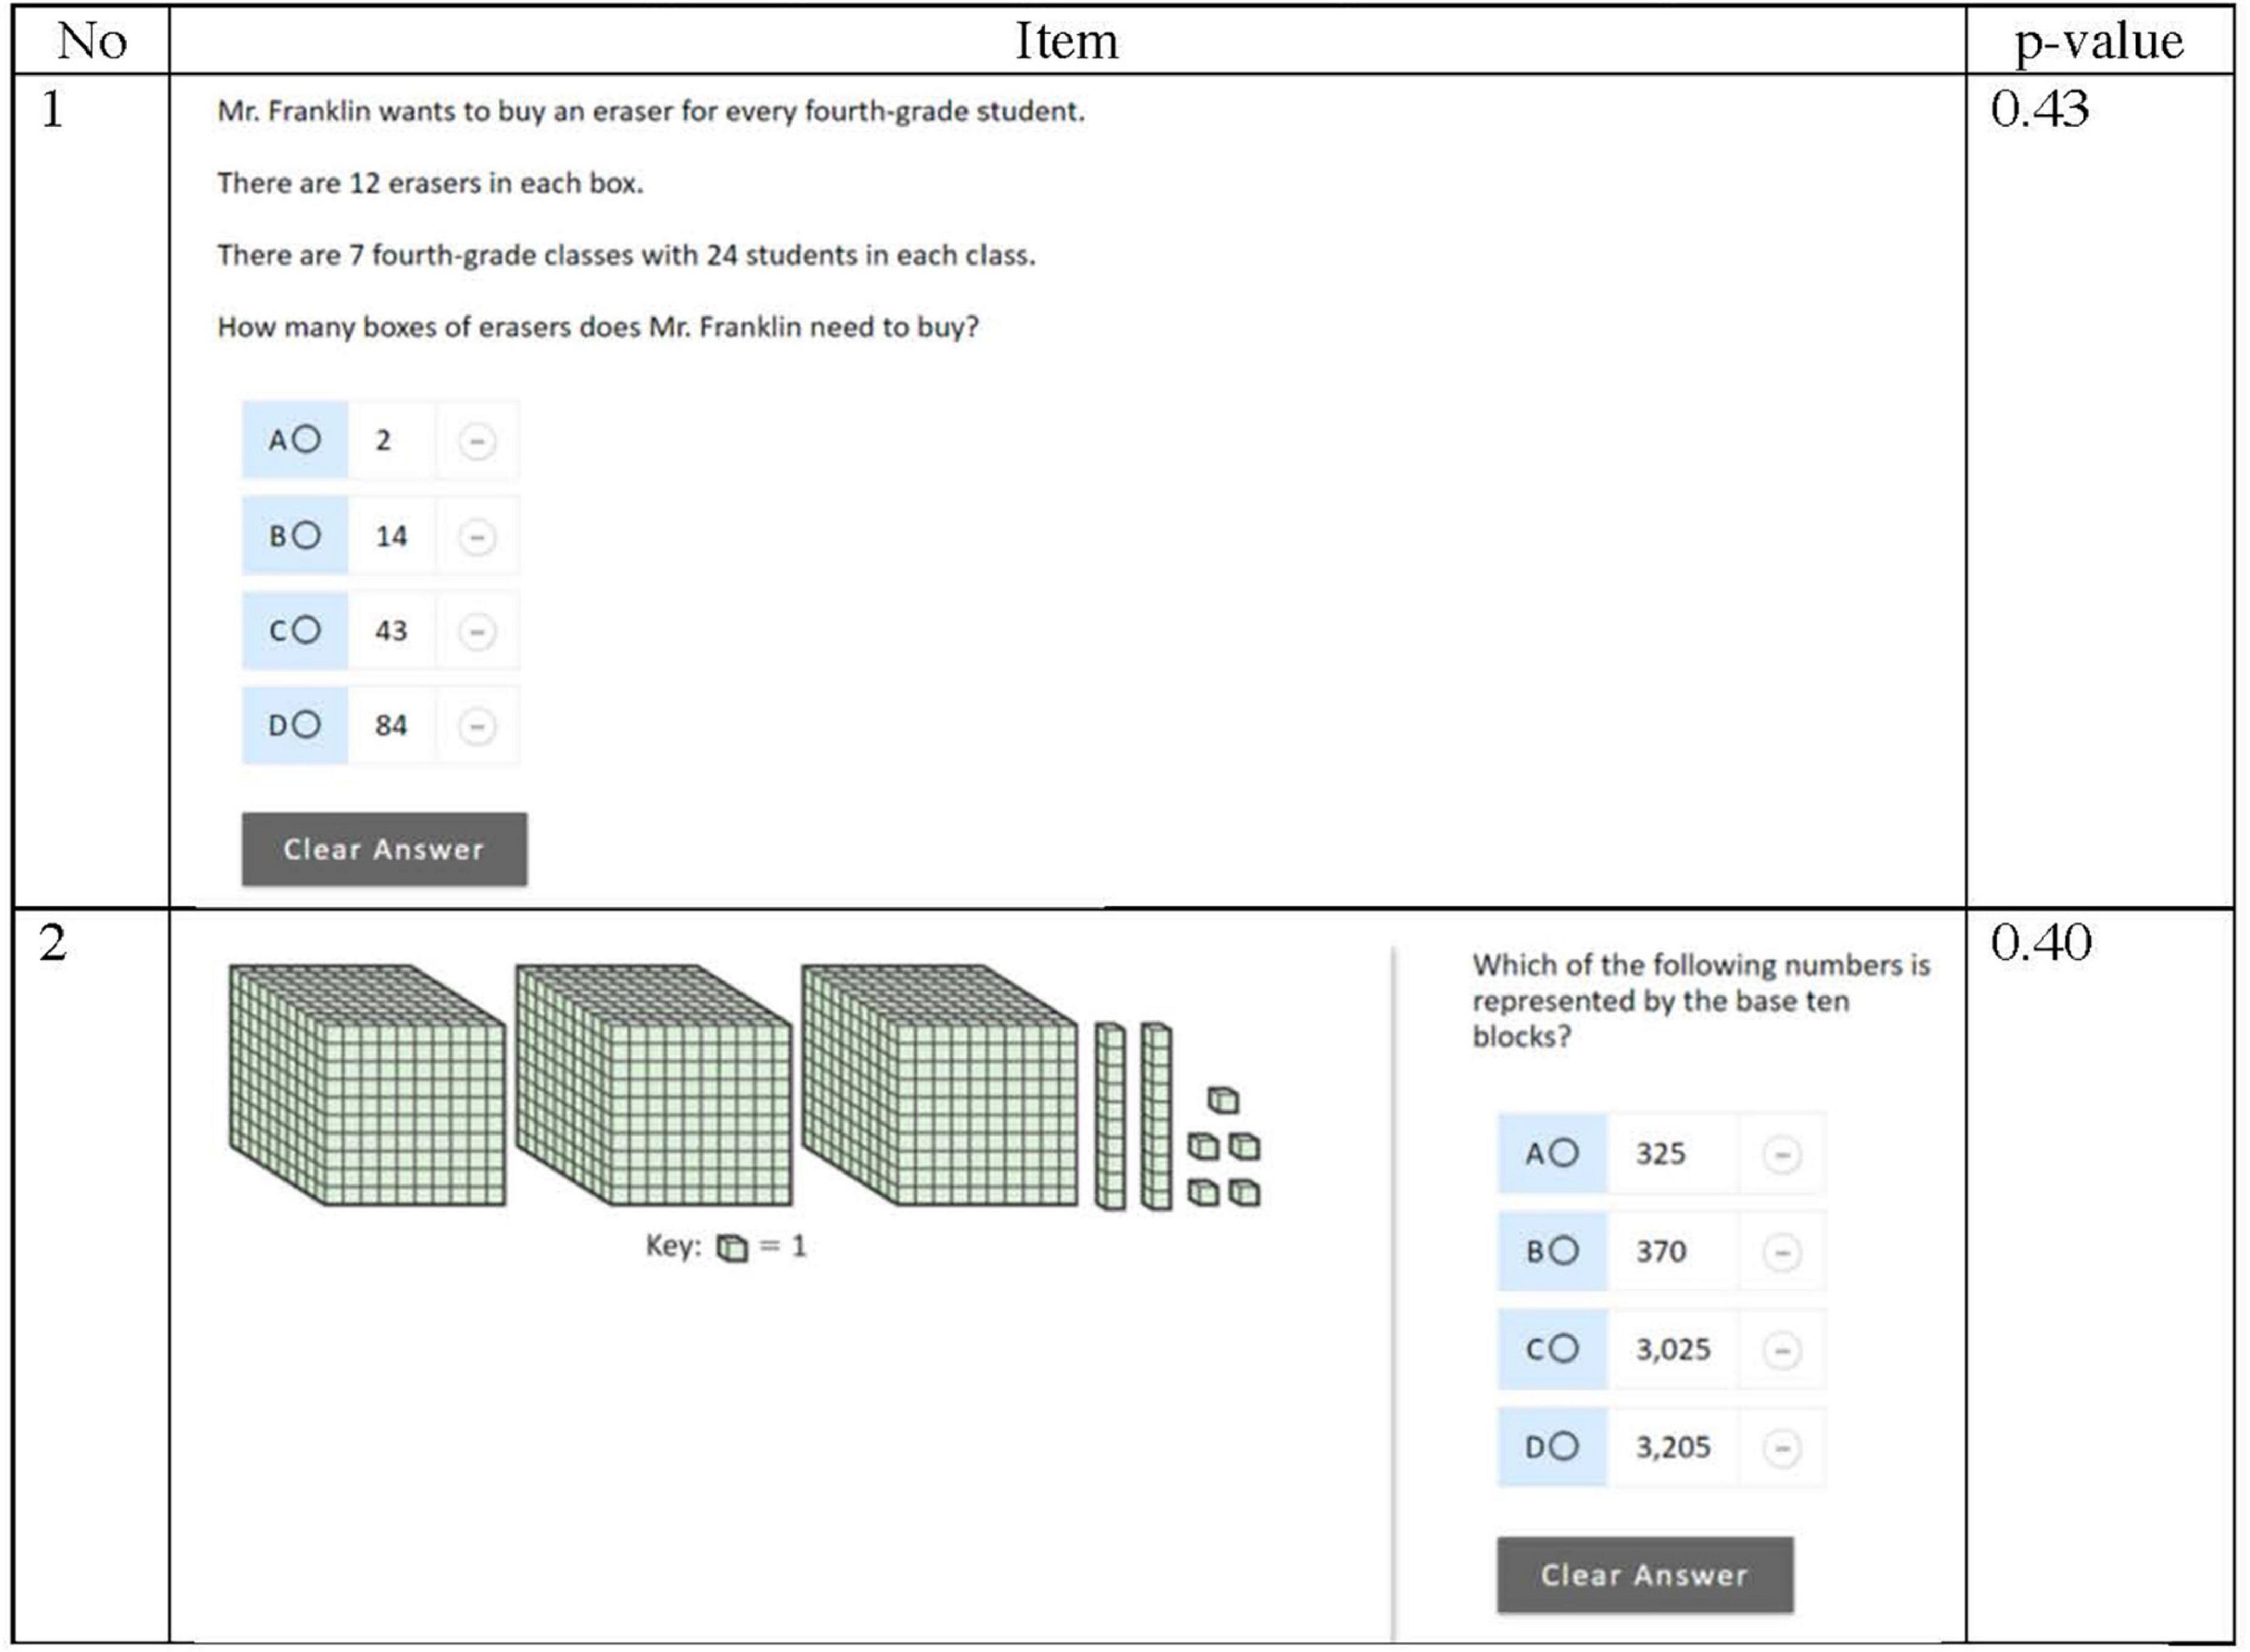
Figure 1. NAEP items with similar difficulty assessing number properties and operations. Source: U.S. Department of Education, Institute of Education Sciences, National Center for Education Statistics, National Assessment of Educational Progress (NAEP), 2017 Mathematics Assessment.
Even when content is held constant, subtle differences in wording or students’ opportunity to learn the content may impact item difficulty. To illustrate these issues, consider the following released items from the Grade 4 NAEP in Mathematics that are designed to assess students’ ability to use place value to determine the amount of increase or decrease in whole numbers. Figure 2 includes two items and their respective p-values as reported by NAEP. Both items require students to identify by how much a given number would increase if the value of a specific digit were changed. Item 1 was considerably less difficulty than Item 2 in that 62% of the respondents answered correctly as compared to 36% for Item 2. For Item 1, the distractors were selected roughly equally with less than 15% of the respondents selecting any one distractor; Distractor B was selected the least at 8%. For Item 2, Distractors A and C were selected by 22% of the respondents, and Distractor D was selected by 14% (6% of the respondents omitted this question).
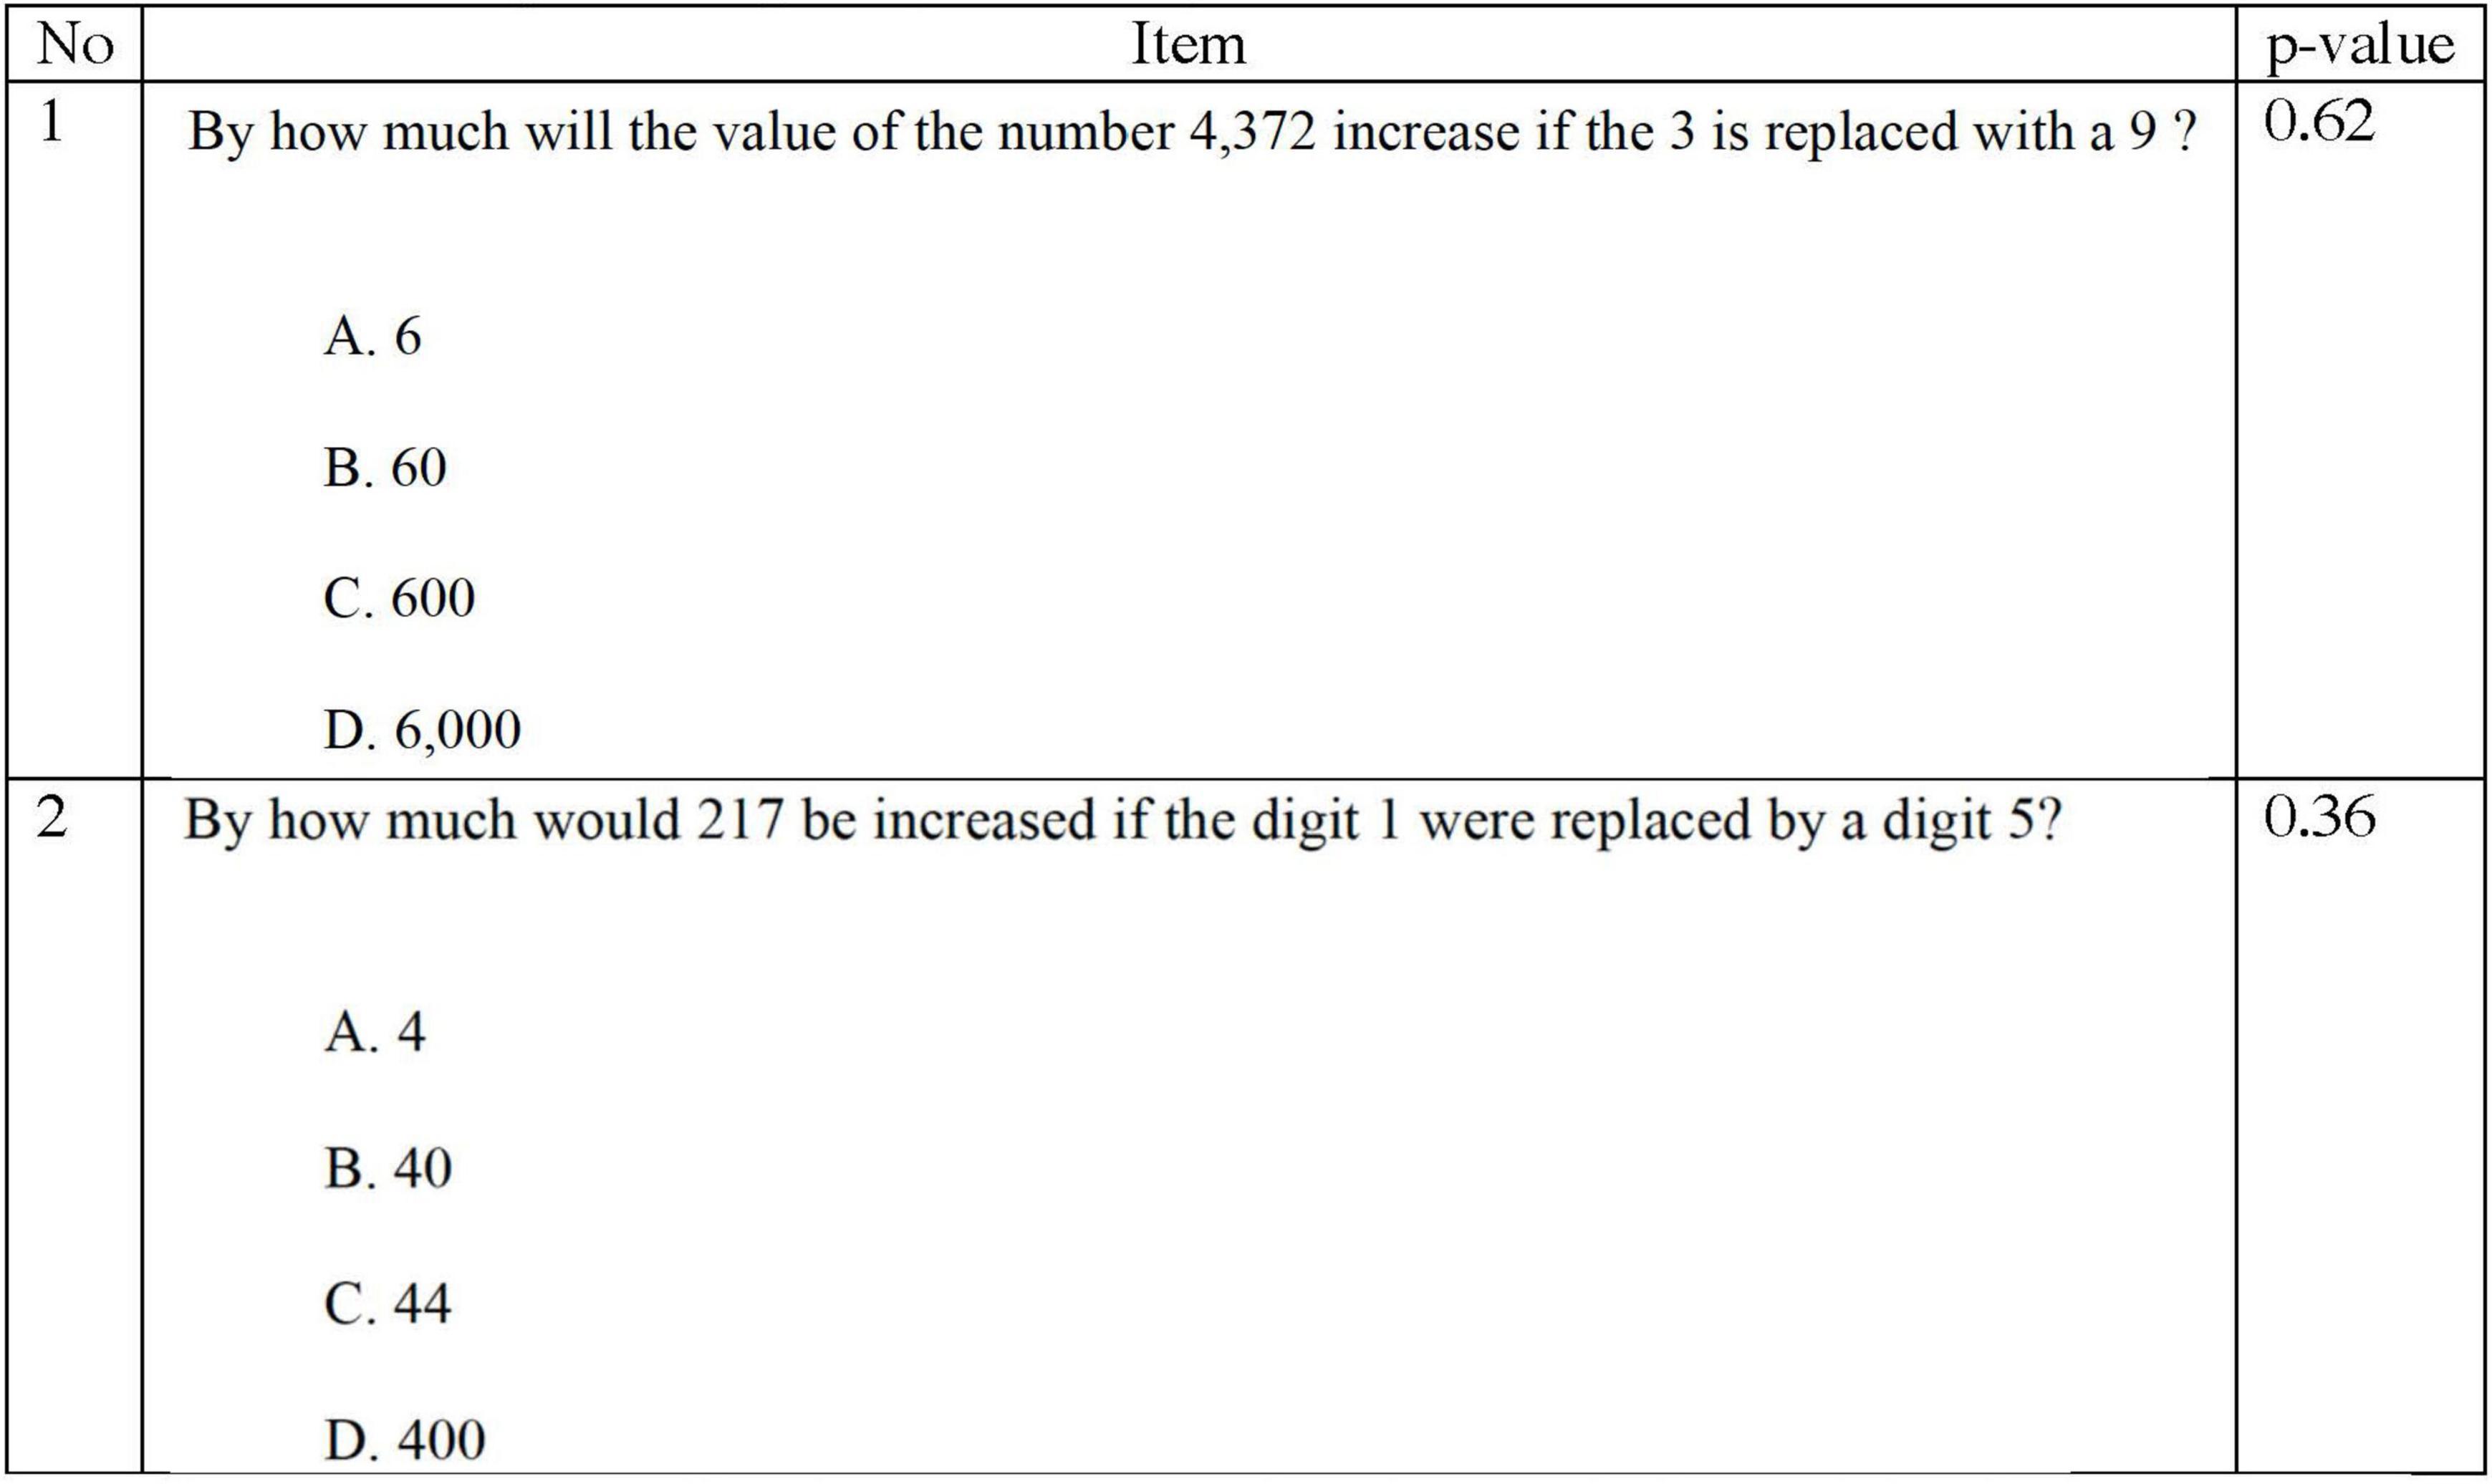
Figure 2. NAEP items with different difficulty assessing place value. Source: U.S. Department of Education, Institute of Education Sciences, National Center for Education Statistics, National Assessment of Educational Progress (NAEP), 2007 and 1992 Mathematics Assessments.
On the surface, these items appear to be very similar in content and structure. Subtle differences in the wording of the stem may have caused differences in the item difficulty estimates as might have students’ opportunity to learn these place-value concepts. Item 1 was operational in 2007, whereas Item 2 was operational in 1992. Given the change in content standards and expectations in the 25-year span between administrations, it is likely that changing curricular expectations impacted students’ exposure to these concepts. As this example points out, factors other than the content and structure of an item may impact item difficulty.
An emerging approach to creating parallel forms is using automated item generation (AIG). The goal of AIG is “to produce large numbers of high-quality items that require little human review prior to administration” (Alves et al., 2010, p. 2). Two approaches emerge within the AIG framework: automatic and semi-automatic (Prasetyo et al., 2020). Automatic AIG incorporates the use of natural language processing for the generation of questions, answers, and distractors simultaneously. For semi-automatic AIG, an expert develops a stem of questions that can be adapted to create new items. These new items can either be clones or variants. Clones are similar items with comparable psychometric properties, while variants possess different psychometric properties. Semi-automatic AIG is primarily contained in three steps (Royal et al., 2018). First, content experts create a cognitive map that identifies the content for inclusion in the assessment; this serves as the assessment blueprint. Next, the experts develop a template or item model for the content. Lastly, a computer algorithm combines various elements of content provided by the experts to generate new items. In the context of creating progress monitoring measures, AIG holds promise for generating parallel forms; however, limited application of this technology exists in this context.
In this manuscript, we describe an application of the principles of semi-automatic AIG to create a progress monitoring system in mathematics for students in Kindergarten through Grade 6. Each grade included 20 parallel forms of 30–40 items on each form. The project described here followed the general framework of semi-automatic AIG but employed only humans in the development process. After specifying the test blueprint, we created item templates that constrained the test and item specification to isolate specific components of the content that would be assessed by each item. These templates were then used by item writers to create item clones for 20 parallel forms. The goal for using this approach is to support the inference that students engage with items on parallel forms in comparable ways that are related to their present-level of understanding.
At present, the items created through this process have not been psychometrically evaluated to substantiate the claim that they are parallel in difficulty. Once field testing data are available, these sources of evidence can be combined to examine the claim that the progress monitoring system can be used to monitor growth in individual student’s understanding.
The purpose of the progress monitoring system described in this manuscript was to facilitate educators’ decisions about students’ growth in the computations-based content standards in Kindergarten (K) through Grade 6. Results from multiple administrations of these probes would allow educators to make inferences about changes in individual student’s computational fluency on grade-level content standards. For the remainder of this manuscript, we will refer to this project as the COMP-PM.
The following description illustrates the three phases of the semi-automated AIG framework, as applied to develop the COMP-PM: (1) specify the test specifications and blueprint, (2) develop the template for item clones, and (3) automate the item cloning process. We also present the validity evidence we collected to evaluate the assumptions that the items are clones and will result in parallel forms.
Our first step in developing parallel progress monitoring forms for the COMP-PM was to determine the test specifications. Test specifications are intended to articulate multiple aspects of the operational test including the item and test format, number of items, scoring rules, interpretive reference, and time limits, and should be based on the intended interpretations and uses of the test results (American Educational Research Association [AERA] et al., 2014). Subsumed within the test specification is the test blueprint, which details the content covered at the test- and item-level.
To begin, we determined the computations-based content standards that would be assessed on the progress monitoring measures. For most grades, these standards were clearly specified as fluency-based expectation. For example, computational fluency is clearly expressed in the Grade 2 standard: Students are expected to recall basic facts to add and subtract within 20 with automaticity. However, for some grades, the computations-based expectations were intertwined with other content standards. In Grade 3, for example, students are expected to use strategies and algorithms, including the standard algorithm, to multiply a two-digit number by a one-digit number. Computational fluency expectations are expressed as students are expected to use algorithms to multiply.
To identify the assessable content for the COMP-PM, two experts in mathematics education closely examined the state content standards to identify the computations-based expectations by grade. The experts reviewed the content standards to pinpoint individual skills that related to computational fluency, and importantly, identified the number range in which those skills would be applied. For Kindergarten and Grade 1, two early numeracy constructs were selected because of the predictive evidence with future mathematics performance. A third expert reviewed the final list of assessable content; any disagreements were discussed until consensus was reached.
Next, key decisions related to the format of the operational test were made using prior research on the design of CBM (c.f., Fuchs and Fuchs, 1997; Foegen et al., 2007). These decisions included:
• Item format: Items are formatted as constructed response to allow students to directly demonstrate their knowledge and skills. Depending on the grade and alignment with the content standards, items will be presented horizontally, vertically, or both.
• Test format: Forms are created to allow ample room for students to solve and record their response to each item. In Kindergarten and Grade 1, forms are presented horizontally to maximize space; each subtest is formatted as a separate form. For grades 2–6, all items are formatted vertically as one operational form with 30 items arranged in six rows of five items each. Item arrangement is intentional to vary the placement of items by content representation and difficulty. Item difficulty will mirror a normal distribution.
• Number of subtests and items per subtest: For Kindergarten and Grade 1, two subtests each with 20 items are needed to assess the selected content standards.
• Scoring rules: All items are scored dichotomously to minimize scoring time and errors.
• Interpretive reference: Consistent with other progress monitoring systems, scores on the COMP-PM will be interpreted in relation to the student’s prior performance. As such, no criteria or normative data are provided to aid in interpretation.
• Time limits: The time constraints for administration are needed to maximize students’ opportunities to demonstrate their knowledge while still minimizing the impact of administration on instructional time. Administration is standardized across parallel forms so that students always have the same amount of time.
| Grade | Administration Time |
| K | 1 min each side |
| 1 | 1 min each side |
| 2 | A total of 2 min |
| 3 | A total of 2 min |
| 4 | A total of 4 min |
| 5 | A total of 4 min |
| 6 | A total of 4 min |
Using the assessable content and the test specifications, we created a generalize test blueprint to identify the number of items needed to assess each skill. The number of items associated with each content standard was determined based on the relative importance and priority of the skill within the grade. Figure 3 illustrates the test blueprint for Grade 5.
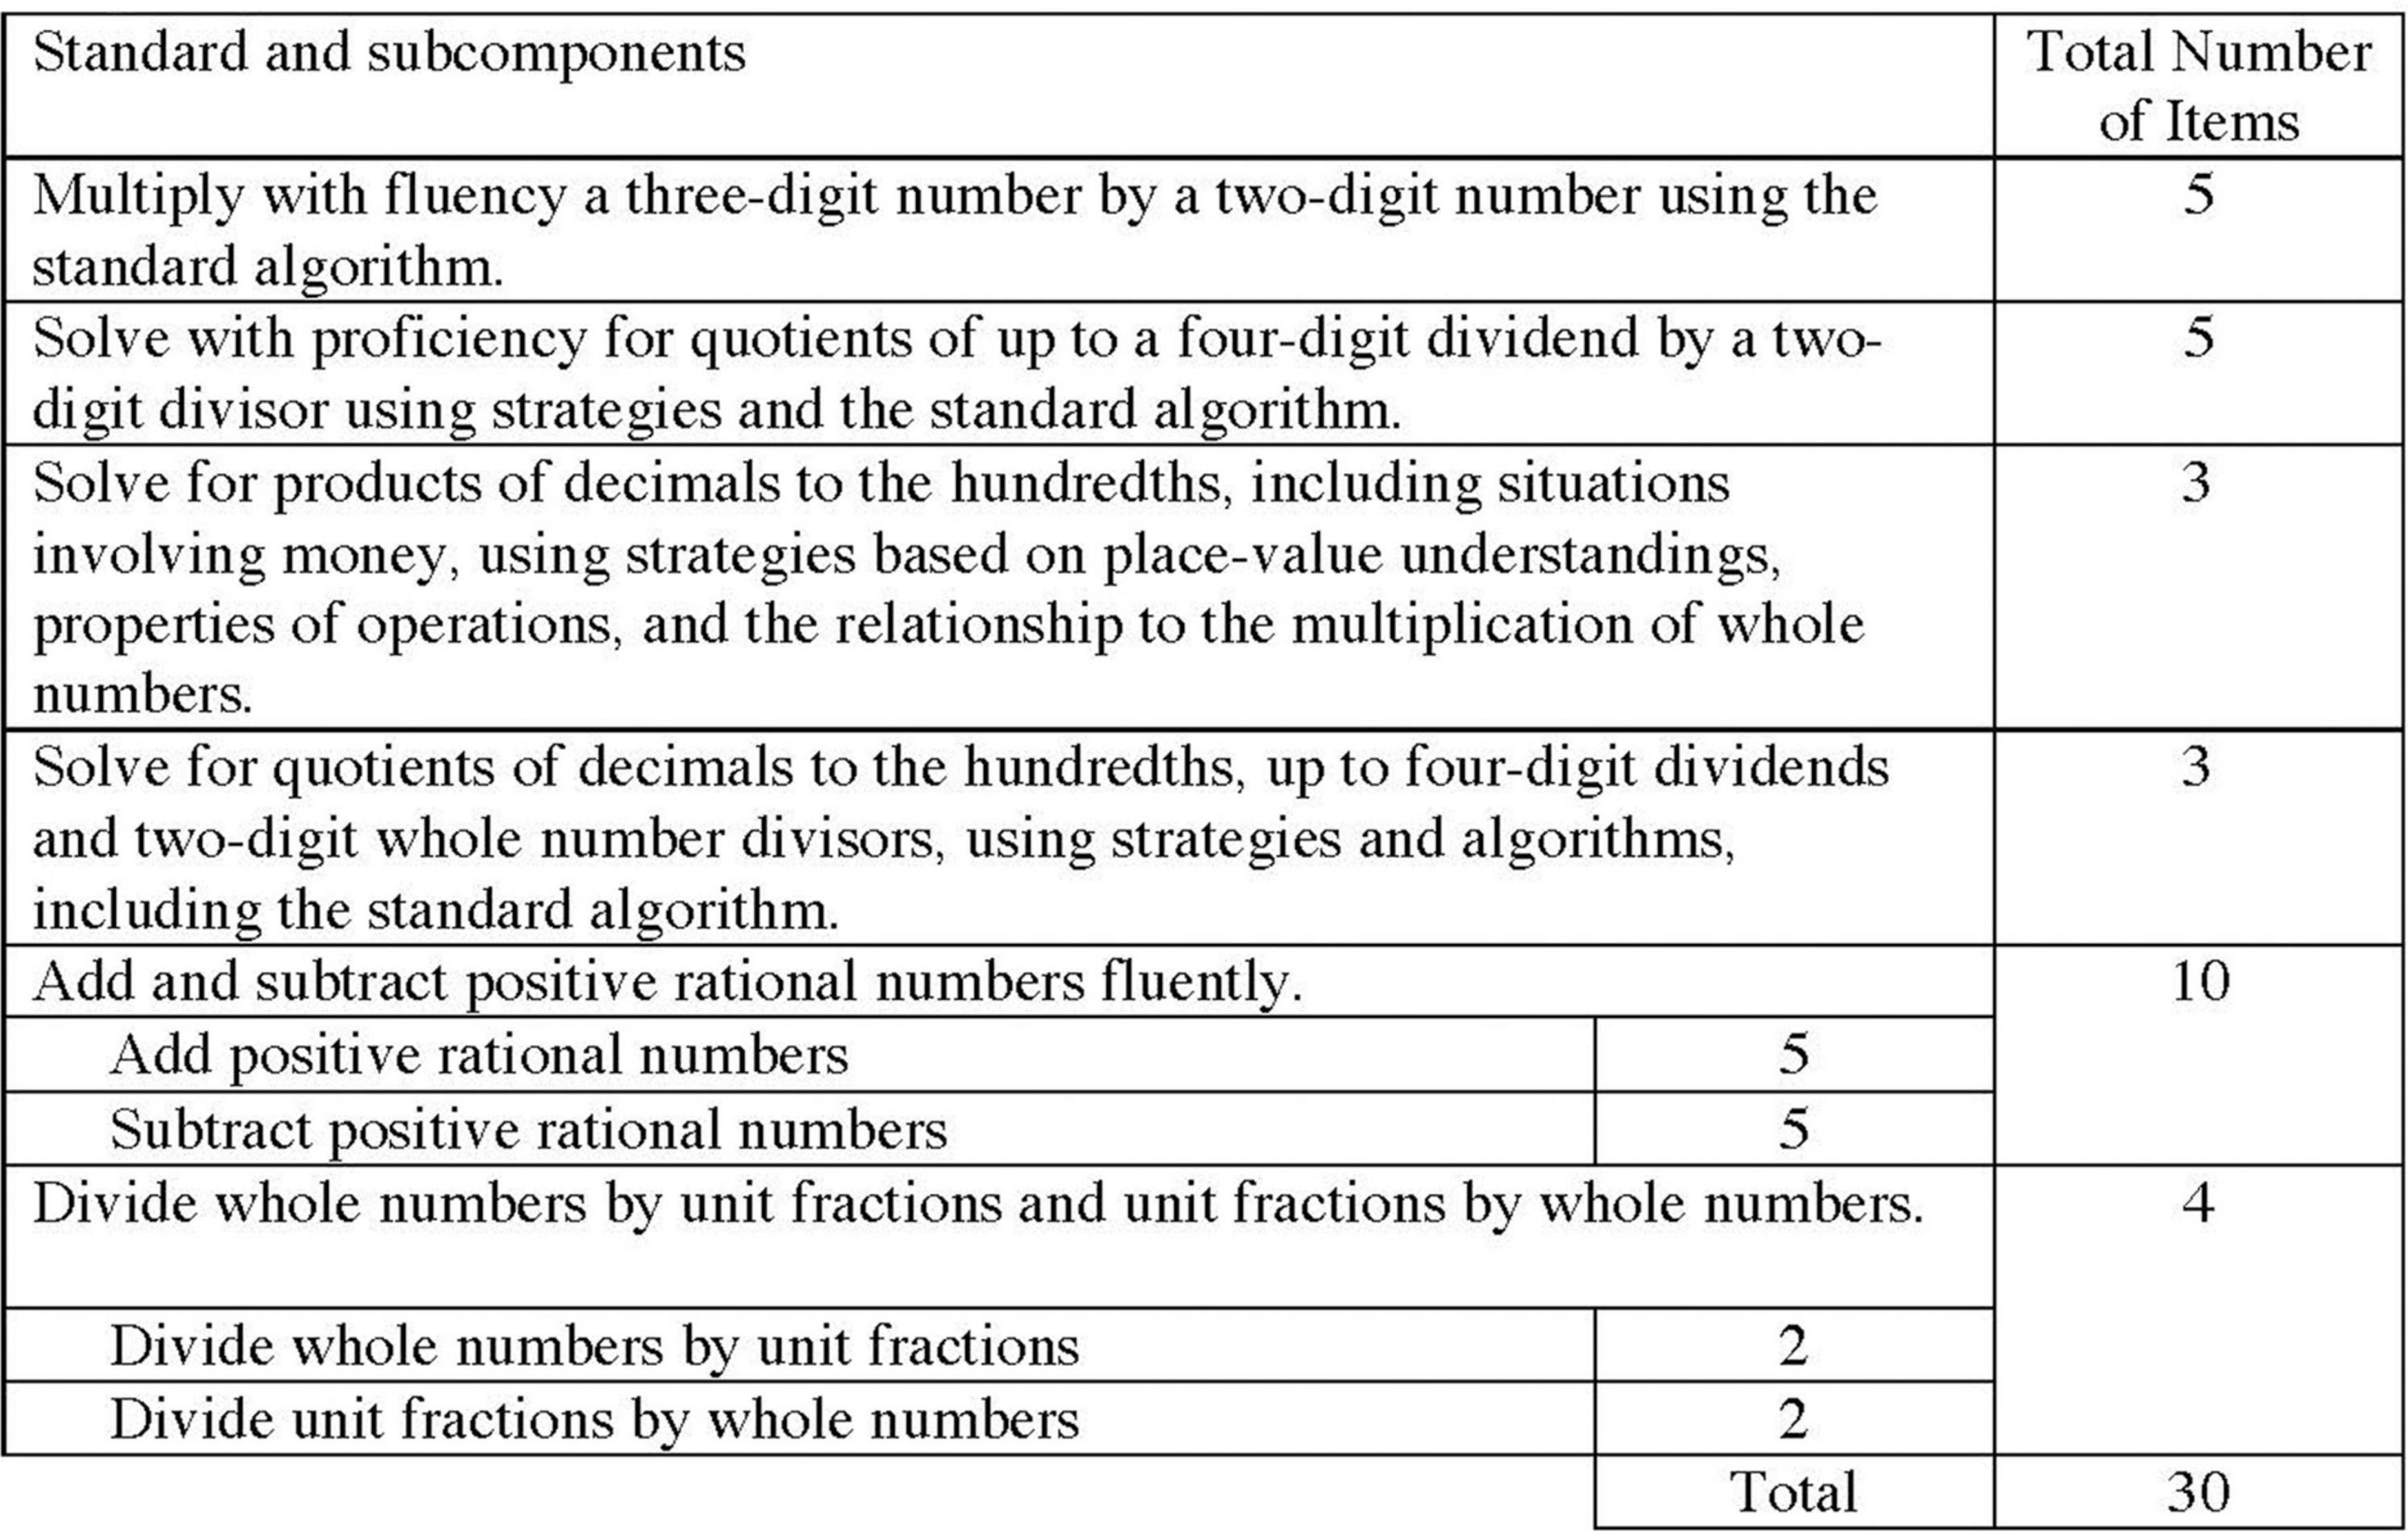
Figure 3. Blueprint for Grade 5.
At the end of Phase 1, we had fully articulated the test specifications for the operational progress monitoring system, and detailed the content to be assessed. The test specifications and test blueprint were reviewed by mathematics education experts at the state education agency. Iterative refinements were made based on their feedback.
The next phase focused on creating the item templates from which item clones would be generated. A unique item template was needed for each of the 30–40 items per grade. Item templates isolate specific components of the content that are assessed by each item. The purpose of the item template is to specify (and thereby constrain) as many factors as possible that could cause students to engage with the items using different cognitive processes. To the extent that these cognitive processes change the elicited knowledge and skills, the resulting items may not be clones. The goal of this phase was to create 20 clones for each of the 30–40 items per grade so that the resulting 20 forms would be parallel in both structure and content, with the intention of being comparable in difficulty.
To begin, we created a fine-grained content matrix that specified the detailed content that would be assessed by each item. During this step, we dissected multi-component content standards into subcomponents that could be a source of variability in the items. For example, a Grade 5 content standard specifies that students can multiply with fluency a three-digit number by a two-digit number using the standard algorithm. Variability in the value of the three-digit and two-digit numbers may impact the difficulty of these items. As such, for the fine-grained content matrix, we specified which multiplicand was a multiple of ten. Figure 4 illustrates the content matrix for Grade 5.
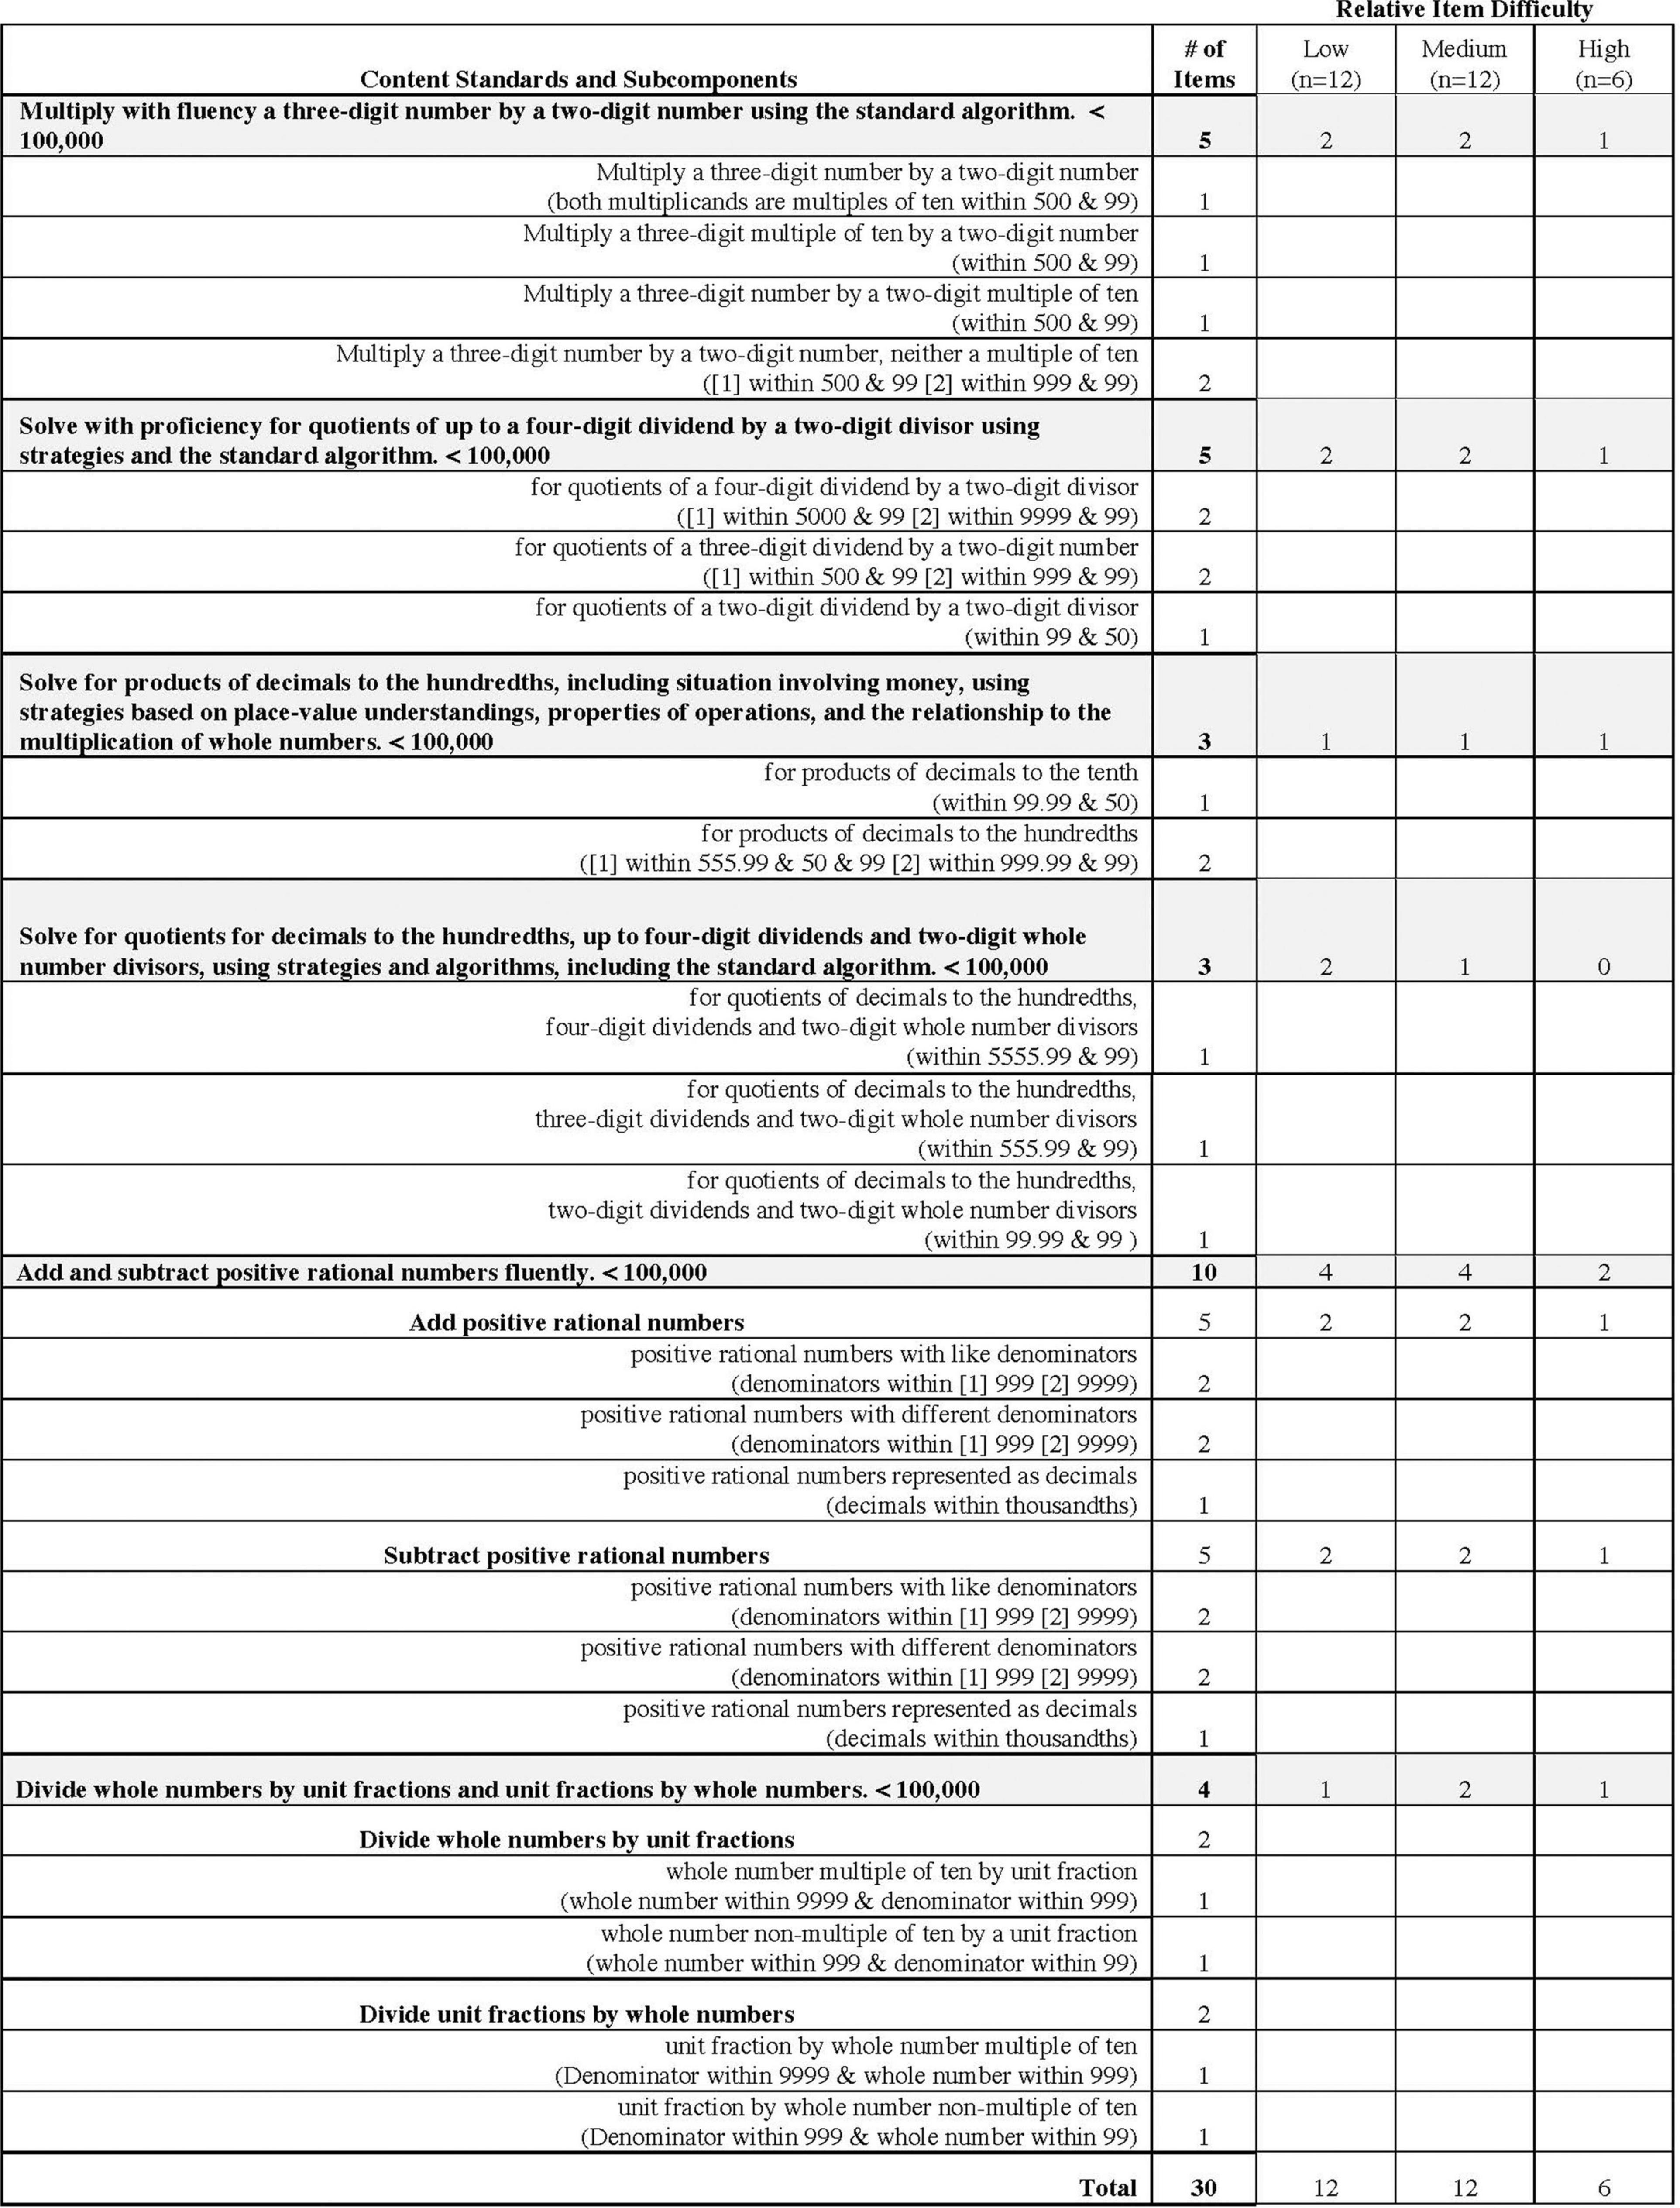
Figure 4. Content matrix for Grade 5.
Also during this step, we assigned a specific number of items to have low, medium, and high difficulty so as to include a range of difficulty levels within the form. Difficulty was determined by several characteristics, including the specific numbers included, the number of steps needed to complete the problem, the amount of information that needed to be retained in working memory, and the number of components needed to execute the algorithm.
To facilitate creating the unique item templates, we created a form that included an algebraic representation of the item in addition to constraints on the item to keep the difficulty consistent across item clones. We also included space to explore common misconceptions in the solving of the problem. The purpose of including misconceptions was to capture common misunderstandings students have for each concept. Data from misconceptions may also provide diagnostic information in the future. Misconceptions were drawn from literature and item writers’ teaching experience. Figure 5 shows the item template.
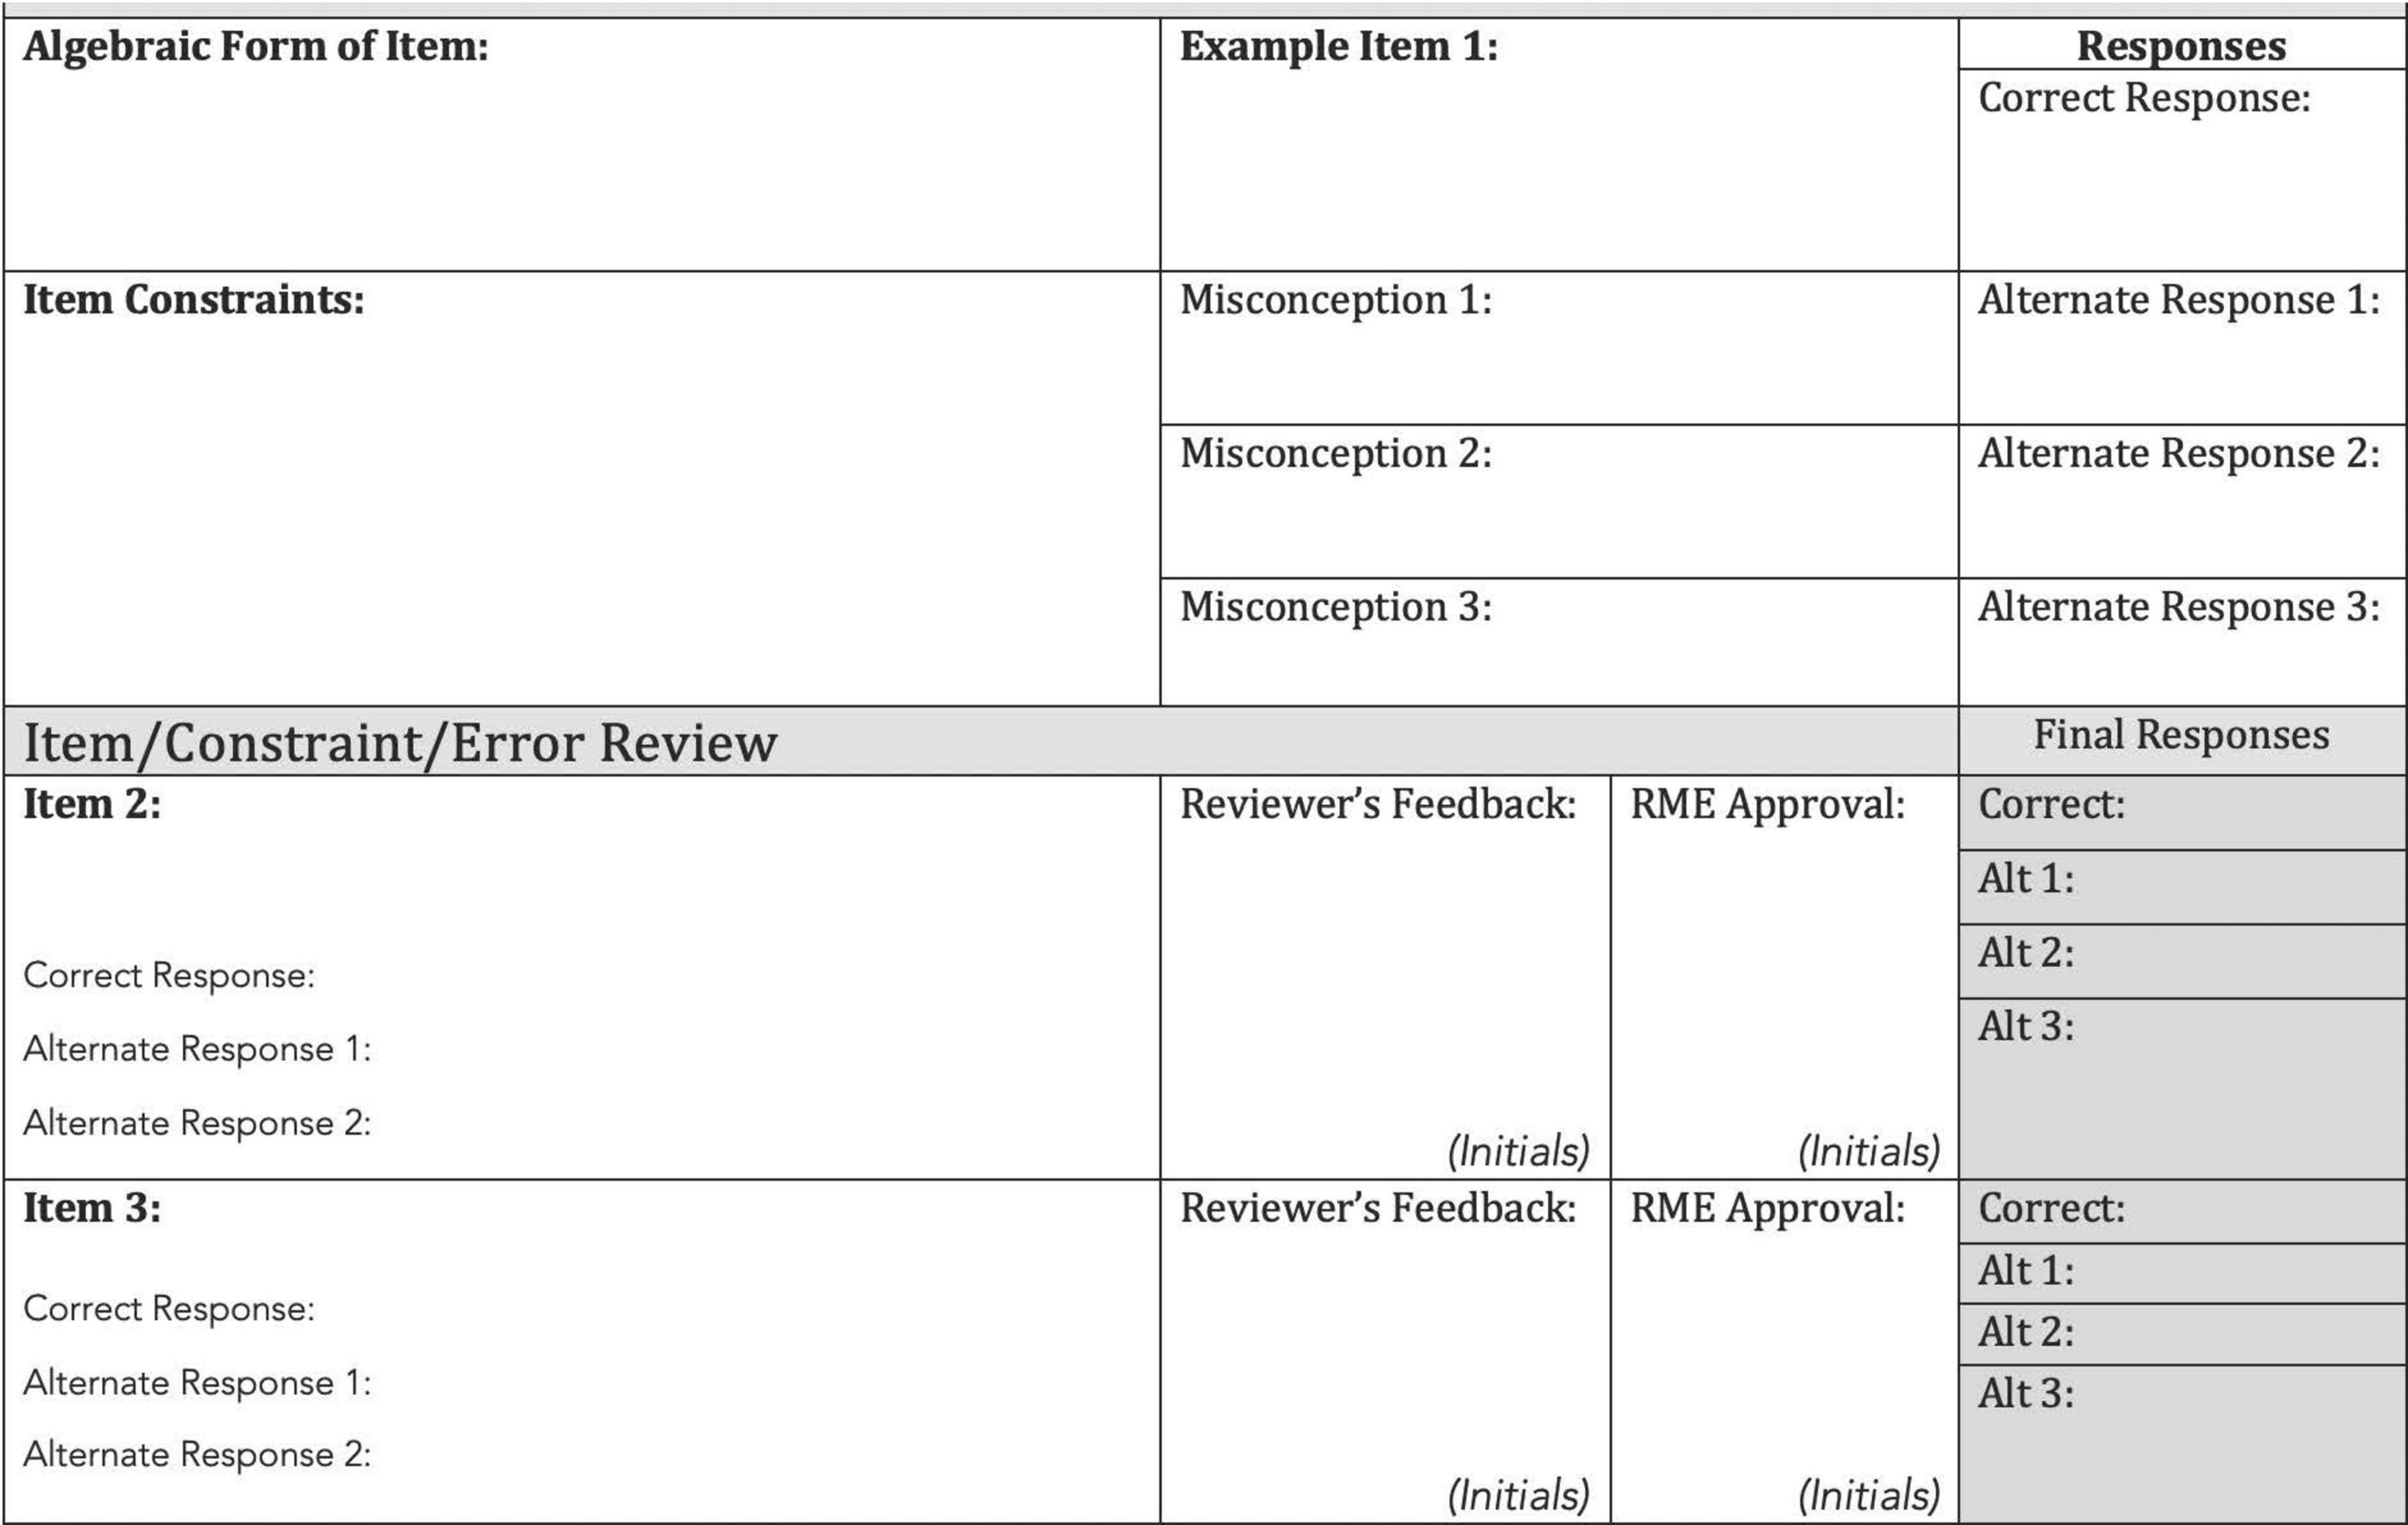
Figure 5. Item model template.
We convened two meetings with 24 content-area experts (e.g., teachers, instructional coaches) to develop 220 item models across Kindergarten through Grade 6. Content area experts were recruited from professional networks with local school districts. Qualifications included:
• Bachelor’s degree or higher in mathematics, education, or related field
• Three years teaching experience in the state in Grade(s) K-6
• Deep understanding of the state content standards
• Ability to accept and incorporate critical feedback
• Proficiency in Microsoft Word/Excel
• Ability to scan/upload files to an online repository
• Ability to adhere to tight timelines
• Experience with writing mathematics assessment items in Grades K-6 (preferred)
• Extensive background in supporting elementary or middle school teachers as a mathematics coach (preferred)
The purpose of these meetings was to train the content-area experts on the purpose and procedures for creating each item template and the corresponding item clones, and create all item templates from which the item clones would be created at a later date. During the meetings, we provided background information on progress monitoring, plausible misconceptions and errors, and factors that impact item difficulty. We also reviewed the test blueprint and content matrix for each grade. Then, we discussed item writing procedures and reviewed the completed item template and three sample item clones presented in Figure 6. We used the item template in Figure 6 to illustrate the importance of specifying the misconceptions and being exhaustive in the constraints to support writing item clones. For Item Clone 2, responses to Misconception 2 and 3 lead to the same answer. To provide diagnostically relevant information, the misconceptions should lead to different answers. For Item Clone 3, the response is only two digits, which may impact students’ cognitive processing. This led to a discussion about the sufficiency of the original constraints, and resulted in updating the constraints to specify that a > d + 1.
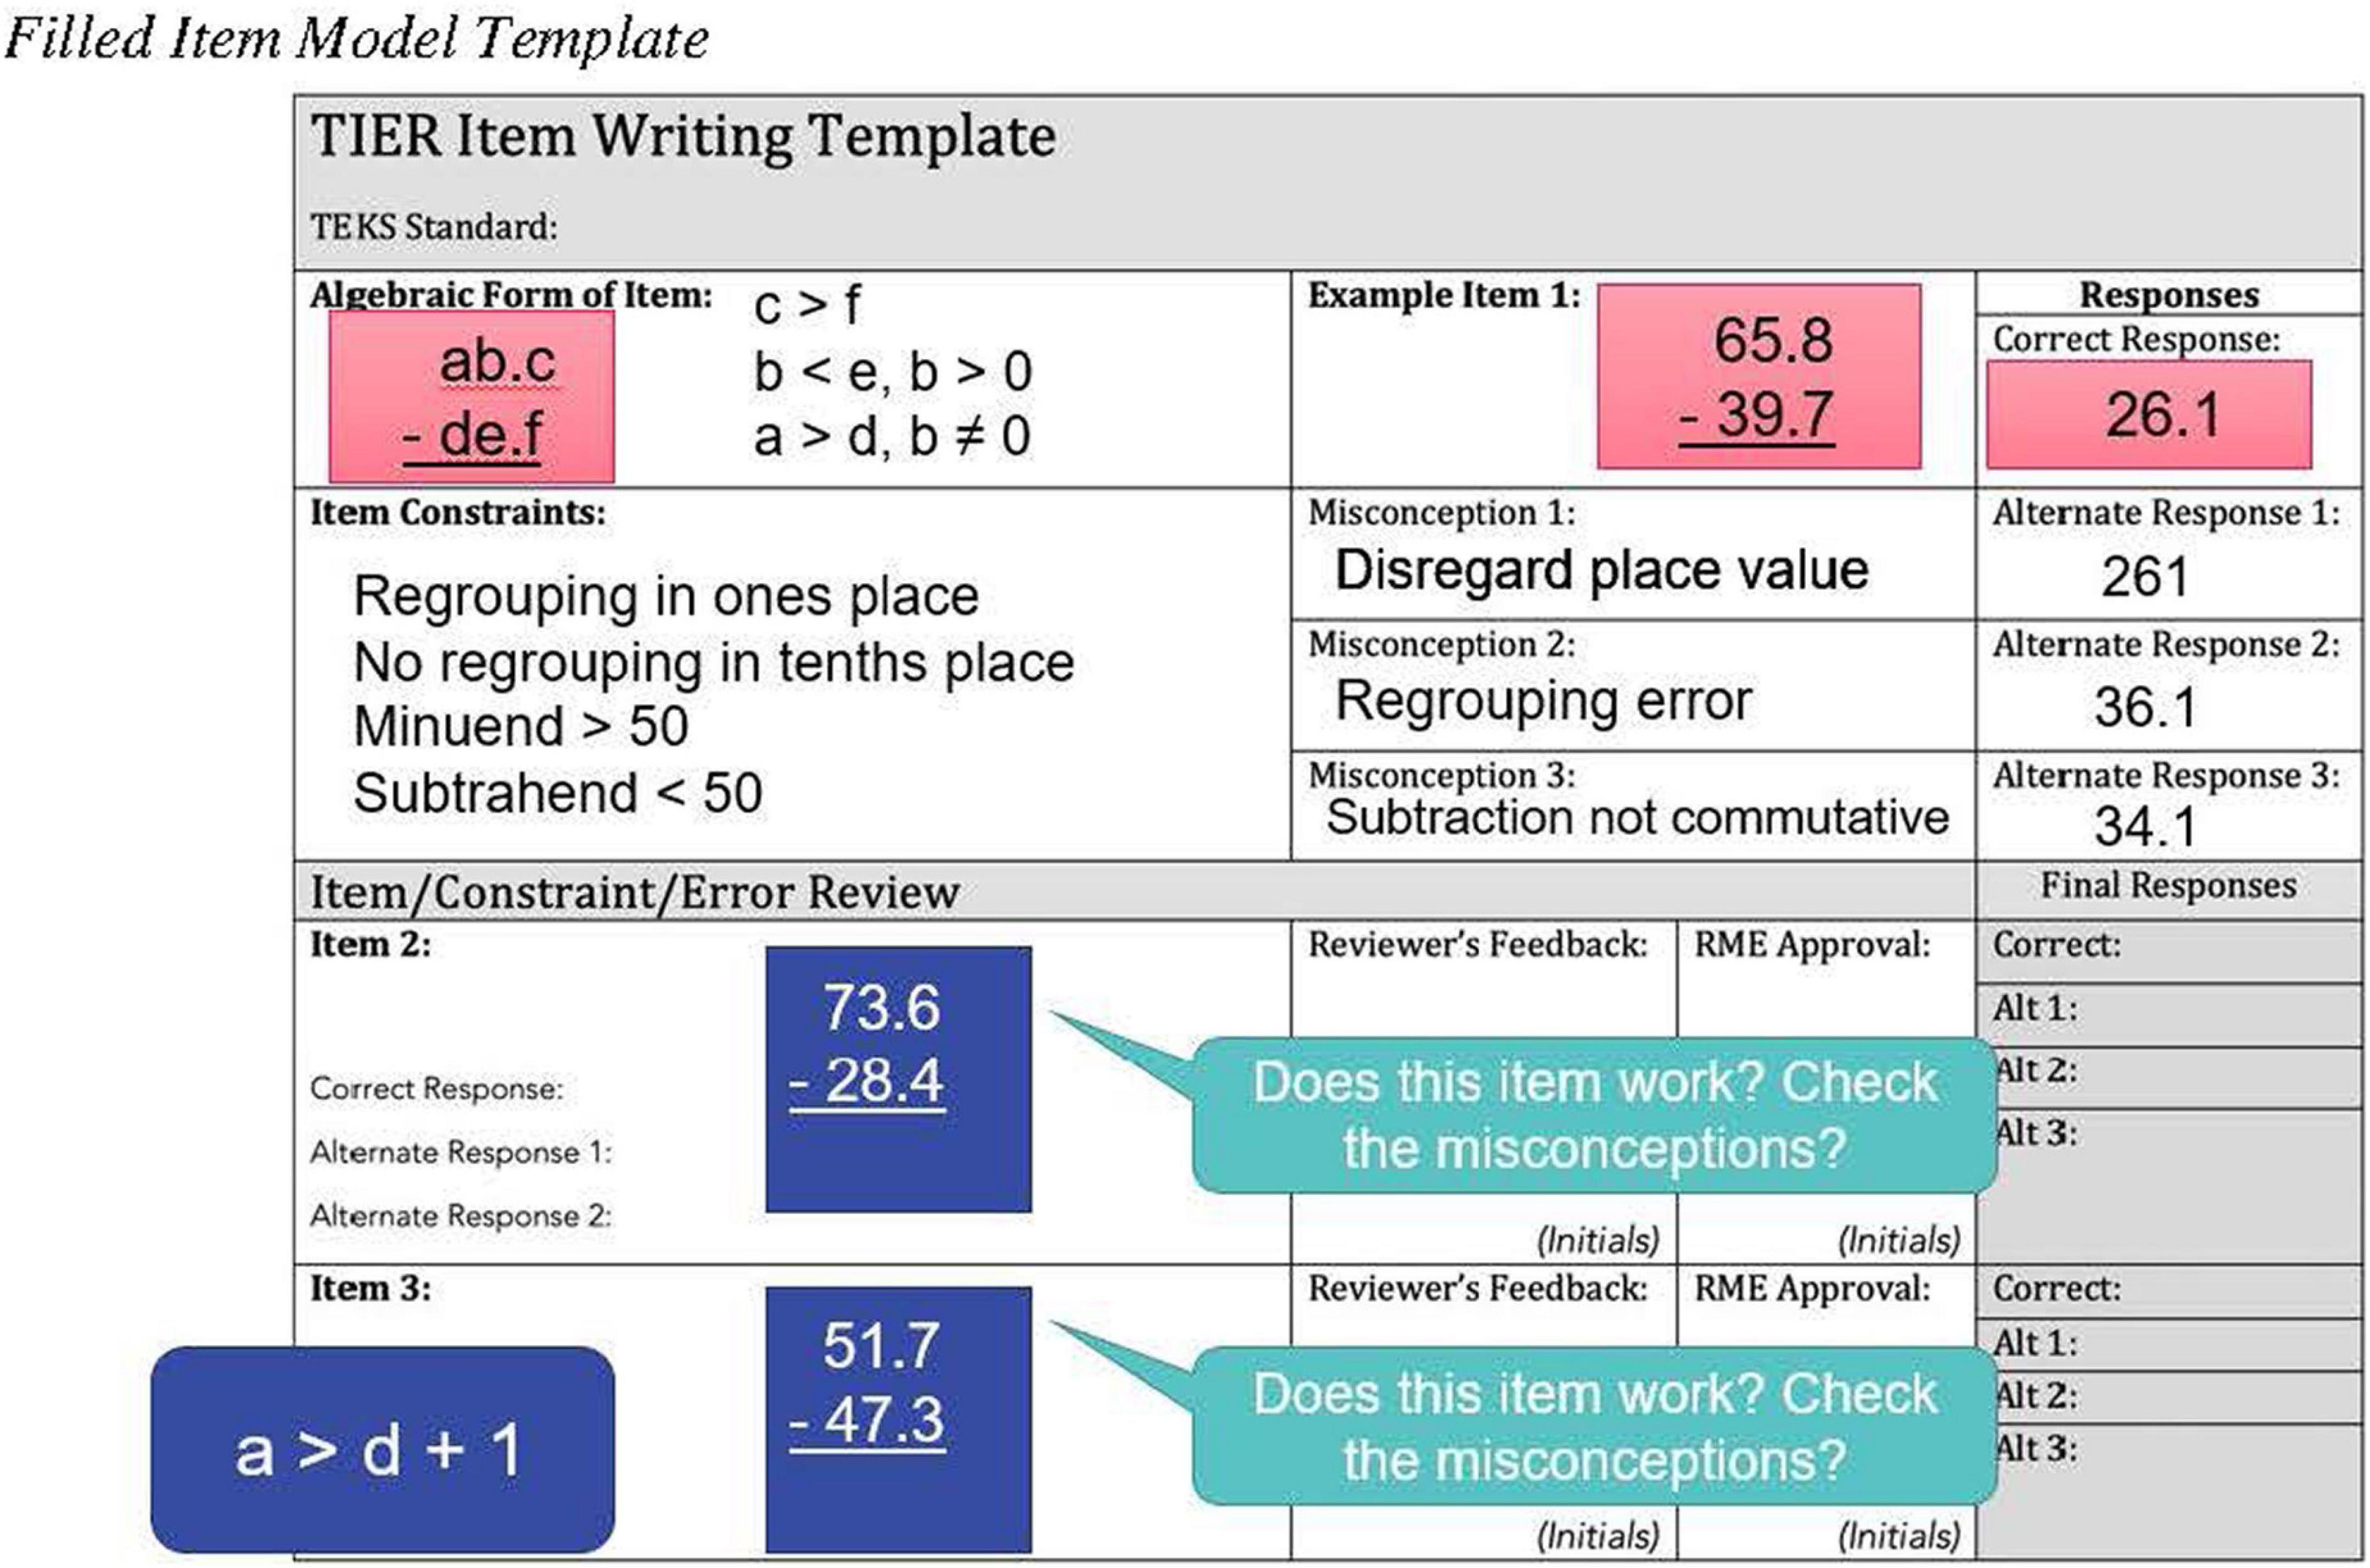
Figure 6. Filled item model template.
After the initial group discussion, content-area experts were divided into grade-level groups to write item templates. As item templates were completed, they were evaluated by two project team members and other content-area experts through an extensive and systematic process. The primary review criteria included alignment with the test blueprint and content matrix, sufficiency of the constraints to maintain item difficulty, and plausibility of the misconception. The Item Template was also reviewed for alignment with the proposed difficulty level so as to ensure distribution of item difficulties as specified in the content matrix. Where needed, we modified items to maintain item difficulties across the distribution. In instances where the two reviewers disagreed with the difficulty rating, the reviewers discussed until consensus was reached.
As part of this initial review, the first three item clones (labeled Item 1, 2, 3 in the Item Template in Figure 5) were carefully examined. Each item clone was evaluated to verify that it matched the constraints specified the Item Template and elicited the same cognitive processes as the other item clones. If the cognitive processes varied across clones, the clone was modified to align with the constraints. If the constraints were met but the item clone still elicited different cognitive processes, the constraints in the Item Template were updated to better control for variability in the cognitive processes. Some item templates required multiple rounds of revision before being finalized.
To gather content-related validity evidence, the finalized item templates were reviewed by five external reviewers with expertise in mathematics and special education, with a particular emphasis on progress monitoring and/or curriculum based measurement. Four of the external reviewers reviewed the item templates for one grade; one external reviewer reviewed the item templates for two grades. Qualifications to serve as an external reviewer included:
• A doctoral degree in mathematics, education, or related field;
• Five years of experience working in a teaching, administrative, or university setting in their field;
• A deep understanding of mathematics content standards;
• Experience with writing mathematics assessment items in Grades K-6; and
• Extensive background in supporting elementary or middle school teachers, preferred.
During the external review process, each item template was reviewed for alignment with the test blueprint and content matrix, alignment with the difficulty level, feasibility and sufficiency of the constraints, comparability of cognitive processing, plausibility of the misconception, and likelihood of generating 20 alternate forms. External reviewers provided feedback for each criteria using a four-point Likert scale (1: strongly disagree, 2: disagree; 3: agree; 4: strongly agree). For any criteria that received a rating of 1 or 2, we requested written rationale for their rating and recommendations to help improve the item template.
Table 1 describes the percent agreement of the external reviewers’ ratings across grades for each criteria. Experts agreed or strongly agreed that 77–100% of the item templates aligned with the content standards. Alignment to the assigned difficulty agreement ranged from 57 to 95%. Agreement that the item constraints would yield 20 comparable items ranged from 77 to 100%. Agreement of the appropriateness of the misconceptions ranged from 44 to 100% and agreement in the appropriateness of the alternate responses ranged from 50 to 100%. The criteria with the lowest level of agreement was misconceptions.
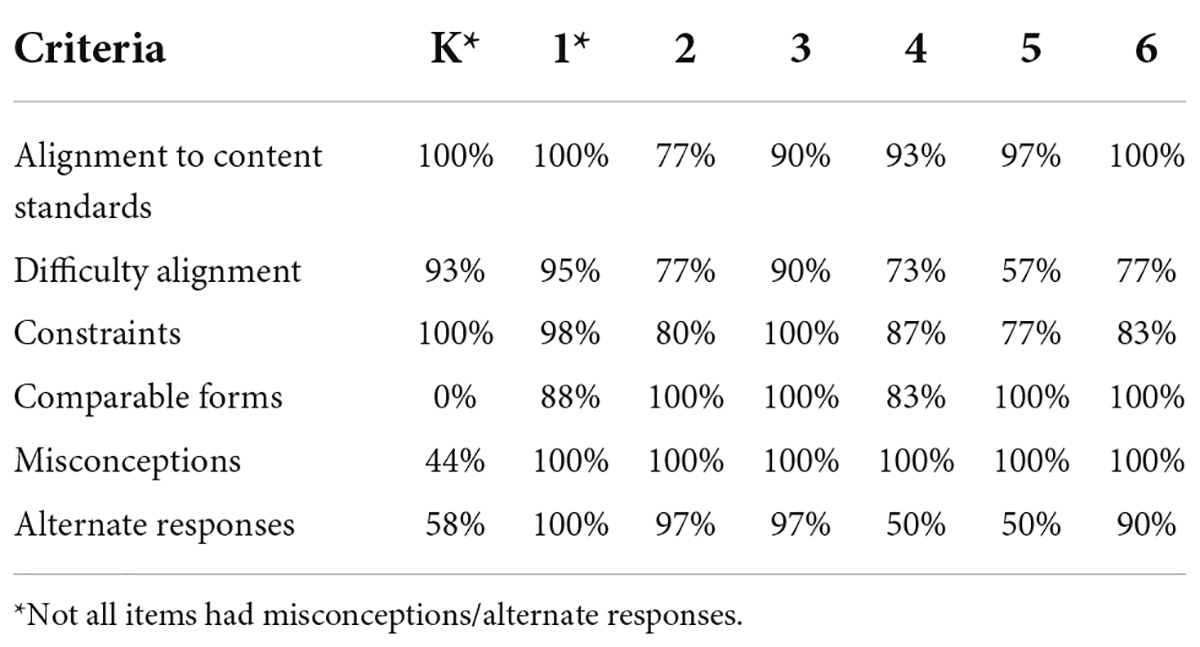
Table 1. External review percent agree/strong agree.
Using the external reviewers’ rationale and recommendations for improvements, at least one project team member reviewed and revised the item templates that received a rating of 1 or 2 (strongly disagree or disagree). An independent reviewer from the project team served as a verifier; this team member reviewed the external reviewer’s feedback and the revision to verify that the issue was adequately addressed. Any discrepancies were reconciled with the original project team member and/or the external reviewer.
At the conclusion of Phase 2, we had 220 unique item templates across Kindergarten through Grade 6. Through extensive and systematic internal and external review processes, we reviewed and revised the item templates to verify that they met the criteria. Content-related validity evidence supported our claim that the item templates measured the content specified in the content matrix and item clones would be comparable in difficulty and elicit similar cognitive processes. As a result, the item templates were used to initiate Phase 3 in which the item clones would be created.
The purpose of Phase 3 was to create 20 item clones for each of the 220 item templates. As previously noted, each item template included the algebraic form of the item, constraints to maintain comparability of content, and cognitive processes, possible misconceptions, and the corresponding alternate responses, and three sample item clones. Constraining these features should result in item clones that are comparable in difficulty. This template became the foundation for writing the item clones. For Kindergarten and Grade 1, the narrowness of the content specified on the item templates would not yield 20 item clones. A total of 4,180 item clones were written during this phase.
All but one of the 24 content-area experts who participated in Phase 2 created item clones as part of Phase 3. Each content-area expert was assigned a set of item templates from which to create item clones. The content-area experts were not assigned an item template that they created. The item template was revised to streamline the item writing and review process (see Figure 7).
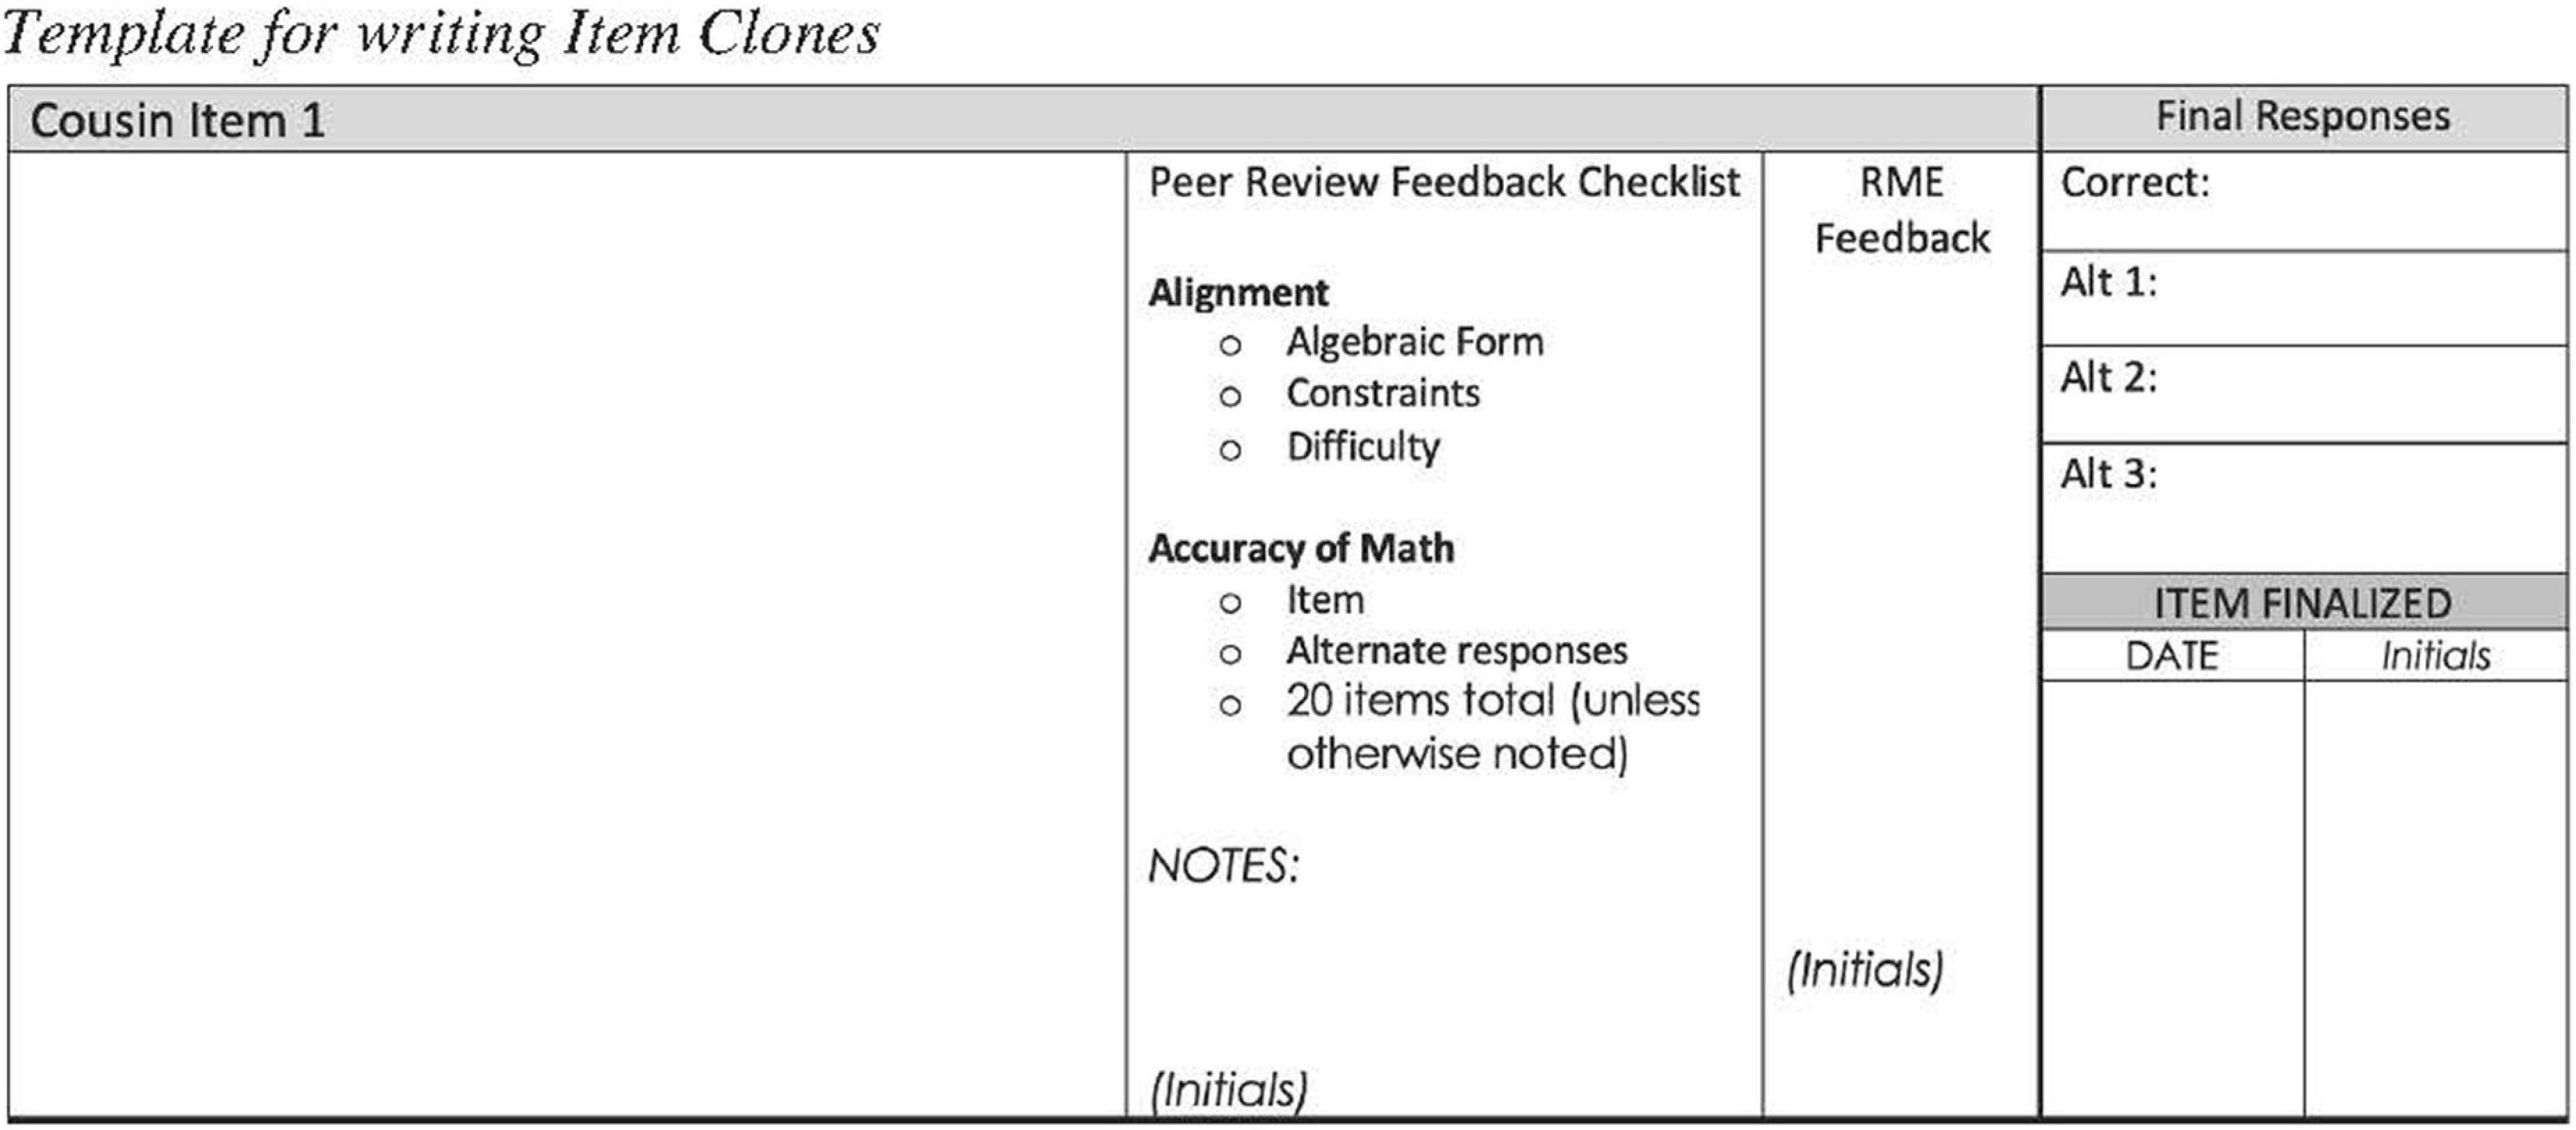
Figure 7. Template for writing item clones.
Prior to writing item clones, the content-area experts received training on the process and procedures for writing item clones. The training emphasized the importance of duplicating the item template as closely as possible, noting the need to align the item clones with the algebraic form, constraints, and misconceptions so as to maintain the same item difficulty level and elicit the same cognitive processes. Examples and non-examples were used to model the expectations and procedures.
To write the item clones, the content-area experts followed the process presented in Figure 8. After reviewing the item templates and the three initial item clones, the content-area experts wrote 17 unique item clones to align with the specified constraints. Once all 20 item clones were written, they were peer reviewed by other content-area experts to verify that all 20 matched the constraints and elicited the same cognitive processes as the other item clones. If an item clone varied in difficulty or was suspected of eliciting different cognitive processes, it was flagged for review and revisions. The content-area experts used this input to finalize the item clones and submit for final review by the project team. In some cases, multiple iterations of revisions were needed before the completed set of 20 item clones was approved.

Figure 8. Development process for writing and verifying item clones.
At the conclusion of Phase 3, 4,180 item clones were finalized for 220 item templates to be distributed across 30–40 operational forms for Kindergarten through Grade 6. To aid in the placement of the items in the operational forms, we created a form blueprint that aligned with the test specifications presented earlier. The form blueprint is a schematic that documents where the items are to be placed on the operational forms. Items assessing similar content standards were dispersed across the form. Item difficulty was also considered when distributing the items and mirrored a normal distribution; the number of most difficult items was greatest in the middle of the form. The first row of items on every form did not include any of the most difficult items. This placement was intentional to allow students with varying ability levels to demonstrate their knowledge, skills, and abilities, and was intended to minimize anxiety.
Once the items were placed, the final forms across all grades were reviewed. Item formatting was examined and content cueing was considered to make sure students’ responses to one item would not influence their responses to others. Once these forms were finalized, they were used to create the final answer key and student forms.
The current paper describes the process of developing a progress monitoring system in mathematics for students in Kindergarten through Grade 6. We adapted a semi-automatic item generation (AIG) approach to address methodological and content-related issues with traditional approaches to developing and validating progress monitoring systems. Using AIG, items are developed based on an item template that controls for variability in item difficulty. Controlling for item-level variability is important in the development of progress monitoring tools, which depend on items of comparable difficulty across multiple forms. These comparable items allow stakeholders the ability to monitor individual student’s progress across the administration of the different probes of the same construct.
In this manuscript, we describe the three phases of the adapted AIG approach that we implemented. Throughout each phase, we collected content-related evidence for validity and made iterative improvements. During Phase 1, to verify the alignment with the state content standards in mathematics, the test specifications and test blueprint were reviewed by mathematics education experts at the state education agency. In Phase 2, the finalized item templates were reviewed by five external reviewers with expertise in mathematics and special education, with a particular emphasis on progress monitoring and/or curriculum based measurement. They reviewed each item template for alignment with the test blueprint and content matrix, alignment with the intended difficulty level, feasibility, and sufficiency of the constraints, comparability of cognitive processing, plausibility of the misconception, and likelihood of generating 20 alternate forms. Finally, in Phase 3, all of the item clones went through a rigorous internal review by content-area experts and mathematics education researchers. At each phase, the quality was assessed and revisions were made to improve the final items.
The approach described in the current paper does not take the place of pilot or field testing and empirical evaluation of the comparability of the forms. For the current research, we used multiple reviews from experts to support the assumption that item difficulty remained consistent across forms. However, a limitation of the current research is the absence of psychometric data to verify this assertion. For example, using pilot or field test data, we need to analyze the comparability of items across multiple forms to assess whether item difficulty is maintained. Analyses could include comparing item difficulty and discrimination parameters derived from IRT modeling or analyses based in classical test theory. The results of these analyses could help support the claim that these items measure the same construct of computational fluency at the same difficulty across forms.
Differences in difficulty across forms may be detected. In these instances, forms can be equated to adjust for differences in difficulty. To avoid the issues previously described with the common-subjects method, a viable method for equating progress monitoring probes would be to embed a set of common items (also known as anchor items) across each of the 20 forms during pilot or field testing. Although a detailed description of equating designs is beyond the scope of this manuscript, equating via anchor items allows the forms to be administered to different samples of students (see Hanson and Beguin, 2002 for a more detailed description of the common-item equating design). Prior to operationalizing the progress monitoring system, the anchor items should be removed from the forms. One implication for this approach to creating parallel progress monitoring probes is the resulting use of scale scores. To facilitate teachers’ use and interpretation of progress monitoring data, raw scores are typically computed and graphed. Using scale scores would require teachers to use score conversion tables for each form, which may impact their implementation.
In conclusion, this manuscript demonstrated the value of using an adapted AIG process to facilitate rapid development a progress monitoring system in mathematics. Content-related validity evidence supported the claims that both content and structure of the items were consistent across forms. Additional empirical evidence is needed to substantiate these claims.
The original contributions presented in this study are included in the article/supplementary material, further inquiries can be directed to the corresponding author/s.
LK-G conceived and designed the study and wrote the first draft of the manuscript. JM managed the implementation of the study. AS contributed to the implementation of the study and wrote sections of the manuscript. All authors contributed to manuscript revisions, read, and approved the submitted version.
This research reported was funded under a contract received by the University of Texas at Austin on behalf of the Texas Education Agency.
The authors declare that the research was conducted in the absence of any commercial or financial relationships that could be construed as a potential conflict of interest.
All claims expressed in this article are solely those of the authors and do not necessarily represent those of their affiliated organizations, or those of the publisher, the editors and the reviewers. Any product that may be evaluated in this article, or claim that may be made by its manufacturer, is not guaranteed or endorsed by the publisher.
Alves, C. B., Gierl, M. J., and Lai, H. (2010). “Using automated item generation to promote principled test design and development,” in Paper Presented at the Annual Meeting of the American Educational Research Association (Denver, CO).
American Educational Research Association [AERA], American Psychological Association [APA], and National Council on Measurement in Education [NCME] (2014). Standards for Educational and Psychological Testing. Washington, DC: American Psychological Association.
Choi, J. H., Meisenheimer, J. M., McCart, A. B., and Sailor, W. (2017). Improving learning for all students through equity-based inclusive reform practices: Effectiveness of a fully integrated schoolwide model on reading and math achievement. Remedial Spec. Educ. 38, 28–41. doi: 10.1177/0741932516644054
Clarke, B., Baker, S., Smolkowski, K., and Chard, D. J. (2008). An analysis of early numeracy curriculum-based measurement. Remedial Spec. Educ. 29, 46–57. doi: 10.1542/peds.2016-2651
Dawes, J., Solomon, B., and McCleary, D. F. (2022). Precision of single-skill mathematics CBM: Group versus individual administration. Assess. Effect. Interv. 47, 170–178. doi: 10.1177/15345084211035055
Deno, S. L. (2003). Developments in curriculum-based measurement. J. Spec. Educ. 37, 184–192. doi: 10.1177/00224669030370030801
Foegen, A., Jiban, C., and Deno, S. (2007). Progress monitoring measures in mathematics. J. Spec. Educ. 41, 121–139. doi: 10.1177/00224669070410020101
Foegen, A., Olson, J. R., and Impecoven-Lind, L. (2008). Developing progress monitoring measures for secondary mathematics: An illustration in algebra. Assess. Effect. Interv. 33, 240–249. doi: 10.1177/1534508407313489
Fuchs, L. S. (2004). The past, present, and future of curriculum-based measurement research. School Psychol. Rev. 33, 188–192.
Fuchs, L. S., and Fuchs, D. (1997). Use of curriculum-based measurement in identifying students with disabilities. Focus Except. Child. 30, 1–16. doi: 10.17161/fec.v30i3.6758
Fuchs, L. S., Fuchs, D., Compton, D. L., Bryant, J. D., Hamlett, C. L., and Seethaler, P. M. (2007). Mathematics screening and progress monitoring at first grade: Implications for responsiveness to intervention. Except. Child. 73, 311–330. doi: 10.1177/001440290707300303
Gersten, R., Chard, D. J., Jayanthi, M., Baker, S. K., Morphy, P., and Flojo, J. (2009). Mathematics instruction for students with learning disabilities: A meta-analysis of instructional components. Rev. Educ. Res. 79, 1202–1242. doi: 10.3102/0034654309334431
Hanson, B. A., and Beguin, A. A. (2002). Obtaining a common scale for item response theory item parameters using separate versus concurrent estimation in the common-item equating design. Appl. Psychol. Meas. 26, 3–24. doi: 10.1177/0146621602026001001
Jung, P.-G., McMaster, K. L., Kunkel, A. K., Shin, J., and Stecker, P. M. (2018). Effects of data-based individualization for students with intensive learning needs: A meta-analysis. Learn. Disabil. Res. Pract. 33, 144–155. doi: 10.1111/ldrp.12172
Ketterlin-Geller, L. R., Powell, S., Chard, D., and Perry, L. (2019). Teaching Math in Middle School: Using MTSS to Meet All Students’ Needs. Baltimore, MD: Brookes Publishing.
Kolen, M. J., and Brennan, R. L. (2014). Test Equating, Scaling, and Linking: Methods and Practices, 3rd Edn. New York, NY: Springer. doi: 10.1007/978-1-4939-0317-7
Powell, S. R., Lembke, E., Ketterlin-Geller, L. R., Petscher, Y., Hwang, J., Bos, S. E., et al. (2021). Data-based individualization in mathematics to support middle-school teachers and their students with mathematics learning difficulty. Stud. Educ. Eval. 69:100897. doi: 10.1016/j.stueduc.2020.100897
Prasetyo, S. E., Adji, T. B., and Hidayah, I. (2020). “Automated item generation: model and development technique,” in Paper Presented at the 7th International Conference on Information Technology, Computer, and Electrical Engineering (ICITACEE (Semarang). doi: 10.1109/ICITACEE50144.2020.9239243
Royal, K. D., Hedgpeth, M., Jeon, T., and Colford, C. M. (2018). Automated item generation: The future of medical education assessment? Eur. Med. J. 2, 83–93.
Rupp, A. A. (2003). Item response modeling with BILOG-MG and MULTILOG for windows. Int. J. Test. 3, 365–384. doi: 10.1207/S15327574IJT0304_5
Keywords: progress monitoring (PM) measures, mathematics education, computational fluency, instructional decision making, curriculum based measures
Citation: Ketterlin-Geller LR, Sparks A and McMurrer J (2022) Developing progress monitoring measures: Parallel test construction from the item-up. Front. Educ. 7:940994. doi: 10.3389/feduc.2022.940994
Received: 10 May 2022; Accepted: 26 July 2022;
Published: 26 September 2022.
Edited by:
Stefan Blumenthal, University of Rostock, GermanyReviewed by:
Quan Zhang, Jiaxing University, ChinaCopyright © 2022 Ketterlin-Geller, Sparks and McMurrer. This is an open-access article distributed under the terms of the Creative Commons Attribution License (CC BY). The use, distribution or reproduction in other forums is permitted, provided the original author(s) and the copyright owner(s) are credited and that the original publication in this journal is cited, in accordance with accepted academic practice. No use, distribution or reproduction is permitted which does not comply with these terms.
*Correspondence: Leanne R. Ketterlin-Geller, bGtnZWxsZXJAc211LmVkdQ==
Disclaimer: All claims expressed in this article are solely those of the authors and do not necessarily represent those of their affiliated organizations, or those of the publisher, the editors and the reviewers. Any product that may be evaluated in this article or claim that may be made by its manufacturer is not guaranteed or endorsed by the publisher.
Research integrity at Frontiers
Learn more about the work of our research integrity team to safeguard the quality of each article we publish.