 Gunnar Höst
 Konrad J. Schönborn
 Lena Tibell
95% of researchers rate our articles as excellent or good
Learn more about the work of our research integrity team to safeguard the quality of each article we publish.
Find out more
ORIGINAL RESEARCH article
Front. Educ. , 22 July 2022
Sec. STEM Education
Volume 7 - 2022 | https://doi.org/10.3389/feduc.2022.933087
This article is part of the Research Topic Visual Images in Science Education View all 10 articles
Visual images are crucial for communicating science in educational contexts and amongst practitioners. Reading images contributes to meaning-making in society at large, and images are fundamental communicative tools in public spaces such as science centers. Here, visitors are exposed to a range of static, dynamic, and digital visual representations accessible through various multimodal and interactive possibilities. Images conveying scientific phenomena differ to what extent they represent real objects, and include photographs, schematic illustrations, and measurement-based models. Depicting realism in biological objects, structures and processes through images differs with respect to, inter alia, shading, color, and surface texture. Although research has shown that aspects of these properties can both potentially benefit and impair interpretation, little is known about their impact on viewers’ visual preference and inclination for further exploration. Therefore the aim of this study is to investigate what effect visual properties have on visitors’ perception of biological images integrated in an interactive science center exhibit. Visitors responded to a questionnaire designed to assess the impact of three indicators of realism (shading, color, and surface texture) and biological content (e.g., cells and viruses) on participants’ preferences, perceptions of whether biological images depicted real objects, and their desire to further explore images. Inspired by discrete choice experiments, image pairs were systematically varied to allow participants to make direct choices between images with different properties. Binary logistic regression analysis revealed that the three indicators of realism were all significant predictors of participants’ assessments that images depict real objects. Shadows emerged as a significant predictor of preference for further exploration together with the presence of cells in the image. Correlation analysis indicated that images that were more often selected as depicting real objects were also more often selected for further exploration. We interpret the results in terms of construal level theory in that a biological image perceived as a realistic portrayal would induce a desire for further exploration. The findings have implications for considering the role of realism and preference in the design of images for communicating science in public spaces.
Development in human knowledge about the world has accompanied an increasing diversity of visual representations and images used to communicate and represent science. A domain of knowledge in which this rings particularly true is the biological sciences, where a multitude of visual imagery is used to communicate levels of biological organization, from unobservable submicroscopic entities through to the tangible macroscopic scale.
An influential aspect of interpreting a biological image is realism, a term that refers to the accurate mapping between the visual representation and reality. Recently, the use of realistic images for conveying scientific content has gained even more traction with the advent of visualization technology such as virtual reality (e.g., Skulmowski et al., 2021), and the exposure of the public to biological visuals in museums and science centers (e.g., Höst et al., 2018). This trend is also vividly apparent in current society, with citizens negotiating and perceiving the wave of biological visual communication in the wake of COVID-19, where biological imagery is a core component in shaping the narrative of the pandemic (e.g., Callender et al., 2020). In contrast with realism, visual abstraction through extracting aspects of a representation also influences perception and understanding. Examples of the influence of abstract properties have been shown in current studies where abstract and perceptually bland visuals of biological change are associated with superior learning in adults, while very young children benefit most from perceptually rich representations (Menendez et al., 2022, 2020). Here, as has been recently shown by Skulmowski (2022), if the aim of an image is for viewers to focus on underlying relationships, abstract images may sometimes be superior to realistic representations.
While debating the virtues of realism versus abstraction in visually communicating science, caution must be taken in making assumptions about the perceptual strengths and limitations of image properties for representing biological phenomena. On this note, according to Smallman and St. John (2005), the assumption that people prefer realistic images is born out of erroneous generalizations such as the fallacy that the human eye is an error-free mental camera, a naïve notion that reinforces the assumed “preference” and automatic positive benefits of realism over other forms. Furthermore, viewers’ representational preferences in interpreting biological visual representations also depends on their previous experience, their perception of the narrative, as well as competence in processing what is often complex imagery (e.g., Pozzer and Roth, 2003; Griffard, 2013). Although the literature suggests that selection and presentation of visual information should be driven from findings in vision science (Smallman and St. John, 2005), little is known about the communicative influence of fine-grained comparisons between the characteristics of visual realism in scientific images. Moreover, there is limited knowledge about what viewer characteristics affect interpretation of biological images, and what might benefit or hinder interpretation (e.g., Skulmowski, 2022). In contributing to this emerging perspective, this study investigates how properties of biological images relate to viewers’ visual preferences, their perceptions of realism, and their desire to explore encountered visual images further.
Visual images are fundamental in the communication of science and are deployed as a representational language among science practitioners, in educational contexts, as well as society at large. In the sciences, visual representations often depict phenomena through various levels and formats that shuttle between the macroscopic, submicroscopic, and symbolic (Johnstone, 1991). In biology, visual images provide an avenue for engaging with and building knowledge about biological structures and processes that are often beyond direct human visual perception. Meaning-making of visual images takes place constantly; when pupils and students view static representations adorned in biology textbooks, right through to public engagement with visualizations in museums and science centers.
The literature contains multiple approaches and taxonomies for distinguishing between how different types of visual representations communicate scientific knowledge (e.g., Gilbert, 2005; Offerdahl et al., 2017). For example, inspired by the classification of visual representations composed by Lohse et al. (1994), Schönborn and Bögeholz (2013) proposed that five primary types of visual representations are used to communicate biology, namely Graphs, Network charts, Structure diagrams, Process diagrams and Photo-realistic pictures. Graphs plot numerical data and encode quantitative information, inherent in representations such as a line graph of population growth. Network charts depict relationships among biological components often through the spatial arrangement of symbols, such as a diagram of a neural network. The visual communication of physical biological objects, such as a sketch of the human heart in cross-section, are termed Structure diagrams, while Process diagrams such as an illustration of gene splicing, are used to convey temporal processes associated with biological objects. Lastly, Photo-realistic pictures realistically depict biological entities, and take the form of, for example, a micrograph of a cell membrane bilayer, or photograph of a terrestrial habitat.
Biology employs and relies on an abundance of diverse visual forms to depict biological meaning, visual forms that in turn can evoke emotion as well as induce or stifle a viewer’s curiosity. For instance, work by Lenski and Großschedl (2022, this issue) has shown that biological images with attributes such as appealing colors can positively influence viewers’ emotions, deepen their image processing and lead to improved learning. At the same time, Eilam (2013) has previously pointed out that while an image might inspire curiosity and provide aesthetic pleasure, it is also important to be aware of what visual elements might diminish these positive dimensions.
An eloquent review by Alesandrini (1984) conveyed that all types of pictorial representations, whether they are realistic, analogical, or abstract, must be explored in terms of their characteristics as communication and learning tools. In response to this call made 40 years ago, continuing to study and classify how different representational forms can be used most effectively for perception is of high interest. When it comes to identifying visual properties that influence perception, Wanger et al. (1992) mention shading and surface texture as two important visual cues for perceiving spatial relations in images. In biology images, visual properties such as shading communicate depth and three dimensions (Griffard, 2013), whilst color and texture properties are related to perceiving a biological structure as authentic (Eilam, 2013). In addition, Rademacher et al. (2001) have presented experimental results indicating that the softness of shadows and the smoothness of surfaces are important parameters for the perception of visual realism. Wang and Doube (2011) have proposed that realism in photographic images based on gradient variance (surface roughness), color variance, and shadow softness have a major influence on perception.
In terms of communicating biology through visual representations, Pozzer and Roth (2003) have posited that biological representations can be classified along a continuum according to the level of contextual detail that they contain. Such a continuum ranges from more detail (less abstraction) to less detail (more abstraction), where a photograph of a flower would lie toward the more detail and less abstraction end while a symbolic equation would lie toward the less detail and more abstraction end. In relation to this work in a biochemistry context, Schönborn and Anderson (2009) deployed what they referred to as a real to abstract continuum to designate visual representations of antibody-antigen interaction. For example, an electron micrograph (× 1,000,000) of antibody-antigen complexes would lie at the realistic end, a stylized space-filling model that pictorially depicts molecular surface interaction between antigen and antibody would lie near the center, while an abstract symbolic portrayal of antibody-antigen interaction represented by a graphical plot of absorbance versus concentration, would lie at the abstract end.
For a quarter of a century, Francis Dwyer studied students’ interpretation of static representations across a visual realism continuum, where the structure of the human heart was often the visually communicated subject of interest. In multiple studies, Dwyer (1967, 1969) found that in comparison with other representations, realistic pictures of the heart were superior for meeting learning objectives. Dwyer’s explanation for these results was that the greater pragmatic detail provided by realistic representations offers students a more natural way to encode the visual information. In a later study that also adopted a representational continuum, Joseph and Dwyer (1984) explored students’ interpretation of a merged representation consisting of an abstract line drawing of one half of the heart with a realistic photograph of the other. The study found that higher levels of prior knowledge supported students’ learning with the realistic half of the representation, while the abstract half supported students with lower prior knowledge more. In addition, previous work (Dwyer, 1975) also showed that students with lower prior knowledge spent more time on processing realistic representations of the heart. As early as the 1960’s, Dwyer’s work already revealed that the perceived and actual benefits of representations for pedagogical outcomes depend on multiple criteria. For instance, the greater the number of representations students have been exposed to, the more superior their procedural skills for decoding visual information. Overall, Dwyer’s extensive contributions to the literature have shown that it is important to systematically identify what representational markings and components are most beneficial for learning. One clear finding was that students favored colored representations of the heart over single color alternatives, where Dwyer (1970, 1972) identified several relationships between colored displays and increased motivation in students to learn.
Recent work by Skulmowski (2022) using skull and bone renderings as subject materials shows that learning tasks that require students to focus on surface and shape dimensions when transferring knowledge from one context to another, are not necessarily improved when the images are realistic. In his study, transfer tasks included students being required to transfer their interpretation of anatomical skull images (e.g., a dog skull) to other skull images (e.g., a pig skull). The work also found that shape distinctness in images did not influence learning with schematic or realistic representations. Nevertheless, interpreting less distinct shapes was associated with higher levels of cognitive load, levels that were reduced when realistic features and shape distinctness were fused. Another recent study by Skulmowski et al. (2021) provided a model for comparing the levels of realism inherent in scientific visualizations. The authors probed the contrast in the literature that while multiple studies have found realism to be useful for learners, other studies show abstract representations to be superior. As part of the development of a cognitive model of learning with realistic visualizations, these same researchers define realism as a combination of geometry, shading and rendering. Merging these dimensions provides different levels of perceptual load for the viewer. Their work advocates that although it might be naïve to merely assume that realism is always superior, the characteristics of what realistic images contribute to perception and learning needs more refinement. During the same period, Skulmowski and Rey (2021) investigated the effect of visual appearance of bacteria on individuals’ assessment of pathogen properties. Among the findings, they show that realistic images were rated as more credible than schematic images. In addition, they observed that disfluency in the bacterial images (i.e., depicting bacteria as irregularly shaped with appendages and hair-like strands, as opposed to perfectly round and smooth) also led to images being rated as more credible.
In a preceding study (Höst et al., 2018), we proposed that the tendency of science center visitors to interact with certain types of images could be partly explained by construal level theory (e.g., Trope and Liberman, 2010). According to construal level theory, people engage differently with objects depending on the psychological distance between the object and the individual. Short psychological distances are associated with low level construal (i.e., focusing on details) while long distances would give rise to high level construal (i.e., focusing on the big picture). The concept of psychological distance encompasses multiple different types of distances, such as temporal, spatial, hypotheticality (whether something appears likely to occur, or to exist), and familiarity (Fiedler, 2007). Thus, depending on the properties of objects, different kinds of psychological distances arise, which in turn, give rise to different types of construal. For example, use of color versus grayscale in images may be associated with different temporal psychological distances, where distant times are associated with less color (e.g., because old photos are often grayscale) (Lee et al., 2014). Our emanating idea from this work was that the properties of biological images give rise to different construal levels, and that low level construal is associated with more interactive behaviors, and vice versa. The rationale is that a low-level construal would emphasize the details of an image, and therefore, would motivate a user to look closer by a desire to further interact with it through actions made possible with modern technology such as zooming and reorienting the image.
The objective of the research is to explore how visual properties (i.e., shading, surface texture, and color) and content of biological representations relate to viewers’ preferences, perceptions of realism and desire to explore further.
A survey study was conducted in which an electronic questionnaire was deployed in a science center context. Inspired by discrete choice experiments (Mangham et al., 2009), the questionnaire instrument exposed respondents to pairs of images and asked them to select one based on specified criteria. Volunteering visitors responded anonymously to the survey using a tablet placed in conjunction with a related interactive visualization exhibit called Microcosmos. The data were analyzed quantitatively in two steps. First, overall patterns in the responses were identified, and second, a predictive statistical model was tested to see if properties of the image could explain the observed patterns.
The Microcosmos exhibit is a digital touch table interface housed at the digital science center Visualization Center C in Sweden. The table provides public visitors with an opportunity to view and explore visual representations and images of biological structures and processes. One objective of the table is to provide visitors with access to (sub)microscopic biological images that are divorced from everyday visual perception. The embedded visual content of Microcosmos includes biological images and representations that visually communicate proteins, viruses, cells, molecules, genes, life processes, and disease. The visual content is represented at multiple levels of biological organization, and through various visual properties such as color, brightness, and contrast. The images cover abstract, stylistic, and realistic examples of biological representation and depict many of the biological representation conventions and formats typically used to convey biological phenomena. Visitors can select and explore the different representations through finger-based gestures.
A questionnaire was developed to probe visitors’ perceptions and reactions to the images embedded in the Microcosmos table exhibit. Assessment of images consisted of participants responding to three questions, each of which required the participant to select one image from an image pair. The first question (“Which of the following two images do you prefer most?”) was designed to elicit information about an overall preference. The second question (“Which of the following two images looks most like a real object to you?”) was designed to probe participants’ assessment of the relative realism of the images in terms of the extent to which the images give the impression of depicting something that physically exists. Thus, the formulation was not intended to induce respondents to evaluate the factual correctness of the images from a scientific point of view. The third question (“Which of the following two images would you like to continue exploring the most?”) was designed to elicit a behavioral intention with respect to interactive exploration. Following each of the three forced-choice responses, the respondents were also asked to motivate their answers. Figure 1 displays a screenshot of the survey screen interface.
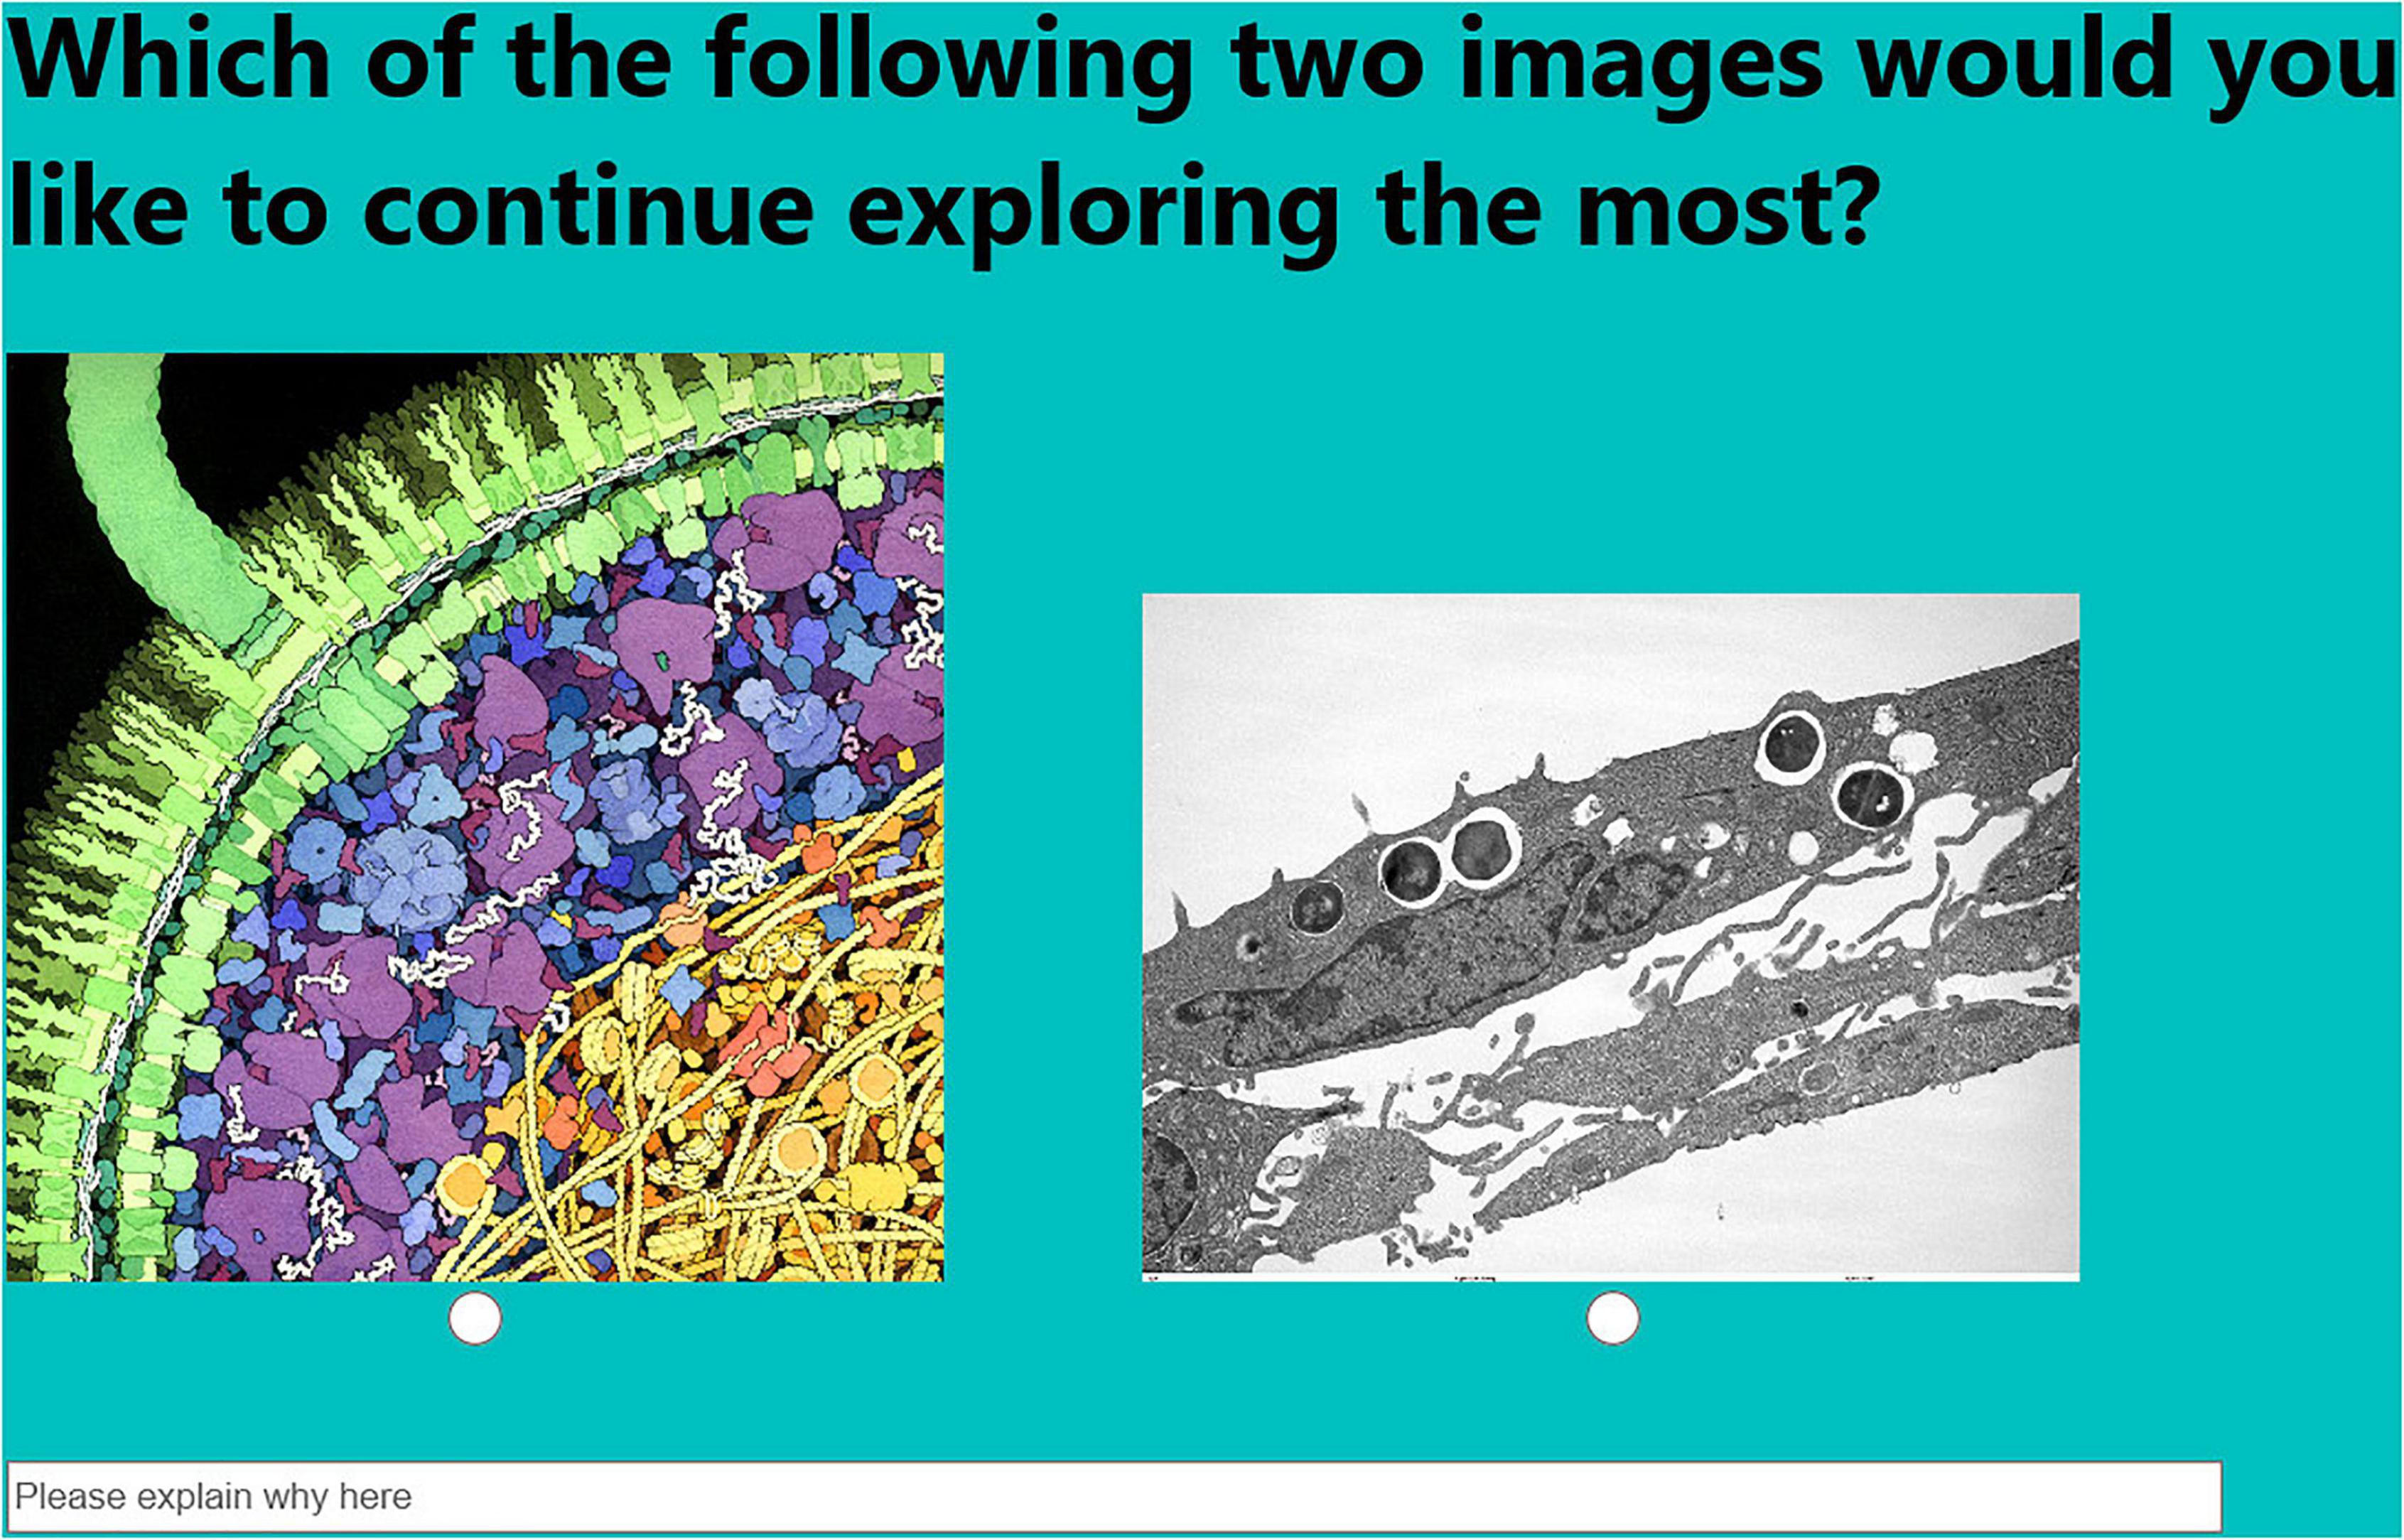
Figure 1. Screenshot of the data collection interface, with one example of a pair of images taken from the Microcosmos exhibit (Höst et al., 2018). In this example, participants are asked to indicate which image they would like to explore further, as an indication of their interaction intention.
Images from the Microcosmos exhibit were chosen for inclusion in the electronic survey based on their visual properties. Four main blocks of four images each were constructed. These consisted, respectively, of (A) images where shading, colors and surface texture created a clear sense of depth in the images; (B) images where colors and shading gave some experience of three-dimensional shapes, albeit clearly of a “flatter” nature than the previous group of images; (C) images where a “watercolor” style had been used and where a range of bright colors, but few depth cues, emphasized molecular and intracellular components (e.g., Goodsell, 2005); and (D) images that contained only a few colors and where no depth cues had been used. In addition, (E) one flat image in grayscale was included. Thus, a total of 17 images were included in five sets of images, which were used as blocks in the randomization of image pairs (see Figure 2). All possible 112 combinations of images between blocks were included in the randomization, while all combinations of images within blocks were excluded.
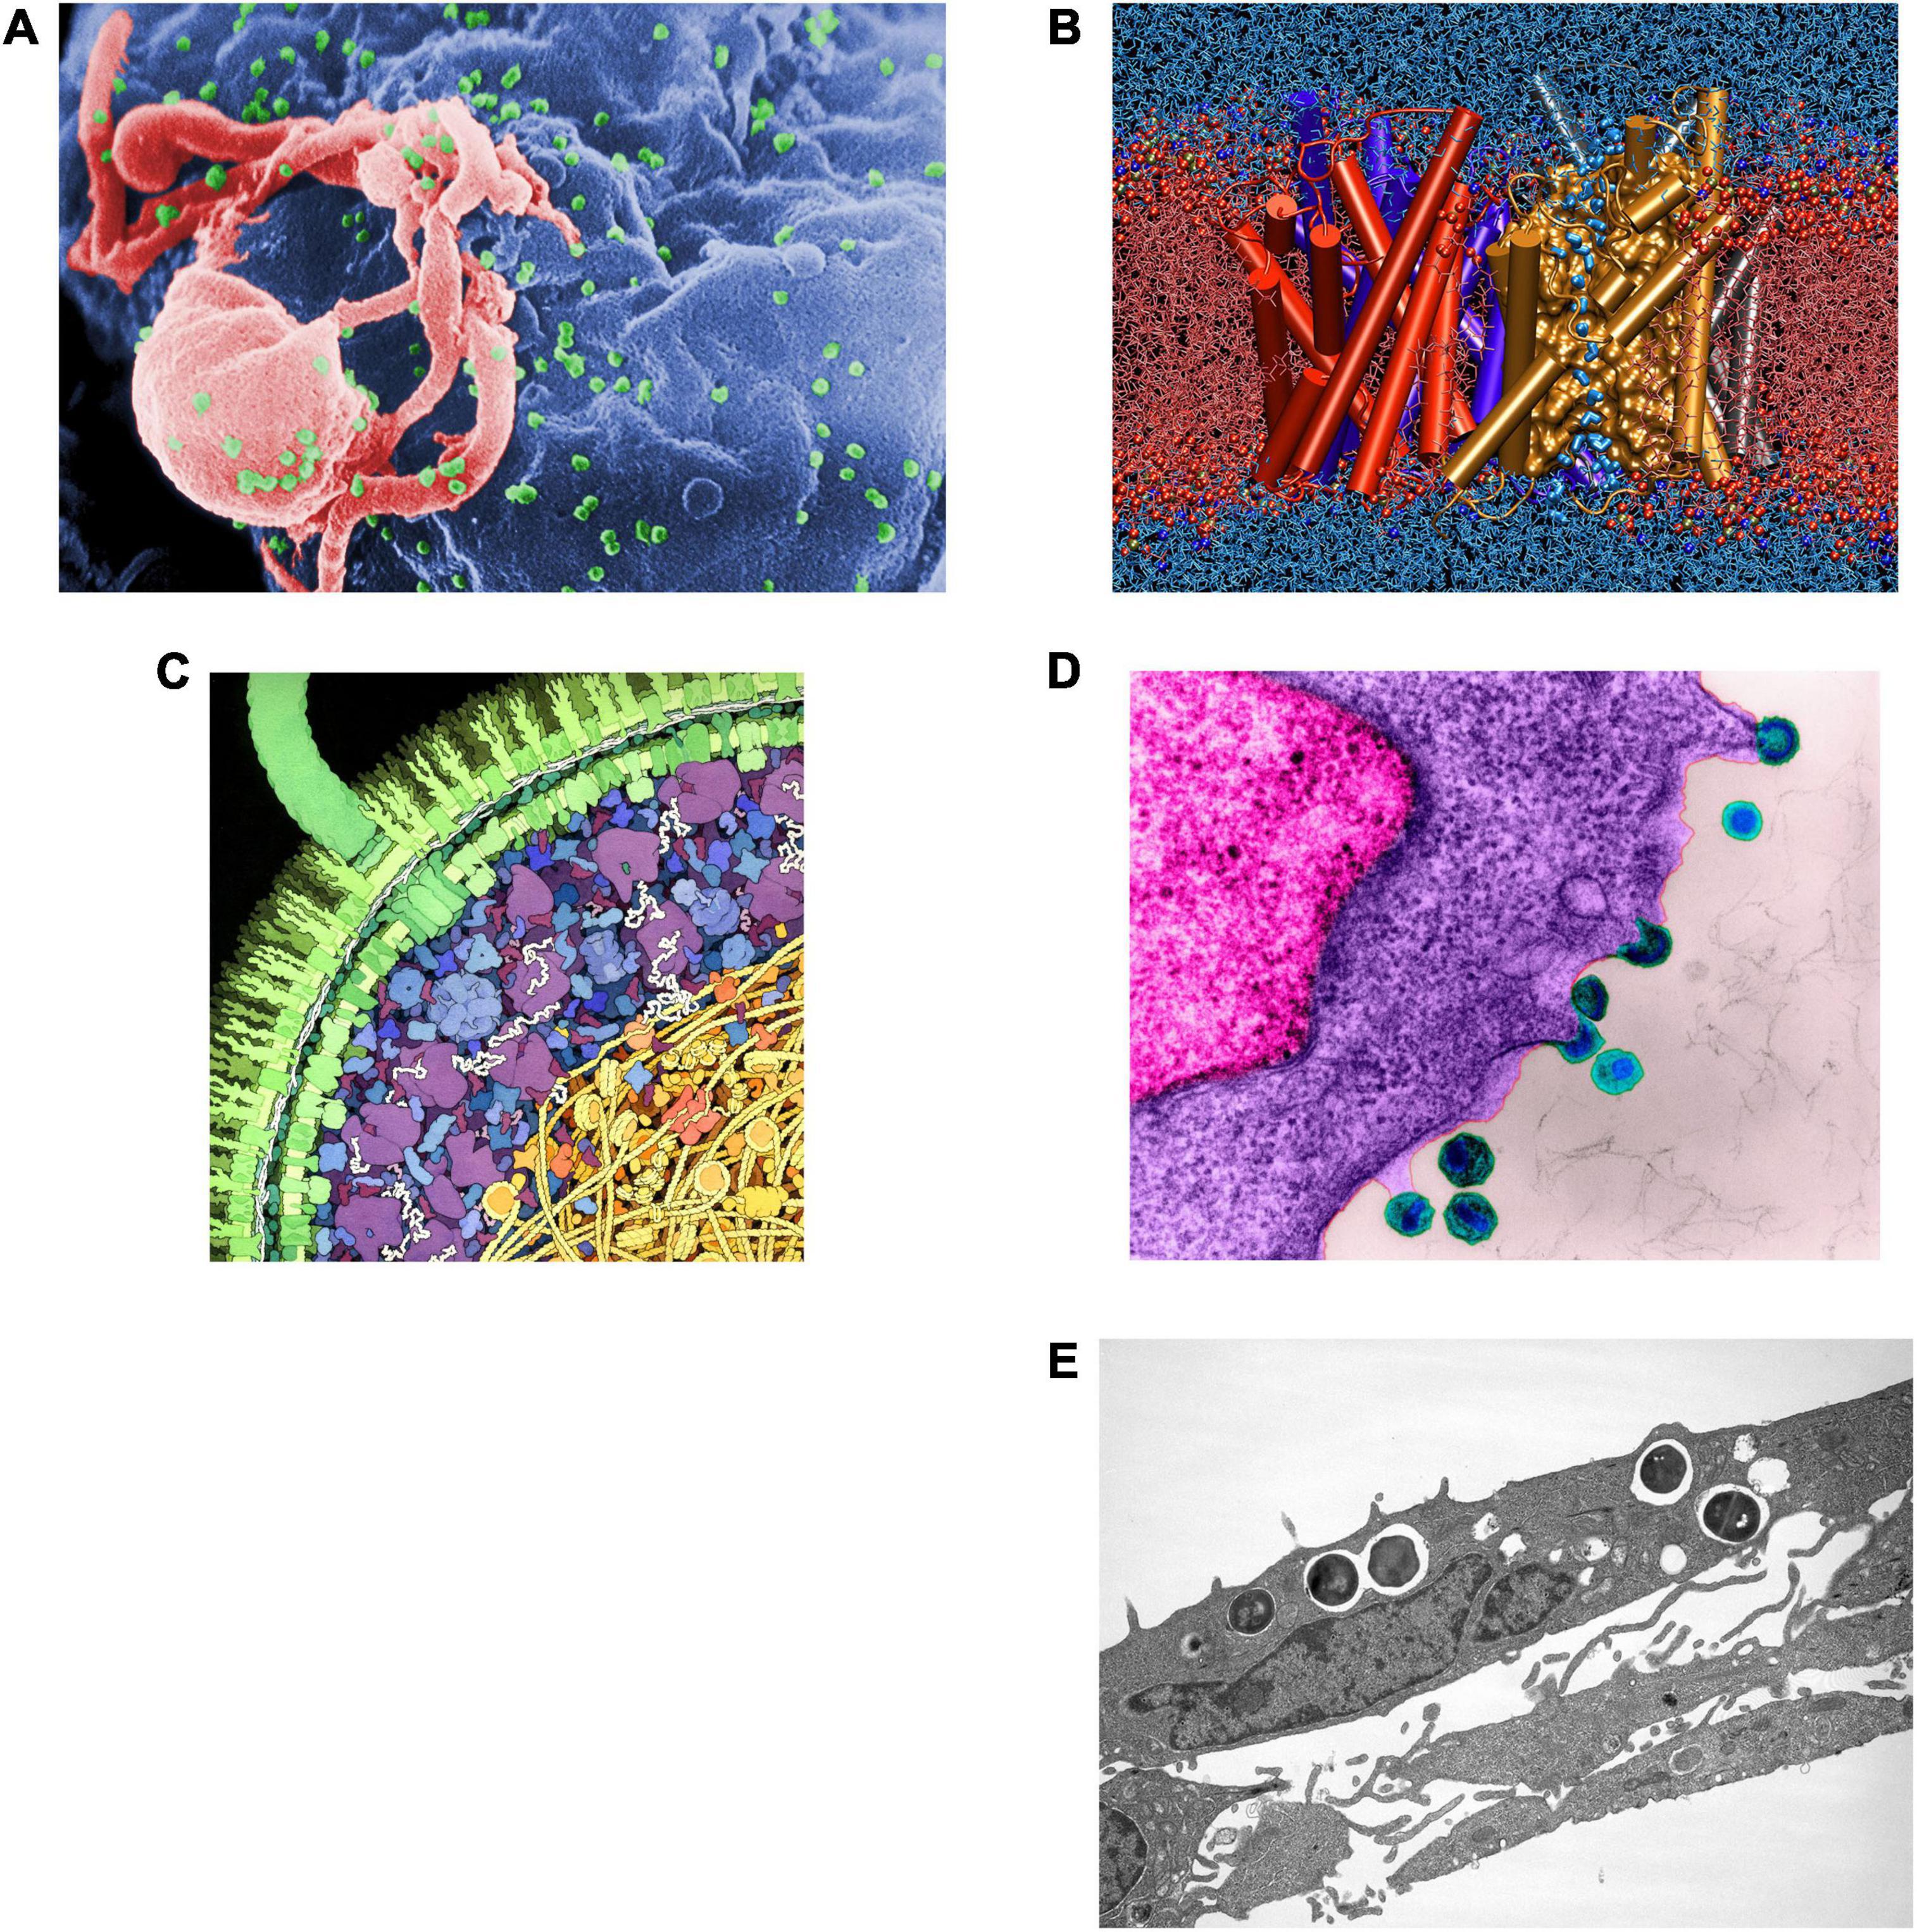
Figure 2. Example images from each of the five blocks (A–E) of images that were included in discrete choice-inspired comparisons. Block (A) The example image depicts HIV viruses budding from a lymphocyte cell. Credit: Photo Credit: C. Goldsmith, Content Providers: CDC/C. Goldsmith, P. Feorino, E. L. Palmer, W. R. McManus. Block (B) The example image shows the water transport protein aquaporin together with a plasma membrane and water molecules. Credit: Emad Tajkhorshid, NIH Center for Macromolecular Modeling and Bioinformatics, University of Illinois at Urbana-Champaign. Block (C) The example image illustrates a part of an Escherichia coli cell in cross-section. Credit: David S. Goodsell, the Scripps Research Institute. Block (D) HIV viruses released from human lymph tissue. Credit: Dennis Kunkel microscopy/Science Photo Library/IBL. Block (E) The example image shows Staphylococcus aureus infection in lung cells. Credit: Todd Jarry, Ambrose Cheung, Louisa Howard.
The questionnaire also included background questions, asking for each respondent’s age and gender. Age was provided by selecting one of nine age ranges (consisting of “5 years or younger”, “6 to 12 years”, “13–20 years”, “21–30 years”, “31–40 years”, and “71 years or older”).
The questionnaire was implemented as an anonymous electronic survey which science center visitors accessed via a tablet mounted next to the Microcosmos exhibit. Informed consent was provided by a text on the start screen that informed participants about the research, and that by responding to the questions, they gave their permission for us to use their responses in the research project. Due to the anonymous, unsupervised, and participant-initiated data collection procedure, it was not possible to collect informed consent from caretakers of any minors that may have responded to the questionnaire. Therefore, we only included data from persons whose stated age was above 20 years in the research. Once initiating the questionnaire, participants could choose to continue or simply discontinue their participation.
Data were collected during a period of 8 weeks. During this time the survey was activated 275 times, yielding a total of 94 complete responses in which respondents aged more than 20 had answered each of the three image selection questions. Each displayed image pair was generated from a randomized list of pairs. The electronic survey form reset automatically after each complete survey response or reset after 2 min of inactivation. The survey software was written with the CakePHP framework and the obtained response data was stored in a local MySQL database on campus.
In a first step, a ranking of the images was constructed for each variable (i.e., image preference, perceived realism, and desire to explore) based on the responses. For each image, the fraction of responses where a user selected that image was calculated across all cases where that image was one of the offered options. Thus, each image was associated with three values in the range 0–1, one for each of the three variables (see Table 1). A value of 1 indicated that an image was always selected, irrespective of what other image it was combined with, while a value of 0 would show that the image was never selected. To compare how the scores and the resulting ranking of images related to each other and to findings from usage statistics from the Microcosmos exhibit, Spearman’s rank correlation was calculated between the scores for image preference, perceived realism, desire to explore, and relative ranking of the individual images based on data from a previous study (Höst et al., 2018).
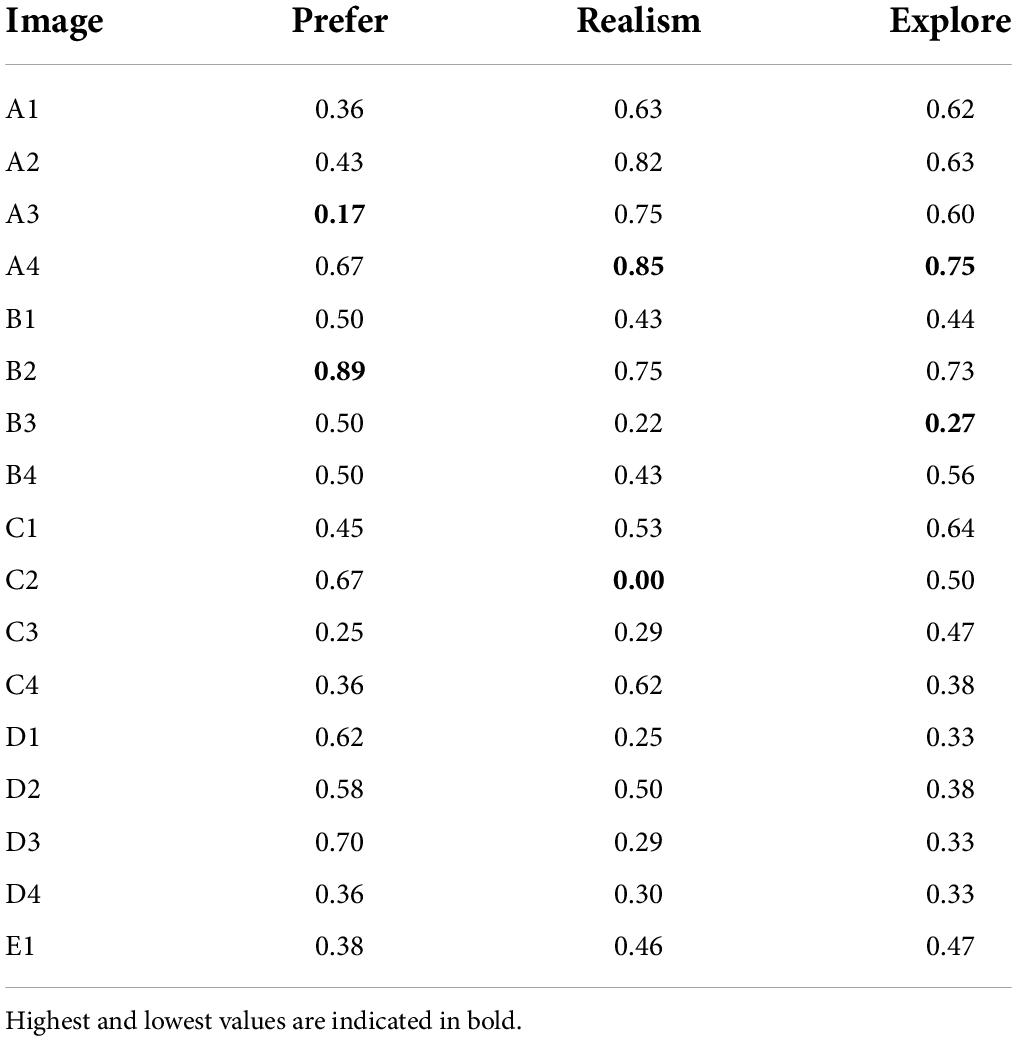
Table 1. Fraction of times each image was selected out of the total number of times it was shown.
Image descriptors were defined to represent realism and content using a coding scheme. Each image was assigned a value for three different aspects of what the literature suggests may contribute to the perceived realism of an image (e.g., Rademacher et al., 2001). The shadows variable describes how light interacts with the objects in the image, while the surface roughness variable describes the degree to which the surface appears to contain microstructures and other discontinuities, and color variance describes the variability of the colors in an image. Codes were assigned in the form of values according to the following code definitions, which were developed iteratively.
None (value 0) – There is no apparent effect from the positions and shapes of objects in the image on how the light appears to interact with the objects. There are no shadows or other depth cues in relation to the spatial positions of objects. Darkening/unfocused depth cue or directional light (value 1) – There are indications of depth in the image, even though they may be inconsistently applied throughout the image space. For example, this can be achieved by making objects that lie “deeper” in the image darker or unfocused. There could also be indications that light comes from some direction, which can be shown by one side of an object being darker (orientated away from the light source) than another side (orientated toward the light source). Casting shadows (value 2) – Objects clearly and consistently cast shadows on themselves and on each other. Shading may also indicate complex surface structures of an object through progressively darker shading in deeper cavities (e.g., “ambient occlusion” rendering).
None/regions of same color (value 0) – The surface does not have any indication of structure, other than perhaps surface areas that differ in color from one another. Gradients (value 1) – Surface structure is consistently indicated by smooth gradients in color or shade. Textured surface (value 2) – The surface has fine-grained variability that gives the impression of microstructures that contributes to a more or less “rough” appearance.
Monochrome/single color (value 0) – The image only depicts objects using one color. This can be a true monochrome depiction with only a single color against a uniform background, or it could be different shades of a single color. Simple colors (multicolor with few shades) (value 1) – Few colors are used and they appear in only a limited number of different shades. Complex colors (multicolor with many shades) (value 2) – Multiple colors are used and appear in multiple shades.
In addition, the content of each image was coded using the following dichotomous variables (using 0 = no, 1 = yes): Virus (image includes one or more viruses); Cell (image includes one or more cells), Molecule (image includes one or more molecules), Imaging data (image is directly based on output from imaging measurements such as electron microscopy). The images employed and the corresponding codes are provided as Supplementary Material to this article.
In a second step, binary logistic regression (Tabachnick and Fidell, 2014; Field, 2018) was used to investigate the importance of the image properties for respondents’ decisions. A new dependent variable was constructed, where each participant decision was coded as 1 if the chosen image had a higher-ranking score (see Table 1) than the image that was not chosen, otherwise it was coded as 0. Predictor variables that represented the realism and content aspects of the images were calculated by discerning the difference in variable value for each descriptor between the selected image and the unselected image in each displayed pair (Mangham et al., 2009). The predictor variables were entered in two steps. Firstly, models were assessed where only the three realism predictors were used, and secondly, the four content predictor variables were entered so that the model included all predictors. Model fits were compared to assess which of the models best explained the data.
All statistical analyses were performed using Jamovi 2.0 (The jamovi project, 2021). An alpha level of 0.05 was used throughout.
A total of 94 anonymous participants completed the questionnaire (46 of which stated female gender, 37 male and 11 other/preferred not to answer). A large fraction of the possible 112 image pairs were included in the study; the data collection yielded data for 85 unique pairs (76% completeness) for the preference question, 87 unique pairs (78% completeness) for perceived realism, and 92 unique pairs (82% completeness) for desire to explore, respectively.
Table 1 shows, for each image and assessment question, how frequently that image was selected when it was displayed to participants. These fractions range between 0.17 and 0.89 for preference, 0.00–0.85 for realism, and 0.27–0.75 for desire to explore. Correlation coefficients were calculated for the three types of values in Table 1 and the relative ranking of the same images observed in another study (Höst et al., 2018). As shown in Table 2, a statistically significant correlation was found between the scores for perceived realism and desire to explore. No other significant correlations were observed.
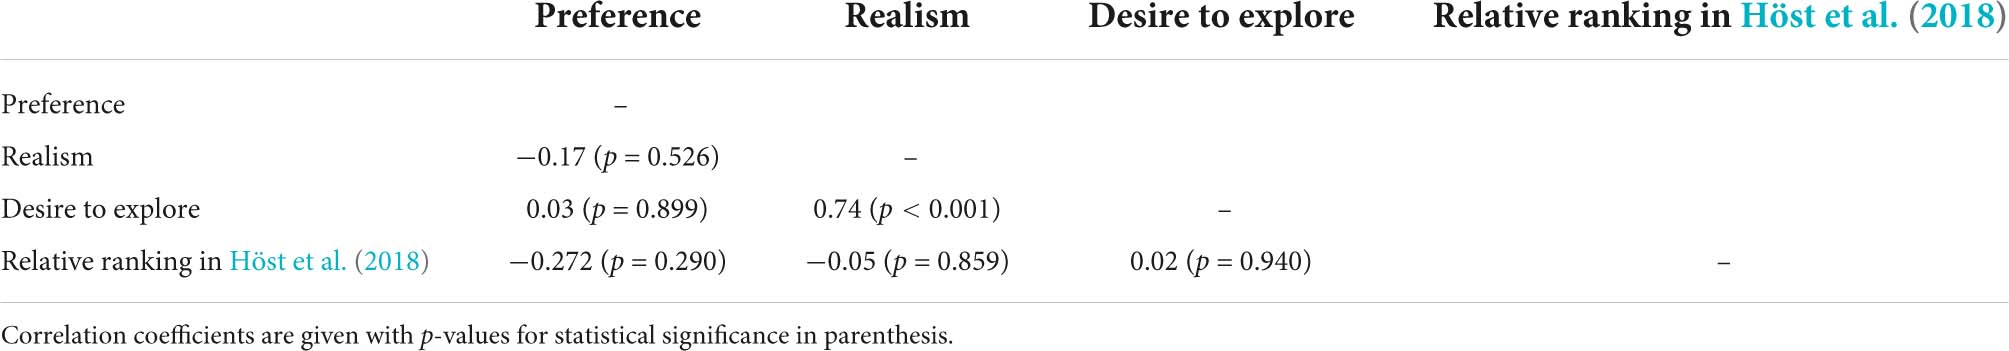
Table 2. Spearman’s rho correlation coefficients between image scores for preference, realism, desire to explore and relative ranking in previous data (Höst et al., 2018).
Two sequential binary logistic regression analyses were performed for each discrete choice criterion (i.e., image preference, perceived realism, and desire to explore). In the first, predictor variables related to visual realism (i.e., shadows, surface roughness, and color variation) were entered. In the second, predictor variables related to the content (i.e., presence of viruses, cells, molecules, and imaging data) were inputted. The two models were compared to ascertain whether the content-related variables added predictive power to the model.
For preference, the model with only variables related to realism indicated that the shadow predictor variable was a significant and negative influence in the decision while the surface roughness predictor variable had a significant and positive influence (Table 3). These influences were retained in the full model, which also included the predictor variables related to content. In addition, the cell and molecule predictor variables also became significant, with positive influence on the decision. The full model was found to provide a better fit for the data (χ2 = 14.4, df = 4, p = 0.006) and is therefore interpreted. The model with all predictors was statistically significant and classified 81.9% of the cases correctly. There was a significant relationship between selecting an image with a higher preference score and the predictors in the model (χ2 = 36.1, df = 7, p < 0.001). Nagelkerke’s R2 was 0.456.
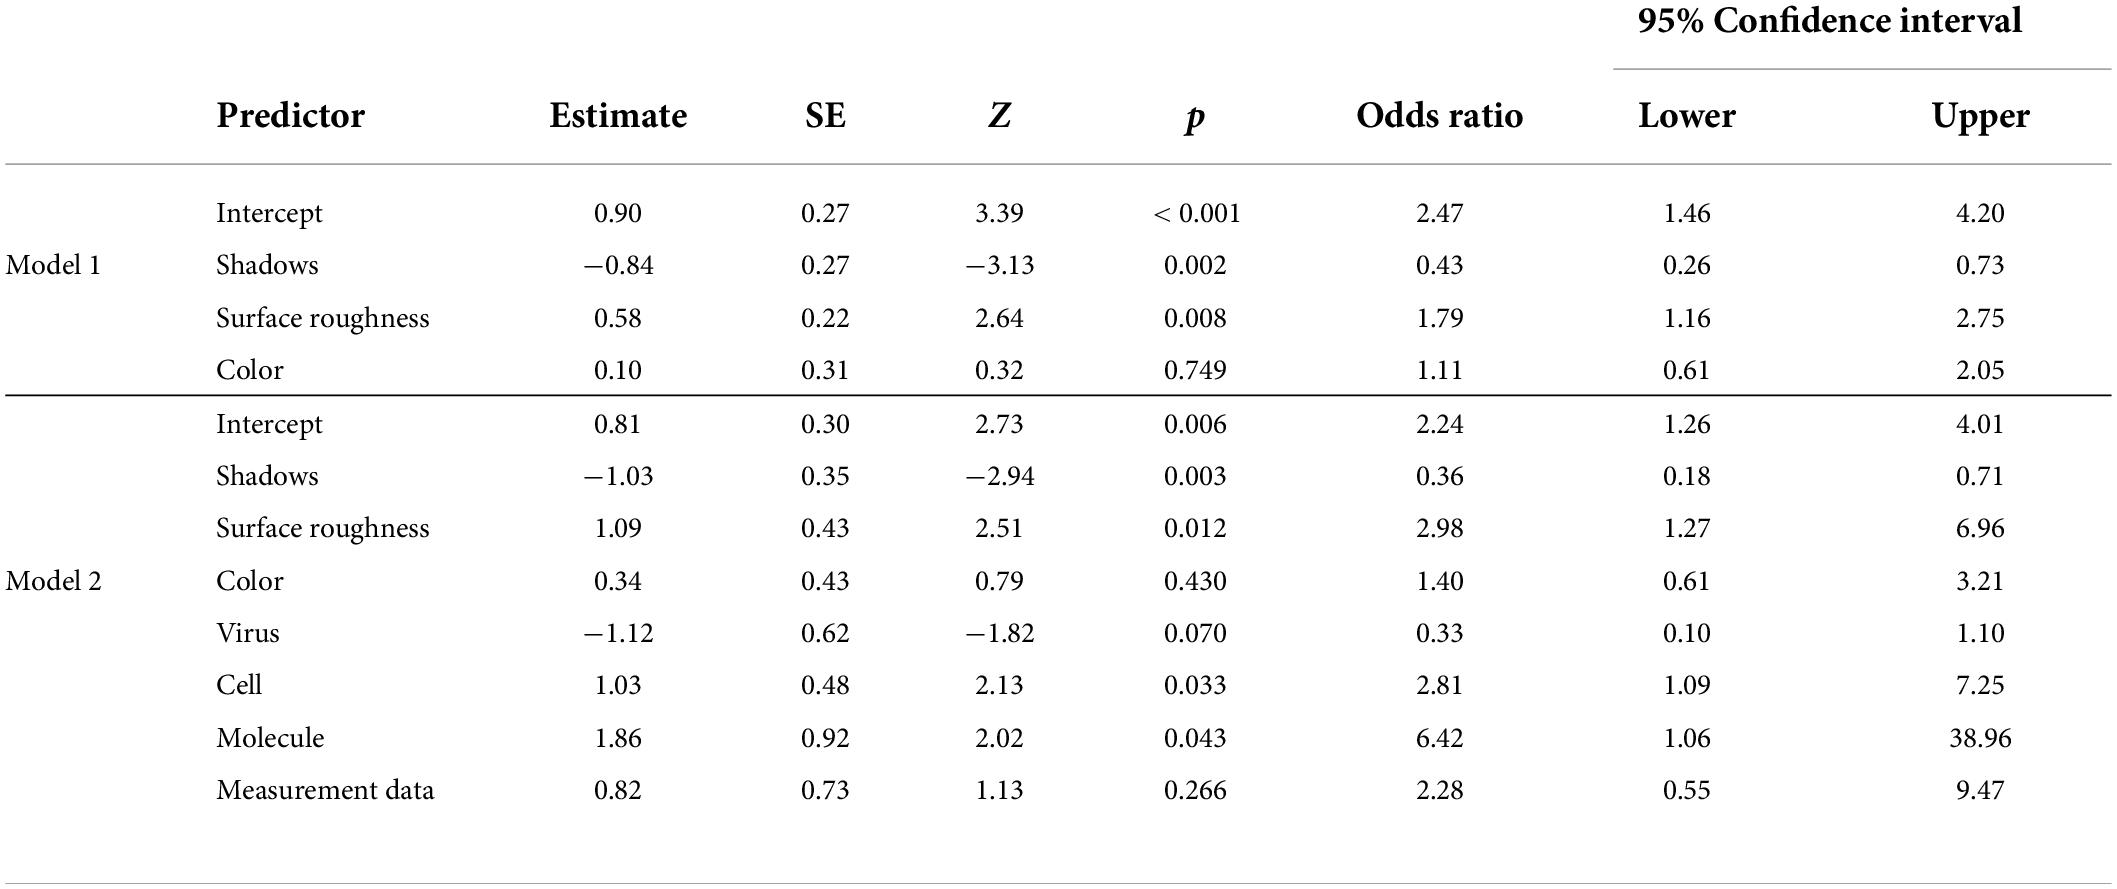
Table 3. Binary logistic regression analysis of participants’ image preferences.
In summary, relatively higher values for shadow decrease the probability that an image with a higher-ranking score will be selected, while increased values for surface roughness, cell and molecule increased the probability. This indicates that among the realism predictor variables, the presence of shadows and surface roughness, but not variation in color, are important determinants of participants’ preferences. Likewise, the presence of cells and molecules, but not viruses or measurement data, are important determinants of what image participants prefer.
In the case of perceived realism, the model with only predictor variables related to realism indicated that the three predictors significantly and positively influenced the decision (Table 4). This influence was retained for shadows and color variation, but not for surface roughness, when the predictor variables related to content were entered. None of the content-related predictor variables had any significant influence on the decision. The full model was not found to give a better fit for the data (χ2 = 4.33, df = 4, p = 0.363), and therefore the model with only variables related to realism were interpreted. The model with the three realism predictors was statistically significant and classified 92.7% of the cases correctly. There was a significant relationship between selecting an image with a higher preference score and the predictors in the model (χ2 = 54.6, df = 3, p < 0.001). Nagelkerke’s R2 was 0.656.
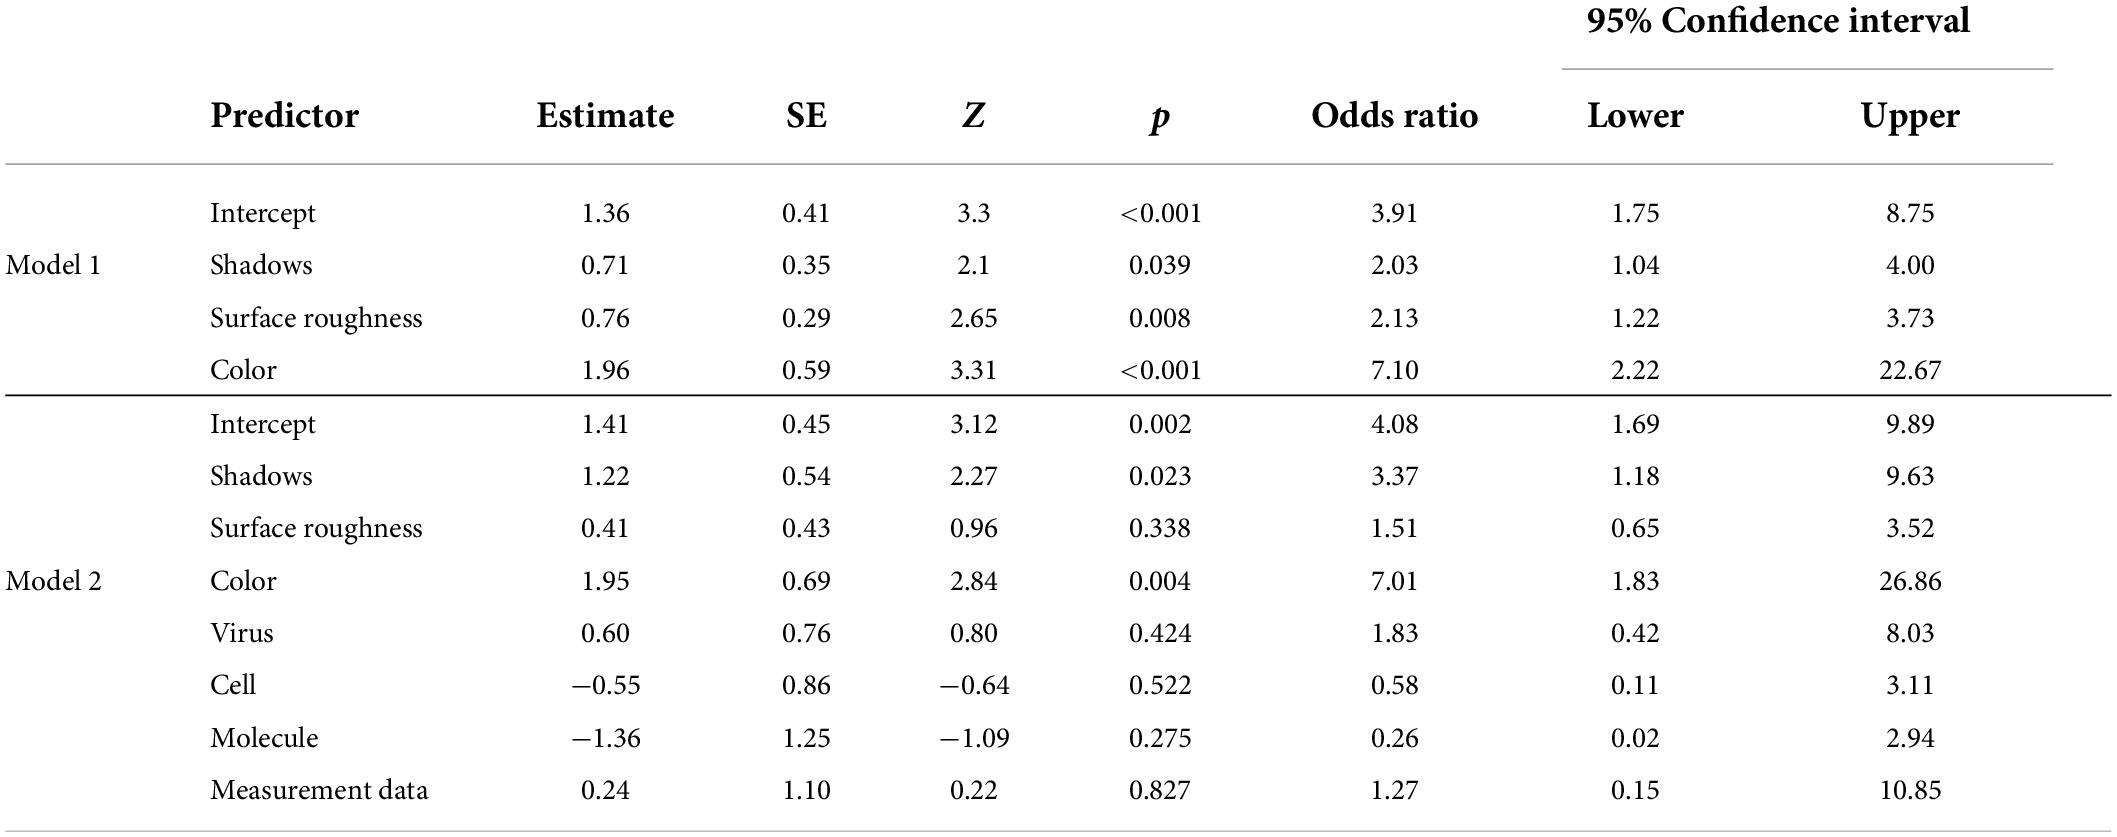
Table 4. Binary logistic regression analysis of participants’ assessment of whether images look like real objects.
In summary, relatively higher values for shadows, surface roughness and color variation increased the probability of an image with a higher-ranking score being selected, in turn indicating that all three dimensions were of importance in participants’ assessments of which image looks more like a real object.
For desire to explore, all three predictors related to realism significantly and positively influenced the decision (Table 5) in the first model. However, when the content-related predictor variables were entered, only the shadows variable remained significant. In addition, the cell predictor variable showed a significant and positive influence on the decisions. The full model was found to give a better fit for the data (χ2 = 16.2, df = 4, p = 0.003) and was therefore interpreted. The model with all predictors was statistically significant and classified 84.0% of the cases correctly. There was a significant relationship between selecting an image with a higher preference score and the predictors in the model (χ2 = 60.5, df = 7, p < 0.001). Nagelkerke’s R2 was 0.664.
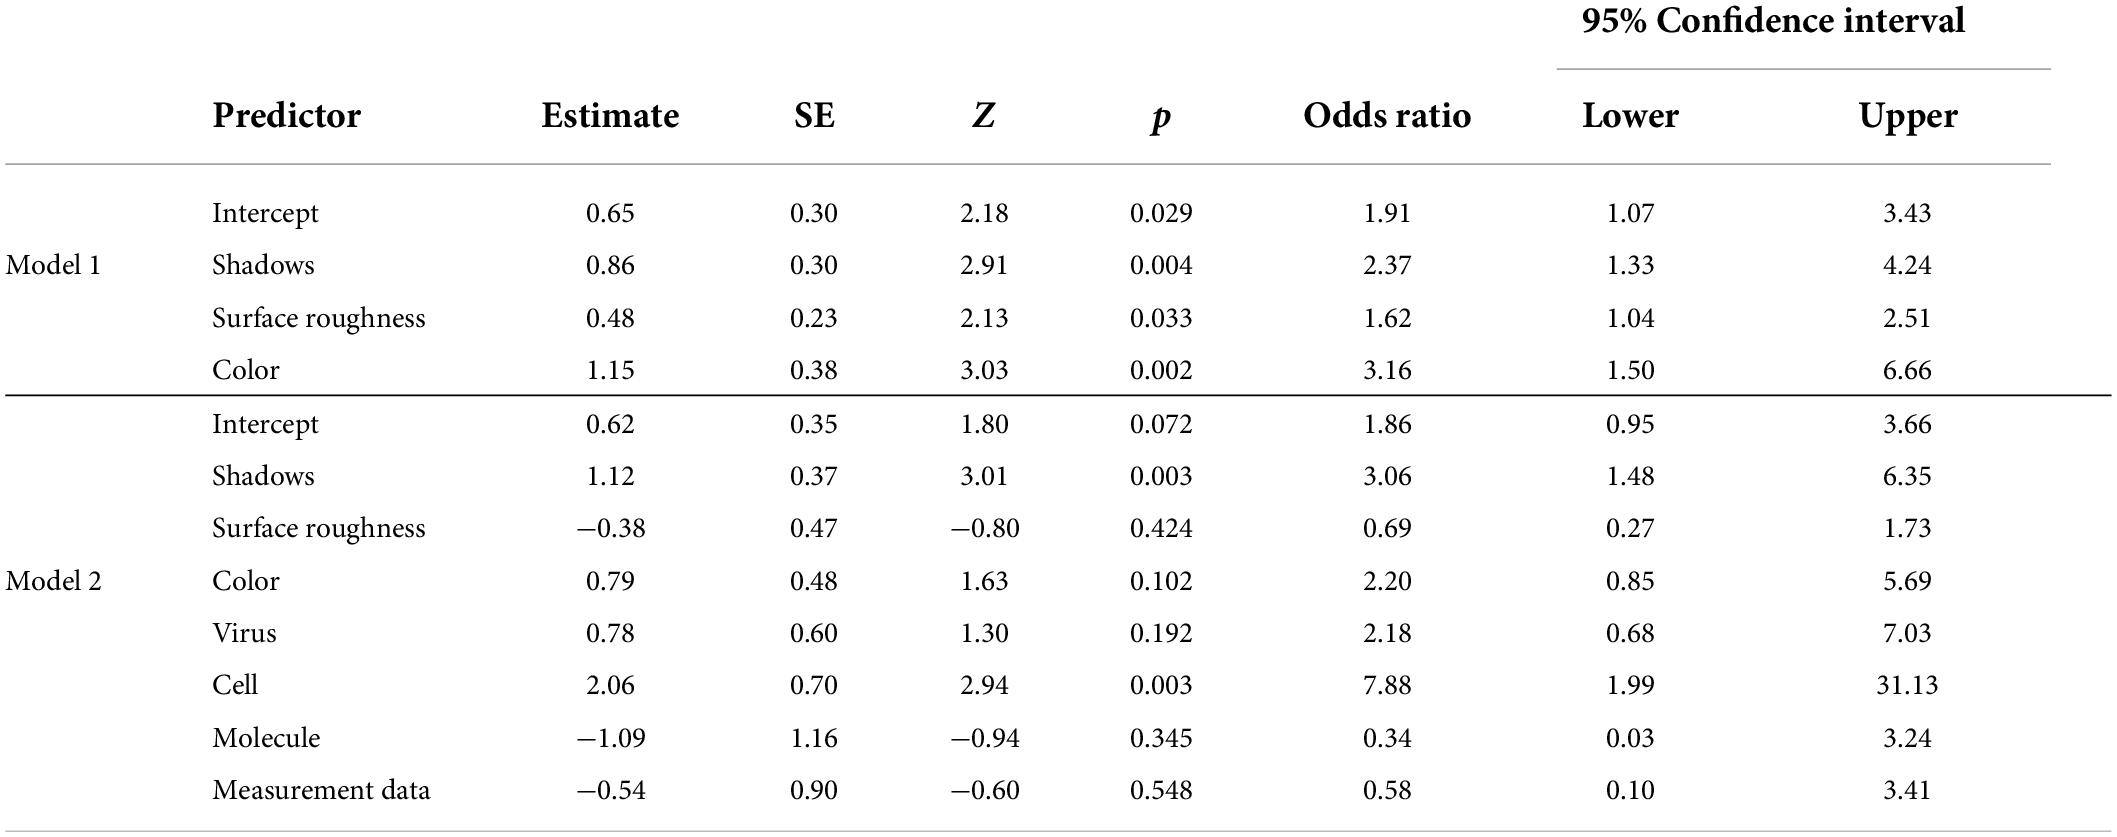
Table 5. Binary logistic regression analysis of participants’ desire to explore images.
In summary, relatively higher values for shadows, but not surface roughness or color difference, increased the probability of participants selecting an image. The presence of cells was also important for participants’ desire to explore an image.
The underlying hypothesis that guided this research was the idea that perceived realism in a biological image would make participants more interested in exploring that image. The hypothesis is supported by the revealed positive correlation between image scores for perceived realism and desire to explore. In turn, this indicates that if an image tended to be selected as being most like a real object, it would also tend to be selected as the one which is most inviting for further exploration. In terms of image properties, the presence of shadows predicted both perceived realism and desire to explore an image further (Table 6). This indicates a potential link between what makes persons perceive an image as depicting a real image and what makes it attractive for further exploration. Certainly, given two images, more use of shadows in one of them is the only factor of the three related to visual realism that would increase the probability of that image being chosen for further exploration. Furthermore, the presence of cells in one but not the other image would increase the probability of that image being chosen for further exploration. Thus, the depicted content of an image is clearly important for a person’s interest in exploring that image, while the depicted content is not critical for perceiving something as a real object.
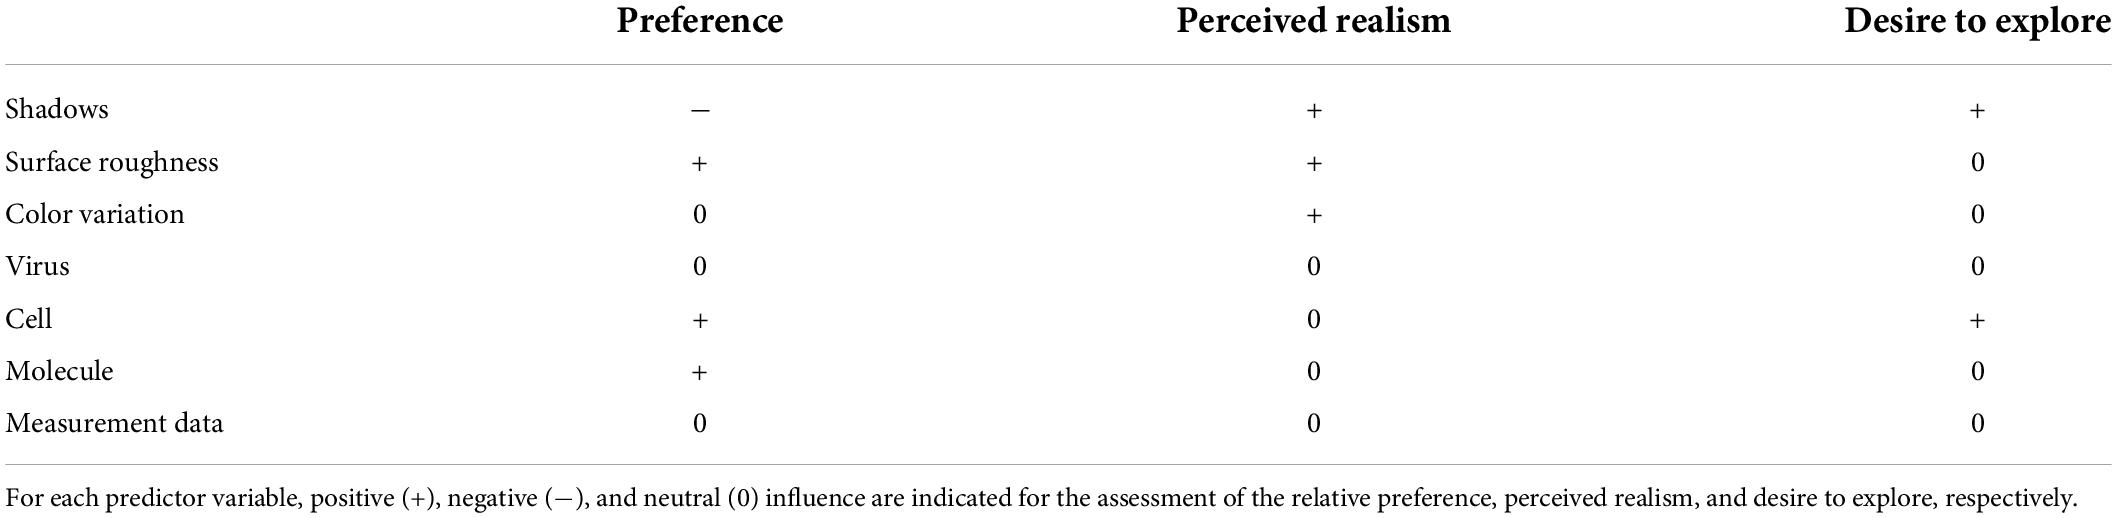
Table 6. Summary of findings from binary logistic regression analysis.
Given two images, more use of shadows, surface roughness and color variation in one of the images would increase the probability of that image being chosen as being most like a real object. In this regard, the findings corroborate suggestions from the literature that shadows, surface roughness and color variation are important for perceiving an image as a depiction of a real object (e.g., Rademacher et al., 2001; Wang and Doube, 2011). In this line, recent work indicates that it should not merely be assumed that realistic images are superior for retention of information or for applying knowledge from one context to another. The benefit of realistic representations is dependent on the nature of the foreseen interpretation task, with a particular advantage when the intention is for the viewer to remember or learn surface details (e.g., Skulmowski, 2022). Moreover, Sayim and Cavanagh (2011) have shown that a viewers’ recognition on an image such as abstract sketch or line drawing is closely related to memory. If an abstract line drawing is interpreted as familiar, memory inputs the missing details pertaining to depth and surface texture, also often resulting in a three-dimensional interpretation.
In a preceding study, we analyzed science center visitors’ use of the Microcosmos exhibit (Höst et al., 2018). The findings concluded that visitors tended to engage more with images that portrayed viruses, were colorful and represented imaging output. None of these variables were revealed in the present study as significant influences on participants’ choice in relation to further exploration. In addition, no correlations were found between relative ranking in the previous study and the values for desire to explore in this study. It is likely that the differences in the respective “choice situations” may explain this discrepancy. In this study, inspired by discrete choice experiments, image pairs were systematically varied to allow participants to make direct choices between widely differing images. In contrast, the Microcosmos exhibit was organized by content topic, so that visitors would decide to interact with a particular image in the context of other thematically related images (e.g., virus images, depending on what theme was selected).
When it comes to results regarding participants’ image preferences, these appear to be influenced in a complex way by multiple characteristics. Clearly, the pattern of influence of the predictors is not the same as for perceived realism or desire to explore (Table 6). Given the relatively low model fit for this data, it seems that the individual esthetic judgments involved in the decisions of which image participants preferred cannot be adequately captured by the relatively simple image characterization used in this study. In this regard, Skulmowski (2022) has recently shown that the benefits of realism appear highly dependent on the situation and calls for continuing research into identifying what fine-grained realistic features support or hinder perception.
In the present study, data were collected without supervision in an authentic environment. While this reduced our control of the process, it may contribute to ecological validity that would be lacking in a more clinical laboratory setting. Nevertheless, supervised data collection wherein science center visitors are approached to respond to the survey could serve to increase the number of participants and provide better insight into who responded. The authentic context also limited the selection of images used in the study, given that it was premised on examining participants’ perceptions of the images that were present in the adjacent Microcosmos exhibit.
The hypothesis that images depicting entities that look like real objects would be preferred for further exploration was based on construal level theory (Trope and Liberman, 2003). The perceived realism was intended to capture the hypotheticality dimension of psychological distance (Trope and Liberman, 2010), which asserts that real objects are associated with a shorter psychological distance than imagined objects. The logic is that the lower-level construal resulting from an object perceived to be real would focus participants more on the details and concrete aspects of the image, which would invite them to explore the image in more detail by, for example, observing it for a longer period or focusing on specific parts.
While the findings can support the above interpretation, there are of course other avenues through which properties of the images could influence a person’s tendency to approach the content at different construal levels. For example, differences in prior information about the portrayed object may be associated with different psychological distances (informational distance) (Fiedler, 2007). In a science communication context, this would make the scientific prior knowledge about the content of the biological images important (e.g., Eilam, 2013) and could perhaps explain the finding in this study that the presence of cells, which may to some extent be a known biological object to most adults, are associated with a desire to continue to explore. In addition, biological content knowledge would also be associated with a more developed visual literacy regarding scientific communication, which could have important consequences for how the images are processed. Duan and Bombara (2022) found that visual literacy moderates the effect of climate change images that differ in the level of abstraction. For less visually literate participants, abstract images were associated with perceiving a longer psychological distance, and vice versa, while this effect was absent for more visually literate participants. Hence, scientific pre-knowledge, including familiarity with disciplinary representational conventions, is an interesting parameter to include in future studies that can build on what is already known in the visual literacy literature (Schönborn and Anderson, 2010).
The findings of this study may have implications for practitioners in public science center exhibits. Given the importance of self-guided interactive exploration in modern science communication venues, inviting visitors to start exploring exhibits is very important. In this regard, the results could indicate that depictions that look like real objects may be associated with a stronger attractive power. In addition, the findings relate to the pedagogical discussion of whether science learning is best served by introducing realistic images early or if it is more beneficial to start with schematic visuals in the classroom (e.g., Menendez et al., 2022). The observed tendency to prefer exploring realistic images could indicate that such images may be a plausible starting point from a motivational perspective. However, research that analyzes the connection between scientific image properties, construal level, and learning-related behaviors is only in its infancy. Future research could explore a wider range of authentic images as well as systematic variation of realism indicators in a synthetic dataset (e.g., Skulmowski et al., 2021). In combination with further unpacking how biological visual images might shape viewers’ visual narratives (e.g., Callender et al., 2020), future work could also investigate the interplay between visualizations and construal level in other science education fields, for example astronomy. Such studies could also widen the methodological repertoire to include eye-tracking techniques for example (Gong and Chu, 2022).
The raw data supporting the conclusions of this article will be made available by the authors, without undue reservation.
Ethical review and approval was not required for the study on human participants in accordance with the local legislation and institutional requirements. The participants provided their written informed consent to participate in this study.
GH, KS, and LT conceptualized the study design and the data collection procedure. GH conducted the primary analysis and drafted the first version of the manuscript. KS performed the synthesis of the current state of the art. GH and KS revised and finalized the manuscript. All authors read and approved the final manuscript.
This research was funded by the Norrköpings fond för Forskning och Utveckling grant number: NK KS 2016/0417.
The authors declare that the research was conducted in the absence of any commercial or financial relationships that could be construed as a potential conflict of interest.
All claims expressed in this article are solely those of the authors and do not necessarily represent those of their affiliated organizations, or those of the publisher, the editors and the reviewers. Any product that may be evaluated in this article, or claim that may be made by its manufacturer, is not guaranteed or endorsed by the publisher.
We thank Visualiseringscenter C for the opportunity to collect the data for this study as part of the public exhibition, and also appreciate the anonymous participation of the respondents in this study. Henry Fröcklin was acknowledged for his technical assistance in developing the data-capturing software. The images in Figure 2 are used with permission.
The Supplementary Material for this article can be found online at: https://www.frontiersin.org/articles/10.3389/feduc.2022.933087/full#supplementary-material
Callender, B., Obuobi, S., Czerwiec, M. K., and Williams, I. (2020). COVID-19, comics, and the visual culture of contagion. Lancet 396, 1061–1063. doi: 10.1016/S0140-6736(20)32084-5
Duan, R., and Bombara, C. (2022). Visualizing climate change: the role of construal level, emotional valence, and visual literacy. Clim. Change 170:1.
Dwyer, F. M. (1967). The relative effectiveness of varied visual illustrations in complementing programed instruction. J. Exp. Educ. 36, 34–42.
Dwyer, F. M. (1969). Student perception of the instructional value of visual illustration. Med. Biol. Illustrat. 19, 42–45.
Dwyer, F. M. (1970). Exploratory studies in the effectiveness of visual illustrations. Audio Vis. Commun. Rev. 18, 235–249.
Dwyer, F. M. (1972). The effect of overt responses in improving visually programed science instruction. J. Res. Sci. Teach. 9, 47–55.
Dwyer, F. M. (1975). On visualized instruction effect of students’ entering behavior. J. Exp. Educ. 43, 78–83.
Eilam, B. (2013). “Possible constraints of visualization in biology: challenges in learning with multiple representations,” in Multiple Representations in Biological Education, eds D. F. Treagust and C.-Y. Tsui (Dordrecht: Springer), 55–73.
Fiedler, K. (2007). Construal level theory as an integrative framework for behavioral decision-making research and consumer psychology. J. Consum. Psychol. 17, 101–106.
Field, A. (2018). Discovering Statistics Using IBM SPSS Statistics, 5th Edn. London: SAGE Publications Ltd.
Gilbert, J. K. (2005). “Visualization: A metacognitive skill in science and science education,” in Visualization in Science Education, eds J. K. Gilbert and C. Boulter (Dordrecht: Springer), 9–27.
Gong, Z. H., and Chu, H. (2022). Seeing risks or solutions: psychological distance and ecological worldview moderated the effect of disgust images on attention to environmental messages. SAGE Open 12:21582440221103857.
Griffard, P. B. (2013). “Deconstructing and decoding complex process diagrams in university biology,” in Multiple Representations in Biological Education, eds D. F. Treagust and C.-Y. Tsui (Dordrecht: Springer), 165–183.
Höst, G. E., Schönborn, K. J., Fröcklin, H., and Tibell, L. A. (2018). What biological visualizations do science center visitors prefer in an interactive touch table? Educ. Sci. 8:166.
Johnstone, A. H. (1991). Why is science difficult to learn? Things are seldom what they seem. J. Comput. Assist. Learn. 7, 75–83.
Joseph, J. H., and Dwyer, F. M. (1984). The effects of prior knowledge, presentation mode, and visual realism on student achievement. J. Exp. Educ. 52, 110–121.
Lee, H., Deng, X., Unnava, H. R., and Fujita, K. (2014). Monochrome forests and colorful trees: The effect of black-and-white versus color imagery on construal level. J. Consum. Res. 41, 1015–1032.
Lenski, S., and Großschedl, J. (2022). Emotional design in concept maps – No support but also no burden. Front. Educ. 7:807627. doi: 10.3389/feduc.2022.807627
Lohse, G. L., Biolsi, K., Walker, N., and Rueter, H. H. (1994). A classification of visual representations. Commun. ACM 37, 36–50.
Mangham, L. J., Hanson, K., and McPake, B. (2009). How to do (or not to do)…Designing a discrete choice experiment for application in a low-income country. Health Policy Plann. 24, 151–158.
Menendez, D., Rosengren, K. S., and Alibali, M. W. (2020). Do details bug you? Effects of perceptual richness in learning about biological change. Appl. Cogn. Psychol. 34, 1101–1117.
Menendez, D., Rosengren, K. S., and Alibali, M. W. (2022). Detailed bugs or bugging details? The influence of perceptual richness across elementary school years. J. Exp. Child Psychol. 213:105269.
Offerdahl, E. G., Arneson, J. B., and Byrne, N. (2017). Lighten the load: Scaffolding visual literacy in biochemistry and molecular biology. CBE Life Sci. Educ. 16:es1. doi: 10.1187/cbe.16-06-0193
Pozzer, L. L., and Roth, W.-M. (2003). Prevalence, function, and structure of photographs in high school biology textbooks. J. Res. Sci. Teach. 40, 1089–1114.
Rademacher, P., Lengyel, J., Cutrell, E., and Whitted, T. (2001). “Measuring the perception of visual realism in images,” in Rendering Techniques 2001, eds S. J. Gortler and K. Myszkowski (Vienna: Springer), 235–247.
Sayim, B., and Cavanagh, P. (2011). What line drawings reveal about the visual brain. Front. Hum. Neurosci. 5:118. doi: 10.3389/fnhum.2011.00118
Schönborn, K. J., and Anderson, T. R. (2009). A model of factors determining students’ ability to interpret external representations in biochemistry. Int. J. Sci. Educ. 31, 193–232.
Schönborn, K. J., and Anderson, T. R. (2010). Bridging the educational research-teaching practice gap: Foundations for assessing and developing biochemistry students’ visual literacy. Biochem. Mol. Biol. Educ. 38, 347–354. doi: 10.1002/bmb.20436
Schönborn, K. J., and Bögeholz, S. (2013). “Experts’ views on translation across multiple external representations in acquiring biological knowledge about ecology, genetics and evolution,” in Multiple Representations in Biological Education, eds D. F. Treagust and C.-Y. Tsui (Dordrecht: Springer), 111–128.
Skulmowski, A. (2022). Realistic visualizations can aid transfer performance: Do distinctive shapes and descriptive labels contribute towards learning? J. Comput. Assist. Learn. 38, 681–691.
Skulmowski, A., Nebel, S., Remmele, M., and Rey, G. D. (2021). Is a preference for realism really naive after all? A cognitive model of learning with realistic visualizations. Educ. Psychol. Rev. 34, 649–675.
Skulmowski, A., and Rey, G. D. (2021). Visualizing pathogens: disfluent shapes of pathogens increase their perceived complexity and danger while realism and disfluency boost the credibility of visualizations. Hum. Behav. Emerg. Technol. 3, 16–323. doi: 10.1002/hbe2.232
Smallman, H. S., and St. John, M. (2005). Naive realism: Misplaced faith in realistic displays. Ergonom. Design 13, 6–13. doi: 10.1111/j.1756-8765.2010.01114.x
Tabachnick, B. G., and Fidell, L. S. (2014). Using Multivariate Statistics. London: Pearson Education.
The jamovi project (2021). jamovi (Version 2.0.0.0) [Computer Software]. Available online at: https://www.jamovi.org (accessed July 16, 2021).
Trope, Y., and Liberman, N. (2010). Construal-level theory of psychological distance. Psychol. Rev. 117:440.
Wang, N., and Doube, W. (2011). “How real is reality? a perceptually motivated system for quantifying visual realism in digital images,” in Proceedings of the 2011 International Conference on Multimedia and Signal Processing, Manhattan, NY.
Keywords: biological images, realism, visual preferences and exploration, construal level theory, science centers
Citation: Höst G, Schönborn KJ and Tibell L (2022) Visual images of the biological microcosmos: Viewers’ perception of realism, preference, and desire to explore. Front. Educ. 7:933087. doi: 10.3389/feduc.2022.933087
Received: 30 April 2022; Accepted: 04 July 2022;
Published: 22 July 2022.
Edited by:
Vassilia Hatzinikita, Hellenic Open University, GreeceReviewed by:
Georgios Ampatzidis, School of Pedagogical and Technological Education, GreeceCopyright © 2022 Höst, Schönborn and Tibell. This is an open-access article distributed under the terms of the Creative Commons Attribution License (CC BY). The use, distribution or reproduction in other forums is permitted, provided the original author(s) and the copyright owner(s) are credited and that the original publication in this journal is cited, in accordance with accepted academic practice. No use, distribution or reproduction is permitted which does not comply with these terms.
*Correspondence: Konrad J. Schönborn, a29ucmFkLnNjaG9uYm9ybkBsaXUuc2U=
Disclaimer: All claims expressed in this article are solely those of the authors and do not necessarily represent those of their affiliated organizations, or those of the publisher, the editors and the reviewers. Any product that may be evaluated in this article or claim that may be made by its manufacturer is not guaranteed or endorsed by the publisher.
Research integrity at Frontiers
Learn more about the work of our research integrity team to safeguard the quality of each article we publish.