- 1Cardiff School of Biosciences, Cardiff University, Cardiff, United Kingdom
- 2Diabetes and Medical Education, Faculty of Medicine, Health and Life Science, Swansea University Medical School, Swansea, United Kingdom
- 3Microbiology and Infectious Disease, Faculty of Medicine, Health and Life Science, Institute of Life Science, Swansea University Medical School, Swansea, United Kingdom
Background: The use of simulations has been steadily rising in popularity in the biosciences, not only due to the COVID-19 pandemic restricting access to physical labs and equipment but also in the face of rising student numbers. In this study, we describe the development and implementation of a novel, open-access interactive simulation used to not only supplement a laboratory class but to enhance the student learning experience. The simulation provides students with the opportunity to interact with a virtual flow cytometer, design a simple experiment and then critically analyse and interpret raw experimental data.
Results: Results showed that this highly authentic assessment used a much broader range of the mark scheme acting as an excellent discriminatory for student ability compared to simple recall as assessed by multiple-choice questions. Overall, the student response to the new assessment was positive, highlighting the novelty of the assessment, however, some students did experience technical issues when the simulation was used for the first time.
Conclusion: Simulations can play a crucial role in the student learning cycle by providing a rich, engaging learning environment, however, they need to be used to supplement other hands-on experiences to ensure that students acquire the necessary kinematic skills expected of a successful science graduate.
Introduction
Practical, hands-on laboratory classes make up a central aspect of science degree programmes, providing students with the opportunity to take the theoretical concepts taught in lectures and apply them to real-world scenarios (Hofstein and Mamlok-Naaman, 2007). Not only do practical classes allow students to develop competencies that are expected of the modern science graduate (Stafford et al., 2020), but they also play a crucial role in fostering interest in the subject, enhancing engagement with learning, providing a sense of identity, and increasing motivation for study (Esparza et al., 2020). One of the challenges associated with running immunology practicals for large groups of students is the high cost associated with specialist equipment and reagents, which prohibits many, more advanced techniques from being used in undergraduate teaching. Access to centralised core equipment is also problematic, so students often learn the theory of immunological techniques without having the opportunity to apply that theory in practice, which is crucial for developing a deeper learning experience (Novak, 1980, 2003).
When the COVID-19 pandemic restricted access to laboratories even further, it became apparent that there was a general lack of high quality, freely available immunology educational resources. The rapid shift to online and, over recent years, “blended learning” has fundamentally changed how higher and further education delivers teaching. While precise definitions of “blended learning” vary, most academics will agree that combining face to face (in class) and online teaching is central to any discussion (Johnson et al., 2016; Dziuban et al., 2018).
We have recently commented that these changes are also consistent in how immunology is taught, especially in regard to practical skills development (Wilkinson et al., 2021). Resources that have been developed in response to COVID-19 have continued to allow students studying remotely to acquire many of the proficiencies associated with laboratory classes, including the theoretical underpinning of techniques, data handling, analysis, and presentation and perhaps, more importantly, scientific inquiry and curiosity, which sparks the interest in the subject matter.
Dry-lab simulations have been widely used in higher education, partly driven by the demand for authentic learning experiences (Serrano et al., 2018). They can be broadly defined as the imitation of a process or situation (Nygaard et al., 2012) or as an educational tool with which the student can physically interact to mimic real-life (Cook et al., 2013). Well-designed simulations allow the processes, procedures or skills to be practised in a controlled environment without risk or consequence (Keskitalo, 2012) and have their pedagogical basis in experiential learning, or learning by doing, as defined by Kolb (1984). A central tenet is that the simulation can change its state based on user inputs (Loughry et al., 2014), therefore allowing for complex branched interactions. Within immunology practical contexts, this often manifests itself as a re-creation of a laboratory method or technique. The benefit of a simulation is threefold firstly, it reduces the cost associated with running a practical, secondly, it mitigates the risk of damage to the equipment from numerous inexperienced users and thirdly, simulations require less time investment from students, allowing multiple iterations of a simulation to be run within the same time frame that one real-world experiment would take, making them a highly efficient inquiry-based learning tool (Pedaste et al., 2015). This allows students to link scientific theory and laboratory practice in a similar way to physical labs and, depending on how the simulation and associated dry lab is set up, permits students to gain an appreciation of how a specific method or piece of equipment works alongside problem-solving, accurate record-keeping and data analysis, which all closely align to learning outcomes for physical labs (Bassingdale et al., 2021). A recent study by Brockman et al. (2020) suggests that undergraduate students overwhelmingly support a “blended” learning approach.
With respect to the immunology discipline, there is a striking contrast between the large number of resources available for established wet-lab teaching and the paucity of novel dry-lab resources and solutions. Thus, Garrison et al. recently described numerous strategies to set up a successful immunology undergraduate lab (Garrison and Gubbels Bupp, 2019). Consistent with this, Kabelitz and co-workers have also reported on the need to promote immunology education across the globe and “without borders,” confirming the thoughts of Kwarteng et al. that major investment is needed in immunology education in developing countries (Kabelitz et al., 2019; Kwarteng et al., 2021). Furthermore, although immunology has shown improvement in training needs since 2018, according to the recent ABPI report, there is an ongoing need for high-quality teaching in the discipline (Association of the British Pharmaceutical Industry [ABPI], 2022). Critically and rather surprisingly, these studies and others (Bottaro et al., 2021) make only minor reference to dry-lab simulations of major immunology tools such as ELISA and flow cytometry. Although some commercial packages exist for simulating laboratory techniques, such as LearnSci and Labster, there is an associated cost and limited scope for customisation. Alternative resources are either too simplistic, too focused, or targeted at researchers and, therefore, too technical for undergraduate students, such as the numerous resources that exist for the in silico analysis of “big data” including genome analysis and antibody epitope mapping (Lyons et al., 2009; Soria-Guerra et al., 2015; Fagorzi and Checcucci, 2021), which are used for basic research and so are far too advanced for undergraduate teaching. In addition, guidelines on immunology education focus on the themes that should be taught in the curriculum, without clear guidance on labs and specifically on dry-lab simulations (Justement and Bruns, 2020; Porter et al., 2021).
A challenge that exists with the use of simulations is that they are limited in regard to their ability to replicate the kinematic hands-on learning that occurs from manipulating physical equipment in the laboratory setting. Therefore, resources such as videos, simulations, augmented and virtual reality should be used to scaffold pre-laboratory learning, allowing students to gain a firmer understanding of the theory and application of experimental techniques prior to even setting foot in the laboratory (Blackburn et al., 2019; Wilkinson et al., 2021).
The study aims to present and evaluate the suitability of a novel, bespoke simulation for teaching a core laboratory immunology technique, namely flow cytometry, in higher education and explore student performance in a variety of assessment styles, focusing on interpretation and application of knowledge rather than simple recall.
Methods/experimental
Description of materials
Flowjo™ was purchased from Becton Dickinson and Company and was used as a flow cytometry analysis tool to display and analyse flow cytometry data and to complement the virtual flow cytometer tool presented in the current manuscript.
Aim, design, and setting of the study
This study follows the design, implementation, and final assessment of a new virtual flow cytometer assessment resource at Swansea University Medical School (Figure 1).
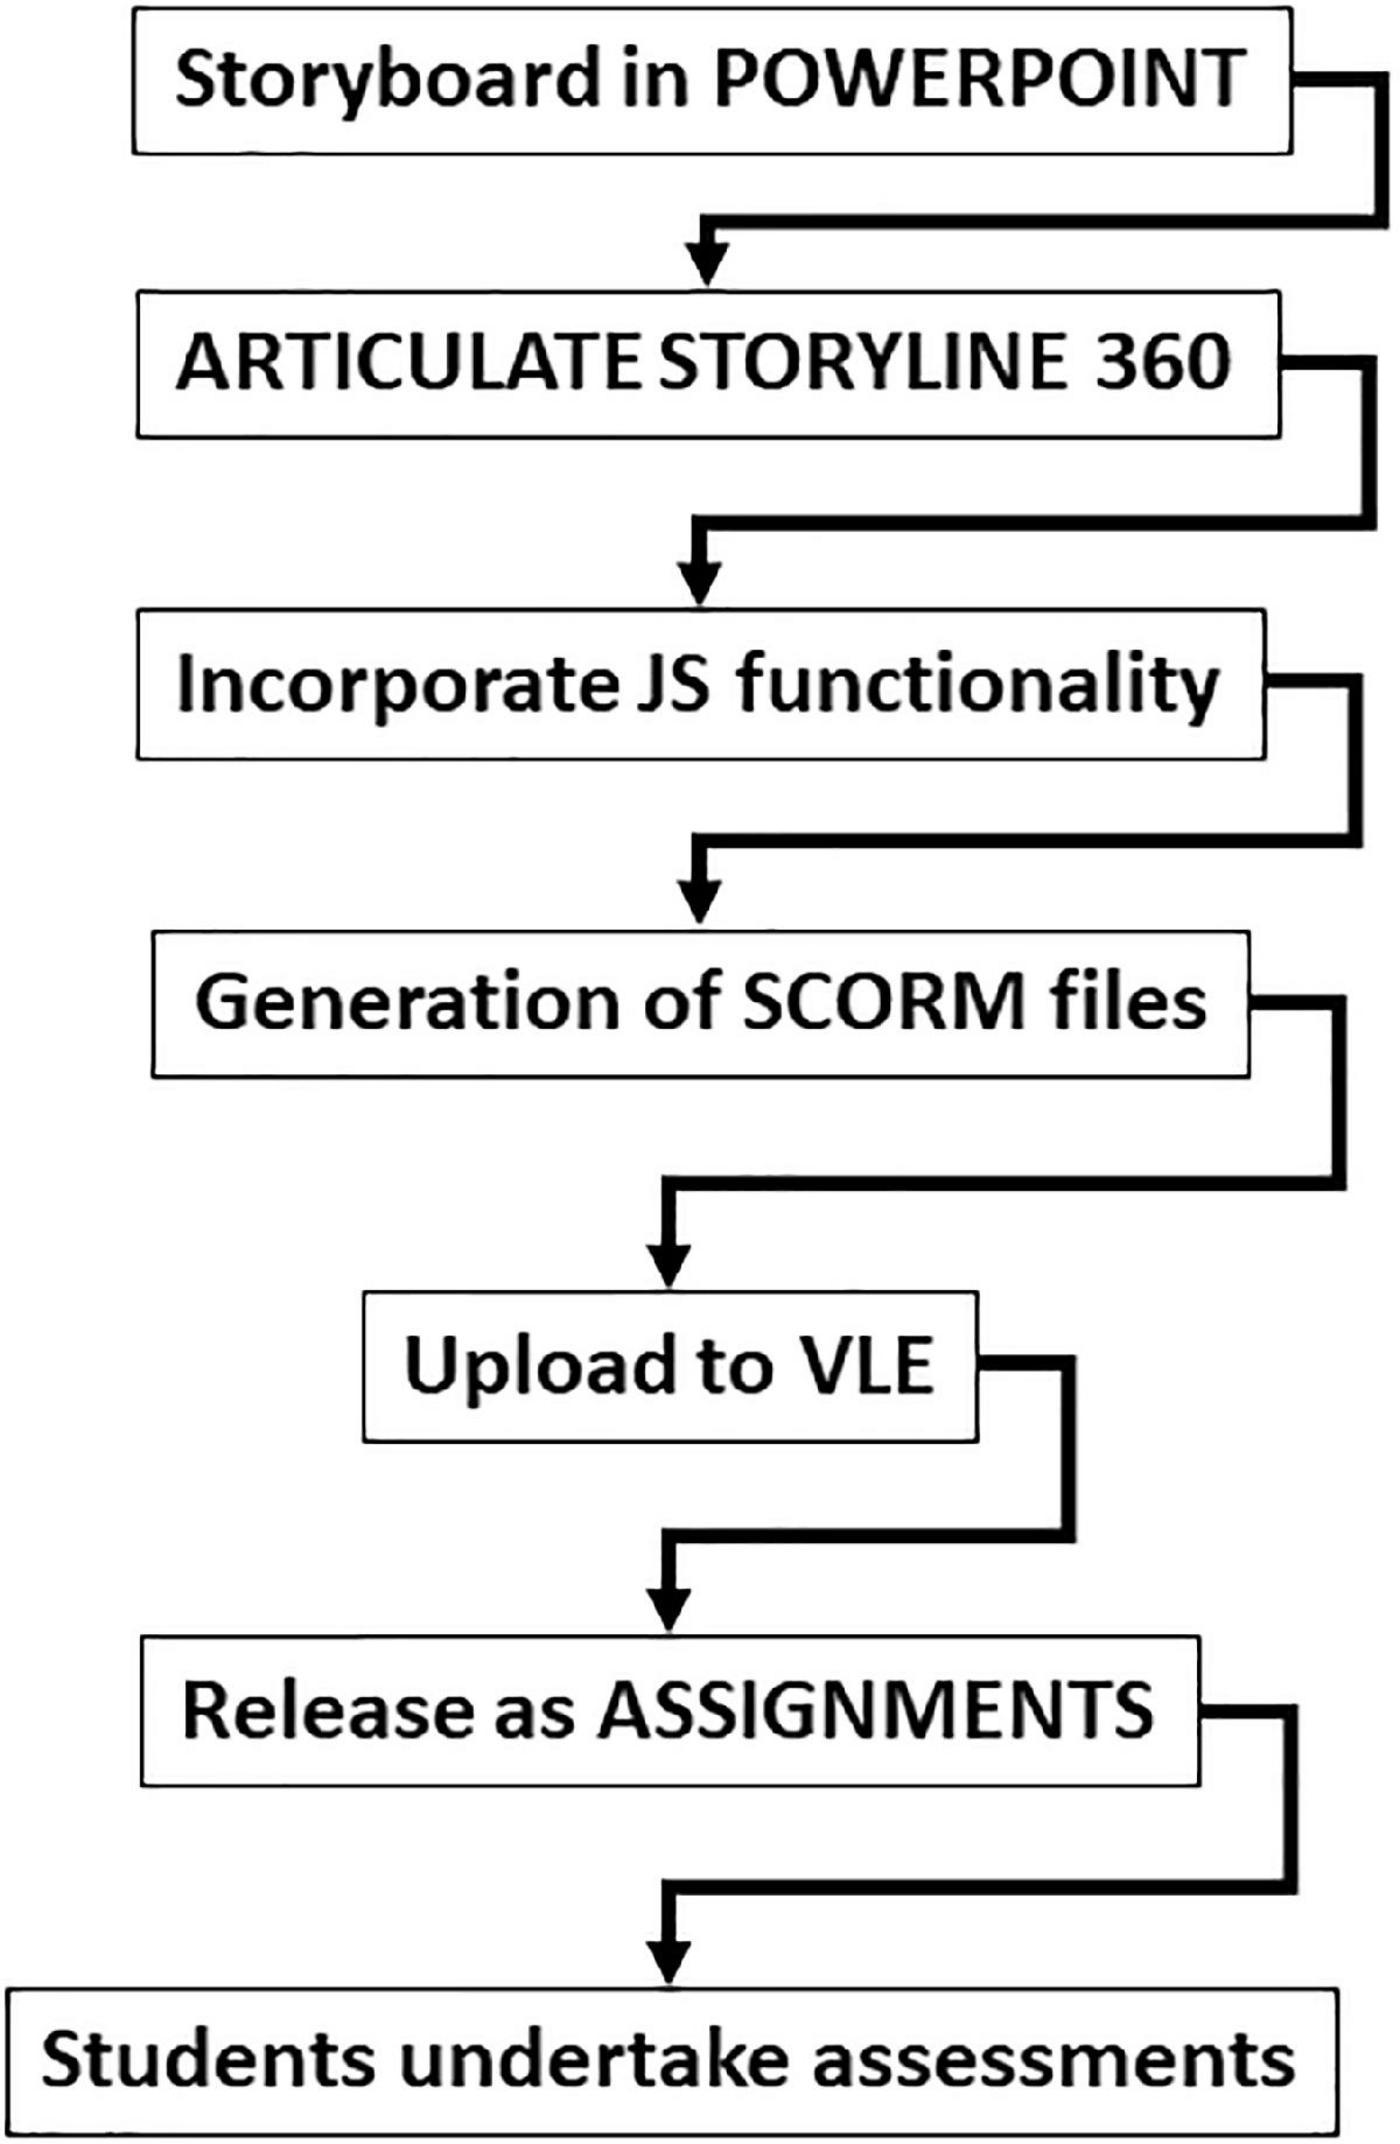
Figure 1. Flow chart of the process to develop the virtual flow cytometer assessments. The whole development process involved significant story development in PowerPoint before the conversion of files into Articulate Storyline 360 with JavaScript (JS) capability. This allowed the generation of SCORM files to upload onto a virtual learning environment (Canvas). These could be released as assignments and student assessments.
Characteristics of the data and student cohort
The data were taken anonymously from the final results of coursework from level 5 (2nd year) undergraduate students studying Human Immunology at Swansea University Medical School. Two major datasets are presented and include final results from the student cohorts from the 2020/21 (n = 266) and 2021/22 (n = 268) academic years. Archive coursework scores of the flow cytometry general knowledge MCQs from previous years (2016–2020) are also included for comparison.
Pedagogical framework
Kolb’s Theory of Experiential Learning (Kolb, 1984) underpins the development of the simulation. Kolb’s theory is based on four steps: concrete experience, reflective observation, abstract conceptualisation, and active experimentation. The simulation alone does not address all these elements, but when combined with the learning experienced in lectures, online resources and assessments completes the four steps. The simulation also utilises the basic tenants of constructivism - primarily building on existing knowledge the students may have had from previous lectures and online learning resources provided in preparation for the simulation (Tam, 2000).
Learning environment
The simulation was created in Articulate Storyline 360 and published as 3 SCORM (Sharable Content Object Reference Model) packages that were hosted on Swansea University’s Virtual Learning Environment (VLE), Canvas. SCORM was used to track scores in parts 1 and 3 of the simulation and completion status for part 2. The students were second-year undergraduates enrolled on the Human Immunology module.
Developing the simulation was a collaborative effort between academics and a learning technologist, with the end product being beta-tested by postgraduate research students. The simulation was used to enhance and replace a face-to-face workshop where students had previously gained experience of using the flow cytometry analysis software, FlowJo and were assessed on their ability to analyse raw flow cytometry data to characterise cells of the immune system. This was incorporated into the new simulation (part 1) and encouraged students to build on their previous knowledge gained from lectures and learning material about immune cell hierarchy. This knowledge was then applied specifically to flow cytometry influencing what knowledge the student gained as they worked through the rest of the simulation (Phillips, 1995). Part 2 of the simulation, which was not assessed, allowed students to work through the process of using a flow cytometer. This part correlated with the concrete experience step of Kolb’s theory as the students had not used a flow cytometer before and therefore were learning about it and how it works for the first time. The knowledge checks present throughout part 2 were designed to allow students to fail safely and to use the feedback they received to correct misconceptions before continuing (Metcalfe, 2017). While part 2 was primarily the concrete experience step of Kolb’s theory, these knowledge checks also allowed students to reflect on the simulation up to that point and therefore met the objective of Kolb’s reflective observation step. Part 3 focused on the abstract conceptualisation step of Kolb’s theory. The students, having completed the main simulation and having been introduced to flow cytometry data, were required to apply their knowledge in order to identify and interpret dot plots to link them to a clinical diagnosis. Performance assessments call upon the examinee to demonstrate specific skills and competencies, that is, to apply the skills and knowledge they have been mastered (Stiggins, 1987). The assessed sections were specifically designed to be authentic as they require students to interpret data and diagrams rather than simply recall data. Part 3 requires students to interpret dot plots as they would in a real lab setting. Finally, part 4 was a multiple-choice assessment that was retained from previous years as a means for students to check their overall understanding of the theory of flow cytometry.
Ethical approval and consent
Ethical approval and consent were not required as part of the work contained within this manuscript. Final coursework results and module feedback were provided anonymously with no link to original participants.
Thematic analysis
Thematic analysis of the mid- and end of module feedback free-text responses was performed manually using an inductive approach (Braun and Clarke, 2006) to determine the frequency of keywords and identify themes in the student responses. All comments relating to the virtual flow cytometer were manually coded to identify keywords. Themes were then grouped together and checked for reliability through a process of reading and re-reading comments.
Statistical analysis and presentation of data
Data are presented in a variety of formats. Student cohort marks were presented as the mean ± standard error of the mean (SEM). Zero scores were removed as they were not representative of an ongoing complete test score. GraphPad Prism software (Version 9.1.2) was used for statistical analysis using a Kruskal Wallis non-parametric multiple comparison test, including a Sidak post hoc test for multiple pairwise comparisons with *p ≤ 0.05 being considered significant. Pairwise linear regression and correlation analysis were used to identify relationships between scores of different values between different parts of the test (e.g., part 1 vs. part 3 etc.).
Results
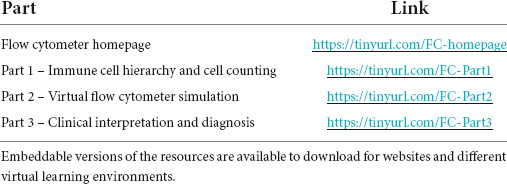
The development of the virtual flow cytometer assessments was carried out in a stepwise manner (Figure 1). Significant time was taken in generating the initial storyboard slides in PowerPoint and required the input of two academics teaching the human immunology module at Swansea University Medical School. This ensured the correct branching of the final assessments. Then, a learning technologist was able to convert the storyboard scenarios into Articulate Storyline 360, with JavaScript capability to produce SCORM files. These files were uploaded to our virtual learning environment, which could be released as assessments on the Canvas site of the University. The environment created uses clear fonts and instruction to guide undergraduate students through the assessments (Figures 2A–D). Thus, the drag and drop environment provides training on leukocyte subsets and incorporates a number of chances to achieve the correct answer, coupled with a decreasing potential to gain marks (Figure 2A). The formative assessment providing a simple “clickable” virtual flow cytometer allows students to experience a short simple experiment using the flow cytometer (Figures 2B,C). Finally, flow cytometry dot plots representing prototype healthy and diseased patients with various immunopathologies form the basis for the final assessment (Figure 2D) and require students to identify the correct dot plot to align with the correct disease. Allocation of marks for the flow cytometry coursework was as follows; Part 1 (30%), Part 2 (0%), Part 3 (30%), and Part 4 (40%) with resulting in three summative and one formative assessment (Figure 2E). The full open access versions (with restrictions on assessments) are available for testing and use (Table 1).
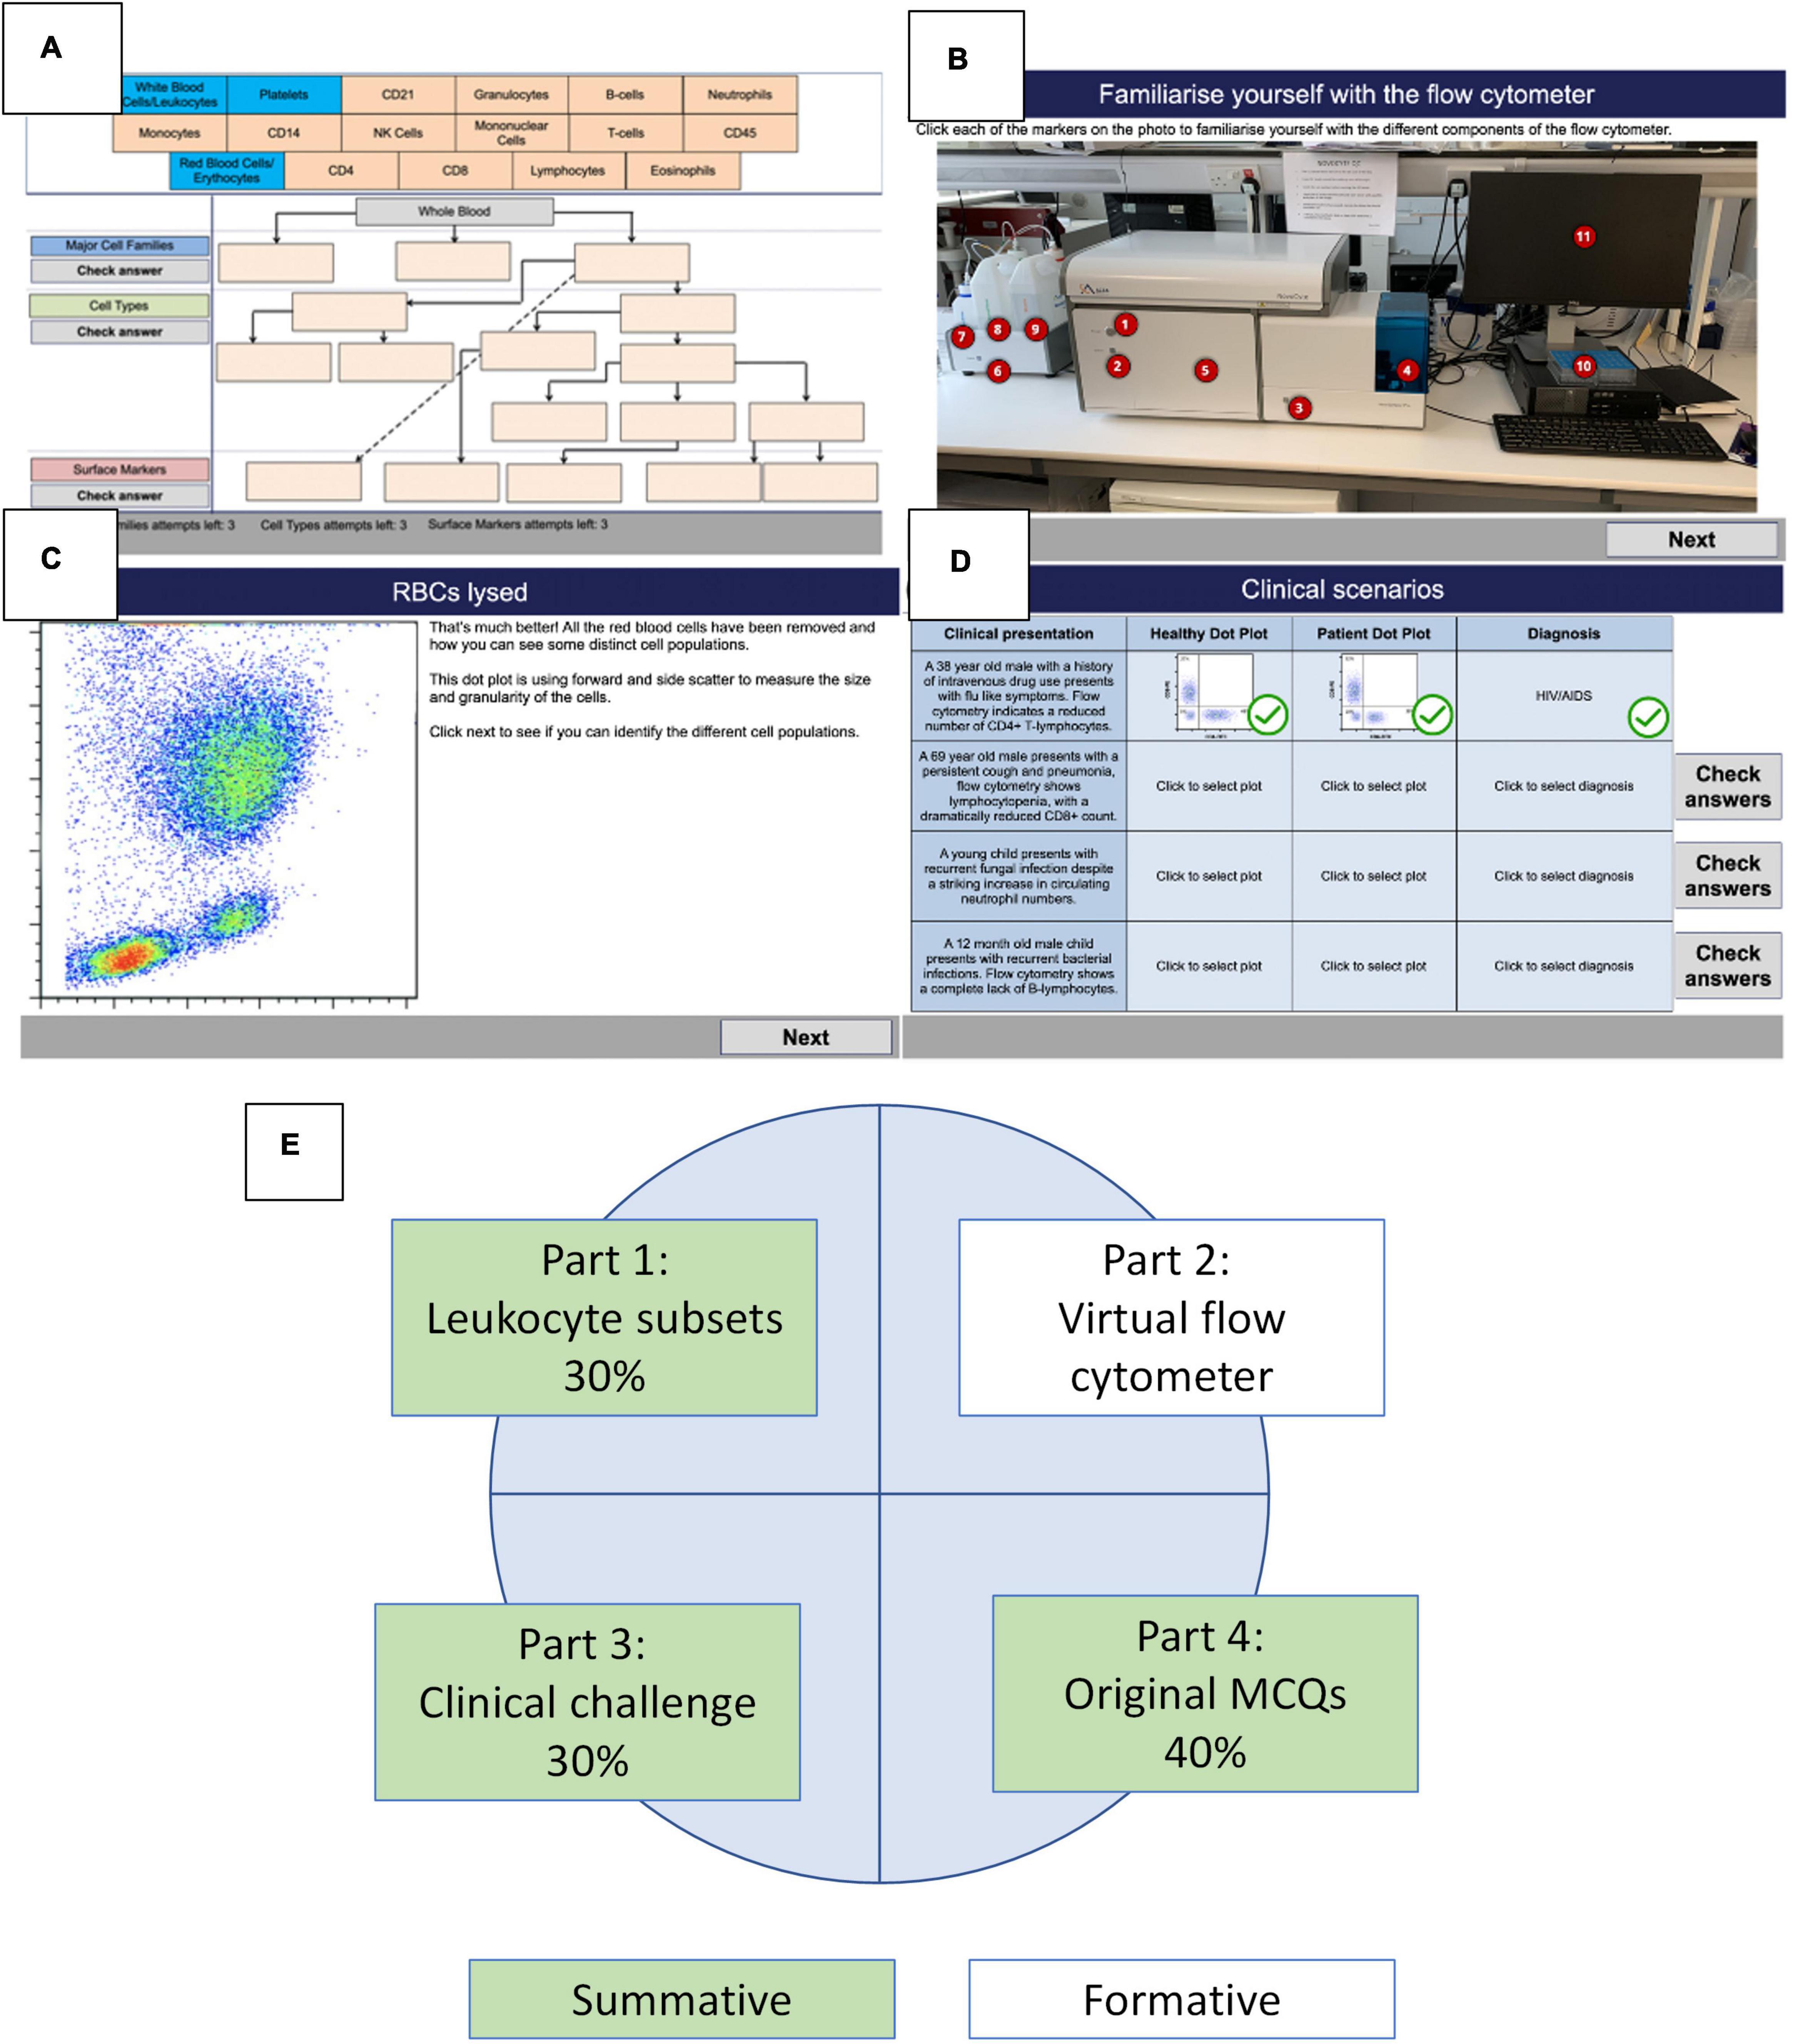
Figure 2. Parts of the flow cytometry simulation. (A) Part 1 – immune cell hierarchy. (B) Part 2 – parts of the flow cytometer. (C) Part 2 – dot plot of white blood cells. (D) Part 3 – interpretation and clinical diagnosis. (E) Distribution of scores across the flow cytometry resource including formative and summative assessments.
The virtual flow cytometer assessments have been used in two recent academic years, including 2020/21 and 2021/22 on the PM249 Human Immunology module at Swansea University. This module has run over the last 7 years with a flow cytometry analysis coursework element. The major learning objectives show a greater challenge for the student when comparing assessments pre and post implementation (Table 2).
Coursework scores (Figure 3) pre- and post- implementation confirms relatively stable scores (for the same general knowledge quiz) over the same period and between cohorts up to the introduction of the virtual flow cytometer simulation in 2020/21 (Figure 3, vertical dotted line). Indeed this flow cytometry MCQ general knowledge assessment from previous years was retained during the 2 years that the virtual flow cytometer assessments have been trialled and was renamed as flow cytometry part 4 (Figures 2E, 4).
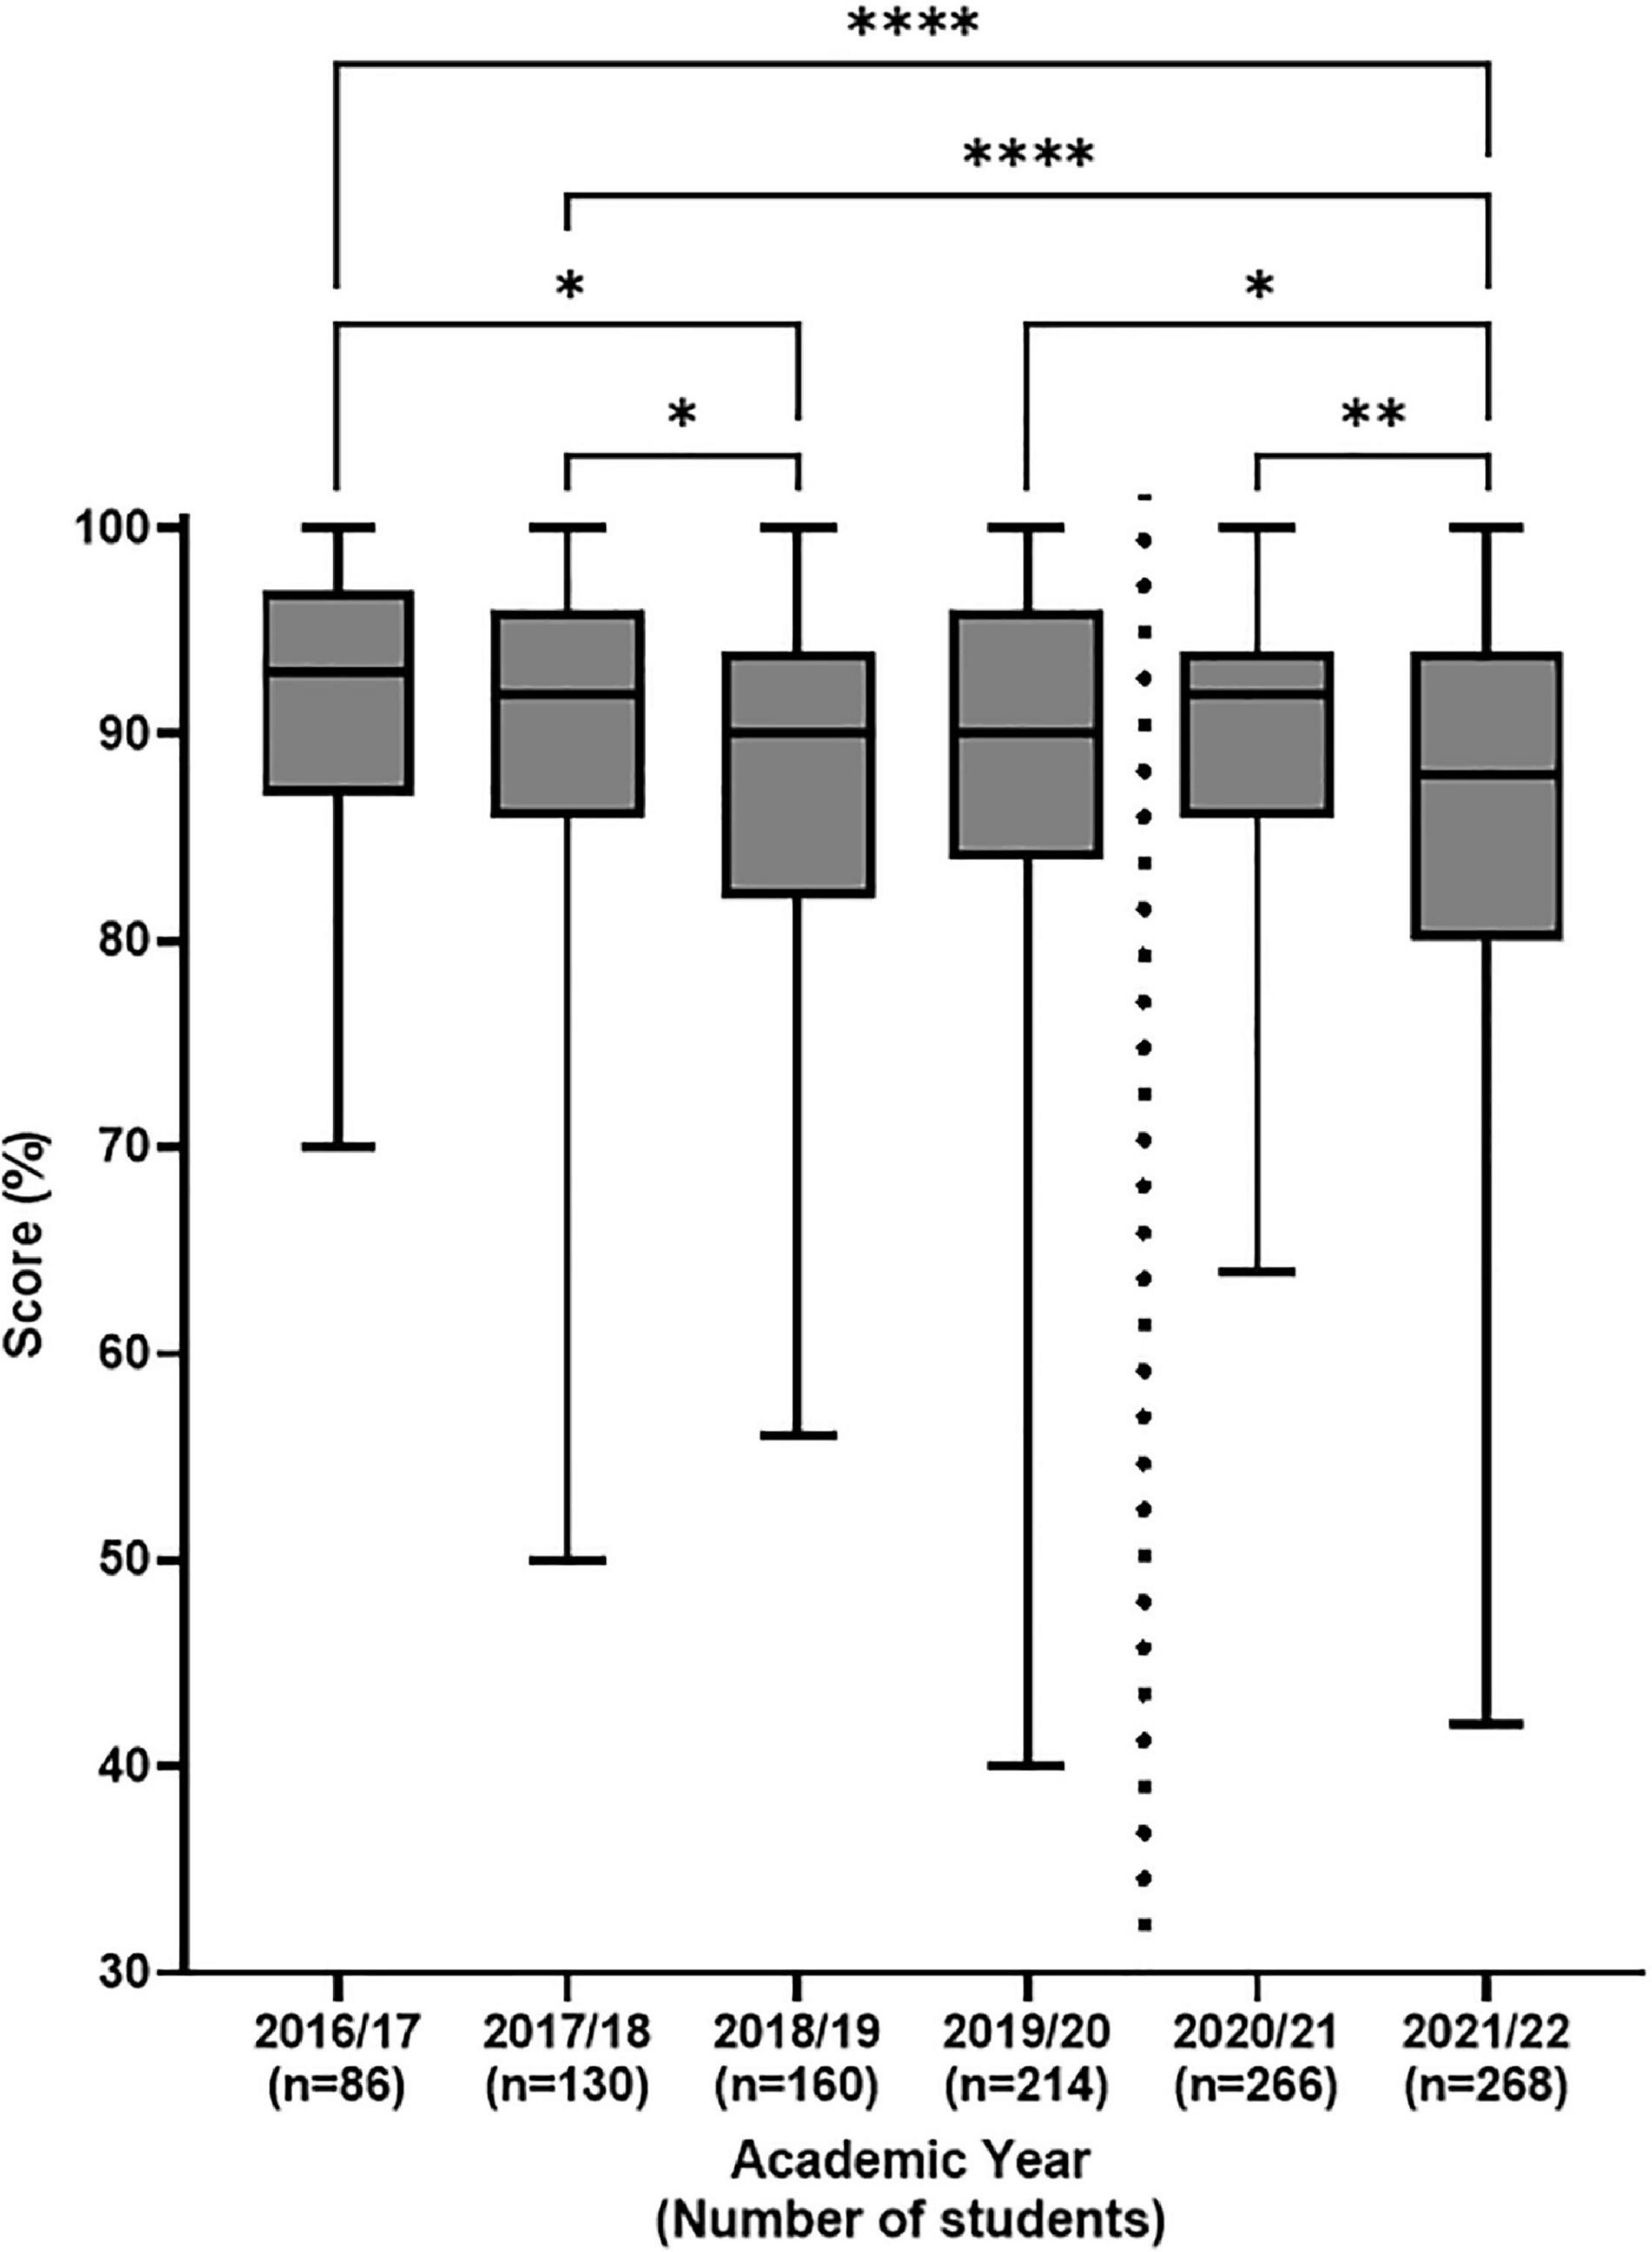
Figure 3. Distribution of Flow cytometry general knowledge MCQ coursework scores pre- and post-introduction of the flow cytometer simulation. Final coursework scores for student cohorts, are presented in a box and whisker plot as the median (horizontal bar) with upper and lower interquartile range (box) and the minimum and maximum values (whiskers). Vertical dotted line represents pre- and post-introduction of virtual flow cytometer. Differences between the data were assessed by Kruskal Wallis multiple comparison test with *p < 0.05 being considered significant; **p < 0.01, ****p < 0.0001.
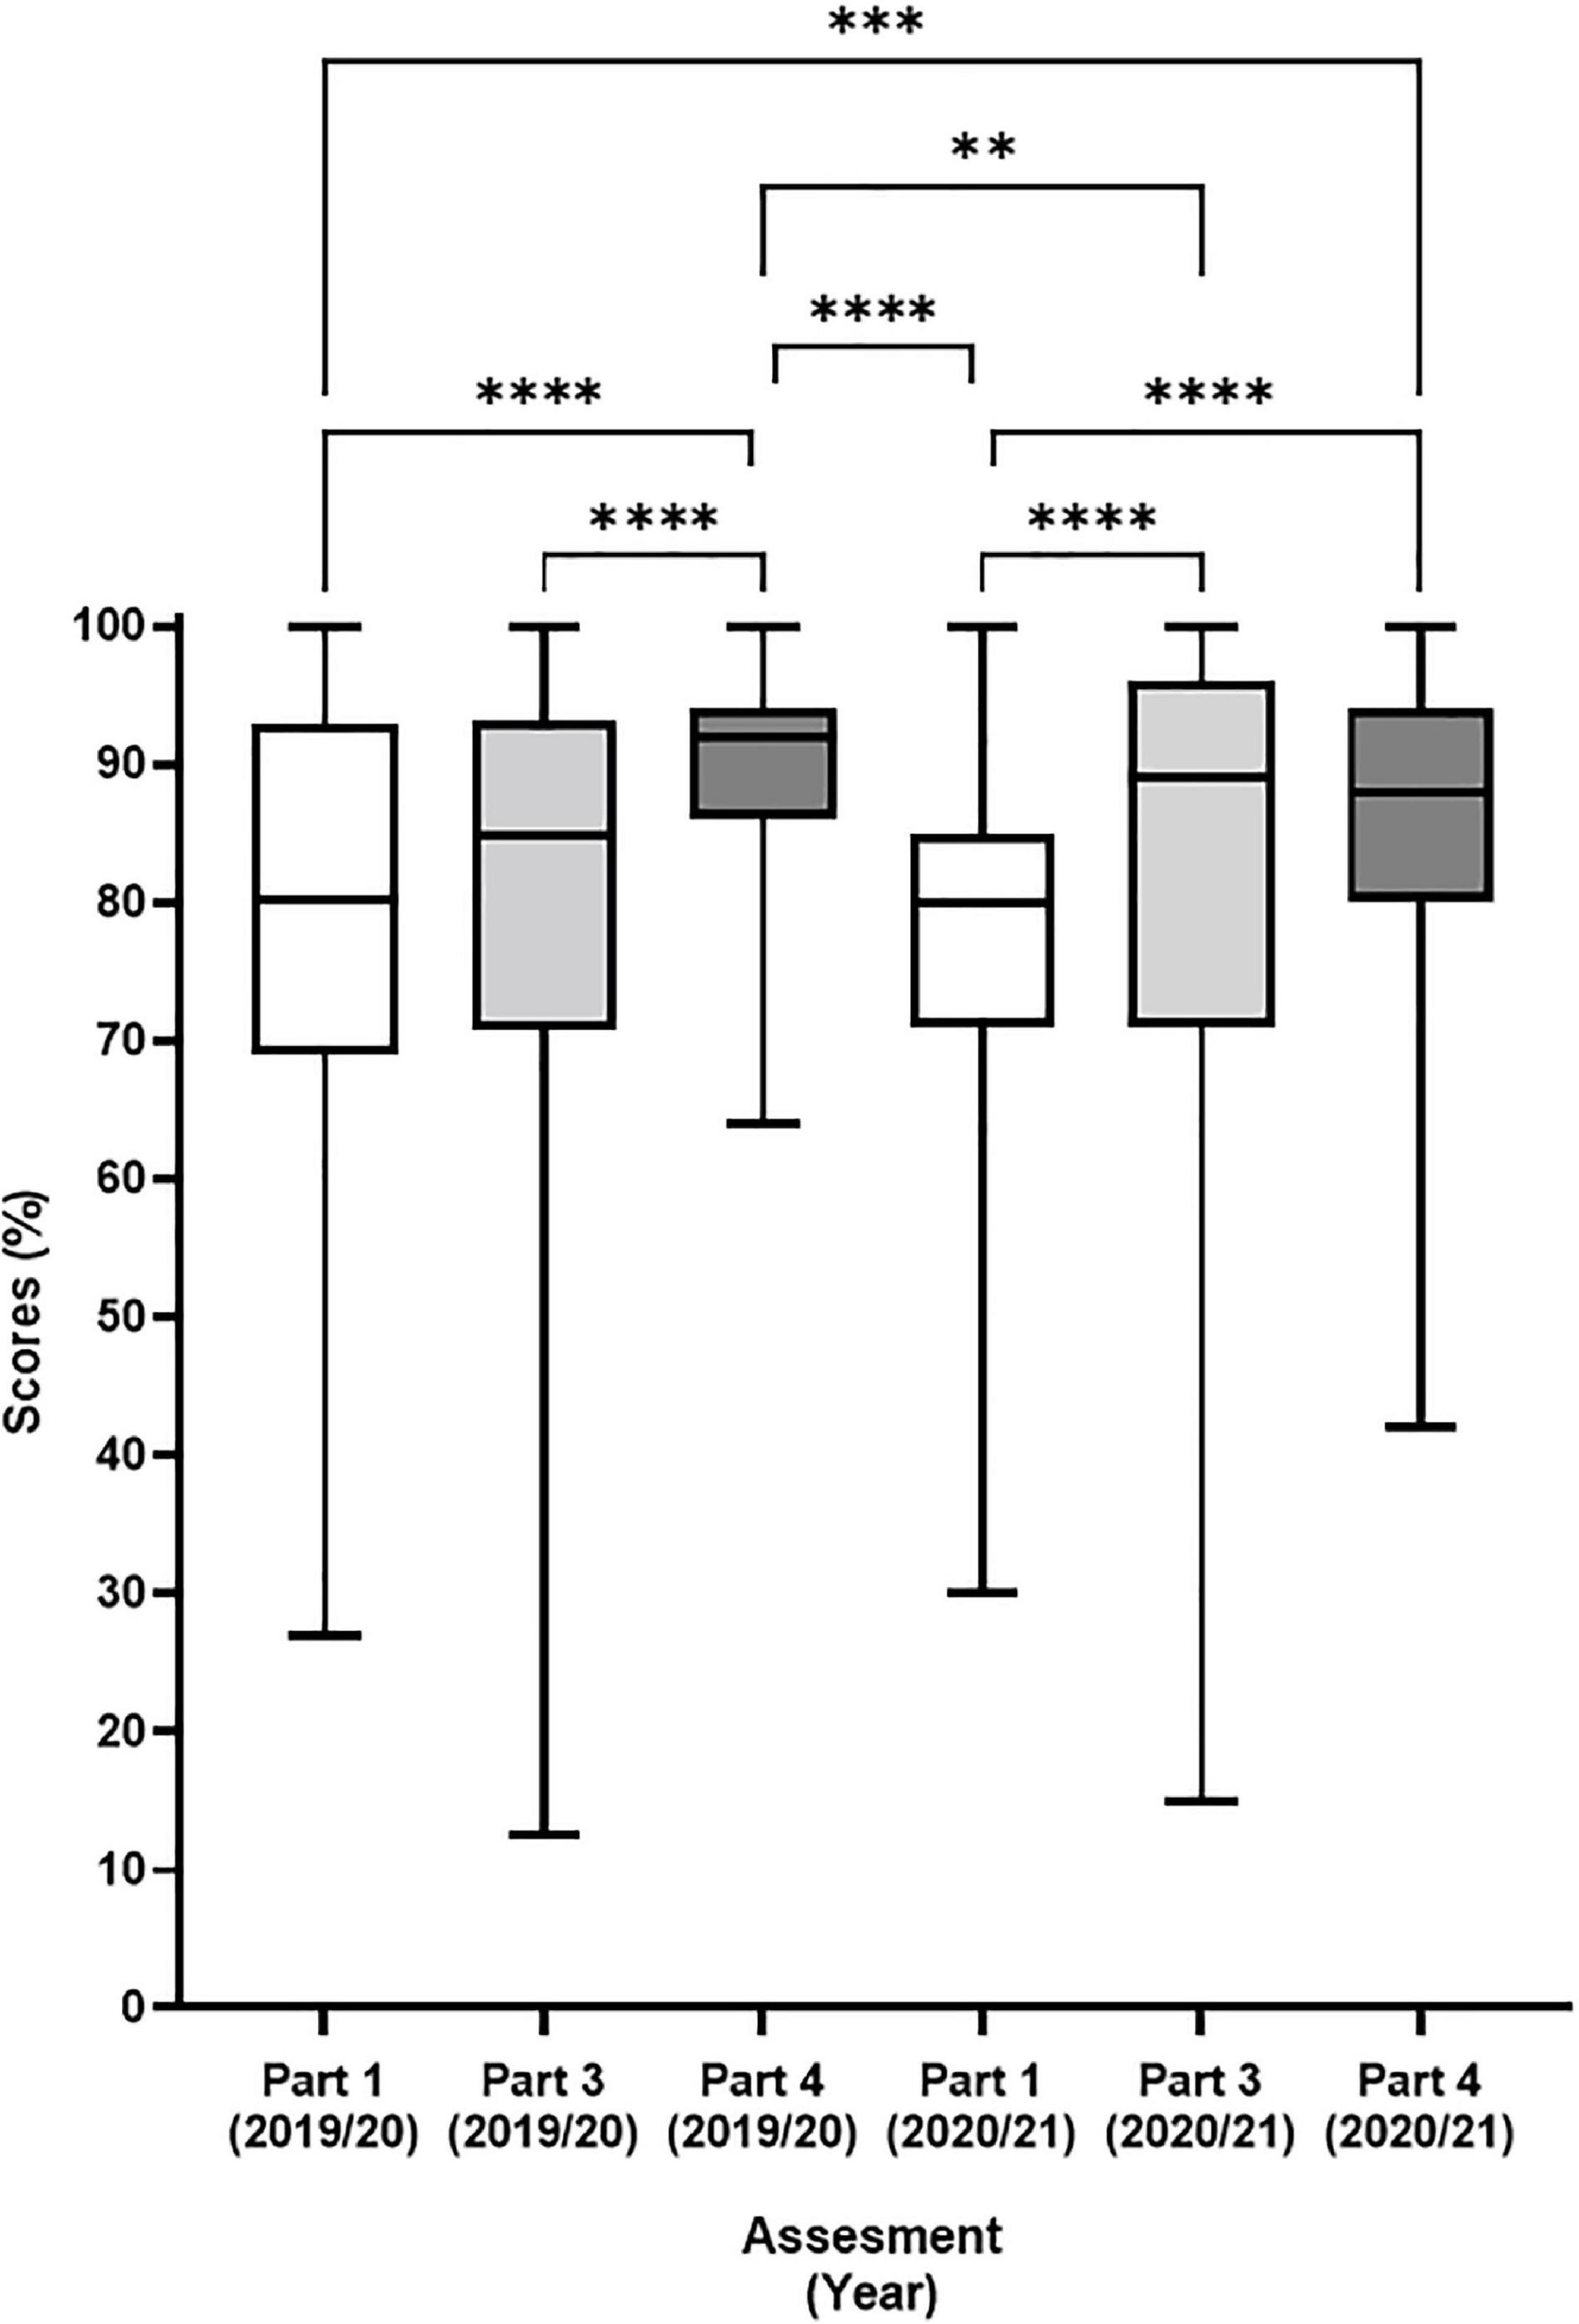
Figure 4. Final assessment scores for the first 2 years of the virtual flow cytometer. Final scores were presented in a box and whisker plot as the median (horizontal black bar) with upper and lower interquartile range (box) and the minimum and maximum values (Whiskers). The left three columns represent academic year 2020/21 (n = 266) and B) and the right three columns represent academic year 21/22 (n = 268). Plots were color labeled Part 1 (white), Part 3 (light grey), and Part 4 (dark grey). Differences between the data were assessed by Kruskal Wallis multiple comparison test. Stars represent increasing levels of significance; ns = not significant, **p < 0.01, ***p < 0.001, ****p < 0.0001.
The final flow cytometry assessments visualised by box and whisker plots for the academic year 2020/21 and 2021/22 (Figure 4) show important features. Firstly, that the new assessments in part 1 (white) and part 3 (light grey) use significantly more of the marking range than the traditional MCQ test in part 4 (dark grey). Secondly, part 1 had significantly lower marks than part 4 in both academic years. Thirdly, that scores of all parts (1, 3, and 4) remained similar between the inaugural year and the following year (Figure 4, white vs. white, light grey vs. light grey and dark grey vs. dark grey). In addition, part 3 also had consistently wide “boxes” (upper and lower interquartile range) over the 2 years demonstrating good use of the marking range.
Next, the assessment scores were analysed by linear regression (Figure 5) to confirm relationships between student performance between different tests in academic year 2020/21 (Figures 5A–C) and academic year 2021/22 (Figures 5D–F). In the first year of use no relationship was identified between the new assessments, parts 1 and 3 (Figure 5A). In contrast, a significant linear relationship could be found between part 1/4 and part 3/4 (Figures 5B,C, respectively). In the following year (2021/22) a striking linear relationship was identified between part 1 and 3 (Figure 5D) and contrasted with the previous year. The remaining comparisons provided consistent linear relationships with the previous year (Figures 5E,F).
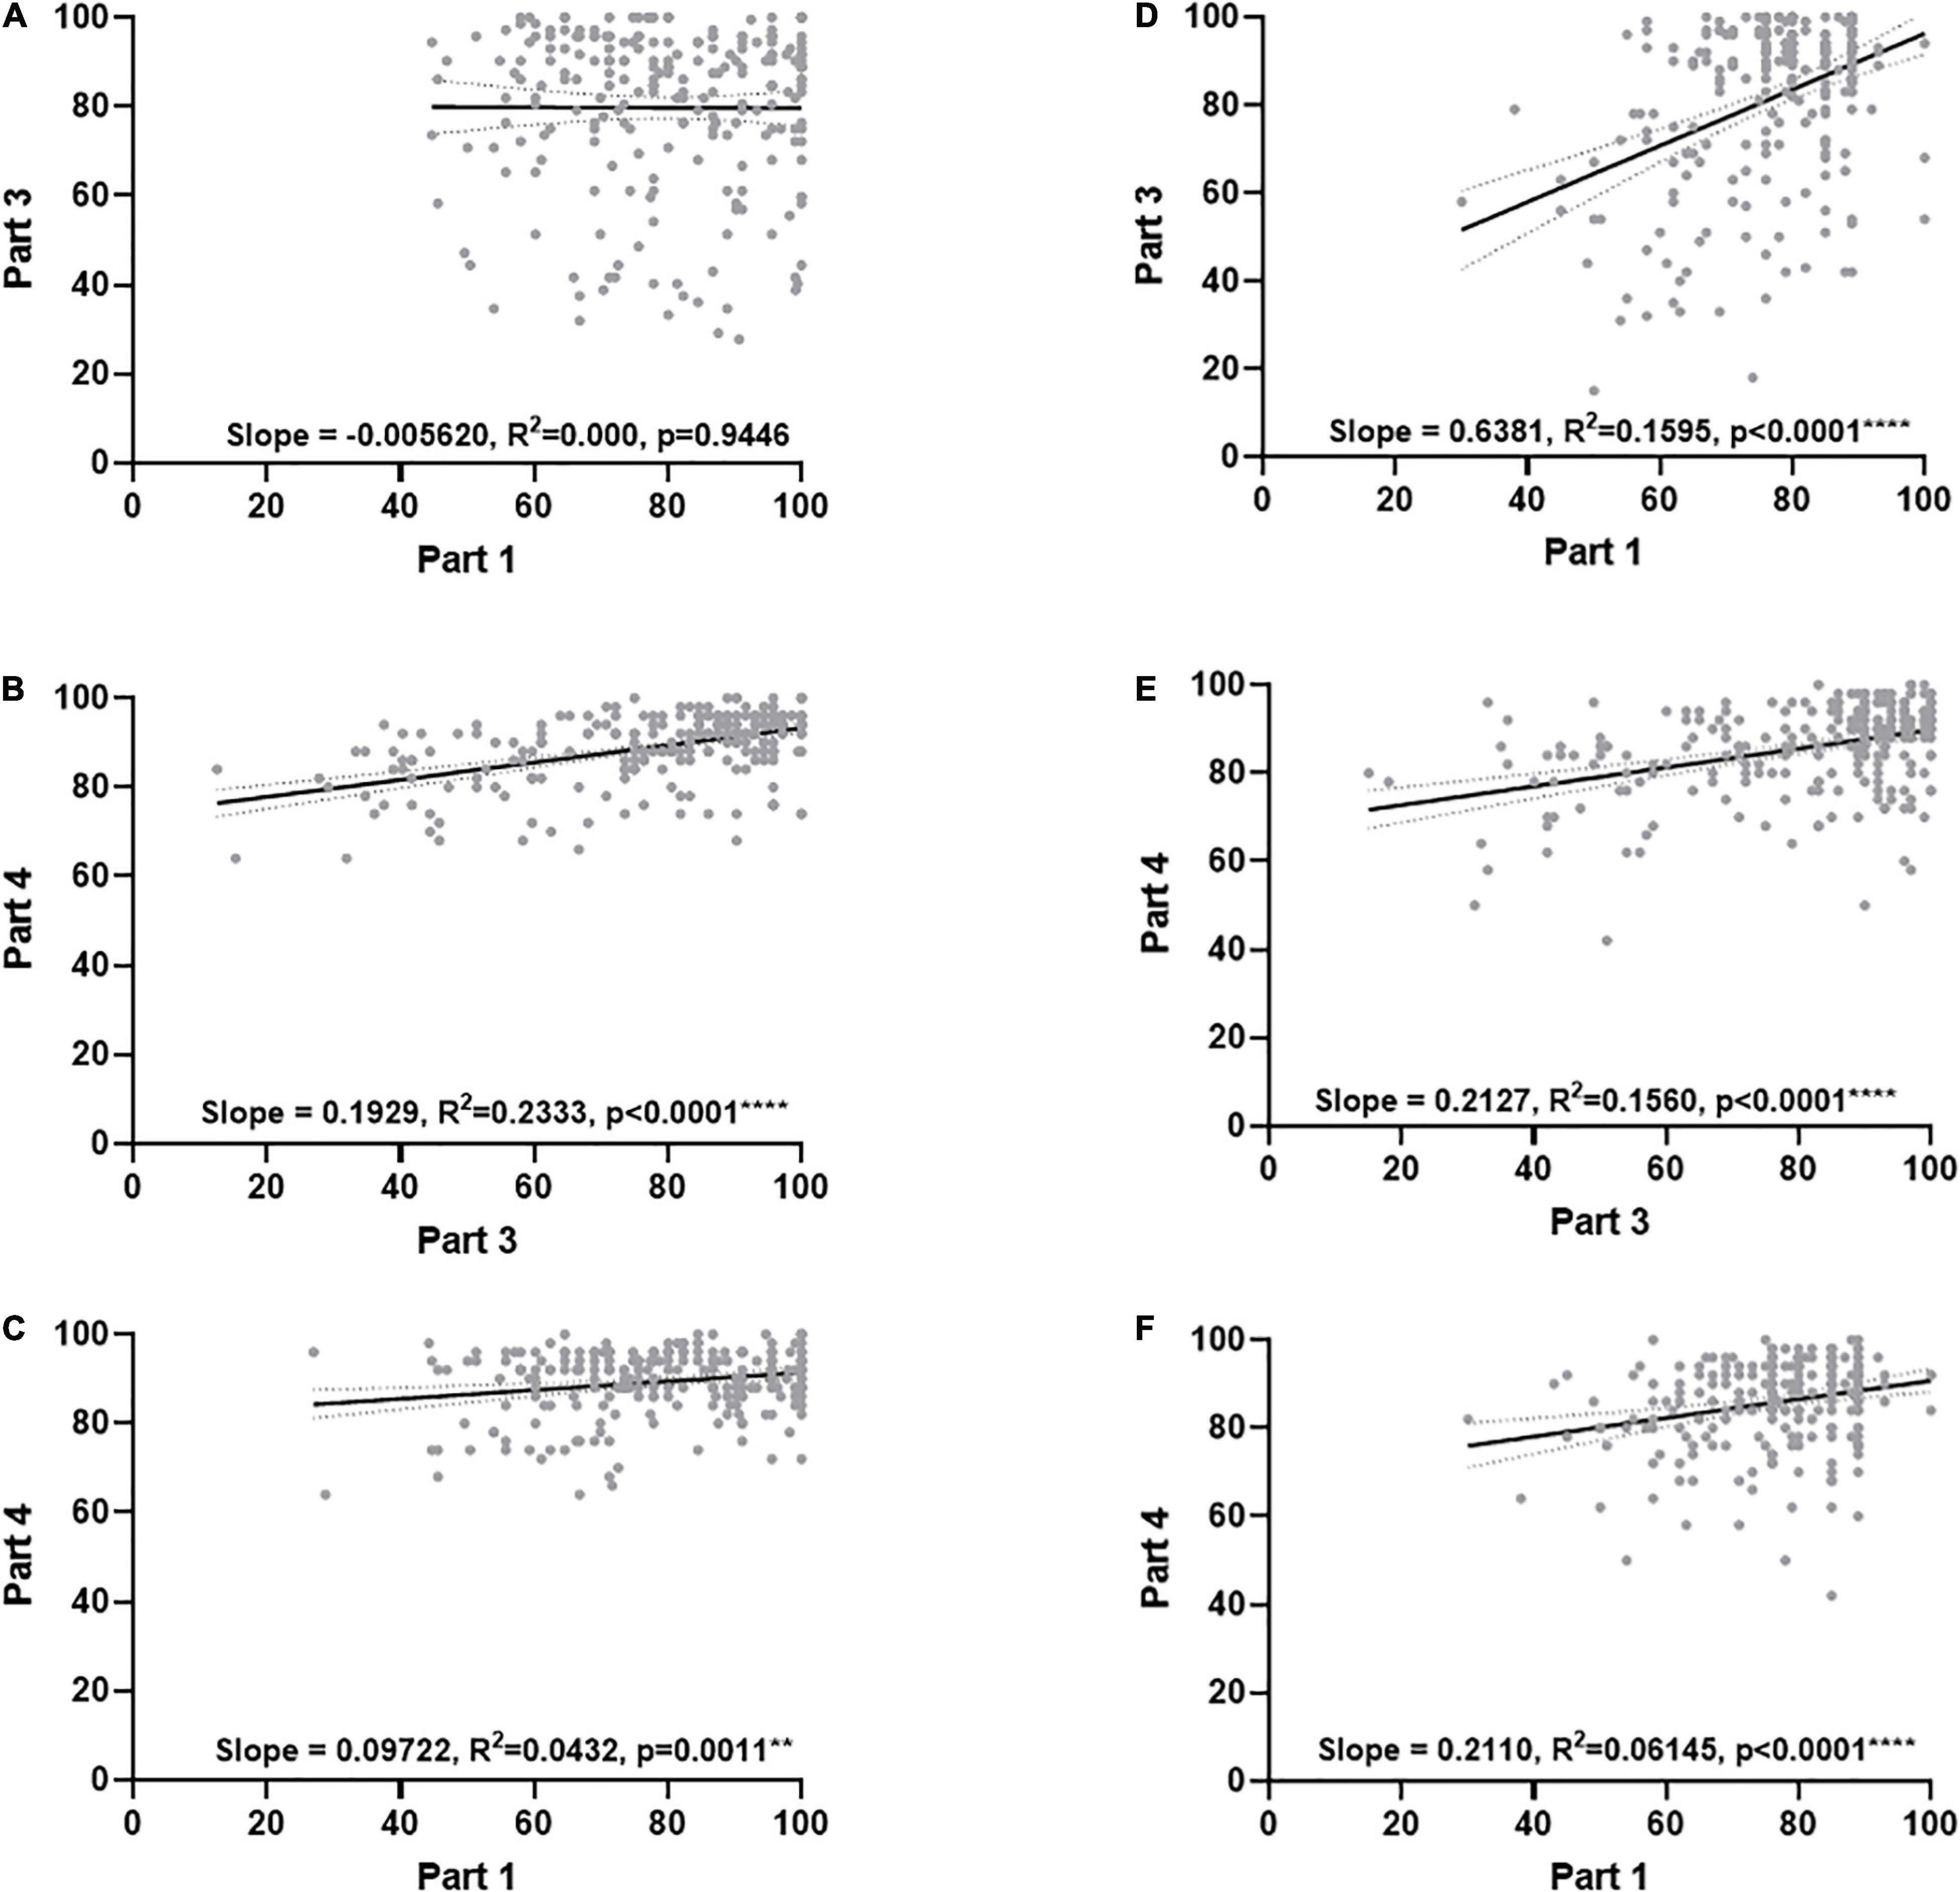
Figure 5. Linear regression analysis of assessment scores over the first 2 years of the virtual flow cytometer. Final scores were presented in a dot plot. Panels (A–C) represent academic year 2020/21 and panels (D–F) represent academic year 21/22. Paired values (grey dots). Regression line (black) and 95% confidence interval (dotted line). Data were analyzed by simple regression with differences considered significant if R2 differed from zero, a p < 0.05 being considered significant. Stars represent increasing levels of significance; **p < 0.01, ****p < 0.0001.
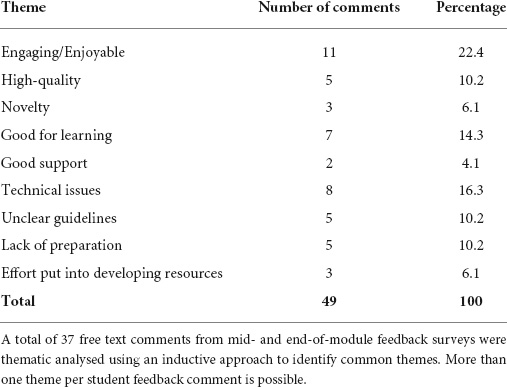
To gauge the student perception of the new resource, thematic analysis of mid- and end-of-module feedback was conducted. In total, 37 free text comments referring to the virtual flow cytometer were classified to identify common themes (Table 3).
The most common positive comment related to the ability of students to engage with the resource and/or the fact that they found this method of teaching enjoyable and easy to work with. A number of students did experience technical issues, which detracted from their overall user experience, which need to be addressed.
Overall, a novel, functional resource that engages students in an enjoyable and challenging way has been developed, which importantly enhances the student learning experience, giving them a more in-depth understanding of the theory and application of the technique.
Discussion
Educational benefit
Human Immunology (PM-249) is a large, second-year module taken by over 250 students each year from a broad range of undergraduate, biochemically-focused degree programmes. One assessment on the module is based around flow cytometry, a technique that allows for multiple parameters of cells to be investigated simultaneously in a high throughput assay used in basic science and clinical immunopathology detection (Kanegane et al., 2018). Access to an actual flow cytometer is restricted, as it is a centralised piece of research equipment, so pragmatically, it is not feasible to allow such large numbers of students the opportunity to experience using the machine. The module assessment enables students to analyse genuine flow cytometry data, which in previous years was carried out as a face-to-face workshop with videos accompanying an interactive lecture covering the theory on which flow cytometry is based. Module feedback since the module’s inception (September 2012) has been positive but frequently highlighted that students would have valued the experience of using a real flow cytometer.
When COVID-19 restricted access to the laboratory, the entire practical experience needed to be reimagined. Although LearnSci and Labster both have simulations relating to flow cytometry, they provide a broad overview with limited scope for customisation. So, over the summer of 2020, the virtual flow cytometer simulation was developed to ensure that students not only still had the opportunity to attain the learning objectives associated with the practical but had an enhanced learning experience. This also acted on student feedback to develop a customised simulation that showcased real research equipment used at the authors’ institution.
The introduction of a highly authentic assessment that requires students to critically analyse and interpret data had a significant impact on the overall coursework scores for the module (Figure 3). It was evident that those aspects of the assessment that required analysis and interpretation (parts 1 and 3) showed scores that made better use of the full marking range (Figure 4) compared to part 4 (MCQs), which relied on factual recall, as the mean scores for this element of the assessment remained stable across all cohorts. Increasing the range of assessment formats provided students with different strengths and the opportunity to display their knowledge and understanding (Bloxham and Boyd, 2007), as well as ensuring that students who truly understand the concepts achieve marks consistent with their knowledge base.
With respect to student scores it is clear that the “box” which defines the upper and lower interquartile range remains wider for part 3 than part 4 over both years of the study despite a mean difference being observed in 2020 only. It is of course difficult to confirm the underlying reasons for these observations. We might speculate that differences in ability or effort may be responsible for the observations, but it is difficult to categorically confirm this. Interestingly there are studies in the teaching of biological subjects that suggest that proportioning marks determines the performance of students (Doggrell, 2020). This is more often associated with exams vs. coursework and not different elements of the same coursework (Richardson, 2015) and future student scores in the coming years will allow us to assess this important issue.
Strikingly, correlation analysis between the different assessments showed a weak, but significant, positive correlation in all cases apart from in 2020/21 part 1 vs. part 3, which then became weakly correlated in 2021/21. While it is not possible to state definitively why this is the case, we can hypothesise that the first time a new method of assessment is used it takes time for students to understand the new requirements, which may explain the lack of correlation in 2020/21. Parts 1 and 3 asked students to analyse and interpret data, something they have probably not had a great deal of experience of at this stage of their education. This is also one of the first assessments that students undertook during their second year, which had been suddenly moved from in-person to online in 2020. The impact here could be twofold, a lack of understanding of the requirements of year 2 assessment, or a lack of confidence engaging with online assessments for the first time. The weak positive correlations between parts 1 and 3, when compared against part 4 of the assessment, might be explained by the fact that part 4 was a MCQ quiz, which all students would have had experienced previously.
The fact that parts 1 and 3 became correlated in 2021/22 is very interesting, suggesting that students are either becoming more comfortable with online assessment (Ismaili, 2021) or that subsequent cohorts of students are engaging in dialog with previous cohorts and, therefore, may have a better understanding of the assessment requirements, which is supported by personal communication from students. Further work would be required to fully explore this phenomenon.
Thematic analysis
Student engagement with the resources was exceptionally high, with largely positive feedback. Thematic analysis of 37 free text responses (Table 3) revealed that students greatly appreciated the novelty of the resource and the different approaches to learning and assessment.
“The second practical (flow cytometry) we had was really different from anything else we’ve done so far. I enjoyed it. It was easier for me to learn new information in this format.”
“The content is engaging, and the practical assessments have been challenging but they are still interesting. In particular, I found part 3 of the flow cytometry assessment to be the most interesting. I like applying what we learnt to real-life cases.”
There were, however, some issues raised by students that could be improved and these centred around how prepared students felt for this new style of assessment.
“I found part 3 of the flow cytometry assignment difficult, and I think maybe some added information or an example on how to read the data in terms of clinical application would have been useful.”
“My critique of the course is for the flow cytometry assignment. I feel we have had minimal teaching in regards to the flow dot charts, so when it comes to completing the part 3 assignment, I felt very let down. The diagnosis was fine but trying to convert and interpret the graphs was a tough task.”
“The layout of the coursework took a little getting used to, which is fair as this was new to everyone.”
These concerns can be mitigated by providing more concrete, formative examples within the simulation or supporting resources that guide students through the more complex aspects of the simulation and assessment.
Students certainly appreciated the effort that had been made to provide them with these resources.
“‘I thought the way the (…) and Flow Cytometry assessments were held was really impressive and the instructions given to complete them were really clear.”
“I am glad the lecturers worked over the summer to provide us with this.”
Limitations
The major limitation of using a simulated practical is the lack of hands-on experience, therefore the use of simulations should be balanced against the need to develop kinematic proficiencies. Simulations can play a key role in pre-laboratory learning allowing students to investigate experimental parameters or where access to specialised equipment prevents real-world experience, but they should not fully replace the laboratory experience.
Developing a simulation can also be challenging and time-consuming, requiring specialist knowledge, such as a learning technologist, to produce the final product and an upfront time investment from academics to storyboard the simulation. However, this time can be recovered if the students are not required to be supervised in the lab. A critical element of developing resources such as the virtual flow cytometer is beta-testing, despite this, there are likely to be bugs that escape detection during the first deployment, particularly as students may attempt things that academics and more knowledgeable testers might not consider. Students are generally understanding of such issues provided robust reporting mechanisms are put in place and their concerns are seen to be actioned promptly. In our case, around 20% of the cohort reported issues during the first run in 2020, which were largely due to browser or device incompatibility, with this number being reduced to about 1% in 2021 for the second iteration.
In the course of this research, it was clear to us that while we believe (from word of mouth) that the students found it to be an enjoyable and challenging resource and that it enhanced their learning and gave them a more in-depth understanding, we must also be careful not to overinterpret our results. It is clear that further feedback is required over the coming years to improve the overall student feeling for this resource and strengthen the thematic analysis. Future plans will allow this resource to be used in future years at Swansea but also at other institutions in Wales, United Kingdom and the world.
Future directions
The simulation will continue to be refined based on user feedback, building in more branching or alternative experimental scenarios to enhance the learner experience. This will enable users to engage with the simulation multiple times, being presented with a slightly different experience each time. The simulation is currently being rolled out across several higher education institutions in the United Kingdom, with a long term aim of producing versions of the resource that have been translated into multiple different languages for use in low- and lower middle income countries via a partnership with the International Union of Immunological Societies (IUIS1). This will allow for additional feedback to be gathered permitting further enhancement of the resources.
Conclusion
Overall, the virtual flow cytometer assessment, which is an openly available resource (Table 1), provides a unique learning and assessment environment for students and permits students to showcase their abilities in a variety of different ways, ranging from data analysis to clinical interpretations and theory recall. The study highlights that simulations can be used to provide a rich, engaging learning environment that challenges students in different dimensions of their learning. However, their use should be combined with hands-on experience in the lab to ensure students are also gaining the kinematic skills required to be successful graduate science practitioners. With blended learning becoming the expected norm for many institutions the use of resources such as simulations is only likely to increase in the future (Johnson et al., 2016; Dziuban et al., 2018; Veletsianos and Houlden, 2020; Wilkinson et al., 2021).
Data availability statement
The raw data supporting the conclusions of this article will be made available by the authors, without undue reservation.
Authors contributions
NF produced the original storyboards. TW edited the storyboards. DR developed the SCORM package. TW and NF were responsible for the conceptual design of experiments and drafted the manuscript. All authors contributed to the article and approved the submitted version.
Funding
This work was partly funded by a grant from the St. David’s Medical Foundation to NF and TW.
Conflict of Interest
The authors declare that the research was conducted in the absence of any commercial or financial relationships that could be construed as a potential conflict of interest.
The reviewer RN declared a past co-authorship with the authors to the handling editor.
Publisher’s note
All claims expressed in this article are solely those of the authors and do not necessarily represent those of their affiliated organizations, or those of the publisher, the editors and the reviewers. Any product that may be evaluated in this article, or claim that may be made by its manufacturer, is not guaranteed or endorsed by the publisher.
Acknowledgments
We would like to thank the postgraduate students involved in beta-testing the simulation. We are grateful for the support of Amy Bazley for providing student performance data.
Abbreviations
MCQ, Multiple Choice Question; SCORM, Sharable Content Object Reference Model; SEM, standard error of the mean; VLE, Virtual Learning Environment.
Footnotes
References
Association of the British Pharmaceutical Industry [ABPI] (2022). Bridging the Skills Gap in the Pharmaceutical Industry. London: The Association of the British Pharmaceutical Industry.
Bassingdale, T., LeSuer, R. J., and Smith, D. P. (2021). Perceptions of a programs approach to virtual laboratory provision for analytical and biochemical sciences. J. Forensic Sci. Educ. 3, 1–9.
Blackburn, R. A. R., Villa-Marcos, B., and Williams, D. P. (2019). Preparing students for practical sessions using laboratory simulation software. J. Chem. Educ. 96, 153–158. doi: 10.1021/acs.jchemed.8b00549
Bloxham, S., and Boyd, P. (2007). Developing Effective Assessment in Higher Education: a Practical Guide. Maidenhead: McGgraw-Hill.
Bottaro, A., Brown, D. M., and Frelinger, J. G. (2021). Editorial: the present and future of immunology education. Front. Immunol. 12:744090. doi: 10.3389/fimmu.2021.744090
Braun, V., and Clarke, V. (2006). Using thematic analysis in psychology. Qual. Res. Psychol. 3, 77–101. doi: 10.1191/1478088706qp063oa
Brockman, R. M., Taylor, J. M., Segars, L. W., Selke, V., and Taylor, T. A. H. (2020). Student perceptions of online and in-person microbiology laboratory experiences in undergraduate medical education. Med. Educ. Online 25:1710324. doi: 10.1080/10872981.2019.1710324
Cook, D. A., Brydges, R., Zendejas, B., Hamstra, S. J., and Hatala, R. (2013). Technology-enhanced simulation to assess health professionals: a systematic review of validity evidence, research methods, and reporting quality. Acad. Med. 88, 872–883. doi: 10.1097/ACM.0b013e31828ffdcf
Doggrell, S. A. (2020). Descriptive study of how proportioning marks determines the performance of nursing students in a pharmacology course. BMC Nurs. 19:112. doi: 10.1186/s12912-020-00506-x
Dziuban, C., Graham, C. R., Moskal, P. D., Norberg, A., and Sicilia, N. (2018). Blended learning: the new normal and emerging technologies. Int. J. Educ. Technol. High. Educ. 15:3. doi: 10.1186/s41239-017-0087-5
Esparza, D., Wagler, A. E., and Olimpo, J. T. (2020). Characterization of instructor and student behaviors in cure and non-cure learning environments: impacts on student motivation, science identity development, and perceptions of the laboratory experience. CBE Life Sci. Educ. 19:ar10. doi: 10.1187/cbe.19-04-0082
Fagorzi, C., and Checcucci, A. (2021). “A compendium of bioinformatic tools for bacterial pangenomics to be used by wet-lab scientists,” in Bacterial Pangenomics: Methods and Protocols, eds A. Mengoni, G. Bacci, and M. Fondi (New York, NY: Springer), 233–243. doi: 10.1007/978-1-0716-1099-2_15
Garrison, K. E., and Gubbels Bupp, M. R. (2019). Setting up an undergraduate immunology lab: resources and examples. Front. Immunol. 10:2027. doi: 10.3389/fimmu.2019.02027
Hofstein, A., and Mamlok-Naaman, R. (2007). The laboratory in science education: the state of the art. Chem. Educ. Res. Pract. 8, 105–107. doi: 10.1039/B7RP90003A
Ismaili, Y. (2021). Evaluation of students’ attitude toward distance learning during the pandemic (Covid-19): a case study of ELTE university. Horizon 29, 17–30. doi: 10.1108/OTH-09-2020-0032
Johnson, L., Adams Becker, S., Cummins, M., Estrada, V., Freeman, A., and Hall, C. (2016). NMC Horizon Report: 2016 Higher Education Edition. Austin, TX: The New Media Consortium.
Justement, L. B., and Bruns, H. A. (2020). The future of undergraduate immunology education: can a comprehensive four-year immunology curriculum answer calls for reform in undergraduate biology education? Immunohorizons 4, 745–753. doi: 10.4049/immunohorizons.2000086
Kabelitz, D., Letarte, M., and Gray, C. M. (2019). Immunology education without borders. Front. Immunol. 10:2012. doi: 10.3389/fimmu.2019.02012
Kanegane, H., Hoshino, A., Okano, T., Yasumi, T., Wada, T., Takada, H., et al. (2018). Flow cytometry-based diagnosis of primary immunodeficiency diseases. Allergol. Int. 67, 43–54. doi: 10.1016/j.alit.2017.06.003
Keskitalo, T. (2012). Students’ expectations of the learning process in virtual reality and simulation-based learning environments. Aust. J. Educ. Technol. 28, 841–856. doi: 10.14742/ajet.820
Kolb, D. A. (1984). Experiential Learning: Experience as the Source of Learning and Development. Englewood Cliffs, NJ: Prentice-Hall.
Kwarteng, A., Sylverken, A., Antwi-Berko, D., Ahuno, S. T., and Asiedu, S. O. (2021). Prospects of immunology education and research in developing countries. Front. Public Health 9:652439. doi: 10.3389/fpubh.2021.652439
Loughry, M. L., Ohland, M. W., and Woehr, D. J. (2014). Assessing teamwork skills for assurance of learning using CATME team tools. J. Mark. Educ. 36, 5–19. doi: 10.1177/0273475313499023
Lyons, R. A., Jones, K. H., John, G., Brooks, C. J., Verplancke, J.-P., Ford, D. V., et al. (2009). The sail databank: linking multiple health and social care datasets. BMC Med. Inform. Decis. Mak. 9:3. doi: 10.1186/1472-6947-9-3
Metcalfe, J. (2017). Learning from errors. Annu. Rev. Psychol. 68, 465–489. doi: 10.1146/annurev-psych-010416-044022
Novak, J. D. (1980). Learning theory applied to the biology classroom. Am. Biol. Teach. 42, 280–285. doi: 10.2307/4446939
Novak, J. D. (2003). The promise of new ideas and new technology for improving teaching and learning. Cell Biol. Educ. 2, 122–132. doi: 10.1187/cbe.02-11-0059
Nygaard, C., Courtney, N., and Leigh, E. (2012). Simulations, Games and Role Play in University Education. Faringdon: Libri Publishing.
Pedaste, M., Mäeots, M., Siiman, L. A., de Jong, T., van Riesen, S. A. N., Kamp, E. T., et al. (2015). Phases of inquiry-based learning: definitions and the inquiry cycle. Educ. Res. Rev. 14, 47–61. doi: 10.1016/j.edurev.2015.02.003
Phillips, D. C. (1995). the good, the bad, and the ugly: the many faces of constructivism. Educ. Res. 24, 5–12. doi: 10.3102/0013189x024007005
Porter, E., Amiel, E., Bose, N., Bottaro, A., Carr, W. H., Swanson-Mungerson, M., et al. (2021). American association of immunologists recommendations for an undergraduate course in immunology. Immunohorizons 5, 448–465. doi: 10.4049/immunohorizons.2100030
Richardson, J. T. E. (2015). Coursework versus examinations in end-of-module assessment: a literature review. Assess. Eval. High. Educ. 40, 439–55. doi: 10.1080/02602938.2014.919628
Serrano, M. M., O’Brien, M., Roberts, K., and Whyte, D. (2018). Critical pedagogy and assessment in higher education: the ideal of ‘authenticity’ in learning. Active Learn. High. Educ. 19, 9–21. doi: 10.1177/1469787417723244
Soria-Guerra, R. E., Nieto-Gomez, R., Govea-Alonso, D. O., and Rosales-Mendoza, S. (2015). An overview of bioinformatics tools for epitope prediction: implications on vaccine development. J. Biomed. Inform. 53, 405–414. doi: 10.1016/j.jbi.2014.11.003
Stafford, P., Henri, D., Turner, I., Smith, D., and Francis, N. (2020). Reshaping education: practical thinking in a pandemic. Biologist 67, 24–27.
Stiggins, R. J. (1987). Design and development of performance assessments. Educ. Meas. Issues Pract. 6, 33–42. doi: 10.1111/j.1745-3992.1987.tb00507.x
Tam, M. (2000). Constructivism, instructional design, and technology: implications for transforming distance learning. J. Educ. Technol. Soc. 3, 50–60.
Veletsianos, G., and Houlden, S. (2020). Radical flexibility and relationality as responses to education in times of crisis. Postdigital Sci. Educ. 2, 849–862. doi: 10.1007/s42438-020-00196-3
Keywords: virtual flow cytometer, eLearning, simulations, immunology, pedagogy, dry labs, higher education
Citation: Francis NJ, Ruckley D and Wilkinson TS (2022) The virtual flow cytometer: A new learning experience and environment for undergraduate teaching. Front. Educ. 7:903732. doi: 10.3389/feduc.2022.903732
Received: 25 March 2022; Accepted: 27 June 2022;
Published: 22 July 2022.
Edited by:
Christine E. Cutucache, University of Nebraska Omaha, United StatesReviewed by:
Robert J. B. Nibbs, University of Glasgow, United KingdomHeather A. Bruns, University of Alabama at Birmingham, United States
Copyright © 2022 Francis, Ruckley and Wilkinson. This is an open-access article distributed under the terms of the Creative Commons Attribution License (CC BY). The use, distribution or reproduction in other forums is permitted, provided the original author(s) and the copyright owner(s) are credited and that the original publication in this journal is cited, in accordance with accepted academic practice. No use, distribution or reproduction is permitted which does not comply with these terms.
*Correspondence: Thomas S. Wilkinson, dC5zLndpbGtpbnNvbkBzd2Fuc2VhLmFjLnVr
 Nigel J. Francis
 Dave Ruckley
 Thomas S. Wilkinson