 Sharna Spittle
 Anthony P. Watt2
 Michael Spittle
94% of researchers rate our articles as excellent or good
Learn more about the work of our research integrity team to safeguard the quality of each article we publish.
Find out more
ORIGINAL RESEARCH article
Front. Educ. , 03 May 2022
Sec. Teacher Education
Volume 7 - 2022 | https://doi.org/10.3389/feduc.2022.840629
This research describes the development and psychometric evaluation of the Confidence and Motivation to Teach Primary Physical Education Questionnaire (CMTPPEQ). Phase 1 involved questionnaire development and quantitative analysis of reliability and use of exploratory factor analysis (EFA) to examine factor structure and validity with 161 pre-service teachers. The EFA revealed two confidence factors and five motivation factors. All factors displayed adequate internal consistency and acceptable test-retest reliability for the confidence factors and three motivation factors. In Phase 2, the measure was further evaluated and factor structure refined using confirmatory factor analysis (CFA), with 211 pre-service and 107 in-service teachers. The two-factor confidence structure of Management and Planning and Implementation was confirmed with acceptable levels of fit. Structural changes made to the motivation structure resulted in six factors: Knowledge, Practice, Introjected Performance, Professional Expectations, Student Outcomes, and Disengagement. All factors demonstrated adequate internal consistency.
Primary physical education provides important opportunities for children to be active in environments that support the development of movement and sports skills (Kirk, 2005; Morgan, 2005; Morgan and Bourke, 2008; Cale et al., 2014). Children who display low levels of physical activity and motor co-ordination (Morgan et al., 2013), are limited within their engagement in high quality primary school physical education (Lloyd et al., 2014; Lopes et al., 2017). Thus, it is important that teachers are confident and motivated to teach in physical education.
In Australia, as in many countries (O’Sullivan and Oslin, 2012; Freak and Miller, 2017), primary school physical education is regularly delivered by generalist primary teachers, who typically do not have specialist training in physical education (Lynch et al., 2017; Randall and Griggs, 2021). There is some debate as to whether generalist or specialist teachers are best placed to deliver physical education (O’Sullivan and Oslin, 2012; Freak and Miller, 2017; Jones and Green, 2017). Several studies have also highlighted challenges in the design and delivery of physical education programs (e.g., Freak and Miller, 2017; Randall and Fleet, 2021), which may influence confidence (Morgan and Hansen, 2007) and, potentially, motivation to teach physical education (O’Sullivan and Oslin, 2012).
Confidence has been depicted as an individual’s mindset toward their capabilities (Duda and Treasure, 2020). Confidence is important because it influences challenges undertaken, effort expended, and persistence (Feltz and Öncü, 2014). Consequently, confidence to teach physical education is a perceived belief about the ability to complete a range of specific tasks and handle situations in physical education. Further to this, teachers’ sense of efficacy is related to student outcomes and teacher behavior, including teaching effort and willingness to utilize new methods of delivery (Jimenez-Silva et al., 2012).
Research has consistently confirmed lower levels of confidence in teaching physical education (Morgan and Bourke, 2005, 2008; Morgan and Hansen, 2008; Randall and Fleet, 2021), however, the measures used to assess confidence have generally lacked design detail and supporting psychometric evaluation. Validity and reliability are not typically assessed or reported and measures tend to be narrowly focused on particular areas of physical education (e.g., the practical content areas) and not on the range of tasks involved in teaching physical education (e.g., planning lessons, performing assessment). The measures are also not specific to the context of primary physical education, where physical education is regularly delivered by generalist primary teachers, who typically do not have specialist training. One measure of teaching efficacy in physical education that has been developed and tested for validity and reliability is the Physical Education Teaching Efficacy Scale (PETES; Humphries et al., 2012). The PETES relates to specific teaching activities including content knowledge, applying scientific knowledge, accommodating skill differences, teaching students with special needs, instruction, using assessment, and using technology. This measure is a broad multi-dimensional measure, but is not specific to confidence in primary school contexts where generalist may deliver physical education, not linked to motivational constructs, and teaching activities may differ.
Motivation is a multi-faceted construct that consists of beliefs, perceptions, values, interests and actions that drive our behavior (Deci and Ryan, 1985). As motivation refers to an intention to act (Gredler et al., 2004), a teacher’s motivation is an important psychological factor that influences whether and how physical education is delivered in primary schools. Currently, a range of measures of general motivation and teaching motivation exist, however, none specific to physical education. Motivation has been studied extensively in relation to the student experience but the examination of motivation in teaching is quite scarce (Kaplan, 2014; Roth, 2014). Despite the existence of studies of teacher motivation (Spittle et al., 2009; Hein et al., 2012; Van den Berghe et al., 2013; Spittle and Spittle, 2014), research on the motivation of primary school teachers regarding physical education is much less evident.
As confidence is a mechanism that mediates motivation (Feltz and Öncü, 2014), the lower levels of confidence experienced by generalist primary teachers may relate to different motives around the delivery of physical education. Self-determination theory (SDT), is a wide-reaching theory concerning motivation and personality (Deci and Ryan, 1985) that may support research to identify motivational characteristics specific to teaching primary physical education. SDT (Deci and Ryan, 1985, 2000), asserts that humans exhibit differing types of motivation depending on the extent to which behavior is self-determined, and the subsequent manner in which it is regulated (Ryan and Deci, 2000b). Self-determination is achieved when an individual perceives that they are the origin of their behavior. The more self-determined behavior is, the better the motivational results. The type of motivation, rather than the amount of motivation, is believed to be a more accurate predictor of outcomes (Baumeister and Vohs, 2007).
The types of motivation; amotivation, extrinsic, and intrinsic motivation, range in terms of the extent to which the motivation is self-determined (Ryan and Deci, 2000a,b). Known as the self-determination continuum (Ryan and Deci, 2000a,b), behavior can be identified as amotivated or lying somewhere between being purely intrinsic to purely extrinsic (Ryan and Deci, 2017; Manninen and Yli-Piipari, 2021). Intrinsic motivation is the most self-determined form of motivation and involves undertaking an activity out of interest, enjoyment, or inherent satisfaction. Extrinsic motivation involves undertaking activities for reasons other than inherent interest in the activity. Amotivation is the least self-determined type of motivation and is characterized by the absence of intrinsic and extrinsic motivation. Previous research into motivation has been concerned with the quality rather than the quantity of motivation, making the type of motivation underlying behavior important (Roth, 2014). Motivation for teaching physical education continues to be explored in relation to SDT.
Developing a measure that examines both confidence and motivation would support the assessment of the beliefs and expectations influencing the decisions of teachers toward delivering physical education. Confidence (or self-efficacy) is the cognitive mechanism that mediates between sources of self-appraisal and subsequent motivation, thus, confidence contributes to motivation in a number of ways including determining goals, intensity of effort applied, level of persistence, and resilience to failure (Feltz and Öncü, 2014). Despite the capacity for confidence to impact upon motivation, both constructs have rarely been examined simultaneously and, as a consequence, no measures have been designed that can assess both constructs (Kaplan, 2014).
The aims for this research were the development and psychometric evaluation of a multi-dimensional measure of confidence and motivation to teach primary physical education. To achieve this, two phases were conducted to develop and refine the measure. Based on these aims it was hypothesized that the development of the instrument for both confidence and motivation would demonstrate satisfactory psychometric properties in terms of factor structure, validity, and reliability. In addition, as confidence is expected to be related to motivation, it was hypothesized that there would be relationships between the confidence and motivation factors.
Participants were 161 pre-service teachers studying an education degree (male: n = 31; female: n = 130) with a mean age of 24.66 years (SD = 4.69). From the sample, 132 indicated they were studying to become a generalist primary teacher and 29 indicated they would be specializing in primary physical education. A specialist primary physical education teacher completes specific training; most often a minimum of six discipline units, approximately 200 h, must be completed to specialize. A sample of 25 participants completed the questionnaire again 2 weeks after initial testing to provide for test-retest reliability.
The questionnaire consisted of two sections addressing confidence and motivation.
Confidence Scale. To construct the confidence section of the questionnaire, an examination of curriculum documents, learning standards and professional standards for teachers was undertaken to create a pool of potential questions (ACHPER, 2010; AITSL, 2011; VIT, 2010; VCAA, 2012) which led to the identification of nine teaching attributes. A total of 43 items that were then analyzed for similarities and reduced to 24 items, which related to the global item stem of “I am confident in my ability to.”
Motivation Scale. The motivation section of the questionnaire was constructed in accordance with the frameworks of the Academic Motivation Scale (AMS; Vallerand et al., 1992) and the Sport Motivation Scale (SMS; Pelletier et al., 1995) that are based on Vallerand (1997) interpretation of SDT. Both scales consist of 28 Likert scale style questions related to seven different subscales of motivation. Three subscales measure various types of intrinsic motivation, three measure various types of extrinsic motivation, and one assesses amotivation. The individual items in each of the scales were used as a base to develop the questions to evaluate motivation for teaching primary physical education. The item stem “Why you would teach physical education” was used.
All items developed were combined to create a two-part questionnaire, the CMTPPEQ, which consisted of 52 items to examine an individual’s confidence to teach (24 items) and motivation to teach (28 items) primary physical education. The final version of the questionnaire incorporated a 6-point Likert Scale as the response technique ranging from 1 (strongly disagree) to 6 (strongly agree).
Comprehensibility. The CMTPPEQ was initially read and reviewed for clarity by five undergraduate students with Primary Physical Education (P-6) as one of their majors. Students identified whether they felt questions were comprehensible (easy to understand) and any specific words or phrases that were difficult to understand, which resulted in minor grammatical changes.
Face and Content Validity. The questionnaire was then reviewed by five expert practitioners and researchers in the area of physical education and teacher education. Experts were asked to indicate whether they felt each item was appropriate and comprehensible and provide any necessary general feedback about each item. This led to refinement of the questionnaire into the final draft.
Ethics approval for the research was granted by a University Human Research Ethics Committee. Following consultation and consent from lecturers of a compulsory health and physical education unit in a Bachelor of Education, questionnaires were administered during classes. Researchers provided a plain language explanation of the research and informed potential participants that participation was voluntary, and that their consent was implied by the return of the completed questionnaire. The questionnaire required less than 15 min to complete.
Data analysis was undertaken to evaluate the factor structure, validity, and reliability of each of the confidence and motivation sections of the questionnaire. Exploratory factor analysis (EFA) using principal axis factoring extraction and oblique rotation was used to examine factor structure (Costello and Osborne, 2005; Gorsuch, 2013) and logical analysis was used to assist with the final factor structure (Marsh, 1998). Statistical analysis and factor analysis was undertaken using SPSS 27 and AMOS 28 software. Internal consistency of each of the subscales was assessed using Cronbach’s alpha coefficients where coefficients greater than 0.70 were considered acceptable (Nunnally, 1978). Item-subscale correlation and item-deleted alpha coefficients were used to examine the degree to which each item is a good exemplar of the subscale it is proposed to belong to. A reliability coefficient of stability was calculated using Pearson’s correlation for the test-retest data.
Preliminary analysis of the skewness and kurtosis values indicated that the data was not normally distributed. The Kaiser-Meyer-Olkin Measure of Sampling (KMO) and Bartlett’s Test of Sphericity were examined for partial correlations. The KMO value (KMO = 0.96) supported that the sample size was adequate for factor analysis (Field, 2018). Bartlett’s Test of Sphericity was significant (p < 0.001), suggesting that there were some relationships between proposed variables. Communalities were all above 0.30.
Kaiser (1958) criterion was used to determine the initial number of factors to be rotated. Solutions for two and three factors were examined using principal axis factoring using direct oblimin rotation. The two-factor solution, which explained 55% of the variance, was the preferred solution because of: (a) The “leveling off” of eigenvalues on the scree plot after 2 factors and parallel analysis confirming the two-factor solution because the eigenvalues extracted from real data exceeded those extracted from random data; (b) the insufficient number of primary loadings and (c) difficulty of interpreting the third factor. Direct oblimin rotation converged in 13 iterations. Items with loadings greater than or equal to 0.40 were then used to interpret the factors. The factors were labeled as Factor 1: Management and Planning (MP); and Factor 2: Implementation (I). Table 1 displays the EFA results for confidence.
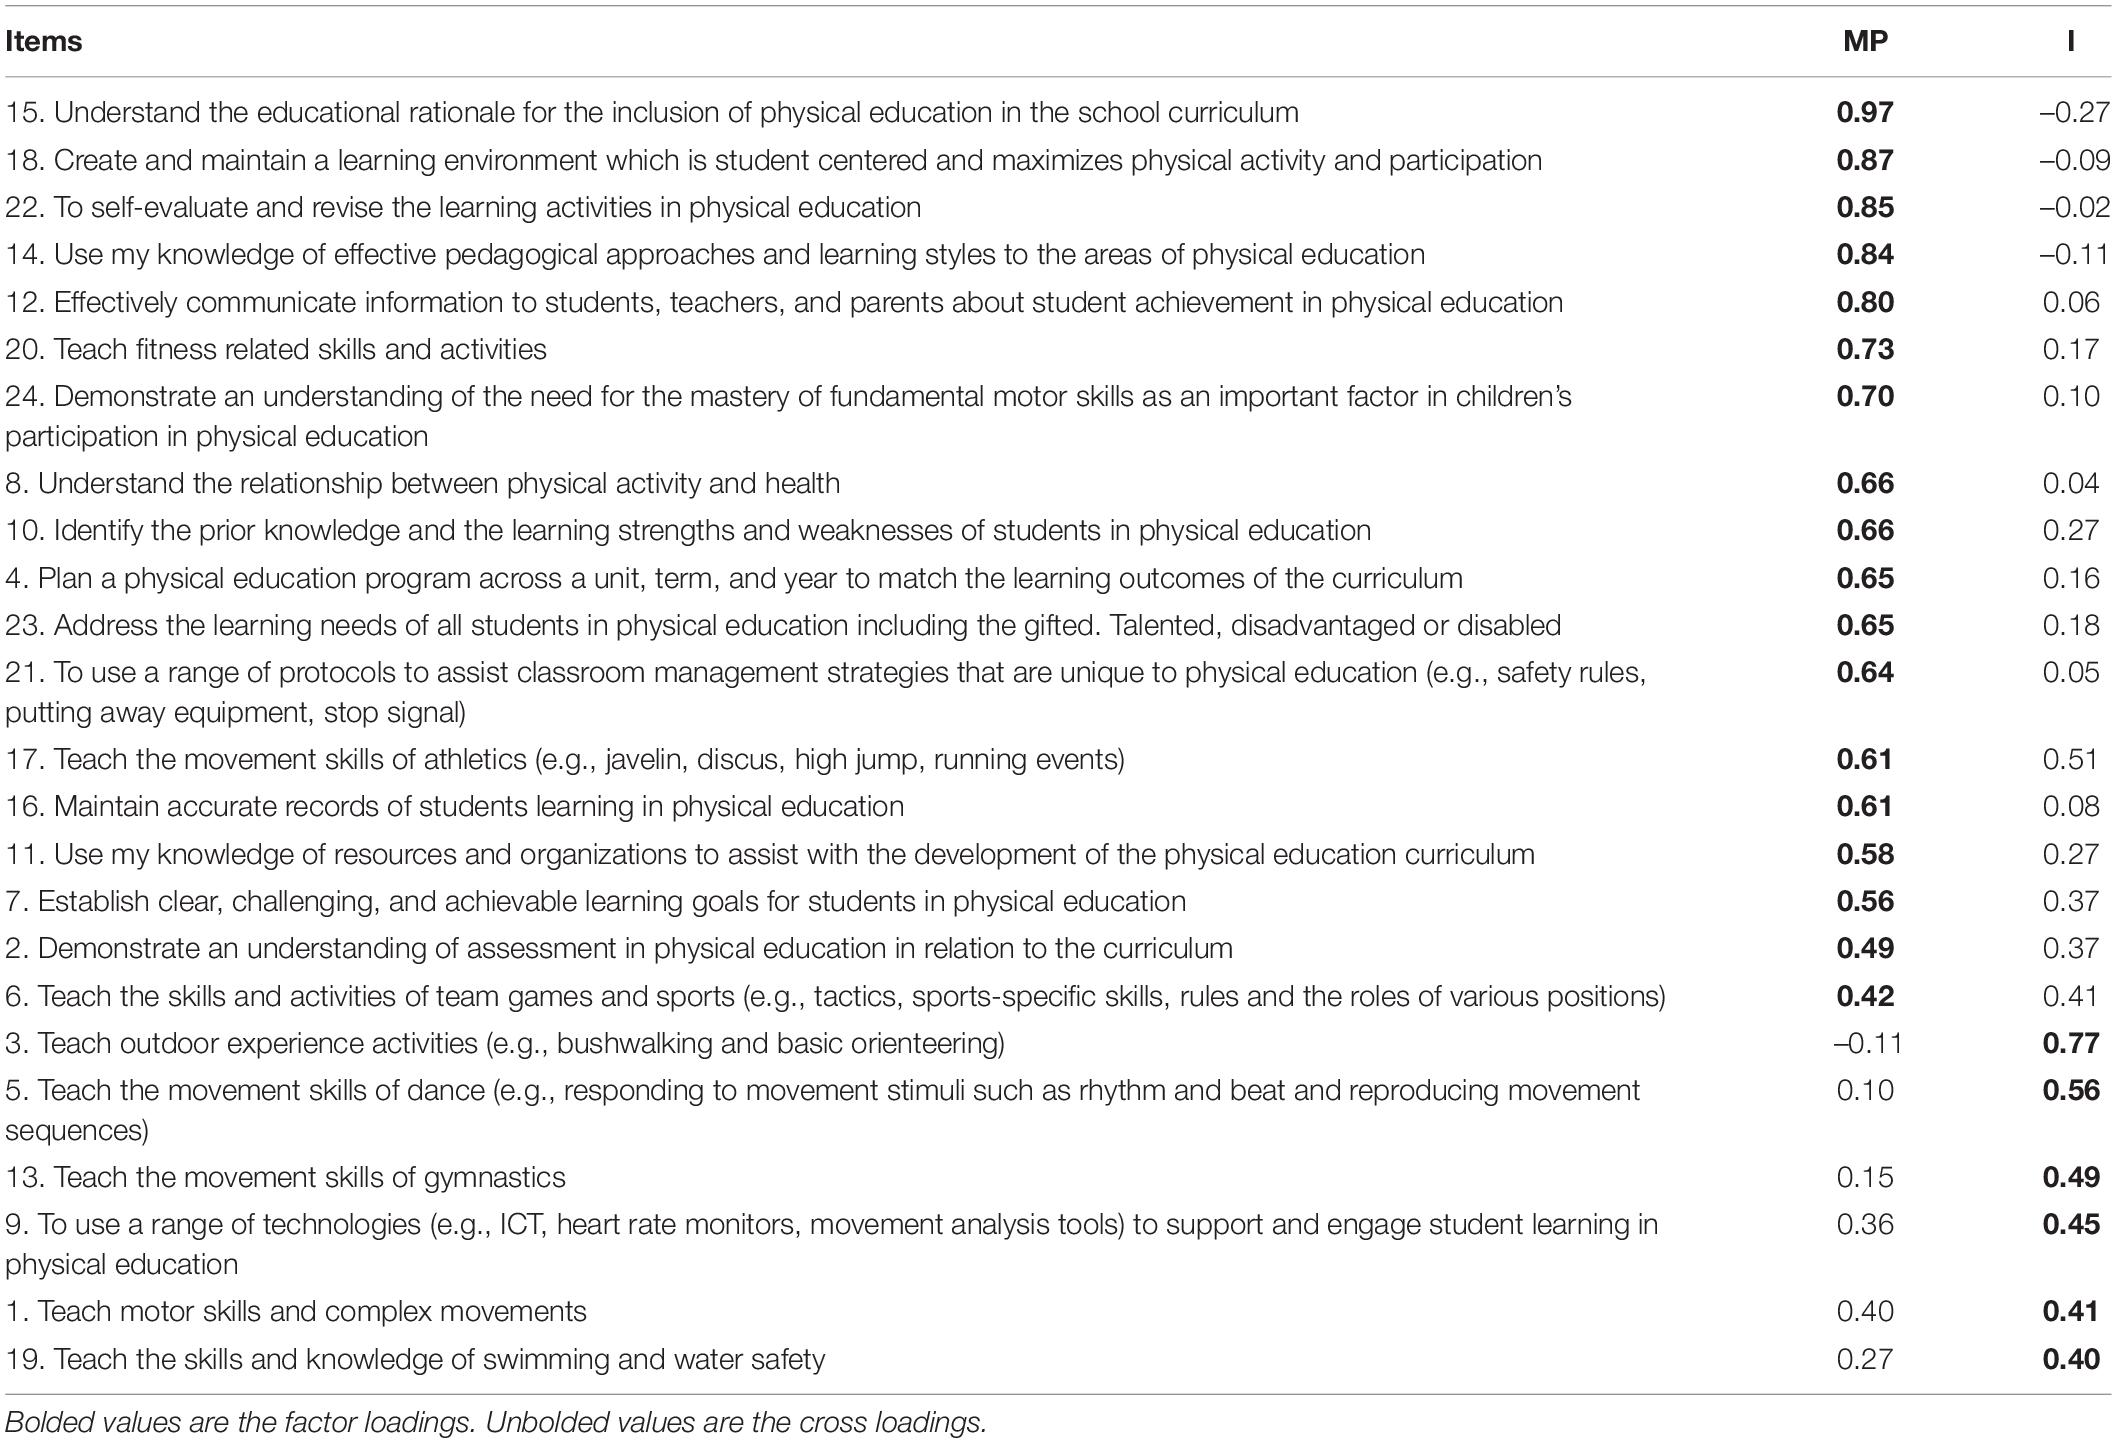
Table 1. Factor loadings for the exploratory factor analysis with oblimin rotation of the confidence section.
Internal consistency (Cronbach’s alpha) and Pearson’s correlation coefficients were computed for the confidence factors. Both of the factors returned adequate Cronbach’s alpha values (0.95 for Management and Planning and 0.89 for Implementation) (Nunnally, 1978) and test-re-test reliability (r = 0.65, p < 0.05 for Management and Planning and r = 0.89, p < 0.05 for Implementation) (Miller, 2020).
As for the confidence section of the questionnaire, preliminary analysis of the skewness and kurtosis values indicated that the data was not normally distributed. A KMO value of 0.90 indicated that the sample size was adequate for factor analysis (Field, 2018). Bartlett’s Test of Sphericity was significant (p < 0.001), indicating that relationships existed between the variables. Examination of the correlation matrix also found several sizeable correlations above the minimum of 0.3, which further confirms that items shared some common variance with other items. These results indicated that the 28 items were suitable for factor analysis.
Principal axis factoring extraction with direct oblimin rotation was performed with the initial eigenvalue for the first factor explaining 36% of the variance. The second, third, fourth, fifth, and sixth factors also had eigenvalues over one and explained 13, 6, 5, 4, and 4% of the variance, respectively. A six factor solution was chosen as the preferred solution. The five factor solution failed to have a sufficient number of primary loadings making it difficult to interpret the fifth factor and the four factor solution had a large number of the items loading on one factor causing difficulty in interpretation. Parallel analysis also revealed a six factor solution on the basis that the eigenvalues of six factors extracted from real data exceeded those extracted from random data. However, the sixth factor raw data eigenvalue was only marginally higher than the mean eigenvalue but lower that the 95th percentile eigenvalue. On the basis of the statistical considerations of both the explained variance and the parallel analysis a six factor solution was subsequently chosen as the preferred EFA solution. Variables with loadings greater than 0.40 were used to interpret the factors. The identity of some of the factors was not clear with some variables not loading on the factor to which they should logically be aligned.
Subsequent item level logical analysis indicated that Factor 1 retained its original structure produced by the EFA. It contained eight items and was labeled Personal Satisfaction. Factor 2 also maintained its original structure of four items and was labeled Amotivation. Factor 3 originally contained three items, however, item 11 did not logically fit with the other items in the factor and was moved into the fifth factor. This move was logically coherent as item 11 loaded strongly on both the third and the fifth factor. The finalized third factor contained two items and was labeled Learning and Development. Factor 4 originally contained four items and Factor 6 originally contained two items. Logical analysis also found that these items would be best represented as one factor, so these factors were combined to make Factor 4, labeled Expectations, Requirement, and Guilt. Factor 5 maintained its original structure with the addition of item 11 and was labeled as Fun, Improvement and Relationships. The final factor structure of the motivation section contained 5 factors. Table 2 displays the results of the EFA for motivation.
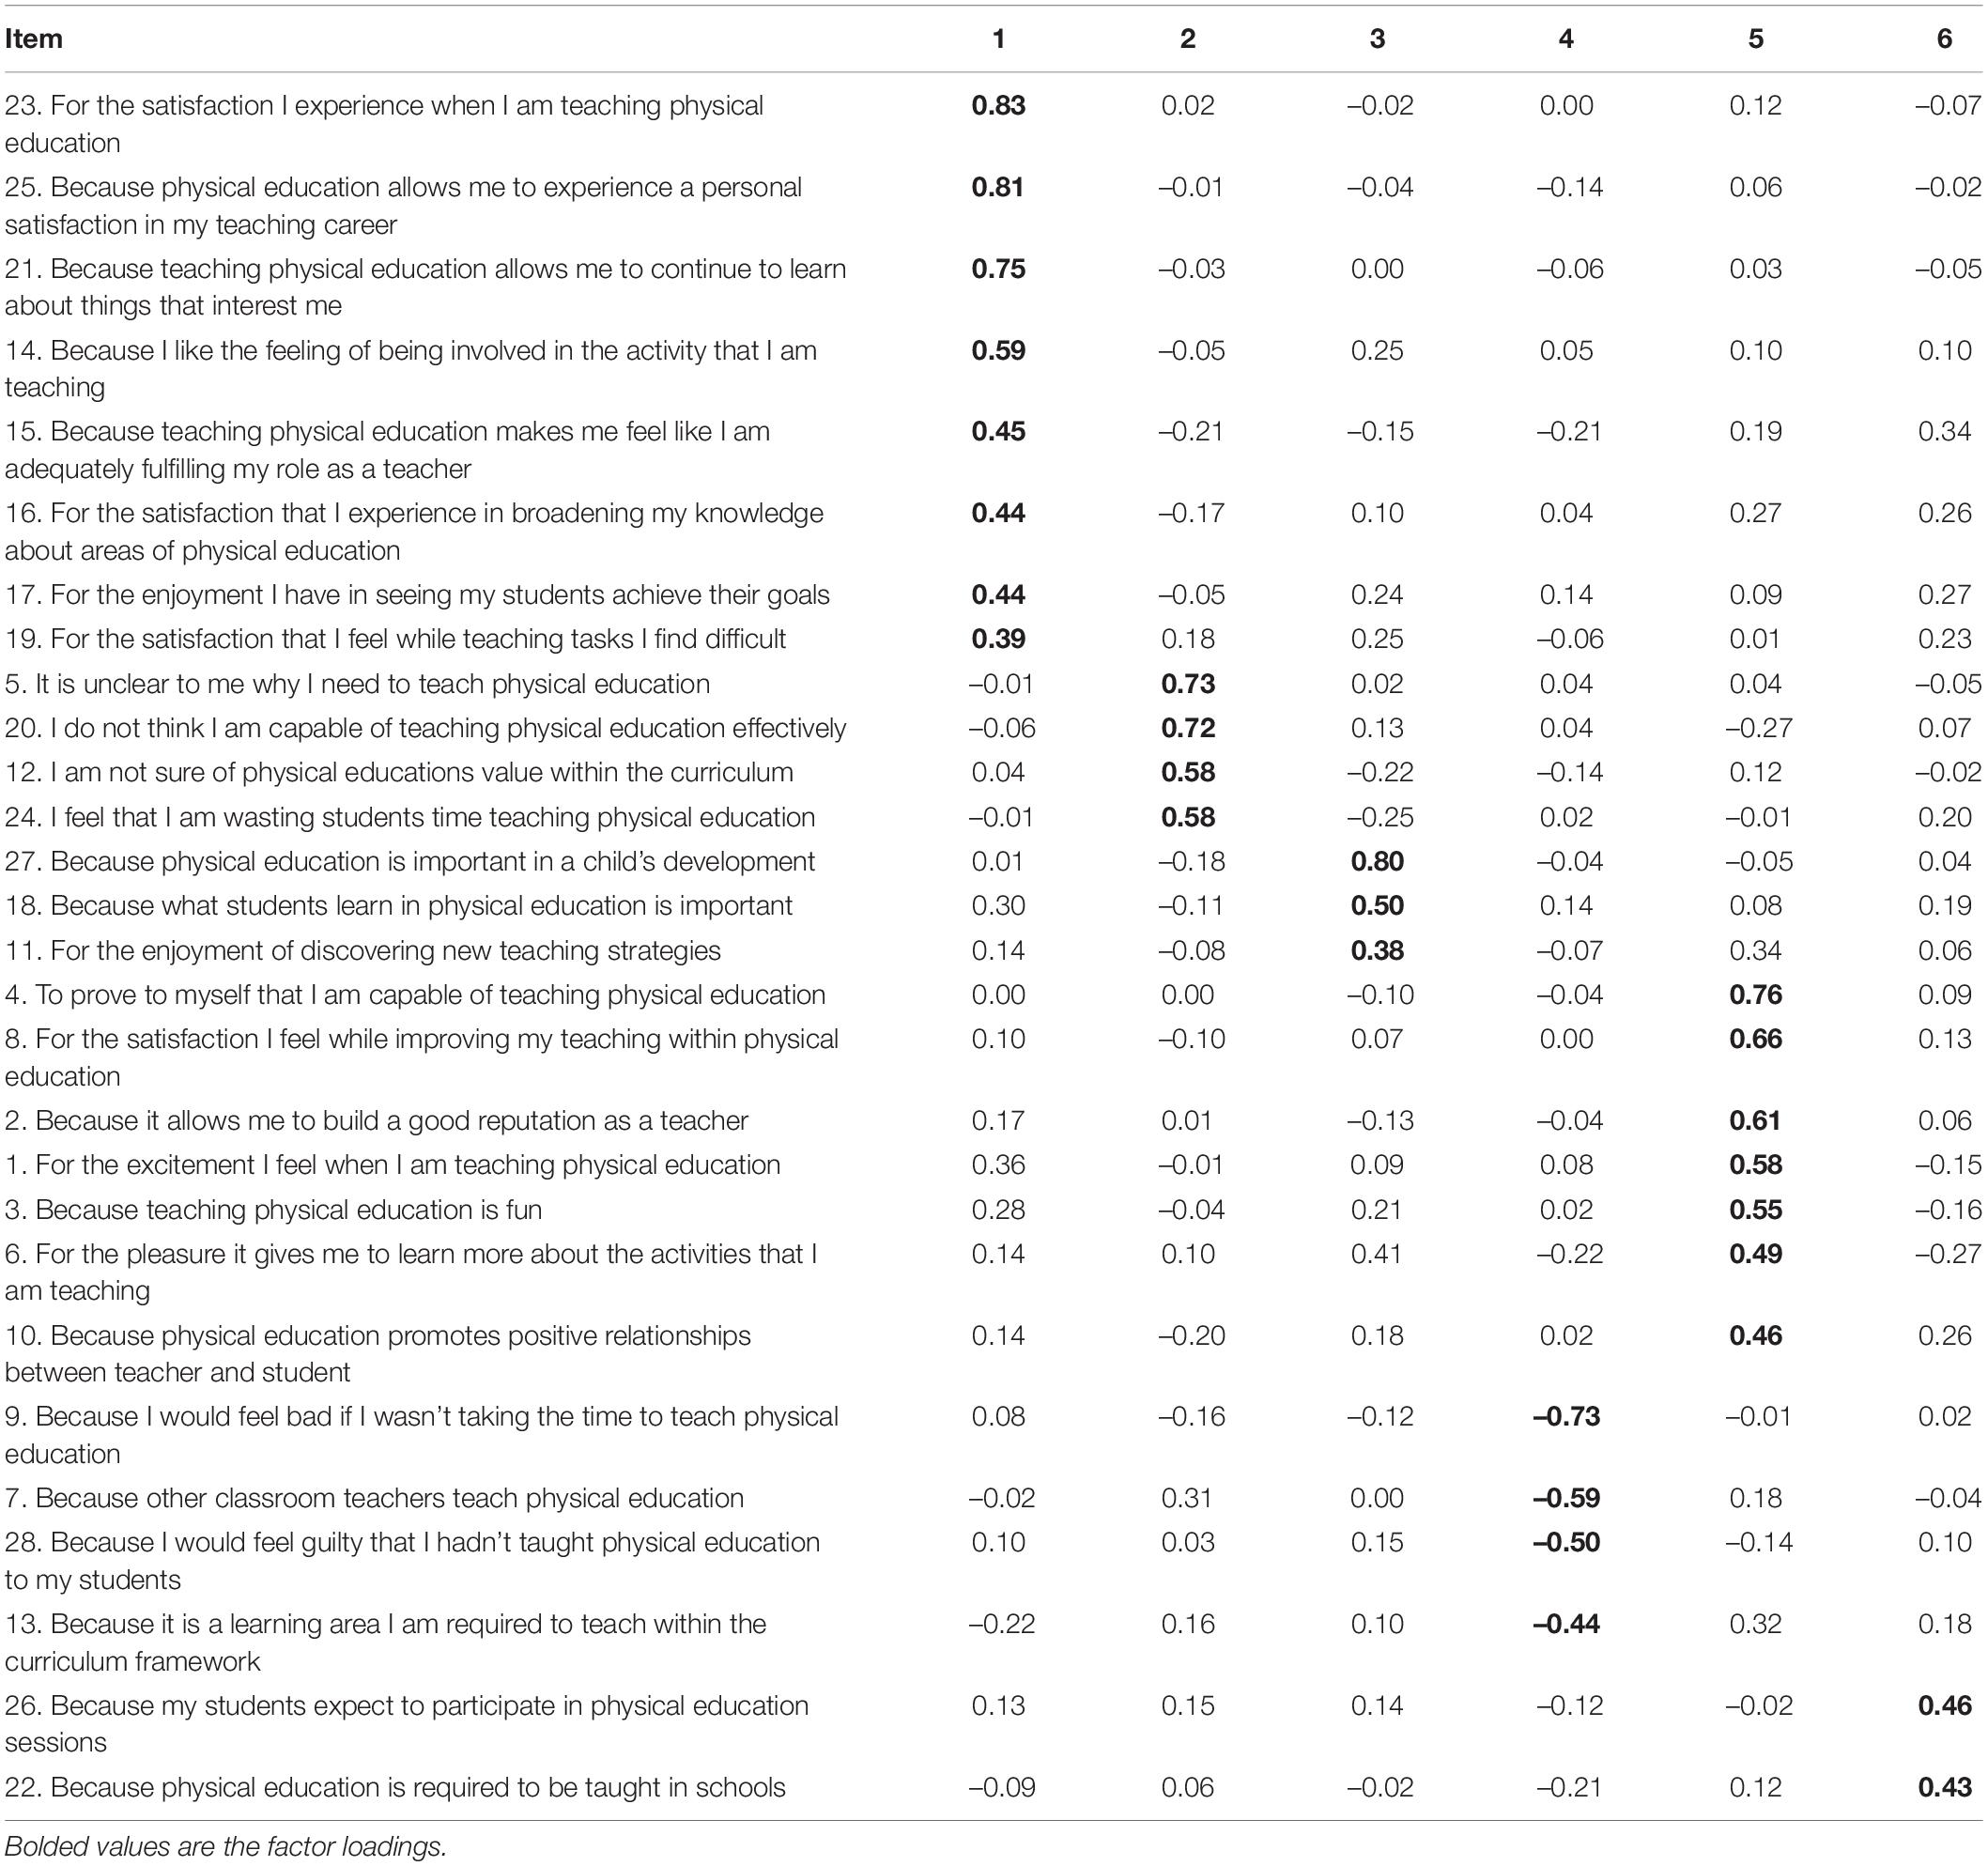
Table 2. Factor loadings for the exploratory factor analysis with oblimin rotation of the motivation section.
Internal consistency (Cronbach’s alpha) values were found to be adequate (Nunnally, 1978) for all factors (0.91 for Personal Satisfaction, 0.77 for Amotivation, 0.77 for Learning and Development, 0.75 for Expectations, Requirement and Guilt, and 0.90 for Fun, Improvement and Relationships). Test-retest reliability correlations for Personal Satisfaction (r = 0.76), Amotivation (r = 0.84), and Fun, Improvement and Relationships (r = 0.75) were adequate. Correlations for Expectations, Requirement and Guilt (r = 0.54) and Learning and Development (r = 0.53) were lower. Table 3 presents the pattern of correlations among the motivation subscales. Correlations ranged between 0.78 for Personal Satisfaction with Fun and –0.37 between Learning and Development and Amotivation. As expected, the correlations for amotivation are generally negative with other subscales as it represents an absence of intrinsic and extrinsic motivation.
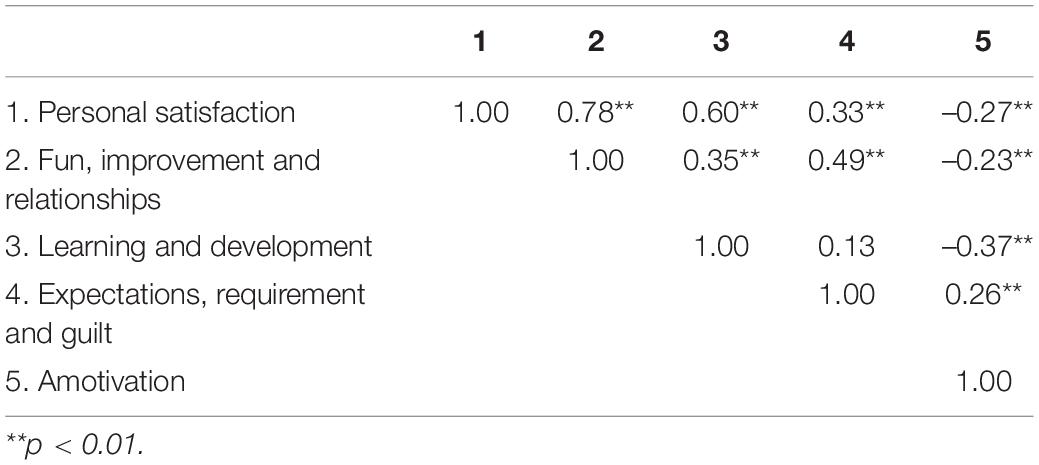
Table 3. Correlations between motivation subscales.
The examination of a simplex pattern of an instrument based on SDT to prove construct validity is not uncommon (Vallerand et al., 1992; Fairchild et al., 2005). It is hypothesized that a simplex pattern occurs where motivation subscales along across the motivation continuum would be ordered in sequence, so that adjacent subscales would have the strongest relationship, with relationships weakening as distance between types of motivation became greater and amotivation should exhibit negative relationships (Fairchild et al., 2005; Guay et al., 2015). The correlations suggest some evidence of a simplex like pattern with stronger positive correlations between adjacent variables, providing some evidence of convergent validity, and appear to be somewhat consistent with the self-determination continuum, providing some evidence for construct validity. For example, personal satisfaction exhibited stronger correlation with fun, improvement and relationships, which both represent more intrinsic motivation, and a lower correlation with expectations, requirement and guilt, which represents more extrinsic motivation.
Following the results of Phase 1, the main aim of Phase 2 was to further evaluate the psychometric properties and factor structure of the CMTPPEQ developed in Phase 1 using Confirmatory Factor Analysis (CFA).
Participants were 318 pre-service (n = 211) and in-service teachers (n = 107), comprising 252 females and 66 males, ranging in age between 17 and 66 years (M = 30.37, SD = 11.98). Participants designated whether they were a physical education specialist (n = 69) or generalist (n = 249).
The revised version of questionnaire developed as an outcome of Phase 1 consisted of two sections that addressed confidence (24 items) and motivation (28 items).
Pre-service teachers were recruited through four universities with participants completing a hardcopy of the questionnaire and returning it to the researchers or by completing the questionnaire online via a link provided to them. For in-service teachers, Government, independent and Catholic schools were contacted to seek approval to recruit participants. Teachers completed a hardcopy questionnaire via reply paid envelope or an online version of the questionnaire. Ethics approval was granted using the same groups and protocols in phase 1.
Data analysis was undertaken to examine the factor structure, validity, and reliability of the questionnaire. Statistical analysis and factor analysis was undertaken using SPSS 27 and AMOS 28 software. CFA using the maximum likelihood estimation procedure was used to examine factor structure. Model solutions were evaluated using Goodness of fit index (GFI) and adjusted goodness of fit index (AGFI) statistics and the following indices to assess model fit: normed fit index (NFI), Tucker-Lewis index (TLI), comparative fit index (CFI), and root mean square error of approximation (RMSEA). Internal consistency was assessed using Cronbach’s alpha coefficients where coefficients greater than 0.70 were considered acceptable (Nunnally, 1978). Relationships between confidence and motivation were explored using Pearson’s correlations.
The initial analysis tested the fit of the model proposed by the EFA from Phase 1, shown as Model 1 in Figure 1. This model incorporated each item of the confidence section of the questionnaire as observed variables and a reasonable degree of fit was found with the fit indices. In an effort to improve the model fit, the modification indices were examined. A correlation between error terms was added between two observed variables; question 5 (delivering the movement skills of dance) and question 13 (delivering the movement skills of gymnastics) and the results are labeled as Model 2 in Figure 1. The resultant correlation was an outcome of both the data and logical analyses. The modification index between these variables was large at 23.54.
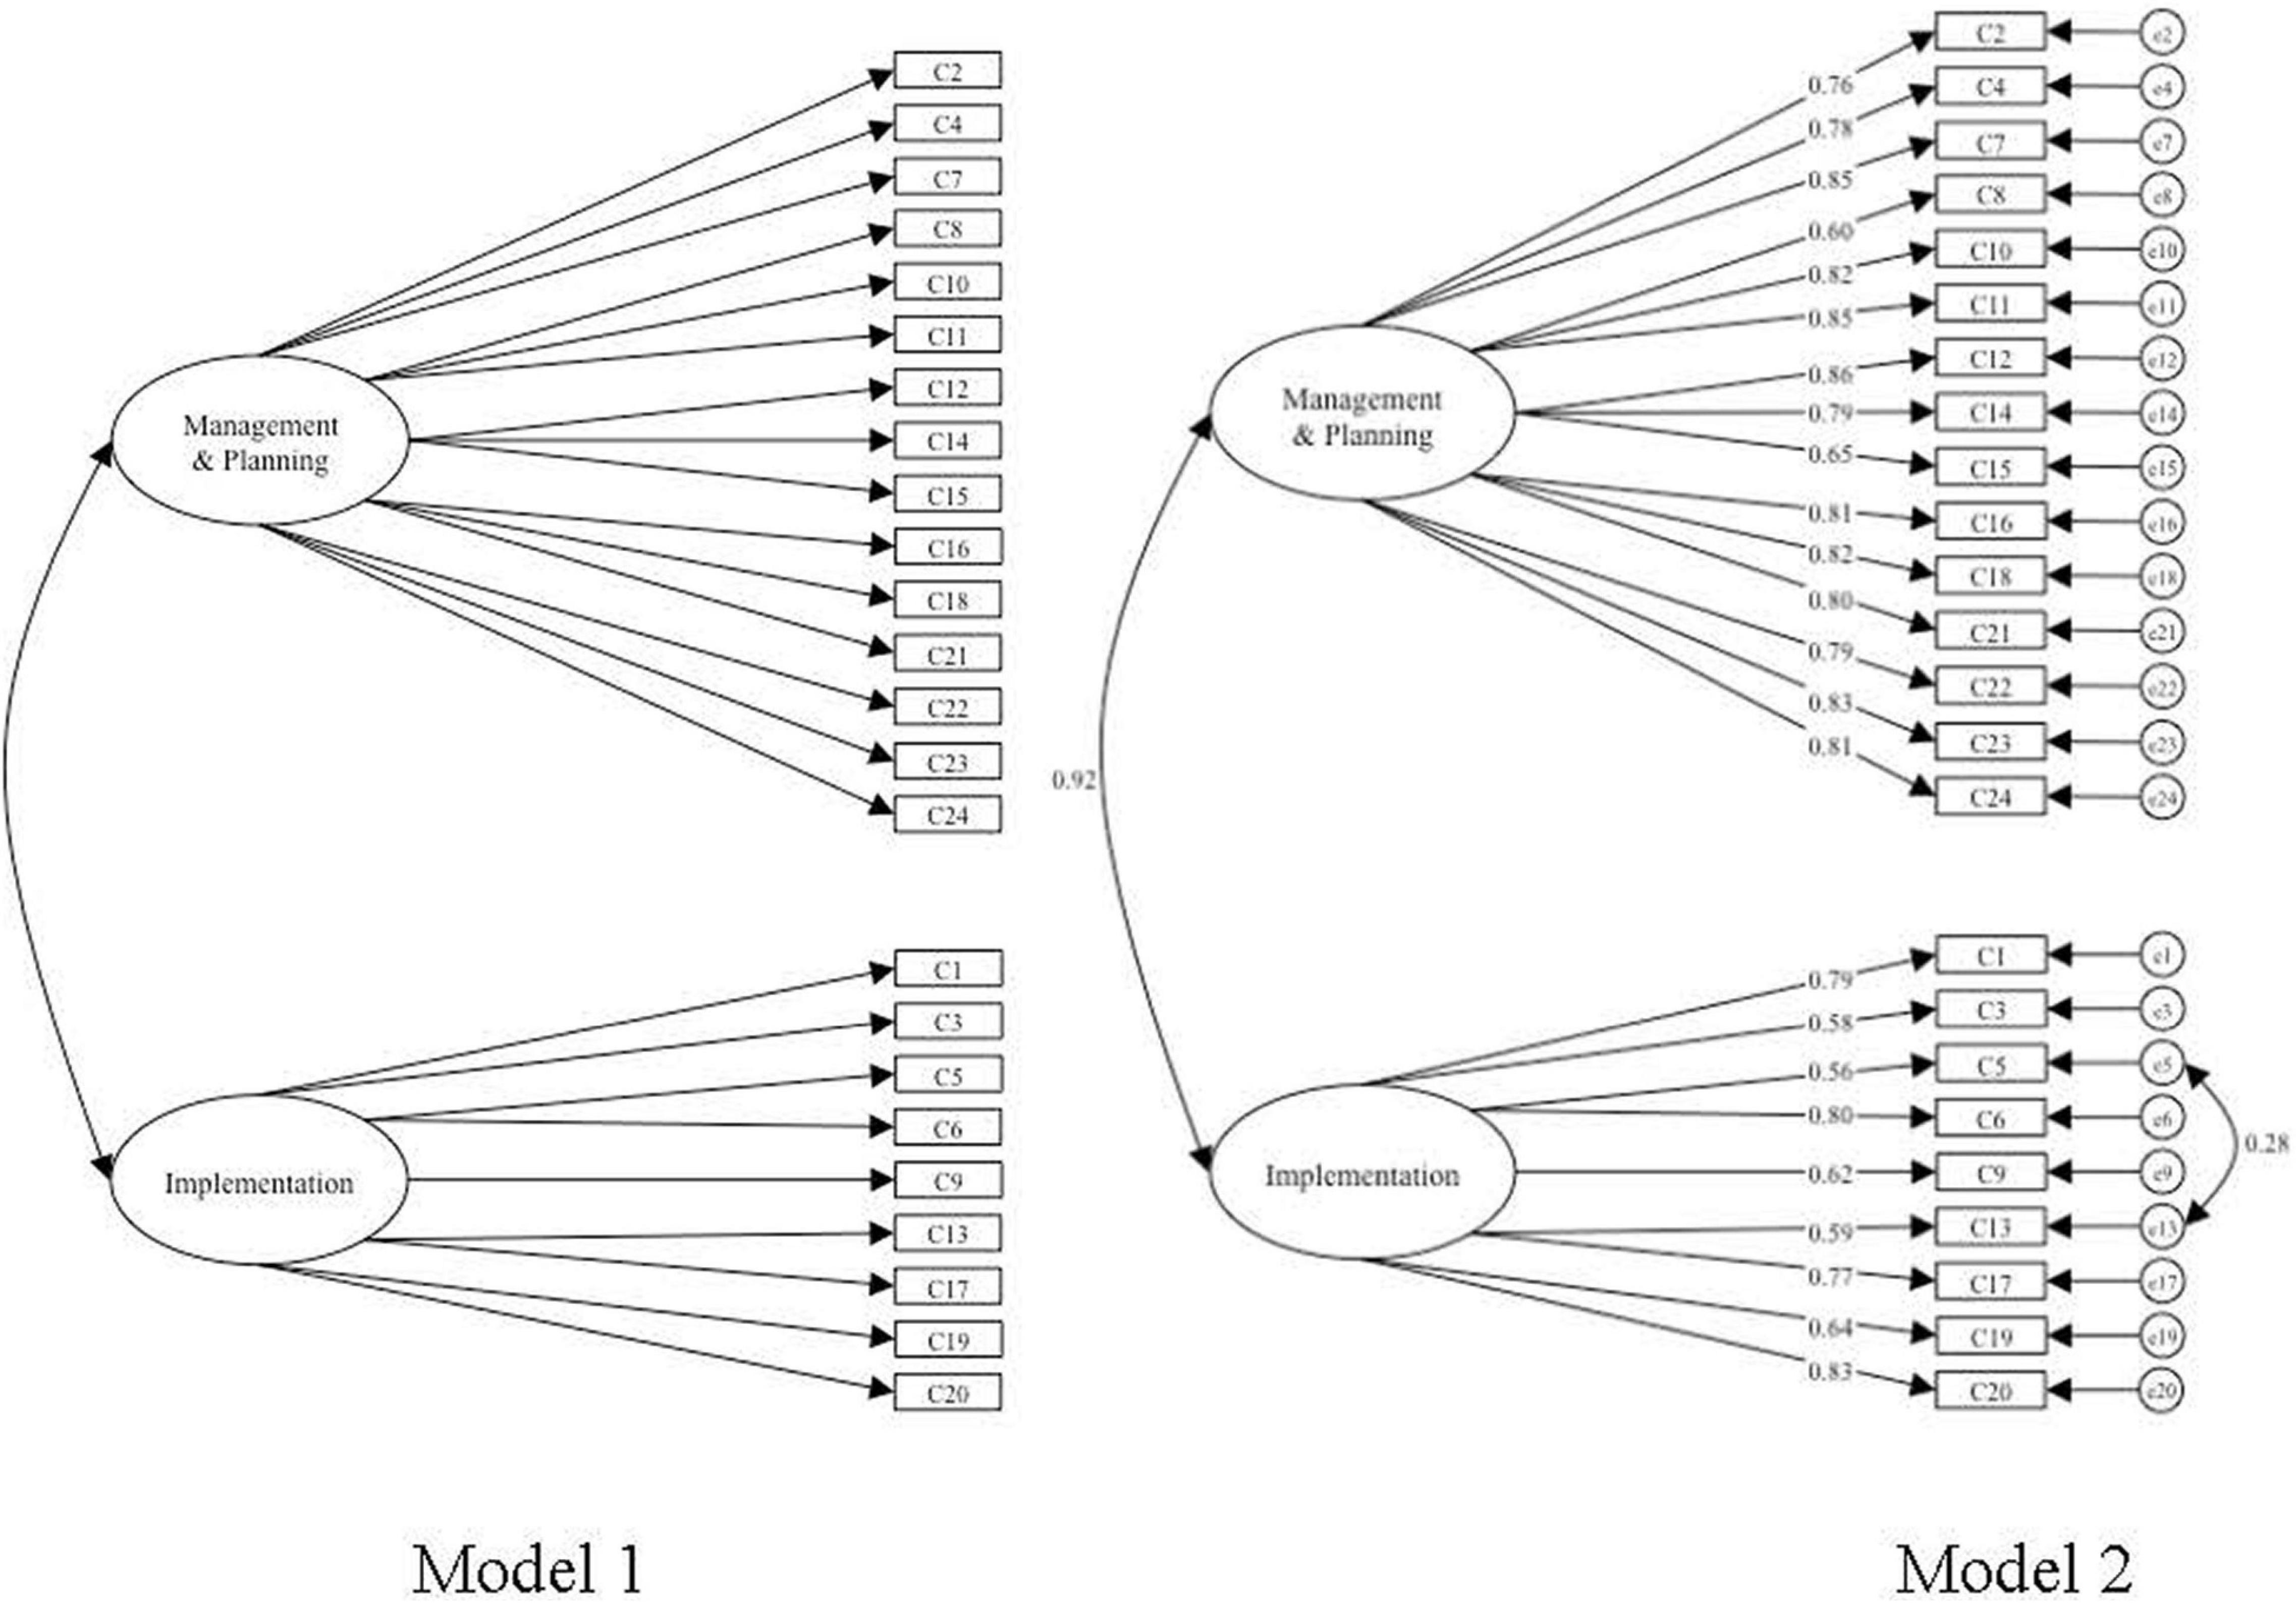
Figure 1. Proposed model (Model 1) and final confirmatory factor analysis model (Model 2) for the motivational section of the questionnaire.
Goodness of fit indices indicated that Model 2, χ2(251) = 669.13, p < 0.001, GFI = 0.838, AGFI = 0.807, Cmin/DF = 2.66, TLI = 0.922, RMSEA = 0.072, CFI = 0.929, NFI = 0.891, exhibited a better fit than Model 1, χ2(250) = 644.35, GFI = 0.843, AGFI = 0.812, Cmin/DF = 2.58, TLI = 0.926, RMSEA = 0.071, CFI = 0.933, NFI = 0.895. Both models had a high chi-square and low p-value (p < 0.001); however, the χ2/d.f. ratios of both models were < 3. The TLI and CFI in both models reached the recommended cut off of > 0.90, with the NFI value also very close. The RMSEA was also less than < 0.08 for both models, indicating a reasonable fit. The GFI and AGFI values were the lowest of the fit indices reported. These fit indices did not reach the recommended cut off of > 0.90 in either model but the values were higher and closer to 0.90 in Model 2.
Descriptive statistics and internal consistency were computed for both the factors. Both Management and Planning (M = 67.03 SD = 14.47, M per item = 4.47, SD = 0.96, Cronbach alpha = 0.96) and Implementation (M = 36.05, SD = 9.11, M per item = 4.01, SD = 1.01, Cronbach alpha = 0.89) returned adequate Cronbach’s alpha values (Nunnally, 1978). A Pearson’s correlation between the confidence factors revealed a strong and statistically significant relationship (r = 0.84, p < 0.01) between the factors. Convergent validity refers to the degree to which items in a construct that should be related are actually related. Convergent validity can be supported by composite reliability (CR) and the average variance extracted (AVE) (Hair et al., 2014). AVE above 0.5 is generally considered acceptable (Hair et al., 2010) but if AVE is less than 0.5 and CR greater than 0.6, this may also still be adequate (Fornell and Larcker, 1981). For both confidence subscales, convergent validity was acceptable, with the Management and Planning AVE 0.63 and CR 0.99 and the Implementation AVE 0.48 and CR 0.89.
The initial analysis tested the fit of the model proposed by the EFA from Phase 1, shown as Model 1 in Figure 2. This model incorporated each item as observed variables on one of five latent variables. The results indicated that the model did not represent a good fit for the data and that substantial modifications would be required. It was decided that item 7 was a potentially confusing item, so the item was removed, which improved the fit indices (Model 2). Items 1, 3, 6, 8, and 11 all appeared to describe fun, excitement and satisfaction that an individual gains from teaching physical education, whereas the other three items (2, 4, and 10) appeared to be more about building relationships.

Figure 2. Proposed model (Model 1) and final confirmatory factor analysis model (Model 6) for the motivational section of the questionnaire.
The addition of another latent factor saw the overall model fit improve (Model 3). Adding this latent factor resulted in the model having three factors that appeared to characterize the affective motivations representative of the teaching process. Through logical analysis, items on these three latent factors; personal satisfaction, fun, improvement and relationships, and the recently added latent factor were then grouped. This resulted in items 1, 3, and 8 being moved to personal satisfaction and items 15, 16, 21 and 25 being moved to fun, improvement and relationships. Items 10 and 17 logically fit better with other items on the factor labeled learning and development. This restructure saw the model fit improve (Model 4). Following the minor model restructure, the modifications indices were examined to see if correlation errors could be added to improve the fit of the model. Correlation errors were added between the following items; items 15 and 16, 21 and 25, 18 and 27, 9 and 28, and 1 and 3 as the values were all > 20 (Model 5). The final step in attempting to improve the model fit was the examination of the standardized residual covariance matrix. Items 9 and 28 were found to have high values with a number of the other items, which resulted in them being removed. The removal of these items once again improved the model fit (Model 6). The final model (Model 6) produced the fit indices that moved closer to their respective recommended cut off values. The latent factors in the final model were then renamed to provide a more accurate description of the items they include. Results of the CFA for the models are shown in Table 4. The six resultant factors of Model 6 were labeled as in Figure 2.
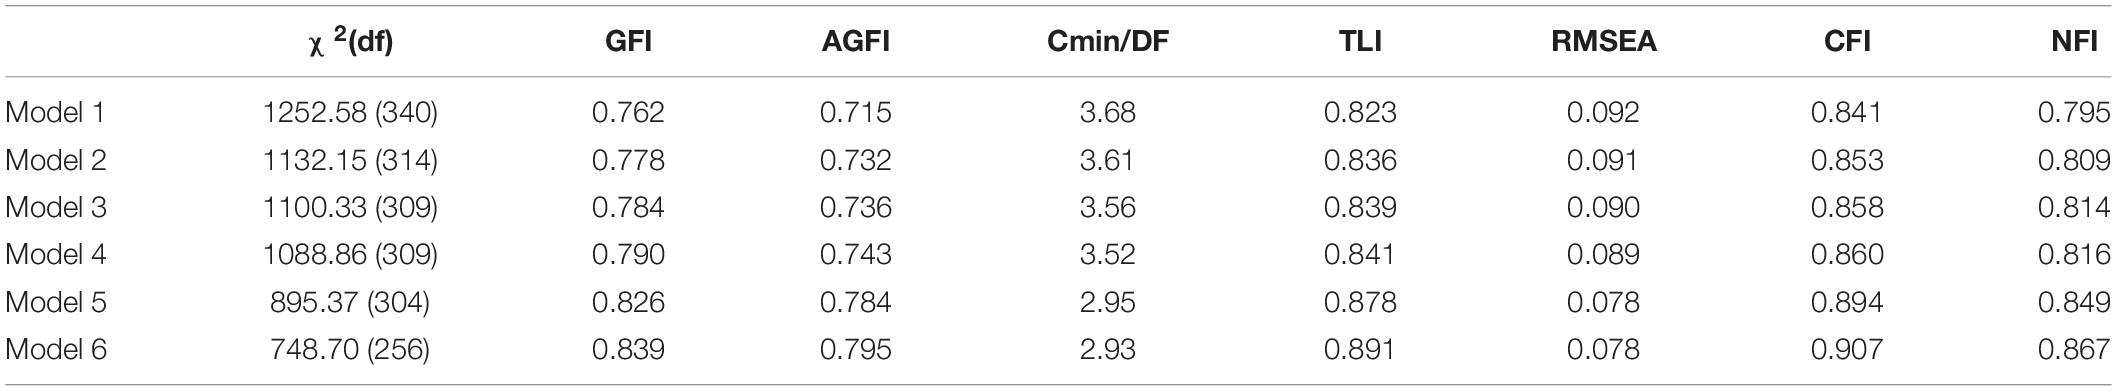
Table 4. Goodness of fit indices for confirmatory factor analysis models of the motivation section of the questionnaire.
In the case of GFI, AGFI, TLI, CFI, and NFI, each of these values increased with the chi-square, χ2/d.f. and RMSEA decreasing. All of the models had high chi-square and low p-values (p < 0.001) with the final two models achieving χ2/d.f. ratios of < 0.3. The only index that reached the recommended cut off of > 0.90 was CFI in Model 6. The other fit indices; TLI, NFI, GFI, and AGFI did not reach the recommended cut off values of > 0.90 in any of the models, however, the values were the highest and closest to 0.90 in Model 6. The RMSEA was < 0.08 in Model 5 and Model 6, indicating a reasonable fit.
Descriptive statistics and internal consistency were computed all of the factors, Knowledge (M = 12.48, SD = 3.21, M per item = 4.17, SD = 1.10, Cronbach alpha = 0.78), Practice (M = 21.78, SD = 5.61, M per item = 4.35, SD = 1.17, Cronbach alpha = 0.91), Introjected Performance (M = 24.07, SD = 6.67, M per item = 4.11, SD = 1.15, Cronbach alpha = 0.89), Professional Expectations (M = 11.51, SD = 3.50, M per item = 3.85, SD = 1.19, Cronbach alpha = 0.73), Student Outcomes (M = 19.73, SD = 3.67, M per item = 5.03, SD = 0.96, Cronbach alpha = 0.83), and Disengagement (M = 7.59, SD = 3.86, M per item = 1.97, SD = 1.02, Cronbach alpha = 0.79). All factors returned adequate Cronbach’s alpha values (Nunnally, 1978). Table 5 presents the Pearson’s correlations among the motivation factors. The correlations indicate evidence of a simplex like pattern with stronger positive correlations between adjacent variables than variables further apart on the continuum and appear to be relatively consistent with the self-determination continuum, providing some evidence of convergent and construct validity (Vallerand et al., 1992). Convergent validity was supported, with four of the six subscales displaying AVE above 0.5 and the other two marginal at 0.49 (Table 5), but with CR above 0.7 (Fornell and Larcker, 1981; Hair et al., 2010).
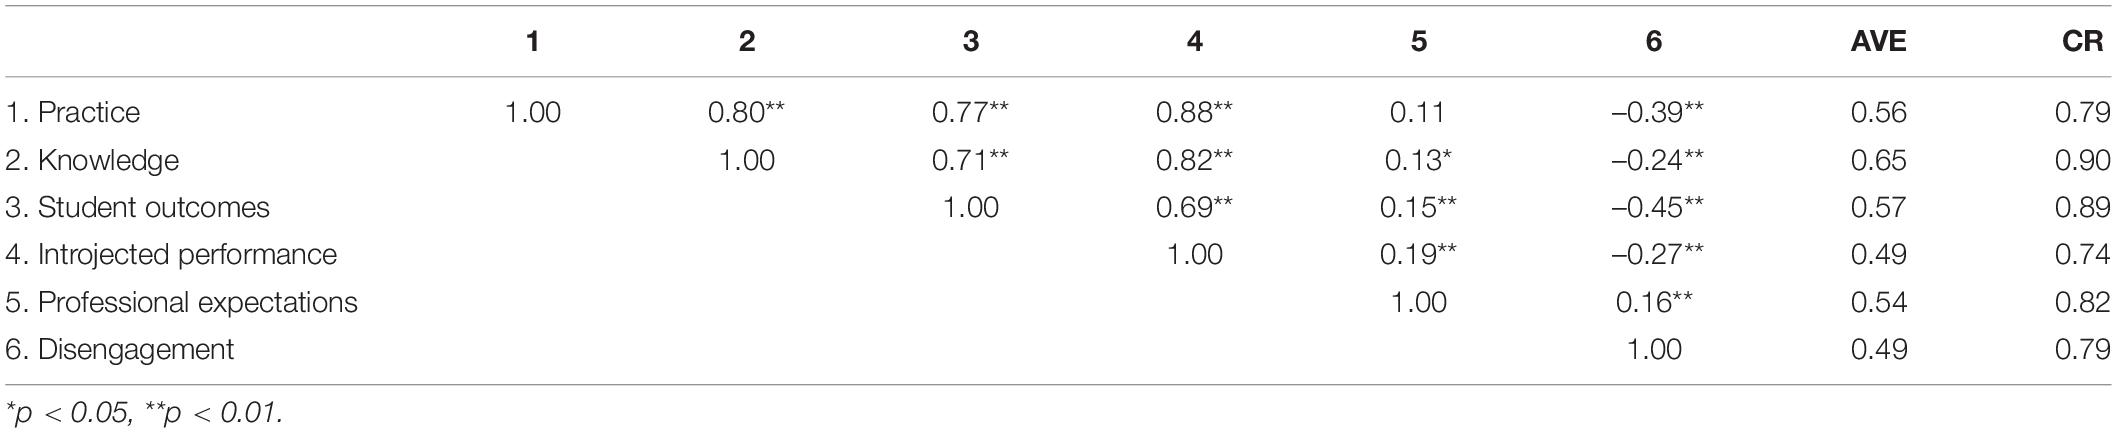
Table 5. Correlations between motivation factors, average variance extracted (AVE) and composite reliability (CR) for motivation factors (N = 318).
Table 6 presents the results of Pearson’s correlations conducted to explore the relationships between the confidence and motivation factors. These results indicated that only implementation and Professional Expectations were not significantly related. The majority of correlations were between 0.4 and 0.62. Disengagement was negatively related to both the confidence subscales.
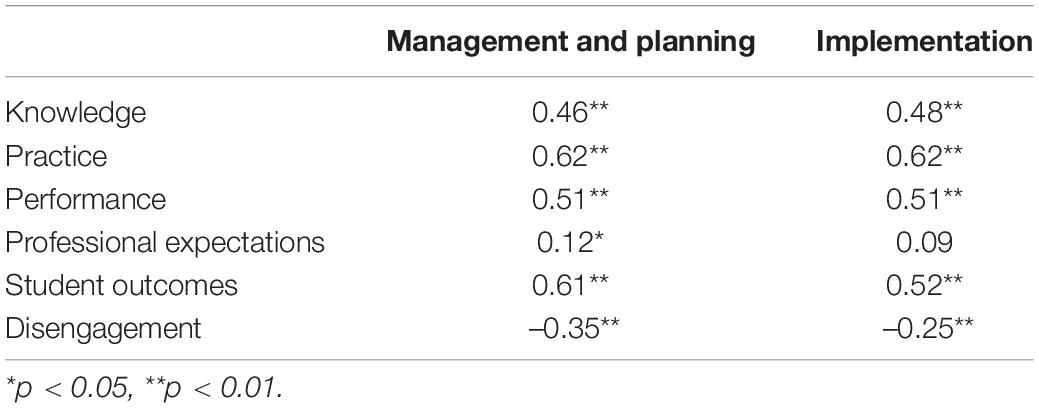
Table 6. Pearson’s correlations between confidence and motivation factors correlations between motivation factors (N = 318).
The aims for this research were the development and psychometric evaluation of a multi-dimensional measure of confidence and motivation to teach primary physical education. The results of the two phases provide preliminary support for the validity and reliability of the CMTPPEQ. The confidence section of the questionnaire comprises a two-factor structure representing Management and Planning (content knowledge - common roles or duties that a teacher would be expected to perform when teaching physical education, e.g., planning a physical education program, establishing learning goals, communicating student achievements, maintaining records and self-evaluating learning activities) and Implementation (teaching practice—delivering content specific to physical education, e.g., teaching motor skills, dance, team games and sports, athletics, and fitness. The six subscales of the motivation section of the questionnaire comprised different types of motivation along the SDT continuum form intrinsic motivation: Practice (experiencing stimulating sensations of fun and excitement), Knowledge (pleasure and satisfaction of learning new things); extrinsic motivation: Student Outcomes (identified as worthwhile for students and integrated into behavior), Performance (governed by rewards and restrictions implemented by the individual), Professional Expectations (behavior is controlled by external sources); and amotivation: Disengagement (a lack of motivation toward teaching physical education).
Phase 1 constituted the development of the questionnaire and subsequent quantitative analysis of validity and reliability. EFA and reliability analysis techniques were used to determine factor structure and to examine the measure’s psychometric properties. The confidence section comprised a two-factor structure, and the motivation section, a five-factor structure. The confidence section displayed adequate internal consistency and all five factors of the motivation section had adequate internal consistency, however, only three out of the five displayed adequate temporal stability.
In Phase 2, CFA was utilized to verify the factor structure of the CMTPPEQ. Preliminary analysis of the confidence section suggested unacceptable levels of fit. The addition of a correlation between the error terms of two items improved the overall fit of the model. The model fit indices demonstrated that the χ2/d.f ratios, TLI and CFI achieved the recommended cut offs, and the NFI approached the criterion level, with the RMSEA also within an acceptable range. The confidence factors, Management and Planning, and Implementation, exhibited adequate internal consistency.
The motivation section required more substantial adjustments to the model than the confidence section. These modifications included: the removal of a number of items, splitting a factor into two, the addition and removal of several items at the factor level, and the correlation of error terms. The model fit indices indicted an acceptable fit based on the χ2/d.f. ratio < 3 and CFI > 0.90, however, other fit indices used to evaluate the model approached criterion levels but did not quite reach the recommended cut off values. The CFA produced six factors with all the factors demonstrating adequate internal consistency, and representative of different types of motivation comprising the self-determination continuum.
Only a limited number of psychometrically evaluated instruments specific to physical education have been available to assess confidence and motivation. The CMTPPEQ represents an instrument that has both conceptual integrity and psychometric merit and, therefore, should prove valuable. Although the confidence section did not achieve acceptable fit across all of the fit indices, based on logic, substantive changes do not appear to be warranted. From a statistical perspective, the individual factor loadings of all items ranged from 0.56 to 0.85, therefore achieving the criteria proposed by Hair et al. (2006) of item loadings being greater than 0.40. Furthermore, the internal consistency of each of these factors was demonstrated. The fit indices that did not meet their recommended cut off values were GFI, AGFI, and NFI. All of these indices are reported as being sensitive to sample size and their use as independent indices to evaluate a model is cautioned (Hooper et al., 2008). Some authors have even suggested that GFI should not be used in the evaluation of a model because of this sensitivity to sample size and a range of problems associated with this (e.g., Sharma et al., 2005). Overall, achieving the recommended cut off values for all other indices supports the acceptable structural fit for the current model.
The two factors that resulted from the CFA of the confidence model were postulated to represent tasks pertaining to management and planning, and implementation. The loading of specific items onto these two factors was logical and representative of tasks a teacher would be required to complete. Items in management and planning relate to tasks involved in common teaching practice (e.g., planning lesson and units, understanding assessment, and establish learning goals) but are applied to the area of physical education. Items concerning implementation relate to the delivery of practical content areas of physical education (e.g., fitness skills, fundamental motor skills, and athletics). These two factors allow the confidence section to assess an individual’s feelings of capability toward management and planning tasks in the area of physical education and their feelings of confidence to implement and teach practical skills and activities in physical education. Both confidence factors are important as they provide a holistic perspective of teaching physical education representative of planning, managing, and implementing the content. Previous approaches have tended to either focus on the “management and planning” tasks associated with being a teacher (e.g., PETES; Humphries et al., 2012), without a focus on specific content knowledge across all areas, or they have focused on the delivery of the practical areas of physical education (e.g., gymnastics, athletics, and fitness) (Morgan and Bourke, 2005) without assessing confidence to complete any management or planning activities. A further strength of the confidence section is that it comprises 24 items, a sufficient number to promote factorial uniqueness and support simple administration and completion. Overall, the confidence section of the questionnaire appears to represent a multi-dimensional construct of confidence that is capable of measuring subject content knowledge in addition to key components of teaching practice, meaning that it is able to assess an individual’s judgments of confidence from a holistic view that encapsulates two major components of teaching physical education.
Similar to the confidence section, several fit indices for motivation did not reach recommended cut off values. The individual factor loadings of the items ranged from 0.60 to 0.88, meeting criteria of item loadings being greater than 0.40 (Hair et al., 2006), and indicating removal of items is not required. Like the confidence section GFI, AGFI, and NFI indices did not reach recommended cut off values. The TLI also did not reach its recommended cut off value. Sharma et al. (2005) describe TLI as one of the best performing indices as long as the size of the factor loadings is > 0.5 and the sample size is at least 200. They further proposed that sample size and the number of indicators can have a significant impact on indices, suggesting that in some cases more liberal cut offs are required. The TLI of 0.89 achieved in the motivation section of the questionnaire, which had 25 items and 318 participants, may actually be an acceptable cut off value for this index. The RMSEA for both confidence and motivation indicated an acceptable fit of < 0.08 (McDonald and Ho, 2002; Lai and Green, 2016), RMSEA is an important fit index as it takes into account the number of parameters in the hypothesis models (Hooper et al., 2008), but has problems with simpler models with few degrees of freedom (Kenny et al., 2015). All of the motivation factors demonstrated acceptable internal consistency. All of the motivation factors demonstrated acceptable internal consistency.
The final model for the motivation section contained six factors, which appear to represent different motivation states along the self-determination continuum. The motivation factors identified appear to represent different types of motivation along the SDT continuum ranging from more self-determined to less self-determined motives for teaching physical education. The motivation factors appear to be logically coherent when applied to teaching physical education comprising areas such as practice, knowledge, student outcomes, professional performance, professional expectations, and disengagement. Although the final model derived from the CFA is not an exact match of the continuum arrangement of the “traditional” configurations of SDT as proposed by Deci and Ryan (1985) it still appears to measure representative states of the continuum. There are some modifications that could be considered to improve the motivation section in relation to both factors and items. Currently, the motivation section consists of 25 items, unevenly distributed across the six factors. Possible modifications could include the reduction or addition of items on certain factors so there is an even distribution. Similar to the AMS (Vallerand et al., 1992) and SMS (Pelletier et al., 1995), the current questionnaire was based on having four items per factor; modifications could be made to replicate this structure, which would result in a 24 item section for motivation, and also match the 24 item design of the confidence section. Another option could be to reduce the number of items in each of the factors to three resulting in a total of 18 questions, which has been previously observed as a refinement procedure in the continuing development of the SMS-II (Pelletier et al., 2013). A reduction in the number of items could potentially make the CMTPPEQ more manageable for individuals to complete. A process of modifications and refinement similar to those implemented with the SMS (Pelletier et al., 2013) could be explored for the motivation section of the questionnaire.
A major aspect in maintaining and improving the quality of any psychological measure is an ongoing process of refinement and re-evaluation (Humphries et al., 2012). As the CMTPPEQ is in the early stages of development, continued investigation of the factor structure, reliability, and validity of the measure will be beneficial. Predictive validity was not evaluated and could be beneficial to investigate (Field, 2018). A measure of confidence and motivation to teach physical education should be predictive of behaviors associated with teaching physical education, such as whether a teacher plans to teach physical education, how many physical education lessons a generalist teacher delivers, and the type of physical education activities they teach. We conducted testing for reliability and validity based on classic test theory, future research with the measure may adopt item response theory to provide some additional information on the psychometric properties of the scale, such as item difficulty and item discrimination (e.g., Crocker and Algina, 1986; Ye et al., 2018). In preparation for using the measure in intervention studies aimed at improving confidence and motivation of primary teachers, future research could assess the state-like or trait like characteristics of the measure to determine whether it can assess change in confidence and motivation (e.g., Hamaker et al., 2007; Ye et al., 2020). As in research in clinical areas (e.g., Revicki et al., 2008; Zeng et al., 2020), it may be beneficial in future research to explore the minimum clinical important difference of the measure to support its use in intervention studies.
Results from the questionnaire will provide researchers with an understanding of an individual’s confidence and motivation toward teaching physical education. For in-service teachers, information could be used to provide professional development opportunities for teachers in particular areas, or identify areas or tasks of physical education in which a teacher may require extra support.
The general recommendation is that the questionnaire can be used to measure confidence and motivation of teachers to teach primary school physical education. It is possible to administer sections of this questionnaire separately as each has been developed as separate models. The confidence section could be used independently to examine confidence in teaching primary physical education or the motivation section could be used to assess motivation toward teaching primary physical education. It is, however, desirable to measure both confidence and motivation where researchers are interested in choices and behaviors related to teaching primary physical education.
The use of questionnaire data collected from volunteer participants may mean that the responses received are not generalizable to all individuals involved in the delivery of primary school physical education. Self-report data is potentially subject to the participants providing socially desirable responses (Paulhus, 1991) and common method variance (Podsakoff et al., 2003). The sample of participants is a potential limitation. The sample size for CFA was based on the recommendations of the literature and access to available participants and for both studies was indicated by KMO as adequate (Field, 2018). The literature, however, contains a variety of recommendations regarding appropriate sample sizes (Mundfrom et al., 2005). For example, while larger samples generally are better (Velicer et al., 1982; Kline, 1994), some have recommended a minimum sample size of 100 (e.g., Kline, 1994), and others have indicated ranges such as 50 is very poor, 100 is poor, 200 is fair, 300 is good, 500 is very good, and 1,000 is excellent (Comrey and Lee, 1992). The sample sizes in the current studies were 161 and 318, which is at the smaller size for factor analysis. In Phase 1 the sample consisted of only pre-service teachers from the one university. In Phase 2 this limitation was addressed with both in-service and pre-service and specialists and non-specialist teachers. Despite a wider range of participants, the sample was still unevenly distributed between specialist and non-specialist teachers. The sample has also only come from the one state in Australia making which may limit the generalizability of the results. Another potential limitation is the use of structural equation modeling techniques; specifically CFA. Models can be developed that are found to have a good fit, however, there is no guarantee that that model is the only or best representation (Ham, 2005).
This research aimed to examine the development of a multi-dimensional measure of confidence and motivation to teach primary physical education. Phase 1 focused on the development of the measure through EFA and provided preliminary support for the psychometric properties of the CMTPPEQ. Phase 2 further refined the measure and verified the factor structure through CFA. The measure developed consisted of two confidence factors: confidence in Management and Planning and confidence in Implementation. The measure comprised six motivation factors: Knowledge, Practice, Performance, Professional Expectations, Student Outcomes, and Disengagement. Further to the acceptable reliability and validity results, the findings generally highlight that the measure would benefit from on-going development and psychometric evaluation. The CMTPPEQ represents a valuable source of information regarding the characteristics associated with confidence and motivation to teach primary physical education.
The original contributions presented in the study are included in the article/supplementary material, further inquiries can be directed to the corresponding author/s.
The studies involving human participants were reviewed and approved by the Victoria University Human Research Ethics Committee. The participants provided their written informed consent to participate in this study.
SS and AW contributed to the conception and design of the study and performed the statistical analysis. SS collected the data and wrote the first draft of the manuscript. AW and MS assisted with major revisions and contributions to sections of the manuscript. All authors contributed to the manuscript revisions, read and approved the submitted version.
The authors declare that the research was conducted in the absence of any commercial or financial relationships that could be construed as a potential conflict of interest.
All claims expressed in this article are solely those of the authors and do not necessarily represent those of their affiliated organizations, or those of the publisher, the editors and the reviewers. Any product that may be evaluated in this article, or claim that may be made by its manufacturer, is not guaranteed or endorsed by the publisher.
ACHPER (2010). Professional Standards For Graduate Teachers Of Physical Education: Primary Generalist Years Prep To 6. Available online at http://www.achper.vic.edu.au/documents/item/11 (accessed July, 2011).
AITSL. (2011). Australian Professional Standards For Teachers. Melbourne: Australian Institute for Teaching and School Leadership Limited.
Baumeister, R. F., and Vohs, K. D. (2007). Self-Regulation, ego depletion, and motivation. Soc. Pers. Psychol. Compass 1, 115–128. doi: 10.1111/j.1751-9004.2007.00001.x
Cale, L., Harris, J., and Chen, M. H. (2014). Monitoring health, activity and fitness in physical education: its current and future state of health. Sport Educ. Soc. 19, 376–397. doi: 10.1080/13573322.2012.681298
Comrey, A. L., and Lee, H. B. (1992). A first Course in Factor Analysis. Hillsdale, NJ: Lawrence Erlbaum Associates, Inc.
Costello, A. B., and Osborne, J. W. (2005). Best practices in exploratory factor analysis: four recommendations for getting the most from your analysis. Pract. Assess. Res. Eval. 10, 1–9. doi: 10.1080/00224499.2015.1137538
Crocker, L., and Algina, J. (1986). Introduction to Classical and Modern Test Theory. Orlando, FL: Holt, Rinehart and Winston.
Deci, E. L., and Ryan, R. M. (1985). Intrinsic Motivation and Self-Determination in Human Behavior. New York: NY: Springer.
Deci, E. L., and Ryan, R. M. (2000). The “what” and “why” of goal pursuits. human needs and the self-determination perspective. Psychol. Inq. 11, 227–268. doi: 10.1080/02640414.2016.1159714
Duda, J. L., and Treasure, D. C. (2020). “The motivational climate, motivation, and implications for empowering athletes and the promotion of the quality of sport,” in proccedings of the Applied sport psychology: Personal Growth to Peak Performance, 8th Edn, eds J. M. Williams and V. Krane (New York: NY: McGraw-Hill).
Fairchild, A. J., Horst, S. J., Finney, S. J., and Barron, K. E. (2005). Evaluating existing and new validity evidence for the academic motivation scale. Contemp. Educ. Psychol. 30, 331–358. doi: 10.1371/journal.pone.0198888
Feltz, D. L., and Öncü, E. (2014). “Self-confidence and self-efficacy,” in Proceedings of the Fundamental Concepts in Sport and Exercise Psychology, eds A. Papaioannou and D. Hackfort (Milton Park: Taylor & Francis), 417–429.
Fornell, C., and Larcker, D. F. (1981). Evaluating structural equation models with unobservable variables and measurement error. J. Mark. Res. 18, 39–50. doi: 10.2307/3151312
Freak, A., and Miller, J. (2017). Magnifying pre-service generalist teachers’ perceptions of preparedness to teach primary school physical education. Phys. Educ. Sport Pedagogy 22, 1–20. doi: 10.1080/17408989.2015.1112775
Gredler, M. E., Brousard, S. C., and Garrison, M. E. B. (2004). The relationship between classroom motivation and academic achievement in elementary school-aged children. Fam. Consum. Sci. Res. J. 33, 106–120. doi: 10.1177/1077727x04269573
Guay, F., Morin, A. J., Litalien, D., Valois, P., and Vallerand, R. J. (2015). Application of exploratory structural equation modeling to evaluate the academic motivation scale. J. Exp. Educ. 83, 51–82. doi: 10.4103/jehp.jehp_1553_20
Hair, J. F., Black, W. C., Babin, B. J., Anderson, R. E., and Tatham, R. L. (2006). Multivariate Data Analysis, 6th Edn. Hoboken NJ: Pearson Prentice Hall.
Hair, J. F., Black, W. C., Babin, B. J., and Anderson, R. E. (2010). Multivariate Data Analysis, 7th Edn. Hoboken NJ: Prentice-Hall.
Hair, J., Hult, T., Ringle, C., and Sarstedt, M. (2014). A Primer on Partial Least Squares Structural Equation Modeling (PLS-SEM). Thousand Oaks, CA: Sage.
Ham, D. R. (2005). Parents and Adolescent Depression: Evaluation of a Model and an Intervention Program for Parents (Unpublished doctoral dissertation). Brisbane, AU: Griffith University.
Hamaker, E. L., Nesselroade, J. R., and Molenaar, P. C. (2007). The integrated trait-state model. J. Res. Pers. 41, 295–315. doi: 10.1016/j.jrp.2006.04.003
Hein, V., Ries, F., Pires, F., Caune, A., Ekler, J. H., Emeljanovas, A., et al. (2012). The relationship between teaching styles and motivation to teach among physical education teachers. J. Sports Sci. Med. 11, 123–130.
Hooper, D., Coughlan, J., and Mullen, M. (2008). Structural equation modelling: guidelines for determining model fit. Electron. J. Bus. Res. Methods 6, 53–60.
Humphries, C. A., Hebert, E., Daigle, K., and Martin, J. (2012). Development of a physical education teaching efficacy scale. Meas. Phys. Educ. Exerc. Sci. 16, 284–299. doi: 10.1080/1091367x.2012.716726
Jimenez-Silva, M., Olson, K., and Jimenez Hernandez, N. (2012). The confidence to teach English language learners: exploring coursework’s role in developing pre-service teachers’ efficacy. Teach. Educ. 47, 9–28. doi: 10.1080/08878730.2011.632471
Jones, L., and Green, K. (2017). Who teaches primary physical education? change and transformation through the eyes of subject leaders. Sport Educ. Soc. 22, 759–771. doi: 10.1080/13573322.2015.1061987
Kaiser, H. F. (1958). The varimax criterion for analytic rotation in factor analysis. Psychometrika 23, 187–200. doi: 10.1007/bf02289233
Kaplan, A. (2014). “Section commentary: theory and research on teachers’ motivation: mapping an emerging conceptual terrain,” in Proceedings of the Teacher Motivation: Theory and practice, eds P. W. Richardson, S. A. Karabenick, and H. M. G. Watt (New York: NY: Routledge), 3–19.
Kenny, D. A., Kaniskan, B., and McCoach, D. B. (2015). The performance of RMSEA in models with small degrees of freedom. Sociol. Methods Res. 44, 486–507. doi: 10.1177/0049124114543236
Kirk, D. (2005). Physical education, youth sport and lifelong participation: the importance of early learning experiences. Eur. Phys. Educ. Rev. 11, 239–255. doi: 10.1177/1356336x05056649
Lai, K., and Green, S. B. (2016). The Problem with having two watches: assessment of fit when RMSEA and CFI disagree. Multivar. Behav. Res. 51, 220–239. doi: 10.1080/00273171.2015.1134306
Lloyd, M., Saunders, T. J., Bremer, E., and Tremblay, M. S. (2014). Long-term importance of fundamental motor skills: a 20-year follow-up study. Adapt. Phys. Activ. Quarterly 31, 67–78. doi: 10.1123/apaq:2013-0048
Lopes, V. P., Stodden, D. F., and Rodrigues, L. P. (2017). Effectiveness of physical education to promote motor competence in primary school children. Phys. Educ. Sport Pedagogy 22, 589–602. doi: 10.1080/17408989.2017.1341474
Lynch, T., Soukup Sr, G. J., and Lin, M. D. P. (2017). Primary physical education (PE): school leader perceptions about classroom teacher quality implementation. Cogent Educ. 4, 2–32. doi: 10.1080/2331186X.2017.1348925
Manninen, M., and Yli-Piipari, S. (2021). Ten practical strategies to motivate students in physical education: Psychological need-support approach. Strategies 34, 24–30. doi: 10.1080/08924562.2020.1867270
Marsh, H. W. (1998). “Foreword,” in Proceedings of the Advances in Sport and Exercise Psychology Measurement (pp. before xvi – xix), ed. J. L. Duda (Morgantown, WV: Fitness Information Technology).
McDonald, R. P., and Ho, M. H. R. (2002). Principles and practice in reporting structural equation analyses. Psychol. Methods 7, 64–82. doi: 10.1037/1082-989x.7.1.64
Miller, D. K. (2020). Measurement by the Physical Educator: Why and How, 8th Edn. New York: NY: McGraw-Hill.
Morgan, P. (2005). Primary school physical education: far from realising its potential. Every Child. 11, 20–21.
Morgan, P., and Bourke, S. F. (2005). An investigation of pre-service and primary school teachers’ perspectives of PE teaching confidence and PE teacher education. Achper Healthy Lifestyles J. 52, 7–13.
Morgan, P., and Bourke, S. (2008). Non-specialist teachers’ confidence to teach PE: the nature and influence of personal school experiences in PE. Phys. Educ. Sport Pedagogy 13, 1–29. doi: 10.1080/17408980701345550
Morgan, P., and Hansen, V. (2007). Recommendations to improve primary school physical education: Classroom teachers’ perspective. J. Educ. Res. 101, 99–108. doi: 10.1111/cch.12555
Morgan, P. J., and Hansen, V. (2008). The relationship between PE biographies and PE teaching practices of classroom teachers. Sport Educ. Soc. 13, 373–391. doi: 10.1080/13573320802444994
Morgan, P. J., Barnett, L. M., Cliff, D. P., Okely, A. D., Scott, H. A., Cohen, K. E., et al. (2013). Fundamental movement skill interventions in youth: a systematic review and meta-analysis. Pediatrics 132, e1361–e1383. doi: 10.1542/peds.2013-1167
Mundfrom, D. J., Shaw, D. G., and Ke, T. L. (2005). Minimum sample size recommendations for conducting factor analyses. Int. J. Test. 5, 159–168. doi: 10.1207/s15327574ijt0502_4
Paulhus, D. L. (1991). “Measurement and control of response bias,” in Proceedings of the Measures of Personality and Social Psychological Attitudes, eds J. P. Robinson, P. R. Shaver, and L. S. Wrightsman (San Diego, CA: Academic Press), 17–59. doi: 10.1016/b978-0-12-590241-0.50006-x
Pelletier, L. G., Fortier, M. S., Vallerand, R. J., Tuson, K. M., Briere, N. M., and Blais, M. R. (1995). Toward a new measure of intrinsic motivation, extrinsic motivation, and amotivation in sports: the sport motivation scale (SMS). J. Sport Exerc. Psychol. 17, 35–35. doi: 10.1123/jsep.17.1.35
Pelletier, L. G., Rocchi, M. A., Vallerand, R. J., Deci, E. L., and Ryan, R. M. (2013). Validation of the revised sport motivation scale (SMS-II). Psychol. Sport Exerc. 14, 329–341. doi: 10.1016/j.psychsport.2012.12.002
Podsakoff, P. M., MacKenzie, S. B., Lee, J.-Y., and Podsakoff, N. P. (2003). Common method biases in behavioral research: a critical review of the literature and recommended remedies. J. Appl. Psychol. 88, 879–903. doi: 10.1037/0021-9010.88.5.879
Randall, V., and Fleet, M. (2021). Constructing knowledge in primary physical education: a critical perspective from pre-service teachers. Curric. Stud. Health Phys. Educ. 12, 20–35. doi: 10.1080/25742981.2020.1866439
Randall, V., and Griggs, G. (2021). Physical education from the sidelines: pre-service teachers opportunities to teach in english primary schools. Education 49, 495–508. doi: 10.1080/03004279.2020.1736598
Revicki, D., Hays, R. D., Cella, D., and Sloan, J. (2008). Recommended methods for determining responsiveness and minimally important differences for patient-reported outcomes. J. Clin. Epidemiol. 61, 102–109. doi: 10.1016/j.jclinepi.2007.03.012
Roth, G. (2014). “Antecedents and outcomes of teachers’ autonomous motivation: a self-determination theory analysis,” in Proceedings of the Teacher Motivation: Theory and Practice, eds P. W. Richardson, H. M. G. Watt, and S. A. Karabenick (New York:NY: Routledge), 3–19. doi: 10.3389/fpsyg.2020.01808
Ryan, R. M., and Deci, E. L. (2000a). Intrinsic and extrinsic motivations: classic definitions and new directions. Contemp. Educ. Psychol. 25, 54–67. doi: 10.1006/ceps.1999.1020
Ryan, R. M., and Deci, E. L. (2000b). Self-determination theory and the facilitation of intrinsic motivation, social development, and well-being. Am. Psychol. 55, 68–78. doi: 10.1037//0003-066x.55.1.68
Ryan, R. M., and Deci, E. L. (2017). Self-Determination Theory: Basic Psychological Needs in Motivation, Development, and Wellness. New York: NY: Guilford Press.
Sharma, S., Mukherjee, S., Kumar, A., and Dillon, W. R. (2005). A simulation study to investigate the use of cutoff values for assessing model fit in covariance structure models. J. Bus. Res. 58, 935–943. doi: 10.1016/j.jbusres.2003.10.007
Spittle, M., Jackson, K., and Casey, M. (2009). Applying self-determination theory to understand the motivation for becoming a physical education teacher. Teach. Teach. Educ. 25, 190–197. doi: 10.1016/j.tate.2008.07.005
Spittle, S., and Spittle, M. (2014). The reasons and motivation for pre-service teachers choosing to specialise in primary physical education teacher education. Australian J. Teach. Educ. 39, 1–25. doi: 10.14221/ajte.2014v39n5.5
Vallerand, R. J. (1997). “Toward a hierarchical model of intrinsic and extrinsic motivation,” in Proceedings of the Advances in Experimental Social Psychology, ed. M. P. Zanna (New York: NY: Academic Press), 271–360. doi: 10.1016/s0065-2601(08)60019-2
Vallerand, R. J., Pelletier, L. G., Blais, M. R., Briere, N. M., Senecal, C., and Vallieres, E. F. (1992). The academic motivation scale: a measure of intrinsic, extrinsic, and amotivation in education. Educ. Psychol. Meas. 52, 1003–1017. doi: 10.1177/0013164492052004025
Van den Berghe, L., Cardon, G., Aelterman, N., Tallir, I. B., Vansteenkiste, M., and Haerens, L. (2013). Emotional exhaustion and motivation in physical education teachers: a variable-centered and person-centered approach. J. Teach. Phys. Educ. 32, 305–320. doi: 10.1123/jtpe.32.3.305
VCAA. (2012). Ausvels Standards and Progression Points: Health and Physical Education. Melbourne, AU: Victorian Curriculum and Assessment Authority.
Velicer, W. F., Peacock, A. C., and Jackson, D. N. (1982). A comparison of component and factor pattern: a monte carlo approach. Multivar. Behav. Res. 17, 371–388. doi: 10.1207/s15327906mbr1703_5
VIT. (2010). Australian Professional Standards for Teachers. Vellore: Victorian Institute of Teacher Education.
Ye, Z. J., Liang, M. Z., Zhang, H. W., Li, P. F., Ouyang, X. R., Yu, Y. L., et al. (2018). Psychometric properties of the Chinese version of resilience scale specific to cancer: an item response theory analysis. Qual. Life Res. 27, 1635–1645. doi: 10.1007/s11136-018-1835-2
Ye, Z. J., Zhang, Z., Zhang, X. Y., Tang, Y., Chen, P., Liang, M. Z., et al. (2020). State or trait? Eur. J. Oncol. Nurs. 46, 1–8. doi: 10.1016/j.ejon.2020.101727
Keywords: physical education, confidence, motivation, teacher, self-determination
Citation: Spittle S, Watt AP and Spittle M (2022) Development and Initial Validation of the Confidence and Motivation to Teach Primary Physical Education Questionnaire. Front. Educ. 7:840629. doi: 10.3389/feduc.2022.840629
Received: 21 December 2021; Accepted: 05 April 2022;
Published: 03 May 2022.
Edited by:
Sai-fu Fung, City University of Hong Kong, Hong Kong SAR, ChinaReviewed by:
Vanessa Scherman, University of South Africa, South AfricaCopyright © 2022 Spittle, Watt and Spittle. This is an open-access article distributed under the terms of the Creative Commons Attribution License (CC BY). The use, distribution or reproduction in other forums is permitted, provided the original author(s) and the copyright owner(s) are credited and that the original publication in this journal is cited, in accordance with accepted academic practice. No use, distribution or reproduction is permitted which does not comply with these terms.
*Correspondence: Sharna Spittle, c2hhcm5hLnNwaXR0bGVAdnUuZWR1LmF1
Disclaimer: All claims expressed in this article are solely those of the authors and do not necessarily represent those of their affiliated organizations, or those of the publisher, the editors and the reviewers. Any product that may be evaluated in this article or claim that may be made by its manufacturer is not guaranteed or endorsed by the publisher.
Research integrity at Frontiers
Learn more about the work of our research integrity team to safeguard the quality of each article we publish.