 Yaacov Petscher
 Kelli D. Cummings
 Michael O. Killian
 Makenna Woods1
95% of researchers rate our articles as excellent or good
Learn more about the work of our research integrity team to safeguard the quality of each article we publish.
Find out more
ORIGINAL RESEARCH article
Front. Educ. , 13 May 2022
Sec. Assessment, Testing and Applied Measurement
Volume 7 - 2022 | https://doi.org/10.3389/feduc.2022.733851
The literature reports mixed findings on whether measuring individual change over time on an interim progress monitoring assessment adds value to understanding student differences in future performance on an assessment. This study examines the relations among descriptive measures of growth (simple difference and average difference) and inferential measures [ordinary least squares (OLS) and empirical Bayes] for 800,000 students in grades 4, 8, and 10 and considers how well such measures statistically explain differences in end-of-year reading comprehension after controlling for student performance on a mid-year status assessment. Student differences in their reading comprehension performance were explained by the four growth estimates (simple difference, average difference, OLS, and empirical Bayes) and differed by status variable used (i.e., performance on the fall, winter, or spring benchmark assessment). The four growth estimates examined in the study all contributed significantly to predicting end-of-year reading comprehension when initial, fall performance was used as a covariate. The simple difference growth estimate was the best predictor when controlling for mid-year (winter) status, and all but the simple difference estimate contributed significantly when controlling for final (spring) status.
Close monitoring of students’ progress to identify students whose progress in reading assessment performance is not sufficiently matched to an identified performance target, and thus may need additional intervention, is an essential element of response to intervention/instruction systems and to accountability systems more broadly (Fuchs and Fuchs, 1998; Fuchs et al., 2003, 2004; McMaster et al., 2005; Compton et al., 2006; Schatschneider et al., 2008). When an interim assessment is administered multiple times within an academic year, data from a sample of individuals are typically used to evaluate changes in performance over time. Estimations of individual growth or change can be used to test if a student is growing or not growing, as well as if they is growing fast or slow relative to another individual in the sample. In addition to using the individual growth rate to evaluate change, it is possible to find students whose score at the first assessment period and growth trends differ from the sample mean.
Empirical work within the framework of response to intervention has tested whether individual growth from interim assessments in a particular population statistically explained sample differences in selected outcome performances beyond what could be predicted by performance at a single point in time (i.e., initial, middle, and final performance; Schatschneider et al., 2008; Kim et al., 2010; Yeo et al., 2012; Zumeta et al., 2012). Yeo et al. (2012) used latent parallel process growth models to test how well intercepts and individual growth estimates from curriculum-based measures of reading fluency and Maze (i.e., a multiple-choice cloze task) explained sample differences on the Tennessee Comprehensive Assessment Program (TCAP). They found that individual growth curves from the structural portion of the model did not statistically explain TCAP differences beyond the first assessment. Zumeta et al. (2012) used non-linear individual growth curve analysis and multiple regression to evaluate the correlations between growth in word identification fluency and its relation to several outcome measures, including the Woodcock Reading Mastery Test-Revised (Woodcock, 1998), and both sight word and decoding portions of the Test of Word Reading Efficiency (Torgesen et al., 1999). Weak to moderate correlations between the measures of growth and the selected outcomes were observed. Yeo et al. (2012) and Zumeta et al. (2012) used different samples and different measures of reading skills and as such, their conflicting findings cannot be compared. However, two other studies using the same measures with approximately the same sample also yielded conflicting findings (Schatschneider et al., 2008; Kim et al., 2010).
Kim et al. (2010) used a combination of growth curve modeling and dominance analysis to test whether growth in oral reading fluency as measured by the DIBELS assessment (Good and Kaminski, 2002) explained why student scores varied on the Stanford Achievement Test, 10th edition (SAT-10; Harcourt Brace, 2003) for a cohort of students followed from grades 1 through 3. The study results reported that about 15% of the growth occurred during grade 1, 15% during grade 2, and 6% during grade 3. Individual growth in oral reading fluency during grade 2 explained 7% of the variance in SAT-10 scores at the end of the school year but did not explain grade 3 sample differences in SAT-10 performance when other variables were controlled. Finally, growth in oral reading fluency during grade 3 accounted for approximately 6% of sample differences in grade 3 SAT-10 performance. In a similar study using DIBELS as a measure of growth in oral reading fluency, Schatschneider et al. (2008) used a combination of linear analysis of individual growth curves and multiple regression to predict grade 1 performance on the SAT-10. They found that growth in oral reading fluency did not explain variation in student performance on the SAT-10 after controlling for initial status. Although form effects are often an issue when oral reading fluency is used as a measure of growth (for example, Francis et al., 2008; Petscher and Kim, 2011), Schatschneider et al. (2008) and Kim et al. (2010) used approximately the same sample and oral reading fluency probes, so the sharp contrast in their conclusions needs to be explained.
All these studies show how growth in interim progress monitoring measures might expand the understanding of why students vary in their performance on selected outcomes. Although each study had specific limitations related to study design and sampling, three methodological differences across the studies are especially worth noting: the status variable used as a covariate in predicting the outcome, the type of growth estimate used to predict the outcome, and the achievement level of the sample.
The predictive studies by Kim et al. (2010), Yeo et al. (2012), and Zumeta et al. (2012) used the first assessment point (student performance in the fall) as the status variable. Schatschneider et al. (2008) used the final assessment point (spring). All the studies addressed the broad question of how well individual growth curves explain differences in selected outcomes beyond that of a status variable. Schatschneider et al. (2008) framed the research questions around how individual growth curves uniquely predicted outcomes beyond predictions based on end-of-year status, while the other three studies looked at using individual growth curves to explain differences in outcome performance beyond the contributions based on beginning-of-year status. The choice of the first or the last assessment point affects the understanding of how individual growth curves can account for individual differences in an outcome, controlling for the fall or spring status. The use of different status covariates in these studies means that the results are not directly comparable.
An ancillary consideration is that none of these predictive models used the mid-year assessment as a status variable. The mid-year has appealed both instructionally and practically. Instructionally, it marks the first time that a learning gain within the same school year can be evaluated. Knowing the unique contribution of gains from the fall to the mid-year for predicting outcomes at the end of the school year could enable teachers to modify or differentiate instruction accordingly. From a practical perspective, using mid-year status makes more sense than using beginning-of-year status, when no growth has yet taken place, or end-of-year status, when teachers can no longer adapt instruction to individual differences in gains over the year.
All the studies but Yeo et al. (2012) used individual growth curves estimated with ordinary least squares (OLS) regression to predict the selected outcomes; Yeo et al. (2012) used latent growth curves with a maximum-likelihood estimator. None of the studies used an empirical Bayes slope (model-based estimate of individual growth curves), often considered a best practice for estimating individual growth (Singer and Willett, 2003) because it combines OLS estimates with the grand mean (i.e., population mean). The empirical Bayes slope shrinks an OLS estimate toward the grand mean by a factor proportional to its individual unreliability; thus, individual OLS growth values at the tails of the slope distribution get pulled much closer to the grand mean because they are typically less reliable—and therefore less likely to reflect the true slope. Although the empirical Bayes estimate yields a more reliable slope, it often comes at a cost: biased estimates (Singer and Willett, 2003).
A final methodological consideration concerns the nature of the sample. Yeo et al. (2012), noting that the lack of predictive validity of individual growth curves might have been related to their sample not consisting predominantly of students at high risk of low performance, conjectured that individual growth curves might be more predictive for these students. Zumeta et al. (2012) found that growth on the word identification fluency task was more strongly associated with outcomes for the low-performing subsample than for the average and high-performing subsamples. Because frequent progress monitoring often focuses on students with the highest risk of low performance, the types of regression models typically used to evaluate differential predictive validity might fail to adequately capture how well individual growth curves explain student differences in FCAT performance for individuals at the low end of the achievement distribution for the dependent variable.
The growing reliance on interim progress monitoring assessments in both response to intervention and broader accountability systems such as those mandated by state and national policy elevates the importance of studying the extent to which individual growth curves uniquely explain variance in selected outcomes (e.g., state accountability measures) beyond what can be accounted for by the status variable alone. The literature has produced mixed findings, with some studies suggesting that growth in reading statistically explains such differences (Kim et al., 2010) but others finding it did not (Schatschneider et al., 2008; Yeo et al., 2012).
Differences in the type of slope used in the study (OLS or maximum likelihood) and in the status variable used as a covariate (fall or spring assessment) have been proposed as the reason for the conflicting results. Thus, two immediate goals of this study were to evaluate the extent to which different approaches to estimating individual growth curves differentially predict an outcome beyond what is predicted using a single status variable (for example, results of the fall interim assessment), as well as the extent to which the statistical significance of the individual growth curve might vary when the status variable changes (for example, from fall to spring). In addition, the study sought to expand the research base by testing the extent to which individual growth curves predict performance beyond what is predicted by a mid-year (winter) status variable and by studying what the unique relations might look like in understudied populations (for example, students in secondary grades).
K–3 students have been the population of interest in many responses to intervention studies, with less focus on secondary school students (e.g., Espin et al., 2010; Barth et al., 2012). The National Center on Response to Intervention noted that most states use response to intervention as a prevention/intervention model, while fewer use it for identifying students with learning disabilities. Research has found secondary school students to be responsive to targeted, intensive literacy interventions (Calhoon, 2005; Edmonds et al., 2009; Calhoon and Petscher, 2013). That makes it important to characterize the extent to which growth in measures of reading comprehension uniquely predict outcomes for both secondary and primary school students. That is especially relevant considering studies (like Silberglitt and Hintze, 2007) that find differences in expected growth rates as grade level rises, with average growth slowing from grade 2 to grade 6 on interim progress monitoring assessments (administered three times a year).
In a typical response to intervention framework, progress monitoring assessments are administered once or twice a week. Considering the practical obstacles of scheduling weekly or more frequent assessments, recent research has examined the viability of shifting to fewer assessments (Jenkins et al., 2009). Ardoin et al. (2013) used simulation to study the validity and reliability of growth estimates dependent on the schedule and duration of progress monitoring assessments, as well as the dataset quality. They found growth estimates from monthly assessments over a 17-week period to be sufficiently valid and reliable for low-stakes decisions when the dataset was of very high quality.
Shaped by the limitations of previous research and gaps in developmental research on progress monitoring, the following research questions for this applied research methods report consider student growth for grades 4, 8, and 10 in 2009/10. RQ1: What are the relations among descriptive measures of student change (simple difference and average difference) and inferential measures of individual growth curves (OLS and empirical Bayes)? RQ2: Controlling for students’ mid-year status, how well do the different measures of student change and individual growth curves explain sample differences in end-of-year reading comprehension performance? RQ3: How does controlling for students’ initial or final status affect how well the different measures of student change and individual growth curves explain sample differences in end-of-year reading comprehension performance?
Data for this study are from the Archive Data Core (ADC), a database at the Florida Center for Reading Research. The measures used are the results on the state achievement test, the Florida Comprehension Assessment Test (FCAT), and on the Florida Assessments for Instruction in Reading (FAIR), administered three times a year for progress monitoring. This section outlines the theoretical framework for the analyses, the sample, the measures used in the study, and methods used to analyze the data.
The study drew on archival data from the ADC on 1,132,263 students in grades 4, 8, and 10 for 2009/10. The ADC contains benchmark data in reading reported three times a year, as well as outcome data for the FCAT. A key consideration was that the findings reflect Florida’s student population. As such, it was important to compare the demographics and academic achievement of students in the ADC data with those of the student population in the state as a whole. An initial investigation revealed that the ADC sample did not precisely reflect the achievement distribution of all grade 4, 8, and 10 students in Florida. To correct for these differences, a stratified subsample was constructed to reflect the observed achievement distribution across the five FCAT proficiency levels (see section “Measures”) for children in these grades. State-aggregated data on the population distribution on the FCAT were used as known parameters for constructing the stratified random sample.
The FCAT reading is an end-of-year, group-administered, criterion-referenced test consisting of informational and narrative reading passages with multiple-choice questions (Florida Department of Education, 2005). Students receive a developmentally scaled score and a proficiency level score, with level 1 the lowest proficiency and level 5 the highest. Students meet grade-level standards if they score at level 3 or higher. The current study used FCAT developmental scale scores from the end of the 2009/10 school year. Reported internal consistency for the FCAT is high, at α = 0.90 (Florida Department of Education, 2005). Moreover, content and concurrent validity of test scores have been established through a series of expert panel reviews and data analyses (Florida Department of Education, 2001). The validity of the FCAT as a comprehensive assessment of reading outcomes received strong empirical support in an analysis of its correlations with a variety of other reading comprehension, language, and basic reading measures (Schatschneider et al., 2004).
The FAIR consists of interim reading assessments given three times each year in kindergarten through grade 10 (Florida Department of Education, 2009). In grades 4, 8, and 10 students take a computer-adaptive reading comprehension screen consisting of up to three passages with multiple-choice questions similar in format to those on the FCAT. Performance is reported as an ability score (a developmental scaled score that can track growth from grade 3 through 10). The current study used the FAIR ability scores from the fall, winter, and spring assessments for the 2009/10 school year.
Reported reliability for the ability scores from the reading comprehension screen is at least α = 0.90 for 60% of students and at least α = 0.80 for 98% of students (Florida Department of Education, 2009). Recent technical reporting on the FAIR showed strong correlations (r > 0.66) across assessment points (fall, winter, and spring administration) for the FAIR reading comprehension screen for students in grades 3–10 (Foorman and Petscher, 2010a). In addition, the screen has been shown to explain individual differences in FCAT reading performance beyond that predicted using prior-year performance on the FCAT (average ΔR2 = 3.7%; Foorman and Petscher, 2010b). Together, these reports indicate that performance on the FAIR can help explain individual student differences on the FCAT scores beyond those explained by data for the prior-year FCAT.
The amount of data missing in the stratified sample increased with grade level and decreased across FAIR assessment points within grade for all grades, ranging from 4.6% missing in the fall through 26.6% missing in the spring. Because all students are required to take the FCAT, missingness was not related to the outcome variable (end-of-year reading comprehension). Thus, the data were assumed to be missing at random. Little’s (1985) missing completely at random (MCAR) was assessed for all variables by grade, and in all instances, the null hypothesis (that data were MCAR) was rejected (p < 0.001).
As noted, a disadvantage of using OLS to estimate growth is that complete data are necessary for estimating parameters, whereas empirical Bayes can be used to estimate individual growth curves using full information maximum likelihood. To compare these measures of growth, therefore, it was necessary to evaluate both complete case and missing data conditions. All missing data were imputed using PROC MI in SAS. The pattern of results was the same regardless of whether the data used were the original scores or the imputed data. Cohen’s d for the difference between the original and imputed data ranged from −0.05 to 0.00 and averaged −0.02, −0.03, and −0.02 for fall, winter, and spring FAIR across grades 3–10. Results are available from the first author on request.
Four types of estimates for measuring student change range from descriptive, computationally simple measures of change (simple difference and average difference scores) to complex, inferential measures (OLS and empirical Bayes). The supplemental online materials detail the calculation and estimation differences among these measures of change. Each of the four growth metrics has conceptual or statistical properties that can influence a decision on how to estimate growth. One measure’s statistical merit might need to be weighed against its computational demands. For example, local or state education agency personnel might prefer the descriptive measures of growth (simple and average difference scores), because they allow teachers to estimate student change across the year by calculating simple scores. But a researcher interested in using individual growth curves for analysis might be drawn to an inferential measure that maximizes reliability (empirical Bayes) or provides an unbiased estimate of change (OLS). Researchers will typically opt for the more reliable estimate of growth, as minimizing error in measured variables is always desirable. Further, a score’s validity depends on the degree of error in the measure. Thus, differences in the predictive validity of the individual growth curves for each growth measure are important to consider.
To explore the relations among the four measures, each was used to calculate and estimate growth. For the two descriptive measures (simple difference and average difference) the observed measures of reading comprehension ability (fall, winter, and spring FAIR ability scores) were used. Calculating the simple difference score allows teachers to estimate how much change in reading performance relative to instruction has occurred and to compare student change. The simple difference score was calculated as the change occurring between the fall and winter assessments (the first estimate of change that can be calculated during the academic year using interim/benchmark assessments). The average difference score was computed as the difference between the fall and spring assessments divided by the number of change scores (two) during the year. The simple difference between winter and spring was not calculated because it would not be an actionable score for influencing instruction to meet an end-of-year benchmark for a state achievement test.
The two inferential measures of growth (OLS and empirical Bayes) were estimated using a multilevel growth model. Growth curve analyses were run for each grade, and the residual files were retained so that the OLS and empirical Bayes estimates could be used in the secondary multiple regression analysis. The individual growth curves were used to estimate the means and variances for each measure by grade and to evaluate the distribution of each measure. Simple bivariate correlations and scatterplots were used to examine the relations among growth measures.
A series of hierarchical multiple regression analyses were run for each grade level using the generated measures of growth. The baseline regression model included the intercept and the winter FAIR ability score. The resulting R2 conveyed how much of the individual variation in the FCAT was explained by the winter FAIR reading comprehension ability score. To estimate a total R2 based on both the winter FAIR and each growth measure, four additional models were run iteratively with each measure of growth entered as a second independent variable. The difference between the total R2 and each of the added-growth models was used to evaluate which measures of growth best explained differences in the FCAT at each grade level. Although there are methods for testing whether two R2 values are statistically differentiated (Alf and Graf, 1999), such analysis would not yield meaningful information with so large a sample. Instead, the difference in R2 values between estimators was compared using Cohen’s (1988) criteria: ΔR2 of 2–12% is considered a small, practically important effect; 13–25%, a moderate effect; and 26% or greater, a large effect. In each model, the model-adjusted R2 was equal to the model-estimated R2 due to the large samples at each grade level (n = 100,000) and the small number of predictors (two) in each model.
As with the previous research question, a series of hierarchical multiple regression analyses were run at each grade level, but for this question, the baseline regression model was changed. The regression models were run using the fall FAIR reading comprehension ability score rather than the winter score as the status variable before including each growth measure. A second set of regressions were then run using the spring FAIR score as the status variable.
From the full PMRN sample (1,132,263 students), a stratified random sample of 800,000 students (100,000 per grade) was created from Grades 4, 8, and 10. The achievement distribution for the stratified PMRN sample better matched the state population. The demographic characteristics of the stratified PMRN sample matched those of the state population as well: 51% male, 48% White, 24% Hispanic, 19% Black, 4% more than one race, 2% Asian, and less than 1% other (Supplementary Table 1). Approximately 7% of students were identified as English language learners, and 56% were eligible for free or reduced-price lunch, a proxy for low-income status.
During 2009/10 the FAIR reading comprehension ability scores across grades 4, 8, and 10 ranged from 200 to 800, and the FCAT developmental scale score ranged from 295 to 3,008 (Table 1). The average FAIR reading comprehension ability score rose from fall to spring for all students across grades. Reading comprehension performance remained fairly stable across the three assessment points of the Florida Assessments for Instruction in Reading, and correlations with the Florida Comprehensive Assessment Test were strong. The FAIR reading comprehension ability scores were moderately and positively correlated across the three assessment points, indicating that performance remained fairly stable within grades (Table 1). Correlations of the fall and winter FAIR with the FCAT were strong within and across grades as well (r = 0.70–0.75 across grades and time points). Moreover, the concurrent correlation between the spring FAIR and the FCAT ranged from r = 0.70 to 0.76 across grades.
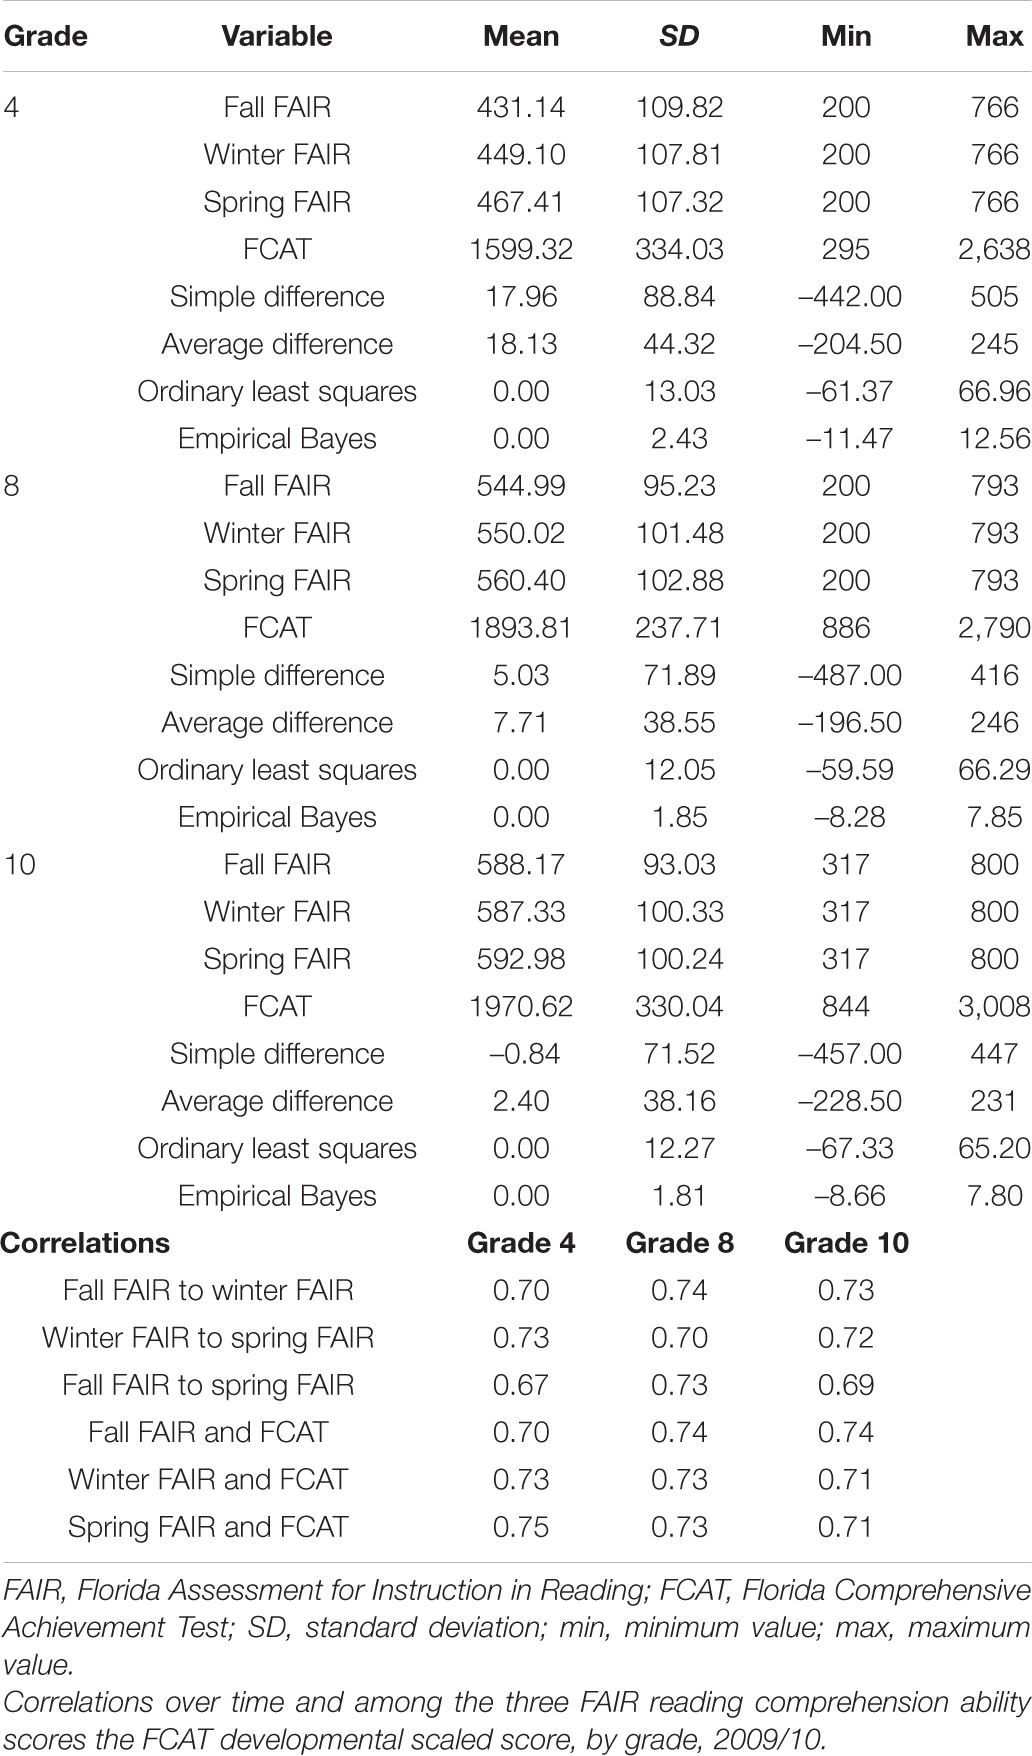
Table 1. Descriptive statistics by grade level and correlations among measures.
The simple difference score was calculated as the difference between the fall and winter FAIR reading comprehension ability scores, whereas the average difference score was calculated as the difference between the spring and fall scores divided by two. The two inferential measures of growth were the residuals from the multilevel model nesting time within student. Model diagnostics for the multilevel analysis included an evaluation of the residuals by time-point. All models indicated that the residuals at each time-point were centered on 0. Results are available from the corresponding author on request.
The OLS and empirical Bayes both had a mean of 0 across grades, but their standard deviations differed (Table 1). Across grades 4, 8, and 10, standard deviations ranged from 12.05 to 13.03 for OLS-based individual growth curves and from 1.81 to 2.43 for empirical Bayes–based individual growth curves (see Table 1). This difference was not surprising considering the shrinkage in growth when estimated using empirical Bayes (the individual slope is weighted by the average of the sample). Change-based means on the descriptive measures revealed that the average difference score ranged from a between-assessment gain of 2.40 points in grade 10–18.13 points in grade 4. The pattern of average change across grades was fairly systematic: the largest gains were made by students in the lowest grades (Table 1). A similar pattern was observed for the simple difference score. The mean change across grades ranged from −0.84 points in grade 10–17.96 points in grade 4. A negative average score may appear counterintuitive considering that a developmentally scaled score should produce average increases over time. Indeed, comparing the observed means in Table 1 (588.17 in the fall and 587.33 in the winter) shows that the decrease from fall to winter was negligible (Cohen’s d = 0.009).
To better understand the relations among the four slope scores, as well as their bivariate correlations with the FCAT, Figure 1 depicts a matrix scatterplot that includes Pearson correlations (upper diagonal), histograms (diagonal), and scatterplots (lower diagonal). The histograms for all variables within grade show that the scores follow a fairly normal distribution.
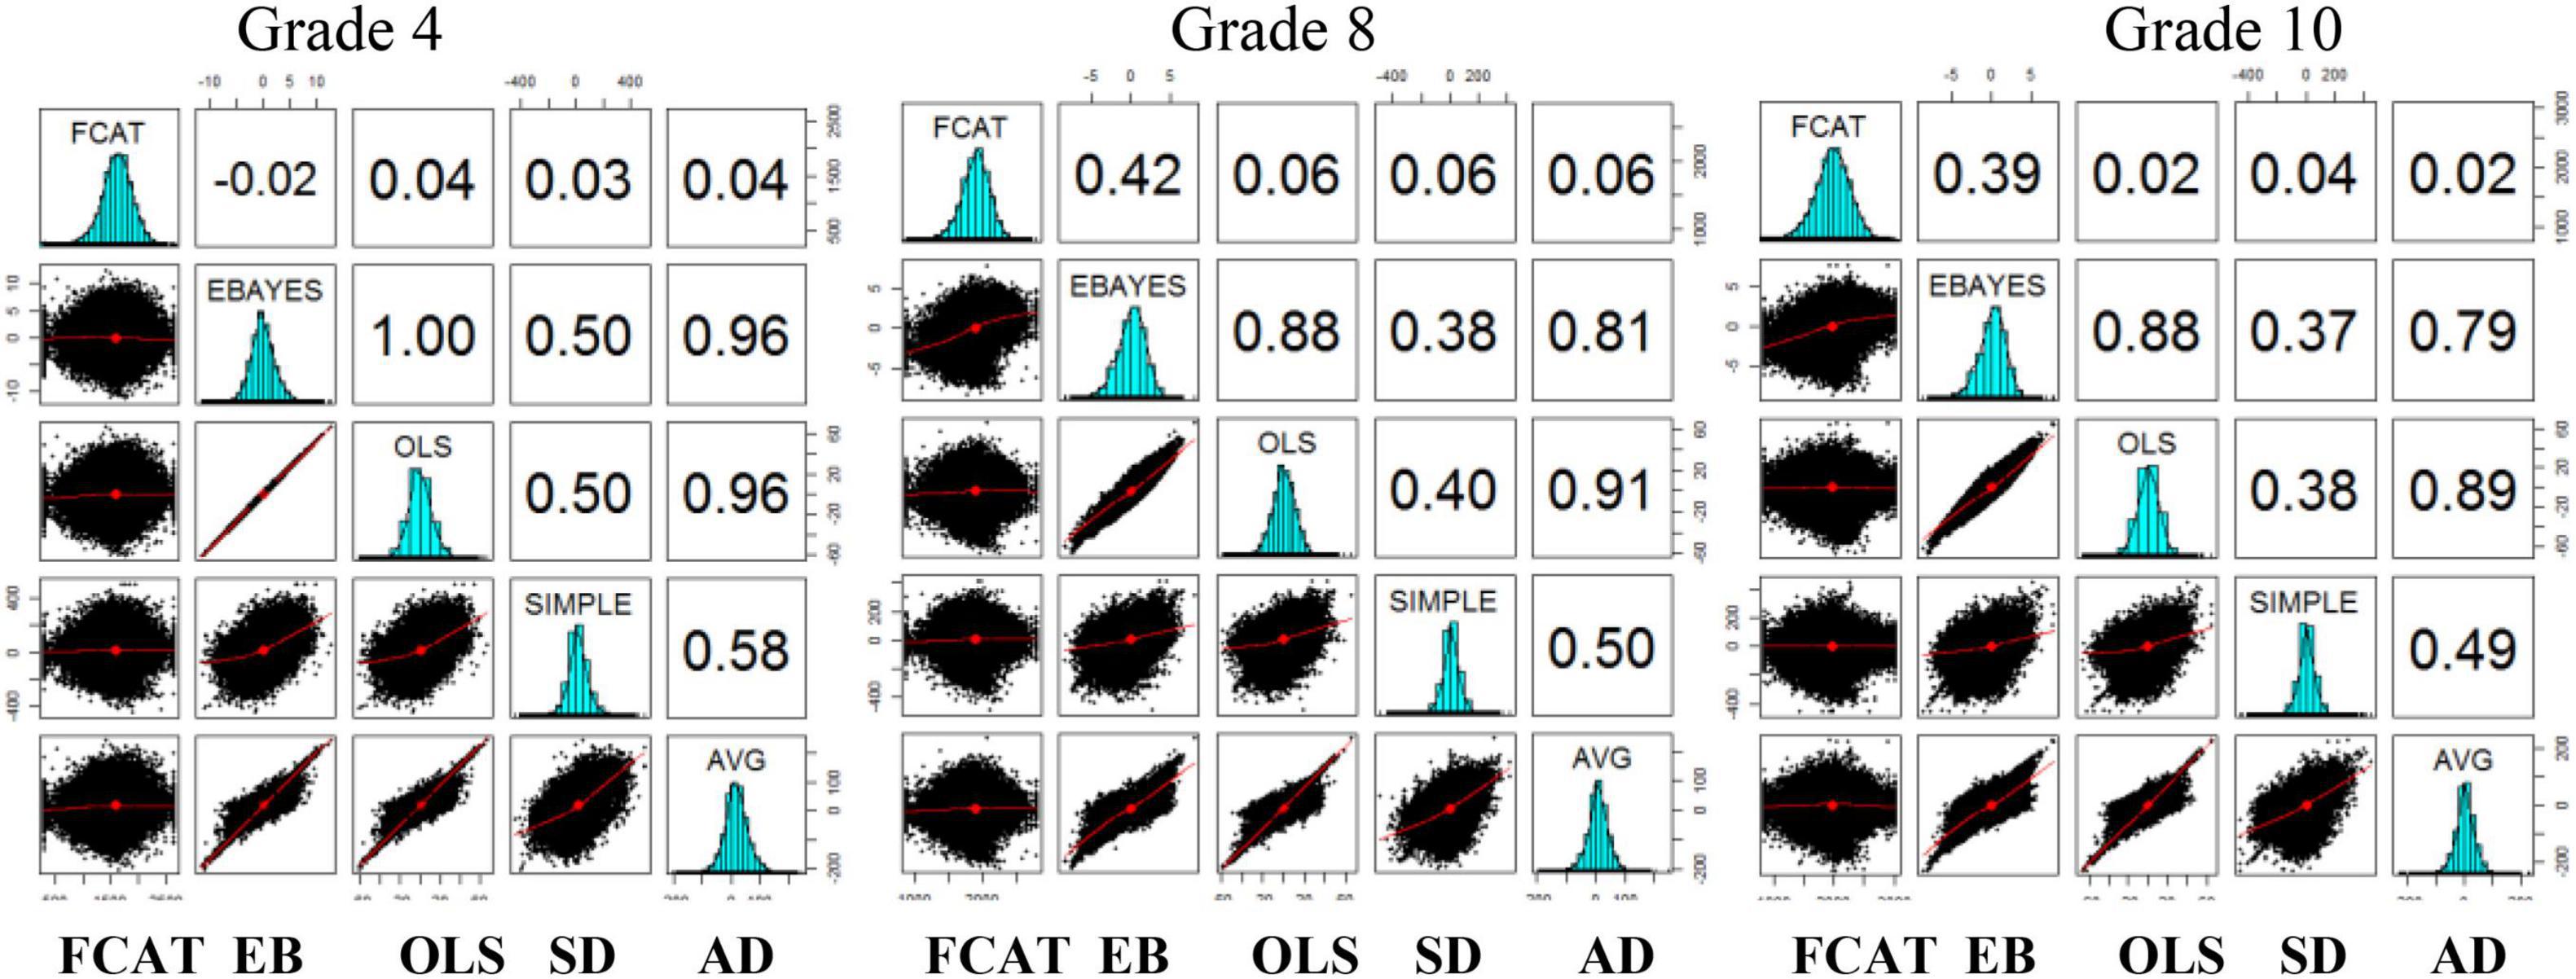
Figure 1. Matrix scatterplot depicting Pearson correlations (upper diagonal), histograms (diagonal), and scatterplots (lower diagonal) for the FCAT and growth measures, by grade, 2009/10. FCAT, Florida Comprehensive Assessment Test; EB, empirical Bayes; OLS, ordinary least squares; SD, simple difference; AD, average difference.
Several correlational trends are worth noting. First, the growth measures are shown to be moderately to perfectly correlated across grades. For students in grade 4, a perfect or nearly perfect correlation is observed between empirical Bayes and OLS (r = 1.00), empirical Bayes and average difference (r = 0.96), and OLS and average difference (r = 0.96). For students in grades 8 and 10, the correlations decrease slightly but remain strong (r = 0.88 between empirical Bayes and OLS, r = 0.79–0.81 between empirical Bayes and average difference, and r = 0.89–0.91 between OLS and average difference). Further, for all students, moderate correlations are observed between simple difference and empirical Bayes (r = 0.38–0.50), simple difference and OLS (r = 0.38–0.50), and simple difference and average difference (r = 0.49–0.58).
Second, as already noted, a limitation of the progress monitoring literature is that many of the studies evaluating the relation of growth with outcomes used samples that did not consist of predominately low-ability/high-risk students. The same criticism can be leveled here, as the sample of 100,000 students at each grade contained students with low, average, and above average reading ability (see Table 1). The scatterplots in Figure 1 corroborate this in that the correlations among growth measures are stronger at the lowest end of the reading ability distribution. That being the case, the Pearson correlations shown in Figure 1 would mask the correlations among variables for students at the lowest end of the reading ability distribution because the coefficients were estimated in a conditional means model (which estimates the average relation). Third, unlike the correlations among the growth measures, the correlations between the growth measures and the FCAT were near zero for all grades (see Figure 1), with the exception of the correlation between empirical Bayes and the FCAT for students in grades 8 and 10 (r = 0.42 in grade 8; r = 0.39 in grade 10). The lack of a correlation between most of the slope measures and the FCAT suggests that individual differences in the individual growth curves would not explain differences in the FCAT outcome but that once status was included as a predictor, individual growth curves could contribute.
Hierarchical multiple regressions (see Supplementary Table 2) used to estimate the amount how the four measures of growth explain differences in the FCAT after accounting for mid-year (winter) status on the FAIR found that they accounted for 49–56% of the variance for students in grades 3–10 in the baseline model (Table 2). Unstandardized regression coefficients for each model by grade are reported in Supplementary Table 2. Table 2 reports the ΔR2 between growth measures controlling for winter status by grade. Adding the OLS slope and the average difference score did not explain FCAT differences among students beyond that accounted for by the winter assessment, and adding the empirical Bayes explained only a negligible amount of additional variance (ΔR2 = 0–2%). By contrast, adding the simple difference score (change from the fall FAIR to the winter FAIR) explained an additional 6–10% of the variance in FCAT scores across grades 3–10. Based on Cohen’s criteria for evaluating the strength of an R2, these constituted small, yet practically important effects.
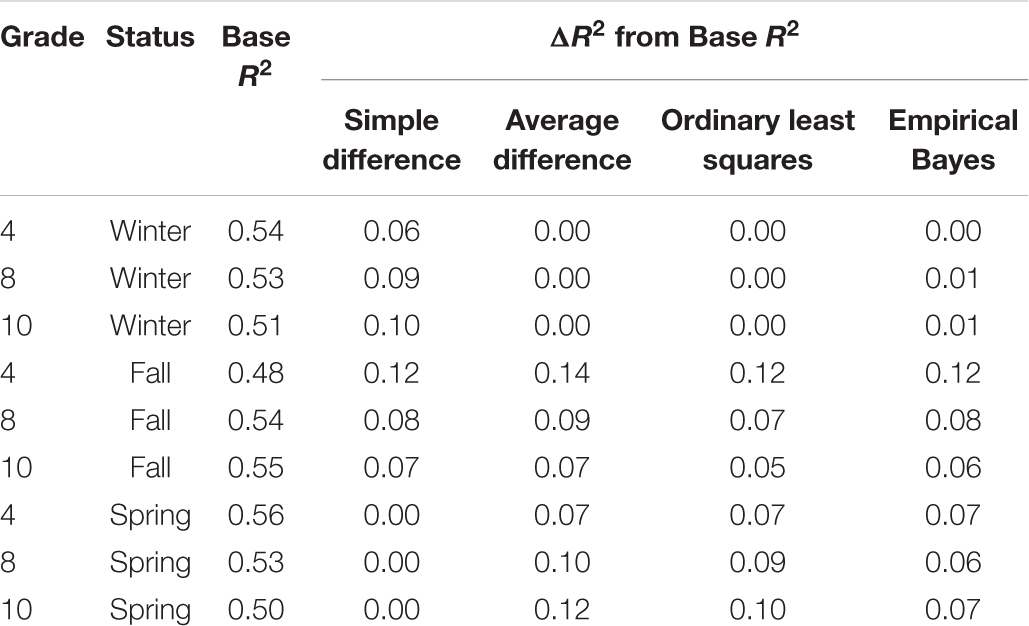
Table 2. Proportion of variance in FCAT scores performance explained by growth measures after controlling for status (base model) on the FAIR, by grade.
Specific results for the hierarchical multiple regressions of adding growth measures beyond each status measure are reported in Supplementary Table 2. Aggregated findings from the base model that only included status measures (Table 2) showed that the base model accounted for 48–55% of the variance in FCAT performance across grades. In general, all growth measures explained additional variance in FCAT performance for all grades after controlling for fall status. Empirical Bayes explained an additional 6–12% of variance, OLS explained 5–12%, average difference explained 7–14%, and simple difference explained 7–12%. As was the case for the base (winter status variable) model, the amount of variance explained by the four growth measures was interpreted as a small effect.
Results for the hierarchical multiple regressions controlling for students’ final (spring) status showed that the base model accounted for 49–58% of the variance in FCAT performance for students in grades 3–10 (Table 2). In general, empirical Bayes, OLS, and average difference measures of growth explained significant variance in FCAT performance after controlling for fall status, whereas the simple difference measure of growth explained no additional variance. Empirical Bayes added 5–8%, OLS added 7–10%, and average difference added 1–12%. Auxiliary comparisons between growth measures controlling for spring status showed that empirical Bayes, OLS, and average difference explained the same amount of variance in FCAT scores for students in grades 3–5. However, in grades 6 and 8, OLS and average difference explained 3–5% more variance than empirical Bayes. Further, in grades 7, 9, and 10, average difference explained 2–4% more variance than OLS, which explained 2–3% more variance than empirical Bayes. Except for the simple difference score, the amount of variance explained by the growth measures was interpreted as a small effect.
The results from a combination of multilevel growth curves, and hierarchical multiple regression suggest that the extent to which individual growth curves may explain variance beyond what can be explained by any one status variable depends on how growth is operationally defined and measured and what status variable is used as a covariate in the statistical model. In grade 4, the average amount of variance explained in FCAT scores by the individual growth curve was 11% when controlling for the fall FAIR score and 6% when controlling for the spring FAIR score, while in grades 8 and 10 it was 8% controlling for either the fall or spring score. These results suggest that individual growth curves may be stronger for elementary school students when the data are centered at the fall FAIR and stronger for middle and high school students when the data are centered at the spring FAIR.
The status covariate was found to affect how individual growth curves relate to FCAT performance. When the fall score was used as the status variable in the base model, all four growth measures added a small yet practically important contribution (average 9–11%) to the prediction of the FCAT score. When the spring FAIR score was used, the simple difference growth measure was no longer predictive, and when the winter score was used, the simple difference growth measure was the only one that consistently added a practically important contribution to the explanation of differences in the outcome across grades.
The extent to which the type of growth estimate explained student FCAT scores was most strongly associated with the status variable covariate. Bivariate correlations demonstrated that the slope coefficients were at least moderately associated with one another (see Figure 1). The average correlation among the four growth measures across grades was r = 0.70, suggesting that the stability or rank ordering of students by slope was fairly consistent across the estimates. Although the correlations among the slope estimates were large, the correlations of the slope estimates and the outcome depended entirely on the status variable (except for the empirical Bayes slope). This finding is consistent with estimates reported by Zumeta et al. (2012), who found near-zero correlations for slope with the selected outcomes of decoding and reading fluency for the representative sample of 25% low-ability students, 50% average ability, and 25% high ability.
Traditional regression analysis might mask predictive correlations with an outcome. Consider that the analysis of the effect of individual growth curves when controlling for winter status on the FAIR suggested that the average difference, OLS, and empirical Bayes growth measures consistently did not explain differences in the FCAT. When considering the extent to which growth explains differences in outcomes, it is important to think about how to characterize growth and about which status variable is most appropriate. One option is to take a developmental progression perspective. Statistical models are agnostic to the data, and it is up to the user to define a model that is both statistically and theoretically sound. When the fall score is used as the status variable, any growth has yet to take place, so using the estimated slope yields little practical information, on average, for practitioners. When the winter score is used in the baseline model, the simple difference growth measure may be the most meaningful because the average difference, OLS, and empirical Bayes growth measures all incorporate information about students that is not yet available when controlling for the status variable. The only status variable for which a within-year growth estimate should be used is the spring score; from a practical perspective, however, this may be less useful to teachers and practitioners looking for a growth measure to use during the year to identify students requiring intervention.
Statistically, the developmental progression perspective resolves many issues with the apparently conflicting results based on centering. Consider the results for grade 3 students. The statistical outcomes for the fall model suggested that 53% of the variance in the FCAT outcome was explained by the base model and about 10% more by individual growth curves, for a total of 63%. In the winter model, the base model accounted for 56% of the variance, an increase of 3% (56% minus 53%), but adding individual growth curves would explain not explain FCAT differences. The idea of losing explanatory power as the criterion is approached does not sit well: it is difficult to explain how a 63% total variance explained in the fall drops to 56% in the winter and then increases to 65% in the spring (57% base model plus 8% additional variance). Taking a developmental approach instead shows that 53% of the variance is explained in the fall (no slope added), 63% in the winter (simple difference score added), and 65% in the spring (average difference, OLS, or empirical Bayes score added).
Taken as a whole, these findings suggest several broad sets of recommendations, with the noted limitation that such generalizations relate solely to the data used in this study. First, for individuals evaluating the within-year effects of individual growth curves, using the estimated individual growth curves such as OLS or empirical Bayes is theoretically relevant from a developmental perspective only when one controls for the final (spring) assessment, not when the first or mid-year assessment is accounted for in the analysis. Although it was observed that the OLS and empirical Bayes individual growth curves explained student differences in the FCAT after controlling for the fall assessment, we conjecture that this is due to including more statistical information in the model than a developmental perspective would allow. Including an individual growth curve with fall status in the statistical model contains information about growth that occurs during the full time period, in this case, during the academic year. Thus, the extent to which the individual growth curve explains differences in the FCAT beyond the fall assessment is due to the growth estimate inherently including information about their performance in the winter and spring. It is natural to expect that an individual growth curve would predict beyond the fall status variable. In this instance, the individual growth curve has the potential to provide misleading information about how important the individual growth curve is in explaining student differences on the FCAT as a developmental perspective would preclude a meaningful interpretation.
Second, for both researchers and practitioners, using the simple difference score may provide valuable information about student differences in an outcome, beyond that of the mid-year status variable. The results in this study showed a statistically significant effect for the simple difference score. This measure of student change represents a score type that is developmentally appropriate to include in the statistical model which includes mid-year status. The simple difference score does not contain additional information about future performance when including the mid-year status; thus, its statistical relevance coupled with the ease of its calculation suggests that this score type may be a useful measure of student change to explain differences in an outcome beyond a status variable. The benefit of a simple difference score in practice allows teachers to potentially differentiate students needing different supports as a function of both initial starting levels and change over time. Two students with the same change score yet different initial starting levels may imply different courses of action such that a small amount of change coupled with low initial scores might suggest more intensive interventions compared to a student with small change but average initial scores. Similarly, a teacher may be able to differentiate needed instructional supports between two students with the same initial score but different amounts of change.
Third, the average difference score may provide information about student performance differences on the FCAT beyond that of the spring assessment. This score type explained student differences in the FCAT at a comparable level to the OLS and empirical Bayes individual growth curves (Table 2). Because this score type was both statistically relevant in explaining student differences beyond the spring assessment and is a simple computation for researchers and practitioners, it, in conjunction with the simple difference should be further explored for its use as an explanatory variable of student outcomes.
While the findings of this study extend the previous research on the value of interim assessments beyond primary grades (Schatschneider et al., 2008; Kim et al., 2010; Yeo et al., 2012) to middle and secondary school grades using a large sample, the work is limited by the measures used in the population, the subject matter assessed (reading comprehension), the frequency with which assessments were administered, and the type of student growth estimates used. The findings might differ if the number of interim assessments changed or if other growth measures were used. Future work could examine reliability of the score types and how prior-year individual growth curves could be used to inform predictions beyond those of the fall and winter status variables and the prior year’s FCAT performance, so that individual growth curves could be informative predictors beyond those assessment periods.
The raw data supporting the conclusions of this article will be made available by the authors, without undue reservation.
Ethical review and approval were not required for the study on human participants in accordance with the local legislation and institutional requirements. Written informed consent from the participants’ legal guardian/next of kin was not required to participate in this study in accordance with the national legislation and the institutional requirements.
YP developed a frame of work, co-led analyses, and co-wrote introduction, method, results, and discussion. KC co-wrote the introduction and discussion. MK and MW co-wrote data analysis and results. SH co-led analyses and results. All authors contributed to the article and approved the submitted version.
The authors declare that the research was conducted in the absence of any commercial or financial relationships that could be construed as a potential conflict of interest.
All claims expressed in this article are solely those of the authors and do not necessarily represent those of their affiliated organizations, or those of the publisher, the editors and the reviewers. Any product that may be evaluated in this article, or claim that may be made by its manufacturer, is not guaranteed or endorsed by the publisher.
The Supplementary Material for this article can be found online at: https://www.frontiersin.org/articles/10.3389/feduc.2022.733851/full#supplementary-material
Alf, E. F. Jr., and Graf, R. G. (1999). Asymptotic confidence limits for the difference between two squared multiple correlations: a simplified approach. Psychol. Methods 4, 70–75. doi: 10.1037/1082-989X.4.1.70
Ardoin, S. P., Christ, T. J., Morena, L. S., Cormier, D. C., and Klingbeil, D. A. (2013). A systematic review and summarization of the recommendations and research surrounding curriculum-based measurement of oral reading fluency (CBM-R) decision rules. J. School Psychol. 51, 1–18. doi: 10.1016/j.jsp.2012.09.004
Barth, A. E., Stuebing, K. K., Fletcher, J. M., Cirino, P. T., Romain, M., Francis, D., et al. (2012). Reliability and validity of oral reading fluency median and mean scores among middle grade readers when using equated texts. Read. Psychol. 33, 133–161. doi: 10.1080/02702711.2012.631863
Calhoon, M. B. (2005). Effects of a peer-mediated phonological skill and reading comprehension program on reading skill acquisition of middle school students with reading disabilities. J. Learn. Disabil. 38, 424–433. doi: 10.1177/00222194050380050501
Calhoon, M. B., and Petscher, Y. (2013). Individual sensitivity to instruction: examining reading gains across three middle-school reading projects. Read. Writ. 26, 565–592. doi: 10.1007/s11145-013-9426-7
Cohen, J. (1988). Statistical Power Analysis for the Behavioral Sciences, 2nd Edn. Hillsdale, NJ: Erlbaum.
Compton, D. L., Fuchs, D., Fuchs, L. S., and Bryant, J. D. (2006). Selecting at-risk readers in first grade for early intervention: a two-year longitudinal study of decision rules and procedures. J. Educ. Psychol. 98, 394–409. doi: 10.1037/0022-0663.98.2.394
Edmonds, M. S., Vaughn, S., Wexler, J., Reutebuch, C., Cable, A., Tackett, K. K., et al. (2009). A synthesis of reading interventions and effects on reading comprehension outcomes for older struggling readers. Rev. Educ. Res. 79, 262–300. doi: 10.3102/0034654308325998
Espin, C., Wallace, T., Lembke, E., Campbell, H., and Long, J. D. (2010). Creating a progress-monitoring system in reading for middle-school students: tracking progress toward meeting high-stakes standards. Learn. Disabil. Res. Practice 25, 60–75. doi: 10.1111/j.1540-5826.2010.00304.x
Florida Department of Education. (2001). FCAT handbook–A resource for educators. Tallahassee, FL: Florida Department of Education.
Foorman, B. R., and Petscher, Y. (2010a). Summary of the Predictive Relationship Between the FAIR and the FCAT in Grades 3–10. Technical Report. Tallahassee, FL: Florida Center for Reading Research.
Foorman, B. R., and Petscher, Y. (2010b). The Unique Role of the FAIR Broad Screen in Predicting FCAT Reading Comprehension. Technical Report. Tallahassee, FL: Florida Center for Reading Research.
Francis, D. J., Santi, K. L., Barr, C., Fletcher, J. M., Varisco, A., and Foorman, B. R. (2008). Form effects on the estimation of students’ ORF using DIBELS. J. School Psychol. 46, 315–342. doi: 10.1016/j.jsp.2007.06.003
Fuchs, D., Fuchs, L. S., and Compton, D. L. (2004). Identifying reading disability by responsiveness-to-instruction: specifying measures and criteria. Learn. Disabil. Q. 27, 216–227. doi: 10.2307/1593674
Fuchs, D., Mock, D., Morgan, P. L., and Young, C. L. (2003). Responsiveness-to-intervention: definitions, evidence, and implications for the learning disabilities construct. Learn. Disabil. Res. Practice 18, 157–171. doi: 10.1111/1540-5826.00072
Fuchs, L. S., and Fuchs, D. (1998). Treatment validity: a unifying concept for reconceptualizing the identification of learning disabilities. Learn. Disabil. Res. Practice 13, 204–219.
Good, R. H. and Kaminski, R. A. (2002). Dynamic Indicators of Basic Early Literacy Skills, 6th Edn. Eugene, OR: Institute for the Development of Education Achievement.
Harcourt Brace (2003). Stanford Achievement Test, Tenth Edition: Technical Data Report. San Antonio, TX: Author.
Jenkins, J. R., Graff, J. J., and Miglioretti, D. L. (2009). Estimating reading growth using intermittent CBM progress monitoring. Except. Child. 75, 151–163. doi: 10.1177/001440290907500202
Kim, Y. S., Petscher, Y., Schatschneider, C., and Foorman, B. (2010). Does growth rate in oral reading fluency matter in predicting reading comprehension achievement? J. Educ. Psychol. 102, 652–667. doi: 10.1037/a0019643
Little, R. J. A. (1985). A test of missing completely at random for multivariate data with missing values. J. Am. Stat. Assoc. 83, 1198–1202. doi: 10.1080/01621459.1988.10478722
McMaster, K. L., Fuchs, D., Fuchs, L. S., and Compton, D. L. (2005). Responding to nonresponders: an experimental field trial of identification and intervention methods. Except. Child. 71, 445–463. doi: 10.1177/001440290507100404
Petscher, Y., Kershaw, S., Koon, S., and Foorman, B. R. (2014). Testing the Importance of Individual Growth Curves in Predicting Performance on a High-Stakes Reading Comprehension Test in Florida. Tallahassee, FL: Regional Educational Laboratory Southeast.
Petscher, Y., and Kim, Y. S. (2011). The utility and accuracy of oral reading fluency score types in predicting reading comprehension. J. School Psychol. 49, 107–129. doi: 10.1016/j.jsp.2010.09.004
Schatschneider, C., Fletcher, J. M., Francis, D. J., Carlson, C. D., and Foorman, B. R. (2004). Kindergarten prediction of reading skills: a longitudinal comparative analysis. J. Educ. Psychol. 96, 265–282. doi: 10.1037/0022-0663.96.2.265
Schatschneider, C., Wagner, R. K., and Crawford, E. C. (2008). The importance of measuring growth in response to intervention models: testing a core assumption. Learn. Individ. Differ. 18, 308–315. doi: 10.1016/j.lindif.2008.04.005
Silberglitt, B., and Hintze, J. M. (2007). How much growth can we expect? A conditional analysis of R—CBM growth rates by level of performance. Except. Child. 74, 71–84. doi: 10.1177/001440290707400104
Singer, J. D., and Willett, J. B. (eds) (2003). Applied Longitudinal Data Analysis: Modeling Change and Event Occurrence. London: Oxford University Press. doi: 10.1093/acprof:oso/9780195152968.001.0001
Torgesen, J. K., Wagner, R. K., and Rashotte, C. A. (1999). Test of Word Reading Efficiency. Austin, TX: Pro-Ed.
Woodcock, R. W. (1998). Woodcock Reading Mastery Test-Revised. Circle Pines, MN: American Guidance Service.
Yeo, S., Fearrington, J. Y., and Christ, T. J. (2012). Relation between CBM-R and CBM-mR slopes: an application of latent growth modeling. Assess. Eff. Interv. 37, 147–158. doi: 10.1177/1534508411420129
Keywords: individual growth curve, benchmark, value added (VA), screening, state outcomes
Citation: Petscher Y, Cummings KD, Killian MO, Woods M and Herrera S (2022) Testing the Importance of Individual Growth in Predicting State-Level Outcomes Beyond Status Measures. Front. Educ. 7:733851. doi: 10.3389/feduc.2022.733851
Received: 19 October 2021; Accepted: 10 February 2022;
Published: 13 May 2022.
Edited by:
Susan M. Brookhart, Duquesne University, United StatesReviewed by:
Rachel Kachchaf, Smarter Balanced Assessment Consortium, United StatesCopyright © 2022 Petscher, Cummings, Killian, Woods and Herrera. This is an open-access article distributed under the terms of the Creative Commons Attribution License (CC BY). The use, distribution or reproduction in other forums is permitted, provided the original author(s) and the copyright owner(s) are credited and that the original publication in this journal is cited, in accordance with accepted academic practice. No use, distribution or reproduction is permitted which does not comply with these terms.
*Correspondence: Yaacov Petscher, eXBldHNjaGVyQGZjcnIub3Jn
Disclaimer: All claims expressed in this article are solely those of the authors and do not necessarily represent those of their affiliated organizations, or those of the publisher, the editors and the reviewers. Any product that may be evaluated in this article or claim that may be made by its manufacturer is not guaranteed or endorsed by the publisher.
Research integrity at Frontiers
Learn more about the work of our research integrity team to safeguard the quality of each article we publish.