- 1Laboratory of Bioinformatics and Systems, Department of Computer Science, Institute of Exact Sciences, Universidade Federal de Minas Gerais, Belo Horizonte, Brazil
- 2Take Blip, Belo Horizonte, Brazil
- 3Bioinformatics Graduate Program, Department Biochemistry and Immunology, Institute of Biological Sciences, Universidade Federal de Minas Gerais, Belo Horizonte, Brazil
Online learning has grown in recent years and has become popular with Massive Open Online Courses (MOOCs). The advent of the pandemic has undoubtedly made more teachers and students experience the online learning experience. Distance learning is going to grow even more in the coming years. In this article, we present our computational thinking and programming course focused on life science students. We introduce our approach for analyzing how students interact with didactic resources regarding their probability of completing the course. We discussed several insights this strategy brought us and how we can leverage the teaching of programming skills to life science students through learning analytics. We suggest that machine learning techniques will be increasingly essential for better monitoring and supporting students and for online courses improvements.
1. Introduction
The intensification of the use of information and communication technologies (ICT) boosted the growth of the distance education (DE) modality in higher education. This growth was accelerated due to the COVID-19 pandemic, culminating in important reformulations in teaching practice (Dhawan, 2020).
The DE is intentionally designed for autonomous learning, with a variety of resources, such as study guides, digital books, video lessons, forums, and virtual assessments. It is based on the theoretical framework of pedagogy defined as the science whose object of study is education, as well as the teaching and learning process; the andragogy that deals with the study of adult learning; and heutagogy, an extension of andragogy, which deals with the student's independence about how and what he wants to learn (Agonács and Matos, 2020). It can be practiced in synchronous and asynchronous models. The synchronous learning environment is where students have access to classes in real time. In the case of asynchronous environments, the content can be offered through recorded lessons (Dhawan, 2020).
Among the advantages associated with distance learning is accessibility, enabling knowledge to reach more remote areas and giving the student greater freedom in planning the time for carrying out activities. Among the aspects of negative impact is less interaction with colleagues and teachers, in addition to aspects related to performance evaluation and feedback, which need to be adapted to the online medium for greater effectiveness (Higashi et al., 2017).
In 2017, we implemented a distance university extension course1 (de Melo-Minardi and Bastos, 2021) aimed at teaching computer programming to students and graduates in life sciences. Teaching computational thinking and a programming language for life science students involves some challenges. Among these, the great heterogeneity of training and level of knowledge in programming logic stands out. In the first half of 2019, we opened enrollment for the first class of the distance university extension course, with 101 enrolled for the first class. Currently, we have trained more than 1,000 students in more than 40 different undergraduate courses. The demand and success in training these students show an opportunity to offer strategic and diversified content to students in areas traditionally not covered by certain disciplines.
The course teaches computational thinking, uses Python programming language, and also teaches more in-depth concepts, such as algorithm complexity analysis techniques, and ends with classic Bioinformatics algorithms for sequence alignment.
The pandemic forced teachers around the world to quickly adapt to teaching content to hybrid teaching. This seems to be a point of no return. Education will never be the same, from now on we can take advantage of the best in face-to-face and distance learning through more hybrid strategies that make the best use of technology for teaching and assessment. With the huge amount of data that online learning platforms collect and generate, teaching methods can be improved through learning analytics.
With a large amount of data that online teaching platforms collect and generate, teaching methods can be improved through learning analytics. We profited from the opportunity and the increasing number of students in our course to implement these strategies and further improve our lessons, didactic resources, and pedagogic trails. It was possible due to data science methods.
We analyzed a class consisting of 245 students. Of these, 101 completed the course, which gives a 41% completion rate. According to Jordan (2015), MOOC completion rates or the percentage of enrolled students who complete the course vary from 0.7 to 52.1%, with a median of 12.6%. Our course has a significant completion rate, but we want to increase it, to comprehend better the factors that lead to student dropout, to support students in completing the course, and continually improve instructional design and course material.
We collected data from Moodle2 virtual learning environment and from Google Forms3 surveys. We gathered information from the students before, during, and after the conclusion of the course. We used machine learning models to comprehend the course content's use and its relation to course completion. The strategy proved to be promising in the evaluation of course resources, proposed activities, and instructional design and predinctig student's drop out.
2. Learning Analytics
Keats and Schmidt (2007), Lengel (2013), and Gerstein (2014) used the term “Education 3.0” to denote a new students generation, more digital. We now teach a cohort of students who grew up in a digital world where learning occurs anywhere, anytime, mediated by ICT.
Learning analytics (Siemens and Baker, 2012) is an emerging field and aims at using data related to students to build better educational material and strategies. A particular trend is to trace the profiles of the students, collecting data about their interactions with online activities to provide reliable information about the learning results achieved (Johnson and Palmer, 2015).
Among the valuable data for this purpose, we cite pass and disapproval data; data for accessing educational resources such as texts, images, and videos; data from participation in learning activities such as quizzes, open activities, discussion forums; performance data on learning and assessment activities; social interaction data (relationship with study colleagues and professors, for example); satisfaction survey data.
Through this data-based comprehension, one can build better andragogical proposals, train students to have a pro-active rule in the learning process, identify the potential of course abandonment (Kampff, 2009), and evaluate the aspects that affect course completion. This educational data science can help provide immediate feedback and adjusts to the educational contents and activities.
Considering the possible dimensions of analysis, the potential, and the importance of adopting learning analytics methods to know the teaching situation, the related factors, and consequently, guide the implementation of improvements in educational systems.
In this article, we focus our attention on three significant dimensions for data analysis in educational environments, including the segmentation of students based on the patterns of access to course resources; the identification of at-risk of abandonment students, and the evaluation of the use and perception of each material/activity/task.
3. The Course
We evaluate our online course that aims to introduce programming logic, teach the Python programming language, introduce algorithm complexity, and present classical bioinformatics.
The content of the course is as follows:
• Module 0 - Welcome: reception of the students, explaining the functioning of the course, and preparing the computational environment for the course.
• Module 1 - Introduction: definitions and fundamentals of bioinformatics, computational biology, computer science, algorithms, problems, data structures, programs, programming language, compiler, computer components and their relationship with programming, the complexity of algorithms.
• Module 2 - Programming: Python language, Python in bioinformatics, essential Python syntax variables, variable types (sets, tuples, lists, dictionaries), arithmetic operators, string comparators, logical operators, conditional structures, defined repetition structures and undefined, loop control, input, and output, formatted printing, code modularization (subroutines and modules), and regular expressions. It is a practical module with several practical exercises to hand on.
• Module 3 - Algorithm complexity analysis: algorithm complexity functions, best case analyses, average and worst case analyses, optimal algorithms, asymptotic behavior of complexity functions, asymptotic domination, O notation, complexity classes, several examples involving, among others, search algorithms. This module is largely made up of theoretical content, exercises are provided at the end of each class to fix the content learned. Submitting these activities is optional.
• Module 4 - Algorithms for bioinformatics: paradigm concept in computing, dynamic programming, token game example, tourist problem in Manhattan, distance metrics between sequences (Hamming and Levenshtein), maximum common subsequence problem, Needleman-Wunsch algorithm, Smith-Waterman algorithm, scoring schemes, and substitution matrices, peer-to-peer alignments, multiple alignments, global alignments, local alignments, and heuristics. This module also has some optional challenges.
• Bonus module: structural bioinformatics bonus module. It has no exercises or practical activities and is entirely optional.
he target audience comprises undergraduate or graduate students in biological sciences and related fields with little or no programming knowledge. We frequently receive as well students who graduated in computer science-related areas. They aim to learn Python, be introduced to bioinformatics problems, and review some computational fundamentals. Students holding more advanced knowledge of Python programming will benefit from the second half of the course, in which we cover more advanced topics related to algorithm complexity and classical algorithms in bioinformatics. This course can help prepare them to enter the graduate course in bioinformatics and computational biology, contributing to their acquisition of solid computing skills.
The course resources consist of the following:
1. 4 digital books: in pdf format, containing theory and challenges (mostly solved) for practical exercises in logical reasoning and programming, totaling 100 pages.
2. Video recorded classes: 35 classes (approximately 7 h).
3. Slides: presentations used in classes will be made available in pdf format.
4. Review and programming tasks: quizzes for review of taught concepts and lists of programming exercises.
5. Google Colab Notebooks: solved and commented programming exercises.
6. Live classes: meetings to clarify doubts through video conferences with the students.
The course lasts for up to 90 days and takes about 40 h to attend classes, read the material, solve course exercises, and complete the course.
3.1. Student Evaluation
Student assessment considers attending asynchronous classes, reading materials, review exercises, and practical programming exercises. To be considered a complete student, the student must attend 75% of classes, attend final classes, and complete 60% of the submitted exercises. We collect the data describing the use of the resources by the students from the Moodle platform. The data set consists of yes/no values for each pair of student-resource. Review exercises contain closed questions of various types: multiple-choice, association, and filling in gaps, among others. The programming exercises are practical and have to be solved using the Python programming language. Proposed solutions in a Google Colab Notebook4 and a video explaining the solution step-by-step accompanies each list of programming exercises. The correction of the exercises is done by the students themselves through correction classes and workbooks of solved activities. The analysis was carried out with data from 245 students from different courses, most of them coming from the biological sciences course, about 39.1% (see Figure 1). The data used consists of a table formed by the course resources such as class and delivery of activities with values of yes for attended and delivered and no for unattended and not delivered and the course completion section with values of yes and no. Data were obtained from the Moodle platform. To obtain the reports used in the analysis, the function “course management” and then “view participation report” was used. We chose “all course activities,” throughout the course period, filtered only by students and the “view” action. Then, we download a spreadsheet in xls format and perform all the analysis using Orange Data Mining.
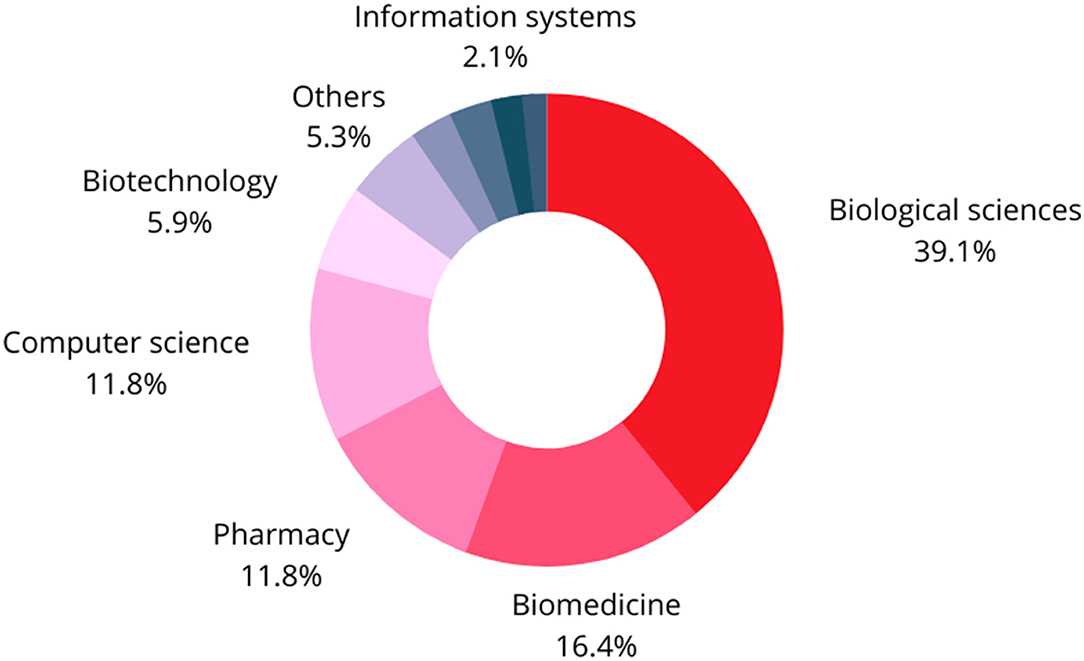
Figure 1. Student graduation areas. 2% of the students have completed the high school level and are not yet enrolled in a graduate course, 28% are undergraduates, 27.5% are graduates, 27.5% are masters, and 15% are Ph.D.s.
4. Materials and Methods
To obtain the reports used in the analysis, we used the Moodle function “course management” and then “view participation report.” We chose “all course activities,” throughout the course period, filtered only by students and by the “see” action. Each line of the data set is a student, each column is a course resource, and the domain of the features is in Yes, No domain. We then downloaded an xls format sheet and performed all the analysis using Orange Data Mining5 software.
4.1. Visualizing Students According to Their Profiles of Material Accession
First of all, we needed to have a visual grasp of the whole set of students according to completion or abandonment of the course. We used Multidimensional scaling (MDS) Carroll and Arabie (1998) which is a technique that finds (in this case) a 2D projection of instances, reproducing their distances as well as possible. As input, the technique needs a matrix of distances. As our attributes are categorical having values yes/no according to whether the student had accessed the material or not, the distances are zero for equal values and one for different values. The MDS algorithm iteratively moves the points around in a simulation of a physical-based model. When two points are too close/too far to each other, it applies a force pushing them apart/together.
We visualized the set of students in a 2D cartesian plan and colored each one according to completion (red) or abandonment (blue). It is presented in Figure 2 which will be discussed later in the Results session.
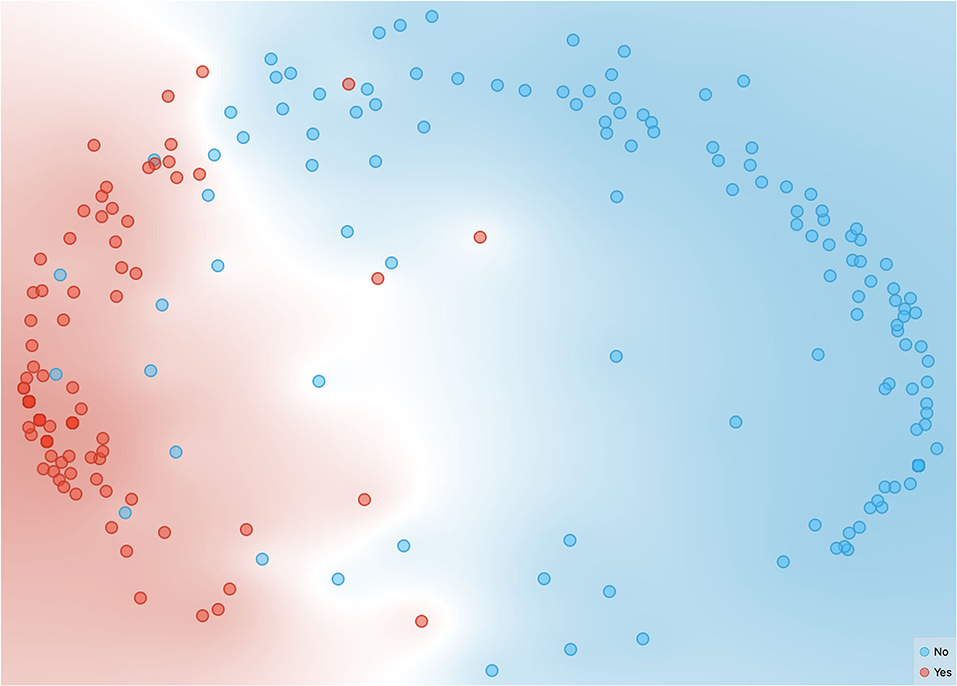
Figure 2. Multidimensional scaling (MDS) visualization of the students. In red, we show the students who complete the course, and blue represents the ones that dropped out.
4.2. Identification of At-Risk of Abandonment Students
To identify whether a particular student would be at risk of dropping out of the course, we built a binary classification model. We evaluated through cross-validation how accurately the model can get the label right (conclusion = yes or no). For the classification task, we tried several algorithms: K-Nearest Neighbors (KNN) (Peterson, 2009), Decision tree (Chang and Pavlidis, 1977), Random Forest (Breiman, 2001), Gradient Boosting (Friedman, 2002), Support Vector Machine (SVM) (Noble, 2006), and Logistic Regression.
All the models achieved accuracy greater than 0.8 with the complete data set, but neural networks outperformed, achieving 1.0. For this reason, we present and discuss only these results. We used a neural network with 100 neurons in the hidden layers, ReLu activation function, Adam optimizer, and a maximum number of interactions of 200. These were all default values, and we did not make any further assessment of the impact of varying these choices.
4.3. Evaluation of the Use and Perception of Course Material
To assess how closely each material is related to the target class (which indicates whether the student has completed the course or not), we created a ranking of attributes (resources) in classification using various indices. This ranking is based on a metric that scores attributes according to their correlation with the class, based on internal scorers (information gain, gain ratio, gini index, χ2, reliefF, and FCBF). Although the final ranking is calculated based on several indices, we present in the tables the information gain and the gain ratio due to space restrictions as they also discriminated the more informative attributes for classification. Information gain (Kent, 1983) is a classical machine learning score and measures the reduction in entropy by splitting a dataset. It is calculated by comparing the entropy of the dataset before and after this split. The concept of entropy comes from information theory and is the purity of a dataset or how balanced the distribution of classes happens to be. An entropy of 0 (minimum) means that all the instances are of the same class, and an entropy of 1 (maximum) means that the classes are equally represented in the group of instances.
5. Results and Discussion
We will present the results of the analysis carried out with data from a single class of students who took the course from August 2020 onwards. We had 245 students. Of these, 101 completed the course, which gives a 41% completion rate. According to Jordan (2015), completion rates of MOOCs vary from 0.7 to 52.1%, with a median of 12.6%. Although we have a relatively high completion rate, we want to better understand the use of the course resources, the main difficulties, and the improvements that can be implemented. Thus, the objectives of our analysis were student monitoring, support and satisfaction, and instructional design and planning.
A central question we wanted to answer was whether it would be possible to predict that a particular student would complete the https://www.overleaf.com/project/623b8acc04b7506347793b4a course by observing his/her pattern of resources study. We would also like to understand the pattern of dropping out of the course concerning the module/lesson/task done. Are there more difficult lessons or tasks that contribute to student dropout and whose content could be improved?
In Figure 2, we show the set of 245 students colored by red (completed the course) and blue (dropped out). We plotted them according to the distance between their profiles of study of course resources. It is possible to discriminate between the ones that conclude or not conclude the course indicating they have different behaviors.
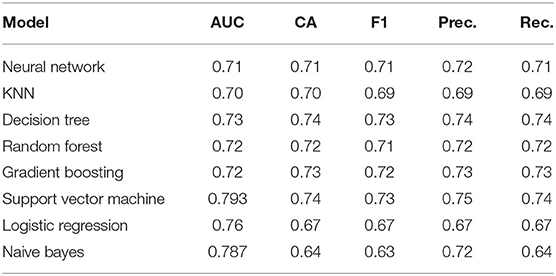
Next, we wanted to see if a machine learning algorithm was able to differentiate the students who would finish those who would give up. A neural network hit 100% of the instances. We did the same with resources from each module of the course and the results are presented in Table 1. The same metrics for module 0 obtained by a varied set of classifiers are in Table 2.
We can see that the last module allows us to predict without error if a student completes the course, which is obvious. However, surprisingly, it is also possible to predict the completion with a relatively high accuracy through the course's first module (Module 0 - Welcome, 0.71). This prediction accuracy naturally increases as more resources are studied and more modules are concluded.
We observed that module 0 was efficient to predict the dropout of students from the course even using different classification algorithms. Accuracy values equal to 0.71 were obtained for Neural Network, 0.70 KNN, Decision tree 0.73, Random Forest 0.72, Gradient Boosting 0.72, Support Vector Machine 0.79, Logistic Regression 0.76, and Naive Bayes 0.78. The suggested hypothesis is that module 0 contains the introductory information of the course, in addition to tutorials for the preparation of the environment, it is imagined that when the first instructions are not met, students have more difficulties in performing programming activities, which can lead to abandonment. In addition, the results obtained may simply reflect a behavioral characteristic of the students, since they start the course performing tasks and attending classes, they are more likely to complete the course than those who do not start fulfilling the proposed activities.
We analyzed whether the use of review exercises and programming exercises themselves were sufficient to indicate a greater chance of completing the course. We have noticed that review exercises are less explanatory while programming exercises can help predict with a bit higher accuracy. We evaluated each exercise list and remarked on the great importance of content referring to loop structures. This topic is fundamental in programming logic. Students who complete this list of programming exercises and the following (about input/output) are more likely to complete the course (precision and recall of 0.8, AUC of 0.87, and an F1-measure of 0.79).
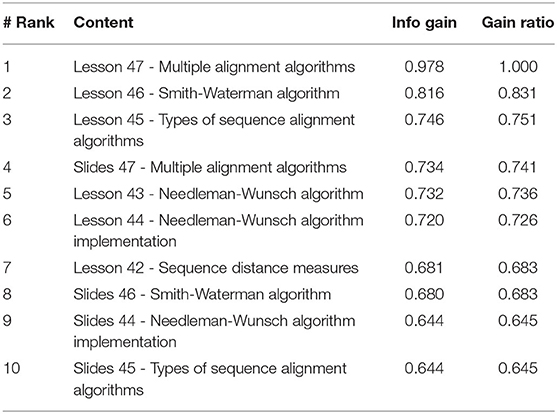
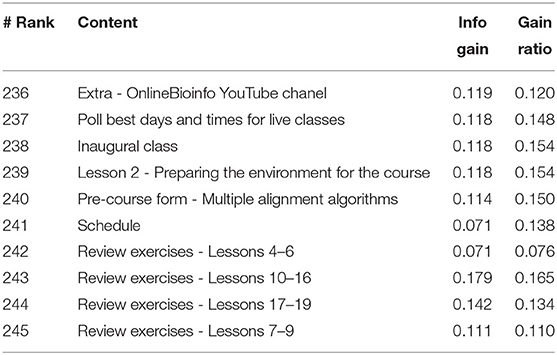
We built a ranking of resources by their correlation to course92s completion by students who accessed them. The most correlated resources are at the end of the course naturally (Table 3). It is noteworthy that recorded video lessons are always best ranked than respective slides. A curious fact is that all review exercises are at the very bottom of the ranking, after every extra and support only resources (Table 4).
A curious fact is that all review exercises are at the very bottom of the ranking, after every extra and support only resources. This surprises us because we assumed that review exercises were very useful in online courses. They are important to give the student immediate feedback on what he/she has learned in each lesson, helping to absorb the content, and are a guide in the need to re-study certain topics. We have to investigate further the use students make of review quizzes and understand how we can use them more effectively.
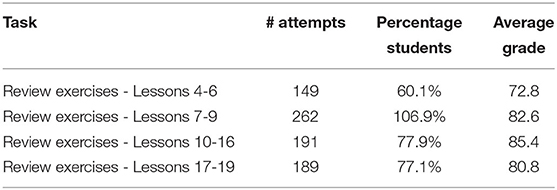
Table 5 shows that all four review exercise lists were widely accessed, and the average grades are reasonable. Consequently, we have to investigate with next classes if and how this type of exercise is contributing to learning. They are very theoretical and aim to fix concepts and diagnose problems in acquiring some knowledge related to a set of particular lessons.
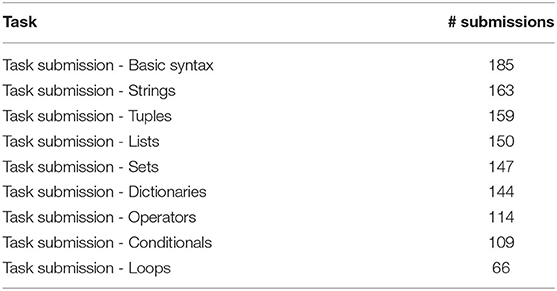
Regarding the programming exercises, the first that appears in the ranking (54th position) is about loop structures, with the info gain and gain ratio meager at values of 0.336 and 0.337, respectively. Table 6 shows the number of students who have turned in each of the programming exercise lists. As expected, the number of work submissions decreases throughout the course, indicating more difficulty for some students in more complex exercises. There is a significant drop in the number of deliveries of the list of loops. From our point of view, it is the heaviest in terms of the programming logic domain. Despite the low predictive capacity and the low number of deliveries of the latest exercise lists, we note that there is higher access to the solutions for these exercises (Table 7).
In Figure 3, we illustrate the distributions of attributes referring to the delivery of the programming exercises. Blue represents the students who abandoned the course, and red represents the students, who concluded the course. The left bars indicate those who did not hand in the task, and the right ones indicate those who did. The column “central” shows the mode of that attribute and the “dispersion”, the entropy of the distribution. We can notice that most of the students who completed the course handed most of the tasks (big red fraction on the right bar). The tasks that were considered the most challenging were about loops, operators, and sets. This is a very useful analysis to guide the instructor to improve course material and design.
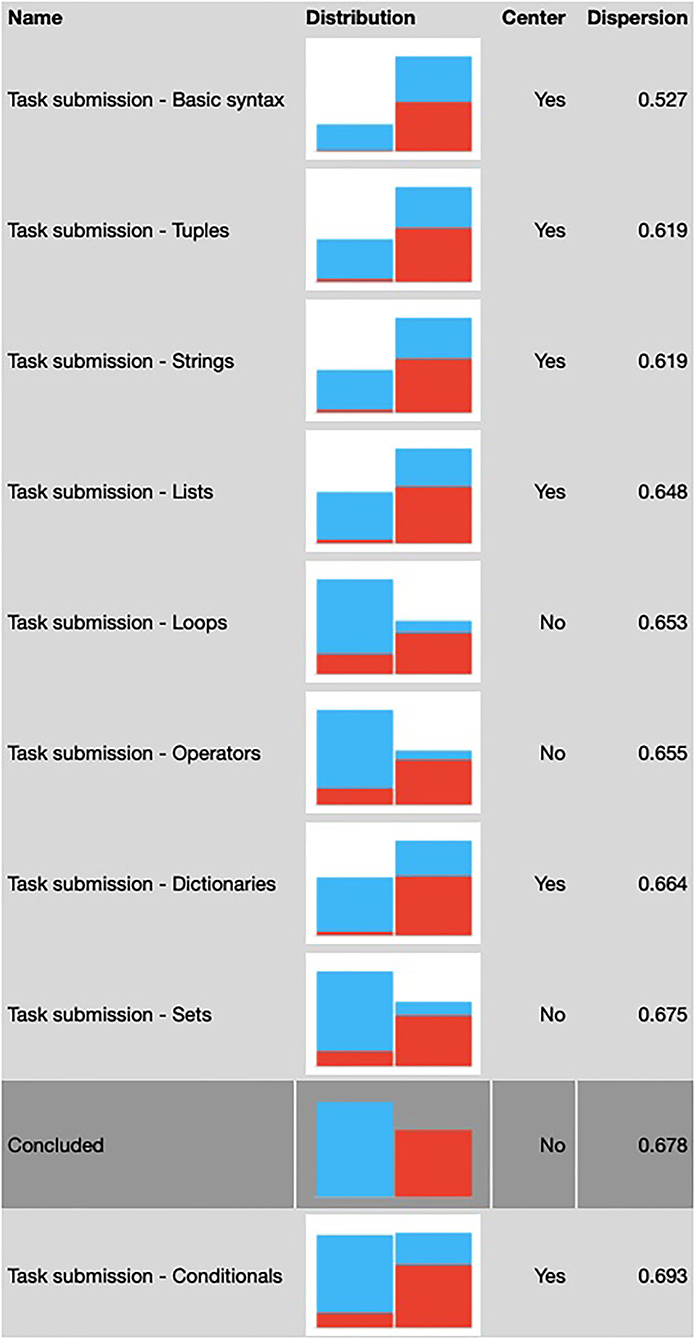
Figure 3. Task submission statistics related to course completion. Each line is a specific task list. The line in a darker shade of gray shows the proportion of students who conclude the course (red) and dropped out (blue). The left bar is composed of students who did not hand the task and the right is composed of the ones who did it.
The programming exercises are critical tasks in the course since computer programming is essentially a practical activity. Thus, we would like all students who completed the course to be fully capable of performing all programming exercises. Table 6 shows us that 66 students submitted the last list of practical exercises among the 101 who completed the course. This means they attended the classes until the end but did not submit all the tasks.
Hence, we consider that only 65% of graduates completed all the course exercises. Consequently, if we were to consider graduates only those who successfully submitted all activities, we would have a completion rate of 27%. Thus, this analysis is critical to raise the quality of the course, to produce more support teaching resources, and offer better follow-up and support to students.
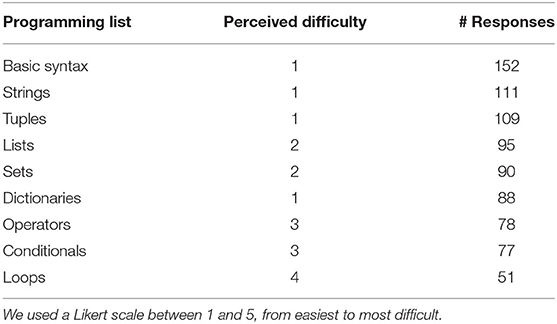
As a result in next classes, we created surveys, using Google Forms, to assess the students' perception of the difficulty of each programming exercise. For each question, we use a Likert scale between 1 and 5, from easiest to the most difficult. As a result, we obtained the following (Table 8) perception of students from the two classes after the class that was initially analyzed.
We confirmed that students perceive the last three lists of programming exercises (operators, conditional structures, and loops) as the most difficult. Therefore, we evaluate each of the exercises separately and use this information to identify the most critical difficulties and propose new exercises in the following classes. We now also have live lessons for these topics.
We did this having in mind the concept of flow proposed by Csikszentmihalyi et al. (2014). According to them, it is ideal for learning that the tasks offered for the students respect a balance between the level of difficulty and the student's knowledge at the point. Tasks far below this level can be tedious, and tasks far above the acquired skills are also discouraging. The professor's challenge involves keeping the difficulties of the tasks in an equilibrium between difficulty and acquired capacity, the flow region.
This challenge becomes more defiant when we have heterogeneous students in distance learning. We have a very limited perception of engagement and student performance. Accordingly, an exciting direction for learning analytics and machine learning techniques in education is developing educational paths and the recommendation of resources suited to each student's particular profile and level. In this way, we could recommend exercises that are more and more challenging according to the evolution of each student. We could still offer more fundamental or reinforcement resources for those with more elementary difficulties on specific contents.
6. Perspectives
The computer programming online course for life science students has been offered since 2019 and has already graduated more than 600 students. They originated from more than 40 different undergraduate courses. It is a vast and heterogeneous audience. We ask students to voluntarily evaluate the course through a survey implemented through the Google Forms tool. Among the 496 graduates in the first four classes, 124 evaluated the course. More than 95% gave grades of 7 or more out of 10 on the question “Would you recommend this course to a friend?” It shows that, in general, the course was considered helpful by the graduates. Approximately 25% of the enrolled got to know the course through the indication of a colleague.
Although we have been monitoring student satisfaction from the beginning, this is the first time we have collected data on their access to course content. We have gained essential insights through learning analytics for course improvement and the teaching-learning process.
For future work, we intend to collect interaction data from the forums, analyze temporal data for each student (order and number of times they use each resource), and better assess the students' performance in the programming exercises. We also want to accumulate historical series from several classes, making possible broader inferences about the results. We would like to evaluate if there are groups or profiles of students that can be treated collectively in terms of necessities or styles of learning. It can guide future decisions about learning paths and guide the elaboration of new resources making it more assertive.
Another natural direction is the use of automatic code correction tools. For instance, Pereira et al. (2020) developed CodeBench, a tool that allows data collection of student programming at the level of keystrokes, number of code submissions, and grades. They also have carried out a fine-grained analysis of effective/ineffective behaviors regarding learning programming. We intend to evaluate how those platforms that integrate programming IDEs and programming data collection could be integrated into our course (Berland et al., 2013; Fu et al., 2017; Grover et al., 2017). We also intend to study how the mistakes made can be used to assist in the correction of codes and the recommendation of didactic resources (Fernandez-Medina et al., 2013).
It may also be interesting to have a more detailed analysis of the codes produced by the students, as done by Blikstein (2011). He evaluated the programming style of the students and developed metrics related to compilation frequency, code size, code evolution pattern, and frequency of correct/incorrect compilations that could assess the students and the course itself. In another work (Blikstein et al., 2014), the same authors stated that learning to program is very personal, and there are multiple ways to build expertise in programming. We want to investigate the personal aspects and modes of learning in the context of our course in deep.
So our central perspective is to collect and integrate more data on the use of the resources and evaluate more machine learning techniques. We want to perform other tasks we did not go further in this study, such as student cohort analysis (through clustering), identifying sequences of students' behaviors, and identifying rules that indicate risk of abandonment, among others.
7. Concluding Remarks
In the present study, we present our online course content to teach introductory computer science concepts to life science students, mainly intending to give them skills to start in bioinformatics.
This course has been offered since 2019, having trained more than 600 people from more than 40 different undergraduate courses. The course has received good feedback from students on course evaluation surveys, and more than 95% of graduates who evaluated the course gave grades higher than 7 out of 10.
This study accounts for how we use learning analytics techniques to scrutinize student access data to course resources. We evaluate their access to recorded lessons, lesson slides, digital books, review exercises, programming exercises, and the proposed solutions for them.
For the class evaluated in this study, we had a completion rate of 41% if we consider attending to 75% of the classes and delivering 60% of the practical exercises. A total of 27% of the students delivered all the programming exercises. It is a relatively high completion rate when compared to the average completion of online courses. According to Jordan (2015), MOOC completion rates vary from 0.7 to 52.1%, with a median of 12.6%.
This study showed us that it was possible to predict student dropout risk with considerable accuracy by evaluating even the course's first welcome and introduction modules. Students who tend to complete the course already show a different behavior from those who do not. In addition, we were able to notice that students access recorded video lessons much more than written material (slides and books). We also notice that there are a greater number of visualizations for solutions of programming exercises than submissions of solved exercises. In addition, there are also fewer views to guided solutions for exercises than to the written solutions (in Google Colab Notebooks). We believe that both patterns are related to “better use of time.” We note that performing the review exercises in quiz format is less significant for predicting the course's completion. We believe that students consider that the practical activity of programming will give them more gain than theoretical exercises. These hypotheses confirm the point initially made about a new generation of students strongly motivated by what they want to learn and willing to pursue the desired skills, going straight to the point in a very pragmatic way.
We observed that only 65% of graduates delivered all activities and identified three main contents that caused more difficulties. To confirm this hypothesis, we applied a questionnaire to survey the difficulties perceived by the students in each of the exercises. The exercises more related to programming logic (operators, conditionals, and loops) were perceived as more difficult. It led us to propose new sets of exercises related to these topics. Our goal is to maintain a good balance between the challenges offered to students and the level of skills acquired so far. It is a great challenge, and in future works, we also intend to use machine learning techniques that support us in improving instructional design and providing more personalized learning trails.
Data Availability Statement
The datasets presented in this article are not readily available because Brazilian general law of individual data protection. Requests to access the datasets should be directed to cmFxdWVsY21AZGNjLnVmbWc=.
Ethics Statement
Ethical review and approval was not required for the study on human participants in accordance with the local legislation and institutional requirements. Written informed consent for participation was not required for this study in accordance with the national legislation and the institutional requirements.
Author Contributions
RM-M conceived the instructional project of the online course, prepared, and taught the recorded and live classes, conceived and executed the analysis, wrote the article. EM conceived the study, performed the analysis, and revised the manuscript. LB prepared exercises for the course, tutored students in the class whose data were analyzed, conceived and performed the analysis, and revised the manuscript. All authors contributed to the article and approved the submitted version.
Funding
This study was supported by Coordenação de Aperfeiçoamento de Pessoal de Nível Superior–Brasil (CAPES)–Grant 51/2013 – 23038.004007/2014-82; Conselho Nacional de Desenvolvimento Científico e Tecnológico (CNPq); Fundação de Amparo à Pesquisa do Estado de Minas Gerais (FAPEMIG). The funding body did not play any roles in the design of the study, collection, analysis, or interpretation of data, or in writing the manuscript.
Conflict of Interest
EM was employed by Take Blip.
The remaining authors declare that the research was conducted in the absence of any commercial or financial relationships that could be construed as a potential conflict of interest.
Publisher's Note
All claims expressed in this article are solely those of the authors and do not necessarily represent those of their affiliated organizations, or those of the publisher, the editors and the reviewers. Any product that may be evaluated in this article, or claim that may be made by its manufacturer, is not guaranteed or endorsed by the publisher.
Acknowledgments
We would like to thank Luciana Carvalho for her great support with Moodle from the Department of Computer Science at the Federal University of Minas Gerais.
Footnotes
References
Agonács, N., and Matos, J. F. (2020). Os cursos on-line abertos e massivos (mooc) como ambientes heutagógicos heutagógicos. Revista Brasileira de Estudos Pedagógicos 101, 17–35. doi: 10.24109/2176-6681.rbep.101i257.4329
Berland, M., Martin, T., Benton, T., Petrick Smith, C., and Davis, D. (2013). Using learning analytics to understand the learning pathways of novice programmers. J. Learn. Sci. 22, 564–599. doi: 10.1080/10508406.2013.836655
Blikstein, P. (2011). “Using learning analytics to assess students' behavior in open-ended programming tasks,” in Proceedings of the 1st International Conference on Learning Analytics and Knowledge, 110–116.
Blikstein, P., Worsley, M., Piech, C., Sahami, M., Cooper, S., and Koller, D. (2014). Programming pluralism: using learning analytics to detect patterns in the learning of computer programming. J. Learn. Sci. 23, 561–599. doi: 10.1080/10508406.2014.954750
Carroll, J. D., and Arabie, P. (1998). “Multidimensional scaling,” in Measurement, Judgment and Decision Making, 179–250.
Chang, R. L., and Pavlidis, T. (1977). Fuzzy decision tree algorithms. IEEE Trans. Syst. Man Cybern. 7, 28–35. doi: 10.1109/TSMC.1977.4309586
Csikszentmihalyi, M., Abuhamdeh, S., and Nakamura, J. (2014). “Flow,” in Flow and the Foundations of Positive Psychology (Springer), 227–238.
de Melo-Minardi, R. C., and Bastos, L. L. (2021). Expandindo as paredes da sala de aula: aprendizados com o ensino a distância e ensino remoto emergencial. Revista da Universidade Federal de Minas Gerais 28, 106–125. doi: 10.35699/2316-770X.2021.29089
Dhawan, S. (2020). Online learning: a panacea in the time of covid-19 crisis. J. Educ. Technol. Syst. 49, 5–22. doi: 10.1177/0047239520934018
Fernandez-Medina, C., Pérez-Pérez, J. R., Álvarez-García, V. M., and Paule-Ruiz, M. d. P. (2013). “Assistance in computer programming learning using educational data mining and learning analytics,” in Proceedings of the 18th ACM Conference on Innovation and Technology in Computer Science Education, 237–242.
Friedman, J. H. (2002). Stochastic gradient boosting. Comput. Stat. Data Anal. 38, 367–378. doi: 10.1016/S0167-9473(01)00065-2
Fu, X., Shimada, A., Ogata, H., Taniguchi, Y., and Suehiro, D. (2017). “Real-time learning analytics for c programming language courses,” in Proceedings of the Seventh International Learning Analytics and Knowledge Conference, 280–288.
Grover, S., Basu, S., Bienkowski, M., Eagle, M., Diana, N., and Stamper, J. (2017). A framework for using hypothesis-driven approaches to support data-driven learning analytics in measuring computational thinking in block-based programming environments. ACM Trans. Comput. Educ. 17, 1–25. doi: 10.1145/3105910
Higashi, R. M., Schunn, C. D., and Flot, J. B. (2017). Different underlying motivations and abilities predict student versus teacher persistence in an online course. Educ. Technol. Res. Dev. 65, 1471–1493. doi: 10.1007/s11423-017-9528-z
Johnson, D., and Palmer, C. C. (2015). Comparing student assessments and perceptions of online and face-to-face versions of an introductory linguistics course. Online Learn. 19, n2. doi: 10.24059/olj.v19i2.449
Jordan, K. (2015). Massive open online course completion rates revisited: Assessment, length and attrition. Int. Rev. Res. Open Distribut. Learn. 16, 341–358. doi: 10.19173/irrodl.v16i3.2112
Kampff, A. J. C. (2009). Mineração de dados educacionais para geração de alertas em ambientes virtuais de aprendizagem como apoio à prática docente.
Keats, D., and Schmidt, J. P. (2007). The genesis and emergence of education 3.0 in higher education and its potential for africa. First Monday 12, 3–5. doi: 10.5210/fm.v12i3.1625
Kent, J. T. (1983). Information gain and a general measure of correlation. Biometrika 70, 163–173. doi: 10.1093/biomet/70.1.163
Noble, W. S. (2006). What is a support vector machine? Nat. Biotechnol. 24, 1565–1567. doi: 10.1038/nbt1206-1565
Pereira, F. D., Oliveira, E. H., Oliveira, D. B., Cristea, A. I., Carvalho, L. S., Fonseca, S. C., et al. (2020). Using learning analytics in the amazonas: understanding students' behaviour in introductory programming. Br. J. Educ. Technol. 51, 955–972. doi: 10.1111/bjet.12953
Keywords: bioinformatics, computer programming, online education, Python, learning analytics, artificial intelligence, neural networks, distance education
Citation: de Melo-Minardi RC, de Melo EC and Bastos LL (2022) OnlineBioinfo: Leveraging the Teaching of Programming Skills to Life Science Students Through Learning Analytics. Front. Educ. 7:727019. doi: 10.3389/feduc.2022.727019
Received: 28 July 2021; Accepted: 12 April 2022;
Published: 18 May 2022.
Edited by:
Chi-Cheng Chang, National Taiwan Normal University, TaiwanReviewed by:
Candido Cabo, The City University of New York, United StatesDiego Onna, University of Buenos Aires, Argentina
Copyright © 2022 de Melo-Minardi, de Melo and Bastos. This is an open-access article distributed under the terms of the Creative Commons Attribution License (CC BY). The use, distribution or reproduction in other forums is permitted, provided the original author(s) and the copyright owner(s) are credited and that the original publication in this journal is cited, in accordance with accepted academic practice. No use, distribution or reproduction is permitted which does not comply with these terms.
*Correspondence: Raquel C. de Melo-Minardi, cmFxdWVsY21AZGNjLnVmbWcuYnI=
 Raquel C. de Melo-Minardi
 Eduardo C. de Melo2
 Luana L. Bastos
