 Mina C. Johnson-Glenberg
 Mehmet Kosa
 Holly Patricia O'Rourke
- 1Department of Psychology, Arizona State University, Tempe, AZ, United States
- 2Sanford School of Social and Family Dynamics, Arizona State University, Tempe, AZ, United States
Multiple assessments, including a novel videogame methodology, were used to understand how viewing a Giant Screen film in four different formats affected both science identity associated with liking science and desire to be a scientist, and learning gains on STEM content. Participants were 406 5th graders who were randomly assigned to watch the 45-min film called Amazon Adventure in either a (1) 2D Small Screen, (2) 2D Giant Flat Screen, (3) 3D Giant Flat Screen, or (4) curved Dome condition. The conditions increased in levels of immersivity as listed. In this 4 × 3 design, the first factor was viewing condition and the second was test time including pretests, posttests, and two-month followup on content knowledge tests relating to natural selection. The strongest pattern was seen at the followup time point where the three more immersive conditions (2D Giant Screen, 3D Giant Screen, and Dome) outperformed the Small Screen condition on the science identity measures of liking science and wanting to be a scientist when grown up. Additionally, two of the more immersive conditions performed significantly better at both posttest and followup on the videogame that assessed natural selection and mimicry knowledge. Significant gender effects at followup revealed that females in the two most immersive conditions (3D Flat and Dome) liked science significantly more and wanted to be a scientist more than males when grown. Interestingly, females also played the videogame significantly better than the males at both posttest and followup. These results suggest that increases in the immersivity of a film can have longer term effects on science identity, and those effects are stronger in females. Additionally, as more assessments are being designed in a gamified manner, designers/researchers should keep game-style (i.e., strategy games) and gender interactions in mind. It had not been predicted that the females would outperform the males on the STEM assessment videogame, but deduction games like the one in this study are probably capturing more than knowledge about natural selection, they may be a proxies for general intelligence or g. More research is needed on game type and gender effects during the school-age developmental span.
Introduction
Although large screen and 3D films are popular with primary and secondary science teachers, there has been little research on how such media affect Science, Technology, Engineering and Math (STEM) learning (Janicke and Ellis, 2013; Price et al., 2015) and less on how they affect the science identity of youth. There has to date been no a large scale, randomized control trial (RCT) study that addresses STEM learning and science identity over multiple time periods comparing different giant screen viewing formats. There has been little empirical evidence supporting the outcome differences in research examining claims and assumptions about giant screens’ potential impact in learning (Fraser et al., 2012). Fraser et al. report that most who argue for greater learning outcomes associated with giant screens believe those outcomes are reliant on four components: (1) the sense of immersion (created when peripheral views are at a minimum), (2) the first person perspective which contributes to the sense of presence, (3) the narrative structures, and (4) the sensory stimulation of mirror neurons that promote kinesthetic learning. Because many youth obtain supplemental science education through science museums and centers outside of formal education, it is as important as ever to investigate how viewing format can impact science learning and science identity.
We chose 5th graders as the population of study because they are old enough to read and answer expository text questions, and they are young enough to perhaps have their science identity affected by an engaging film. Additionally, in the United States 3rd through 5th graders are expected to start thinking about science at a “systems level.” STEM content is highly interconnected; the film topic of natural selection is reliant on what are called crosscutting concepts and patterns. Additionally, gathering empirical evidence is a core concept in most US Standards as is the understanding of hereditary traits (see the National Academy of Sciences1).
In this study, a film was viewed in various formats to understand the research questions associated with how platform immersivity affected students’ in four different domains: (1) science identity, (2) science knowledge, (3) performance on a natural selection videogame, and, (4) finally, how those three variables interacted with gender differences.
The film and study background
The film in this study was called Amazon Adventure and was produced by SK Films and HHMI Tangled Bank Studios. It was released in 2017, when it won multiple awards (including Best Film for Lifelong Learning awarded by the Giant Screen Association).2 The film is based on Henry Walter Bates’ 11-year journey through the Amazon in the mid-1800’s. It is an entertaining 45-min bio-pic experience that highlights Bates’ time as a young man searching to bring samples back to England and to find evidence of new species. The film wove together the narrative of exploring the Amazon river environs with components of science exploration and specimen collection. It has an action-adventure feel, but also probes critical science concepts. We note this is not a traditional STEM education experience (like a NOVA episode). It contained a well-defined narrative arc of Bates’ life. There was only one key scene that somewhat didactically illustrated Bates deducing how the Pierids (nonpoisonous) species of butterflies altered, or mimicked, the Heliconid (poisonous) species over many generations. The actor performs a “think-aloud” while an overlay on screen of the images of the butterflies merging phenotypes shows up. This type of natural selection eventually became known as Batesian Mimicry. There were several instances of cinematic suspense in the film (Would the ship be wrecked?), and potentially life-threatening moments (Would the jaguar attack?), and the movie did a commendable job of showcasing how the life of a scientist can include wonder-filled moments of scientific discovery. Viewers also saw how important observation and perseverance are for science to advance. Beyond learning about mimicry in butterflies, it was hypothesized that watching Bates’ exploits in the Amazon jungle might positively affect students’ desire to become scientists, either immediately after viewing the movie, or 2 months later. Thus, we asked two questions about science identity.
Study history
This study was funded by a 5 year-long grant. The overarching goal was to understand how viewing format affected learning and identity. To this end, the grant also proposed creating a film on the life of Walter Bates that could be modified for the four viewing formats. A studio with a respected track record for creating engaging and professional giant screen films was a partner in the grant. The film came first and then the study was designed to understand how viewing content on the four different screen formats of 2D small screen (12′ diagonal), 2D flat screen (112′ diagonal), 3D flat screen with 3D glasses (112′ diagonal), or a large curved Dome format would interact with the key variables of interest at pretest, posttest and at followup. This article focuses on those four film conditions and also includes results from an innovative videogame assessment created for this study called the natural selection videogame. The full study included a 5th condition called the classroom condition. Results from the original five conditions (with a classroom lecture that used still images from the movie and not the original film) are in preparation (M. Nucci). In order to differentiate the four viewing conditions, we need to unpack how the levels of immersivity differ between the four films.
Presence and immersivity
Presence and immersivity are related. Presence is a subjective measure, it is the “feeling of being there” (Slater et al., 1994). Creating presence, which is based on an illusion, depends on “successfully fooling several senses, principally sight and hearing, and eliminating or reducing any cues that would tend to break the illusion. The basic principle in creating a visually immersive experience is to fill the audience’s field of view” (Hyder, 2009). Certain cognitive components are associated with presence; Makowski et al. (2017) state these include attentional engagement toward the event and a willingness to endorse the mediated scenario (aka suspension of disbelief). Witmer and Singer (1998) hold that presence is inseparable from attentional factors. Presence has been used as a mediator of the learning outcomes in Virtual Reality (VR; Lee et al., 2010) and reported presence is a significant predictor in structural equation models that use science learning as a dependent variable (Makransky and Petersen, 2019; Johnson-Glenberg et al., 2021). Research supports that users’ ratings of presence are positively correlated with a platform’s immersivity (Alaraj et al., 2011; Cummings and Bailenson, 2016; Johnson-Glenberg et al., 2021).
Immersion describes the technical capabilities or physics of a display system. Immersion is a “correlate of presence” (Slater and Sanchez-Vives, 2016; p. 5). The immersivity of the display or platform is an objective measure (as opposed to a viewer’s subjective sense of presence). As Dalgarno and Lee (2010) state immersion relies on the “technical capabilities of VR technology to render sensory stimuli, whereas presence is context dependent and draws on the individual’s subjective psychological response” to being in VR. The Cummings and Bailenson (2016) meta-analysis lists eight immersivity variables of importance for a format: tracking level (or degrees of freedom), stereoscopy (2D or 3D vision), image quality, field of view (FOV), sound quality, update rate (refresh rate of FPS or Hz), user perspective, and “overall high versus low” [this category includes multiple operational features which might be confounded in a study, e.g., comparing a virtual reality (VR) condition with head tracking to a 2D desktop PC condition with no head/perspective tracking]. Cummings and Bailenson found the two most predictive variables were field of view (FOV) which yielded a weighted r of 0.304 (moderate) for reported presence, and stereoscopy (being in 3D or 2D) which yielded a weighted r of 0.320 (moderate).
Thus, FOV is predictive of presence. Lin et al. (2002) compared FOV with feeling of presence using a driving simulator, with four different horizontal FOVs: 60°, 100°, 140°, and 180°. Reported presence significantly increased with screen size; however, presence values approached asymptotes for FOVs at 140°. Further research shows that increased immersion is also related to increased engagement (Loup et al., 2016), enhanced learning (Dede, 2009), increased arousal (Tian and Wang, 2021), and amplified emotions (Kim et al., 2018).
Reported presence in Amazon adventure
In the paper-based assessment arm of the Amazon Adventure research (Nucci, 2019), a presence survey was administered. The paper assessment asked three presence questions using a Likert scale: 1 = disagree a lot to 5 = agree a lot. Preliminary results on presence can also be found at the government grant’s website (Nucci, 2019). The most representative presence query was the following: “I felt I could have reached out and touched the plants and animals in the film.” The four platform groups scored in a manner that correlated with increasing FOV. The Means are followed by SDs: Small Screen = 2.22 (1.14), 2D-GS = 3.25 (1.18), 3D-GS = 3.82 (1.22), Dome = 4.00 (1.07). The pairwise t-test comparisons were all statistically significant (except for the last one between 3D-Giant Screen and Dome). This supports there is a fairly linear increase in the subjective feeling of presence as the viewing formats increase in objective immersivity (i.e., FOV).
Ranking platform immersivity
The four viewing conditions, also called platforms, have been grouped based on levels of immersivity. Again, immersivity is an objective property of the technology (Slater et al., 1994). Two of the most predictive eight independent variables in the Cummings and Bailenson (2016) meta-analysis were used to place the four viewing conditions on a continuum of immersivity. Because the film did not change between conditions, it was not necessary to control for their other variables like image and sound quality, perspective of viewers, and degrees of tracking freedom. To be explicit, the exact same film was shown in the four formats, although we note that the addition of a third dimension can truly alter how some content is experienced, like a river wave rushing towards the viewer, or dust motes floating before ones’ eyes.
This study used the two variables of (1) field of view (FOV), and (2) comparison of 2D vs. 3D to rank level of immersivity. The Cummings and Bailenson article refers to 2D as monoscopy and 3D as stereoscopy, as do many older articles, but from here on, the terms 2D and 3D and “dimensionality” will be used instead of stereoscopy. Table 1 shows how FOV and dimensionality were used to ascertain level of immersivity. The average FOV statistics for giant screens come from publications by Hyder (2009) and Carlson et al. (2019).
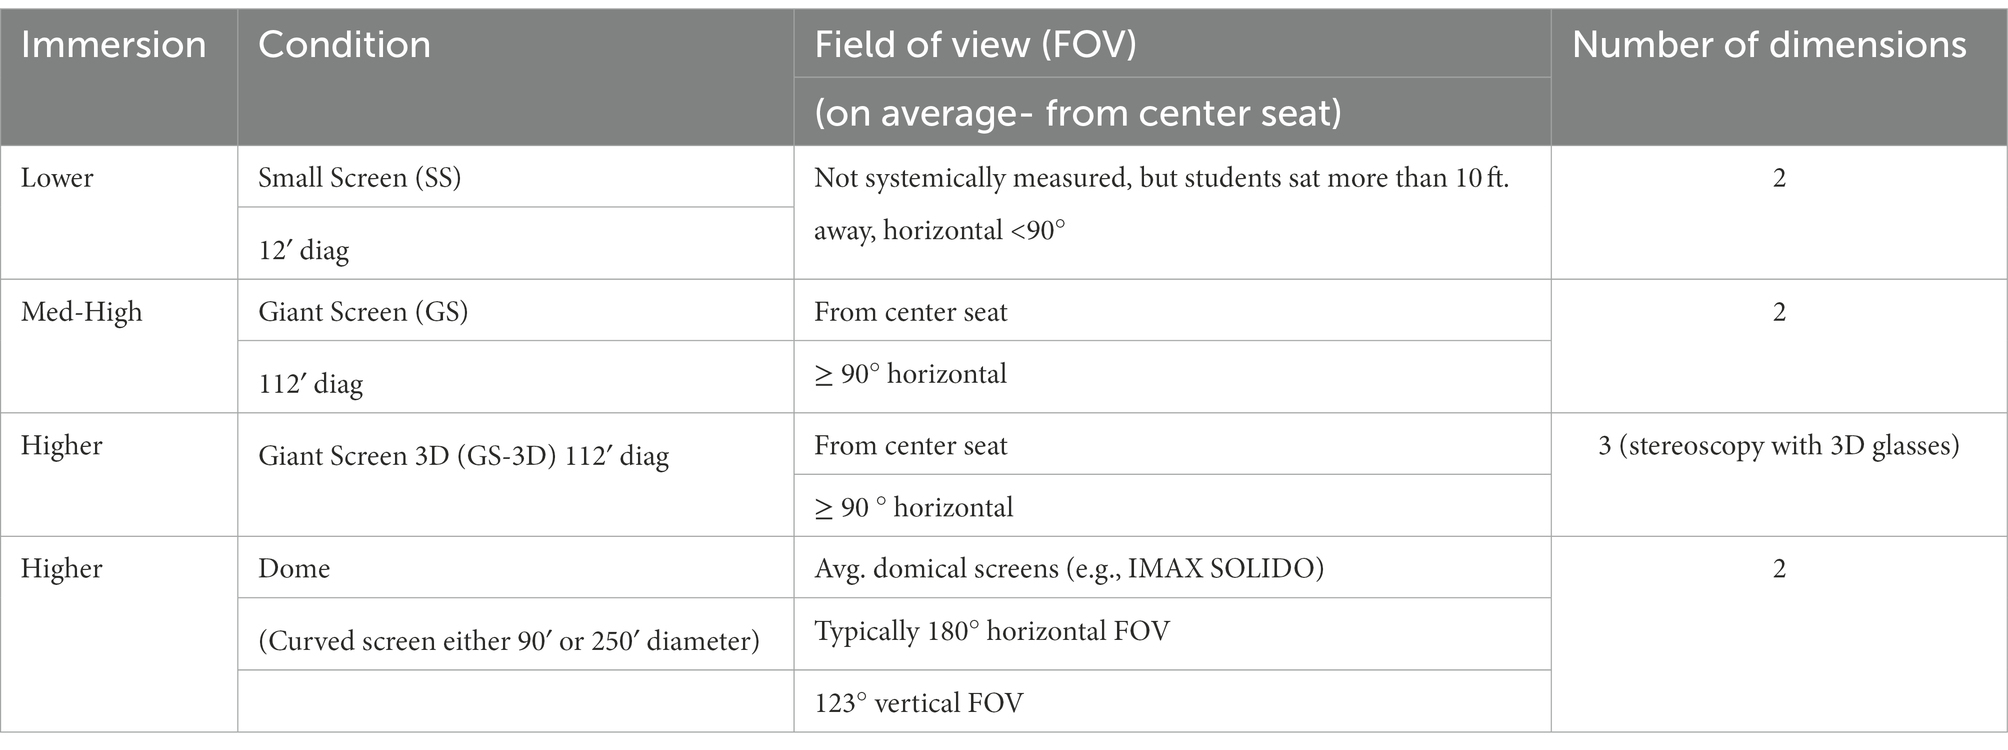
Table 1. Levels of immersivity by FOV by number of dimensions (2D vs. 3D).
The 3D Giant Screen and Dome are considered higher in immersivity because 3D affords a more realistic and depthful experience. The Dome experience, though 2D, affords the viewer a very large curved horizontal FOV with stimulation of peripheral vision. Domes are often characterized as “engulfing.”
Is 3D different?
According to Price et al. (2014), 3D should be used to present an environment where attention to spatial detail is paramount, such as astrophysics or an invasive surgery (van Beurden et al., 2012). The advantage of 3D relies on its more realistic display, which some argue can lessen the cognitive load needed to process the images (Price et al., 2014). To achieve a 3D effect while watching a movie, viewers wear special glasses and this may enhance interest and motivation because the experience is also new (or at least infrequent) for most movie-goers (Price et al., 2014). There is a novelty effect in wearing 3D glasses and it has been often cited as a potential explanation for the positive effects of 3D presentations in advertising (Yim et al., 2012). Finally, there is evidence from fMRI studies that the brain handles 3D content differently. One study suggests that working memory training is more successful using 3D objects rather than 2D ones (Park et al., 2016). Makowski et al. (2017) ran an episodic memory study on 2D vs. 3D effects using one of the Avengers entertainment movies. The main differences between the two conditions only reached the levels of statistical trends; however, a mediation (interaction) analysis found a significant link between emotion and factual memory that was mediated by presence. The authors hypothesized that the role of presence – as an “absorption of the attentional focus toward the stimulus” – had a positive and enhancing effect on encoding some of the factual content from the film.
Statistically significant main effects between Giant Screen viewing conditions on learning are difficult to find in the literature. As evidenced by the Price et al. (2015) and Price et al. (2014) studies, the effects between viewing conditions are often small and differential learning gains over time do not always reach traditional levels of significance. In 2015, Price et al. compared science learning in 2D vs.3D planetarium platforms. Participants were asked specific science questions before and after viewing. A very small effect size (Cohen’s D = 0.06) was found between the two platforms at posttest [note: this first author calculated Cohen’s D from the Price et al. (2015)]. Even though the Price et al. study had a relatively large sample size (N = 498), the time by platform interaction did not approach statistical significance at immediate posttest. They did, however, find a significant delayed effect on a six-month followup test on a smaller subsample (N = 123) and this suggested that 3D viewing may aid long-term retention. Although significant immediate learning differences have been elusive, some studies suggest that movies presented in 3D are rated as “more credible, more realistic, and more immersive” than those in 2D (Pölönen et al., 2009), and the increase in immersivity leads to increases in reported presence (IJsselsteijn et al., 2006). Consequently, we hypothesized that due to greater immersivity, a movie in 3D, compared to 2D, would be associated with increased presence and be associated with more interest in the topic and hence might lead to increases in STEM learning. We assessed STEM learning with two methods, traditional science questions and a novel videogame methodology.
The videogame assessment
This study is one of the first to use an interactive videogame to assess STEM knowledge both before and after a Giant Screen intervention. A metanalysis of serious games shows they are effective for learning (Wouters et al., 2013), and the past decade has also seen an increase in the use of games for knowledge assessment (Hickey et al., 2009; Shute, 2011; Shute et al., 2020). The first author of this article designed the natural selection videogame for a tablet form factor. The game was carefully designed to not instruct in the topic of mimicry per se, but instead to assess whether players understood the principles of capturing non-poisonous butterfly species compared to poisonous species. Additionally, players needed to track and remember the non-poisonous wing patterns changes over time. Gameplay scores were gathered across the three time periods and performance in the four viewing conditions were compared.
Our prediction was that those who viewed the film in the more immersive conditions might understand the concept of Batesian mimicry in a deeper manner. One theory supports that experiencing a film in a more immersive environment might free up cognitive resources for learning (Lin et al., 2002). With more cognitive resources, students may be better able to conceptualize the complexity of natural selection in butterflies. Perhaps when viewers feel present and “really there,” they do not have to expend cognitive effort simulating what Bates experienced as he deduced how the multiple generations of butterflies mutated over time. A second theory posits that the 3D experience is more engaging than a 2D one. Learners perform better with content when it is more engaging (Malone, 1980; Huang et al., 2021), and immersivity (at least with 3D VR) has been associated with more engagement, as well as reported presence (Schubert et al., 1999; Slater and Sanchez-Vives, 2016). Those in 3D film viewing conditions report more engagement compared to 2D ones (Pölönen et al., 2009). If the viewers feel more presence and engagement in the immersive conditions, then this might increase attention, motivation, and ultimately comprehension on the topic of natural selection. In that case, viewers in the high immersivity conditions are predicted to make fewer errors and achieve higher scores in the natural selection butterfly videogame at both posttest and followup. It follows that high immersivity viewers should also score higher on the more traditional science questions.
Gender
Gender and 3D
Although the Price et al. (2015) study did not find gender effects on STEM learning when comparing 2D and 3D formats, there is some evidence that gender effects may be associated with dimensionality. From the earlier videogame literature, Schild et al. (2012) report gender effects on presence and immersion depending on both game type and adult player’s gender. For a racing game with compelling 3D camera movement, they found more impact on male players, while a side-scrolling-game (with fewer spatial animations) had more of an effect on presence for female players. In a study by Salmimaa et al. (2009), participants watched a 1.5 h entertainment film (a U2 band concert) in a theater. Participants were assigned to either the 3D (with glasses) or 2D condition. They found several significant gender differences for the women. In the 3D condition, the females were more interested in “movie viewing as a task,” the females’ opinions about the 3D experience moved to a more positive direction, the females reported significantly deeper feelings of “psychological immersion” and engagement (p < 0.05). The females reported they were concentrated more on the 3D movie compared to the males (p < 0.01), and that everything in the virtual world looked “more real and vivid.” We note here that these results are based on only 11 females (out of 41) participants who responded to the study’s followup Web-based questionnaire, thus, interpretation should take into account self-selection biases.
Gender and STEM
In general, young women are drawn to careers that “fulfill humanistic and helping values” (Eccles, 2007). STEM has long been portrayed as a field that does not support those tenets and Eccles argues that that perception needs to change in order to attract more women to STEM. Interestingly, in primary school the genders report equal in interest in STEM careers, but over time, as fewer women are present in the ‘hard science’ classes, females report feeling less welcome and more isolated (Dasgupta and Stout, 2014). Appendix A includes more background on gender and STEM. We wanted to know if watching a 45-min movie with a male protagonist would affect 5th grade students’ identity and attitudes towards science immediately post viewing and at followup. This question is asked as a function of both gender and viewing condition.
Science identity
An identity is a set of meanings that define who a person is in terms of their roles, group memberships (social identities), or as individuals (person identities; Stets et al., 2017). Science identity is a complex phenomenon, which has been tackled in several different perspectives (Williams and George-Jackson, 2014). One way to think of it is as a type of “affinity identity” (Gee, 2003, 2007). A large study by Stets et al. (2017) reported that only science identity itself, among the many factors considered, influenced moving into a science occupation upon college graduation. Additionally, science identity is posited to be not only related to the extent students see themselves as science students, but also whether they behave consistently with this description (Stets et al., 2017). Several attitudinal constructs have been linked to science identity. One understanding is associated with perception, such as how much a learner perceives themselves as a science person, or that how much they think others recognize them as a science person (Carlone and Johnson, 2007). Most commonly, interest (intrinsic motivation) has been touted as a primary driver of science identity: the larger the science interest, the more solidified the science identity (Vincent-Ruz and Schunn, 2018). Other conceptualizations assume that when interest leads to participation in science, then it is this participation that leads to the development of career goals and a science identity (Crowley et al., 2015) Middle school children gather science knowledge from an abundance of experiences; however, for some proportion explicit science experiences will come primarily from formal environments rather than informal environments (Vincent-Ruz and Schunn, 2018). Thus, it was of interest to explore how a somewhat informal and short educational event, like a science center visit and viewing a giant screen film, might affect science identity.
Due to tight time constraints at the science centers, this study needed to be frugal with the number of test items. It was only possible to ask two of the canonical identity questions pertaining to (1) “liking science” and (2) “wanting to be a scientist when you grow up.” This study’s film portrayed a period of over a decade in the life of Bates, a white male scientist. There were realistic hardships portrayed in the movie that might not appeal to youth, i.e., long spans of isolation in the harsh climate of the untamed Amazon Forest and several graphic bouts of illness. On the other hand, there were also joyous moments of scientific discovery, scenes of palling around with a colleague, and a monkey-on-the-shoulder companion that provided levity. We wanted to know if the film affected boys and girls differently in their desires to be a scientist when they grew up.
Research questions and hypotheses
There is a greater expense associated with creating and screening giant screen films. Giant screen theaters worldwide are marketed as providing highly engaging informal learning experiences that complement and support formal education. It is important that researchers run randomized controlled studies to ascertain what kinds of learning and science identity changes will be associated with increased immersivity (and the increased expense of such films). Expected effect sizes need to be established in the literature. In an attempt to reduce some of the heterogeneity associated with students who visit museums and science centers in the United States, this study focused one grade group, 5th graders (between 10 to 12 years old). Three major research questions were addressed and for each major question an interaction analysis including gender was run. The research questions address how four different screen formats affect the following variables:
RQ 1. Change in science identity
The hypothesis is that students in the two most immersive formats of 3D and dome will increase in their positive attitudes associated with liking science and being a scientist, compared to those in the less immersive conditions.
Interaction of gender and science identity
The prediction is that in 5th grade, the genders will like science equally. This may change at posttest since the males may like science more and show a preference to be a scientist when they grow up since the lead protagonist in the film is a male.
RQ 2. Change in science knowledge
The hypothesis is that all students will increase in science knowledge on natural selection, but that those in the three more immersive conditions (2D GS, 3D GS, and Dome) will show greater increases, compared to those in the Small Screen condition. The more immersive the environment, the more presence and engagement the students should feel, which should translate into better encoding, reduction in cognitive load, and greater knowledge gains. The gains should be maintained at followup.
Interaction of gender and science knowledge
There are no specific predictions for science knowledge to differ pre-intervention since at 5th grade there is usually not a gender difference in STEM. Post-intervention males may gain more in the immersive conditions because the protagonist is a male. On the other hand, one small study showed adult females to be more immersed and engaged by 3D formats than males. In any case, there are no conclusive predictions for learning outcomes by gender.
RQ 3. Change in performance on the natural selection videogame
The natural selection videogame is a different more interactive and engaging method for assessing STEM knowledge. The hypothesis is that post-intervention, the students who were in the more immersive conditions should make fewer errors in the videogame. This may be because the more immersive conditions seem more “real” and encourage viewers to expend more “attentional focus” (Makowski et al., 2017). Focus on detail may also aid or prime some students to spot the detailed patterns on the butterfly wings in the videogame. Gains in performance should be maintained at followup, such that the more immersive conditions still perform better (have higher scores).
Interaction of gender and performance on the natural selection videogame
The prediction is that males will play better on their first exposure to the game (pre-intervention) because males in that age group play more videogames overall (Twenge and Martin, 2020), but that females will catch up in performance post-intervention. This is because the gameplay is about pattern recognition and deduction (e.g., strategy) and not focused on ‘twitch-style’ shooter gameplay skills that males often excel in with games. Thus, gender effects should be negligible at posttest and followup.
Materials and methods
Participants
Fifth grade teachers were recruited either by direct contact via the museum/theater site or by a flyer disseminated to teacher listserves. Teachers sent home parental consent forms for the study. If the forms were not turned in by the day of the study, those children were not tested (though all who were at the science centers did view the film). All research was performed under Rutgers University IRB protocol. The 5th graders came from a variety of geographic locations and schools with varying levels of SES. The sites included large cities in Minnesota, Massachusetts, and Washington state; and mid-sized to small cities in California and New Jersey. Ethnicity demographics were not gathered due to time and privacy constraints. Of the 406 participants, 215 chose male (53%) and 191 chose female (47%). Fifth graders in the U.S. are between the ages of 10 and 12 years. There were seven schools with 17 classrooms. Classes were randomly assigned to viewing condition. During testing, when it was noted that a participant was sitting with a parapro (para-professional adult aide), the parapro was asked (privately) if the child could understand the task of the tablet videogame. If the adult said “no,” those data were not analyzed. This occurred with six participants.
Subset of pretests. The term full set describes the 406 students in the four conditions at posttest and followup. A decision was made to give the natural selection tablet-based videogame to only a smaller subset of students at pretest. (One manager of the study felt that not taking the pretest would better simulate a traditional science center audience experience.) Thus, half of the 17 classrooms were randomly assigned the tablet pretest condition and they went through Set A of the tablet videogame assessment. The participants with pretest videogame scores are referred to as the subset throughout this article. The numbers are in Table 2.
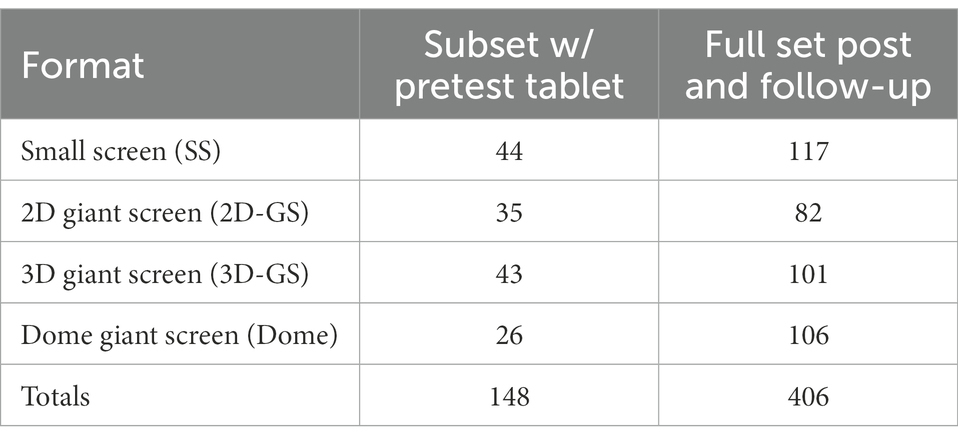
Table 2. Number of participants by format – Subset and Full set.
Design
This study represents a 4 × 3 mixed design. The first between subjects factor is viewing condition (or platform) with four levels. The levels are: (1) Small Screen (SS, four meters diagonal, 12 ft.), (2) giant screen 2D flat screen (2D-GS, 34 meters diagonal, 112 ft.), (3) giant screen 3D with individual glasses (3D-GS, 34 meters diagonal, 112 ft.), and (4) giant screen dome (Dome, immersive curved 2D screen). The Small Screen experiences occurred at the Science Centers but not in the theaters, these occurred in large conference rooms. That condition could be considered the control. There were two curved domes used in the study, the Science Center of Minnesota in St. Paul dome is 30 meters in width (~90 ft.) and the Museum of Science Boston dome is 76 meters in width (~250 ft.).
The second within subjects factor is time with three levels: pretest, posttest, and followup. The followup tests were administered 7 to 8 weeks post-intervention. The majority occurred 8 weeks later, so it is referred to as the 2 month followup. At followup, experimenters flew (or drove) back to the students’ schools and administered both the paper and the tablet-based tests in the school classrooms.
Test apparatus
The apparatus was a Fire HD 8 tablet (6th generation) with a diagonal of 8 inches of playable screen space. The average Frames per Second (FPS) was 32. The natural selection butterfly game was built in Unity Pro with a.json backend to locally save student data. The software team wrote original code to convert the.json data into a.csv format that would be readable by the statistical package. One hundred tablets were purchased for the study. There was no audio included because we did not have the resources (or desire) to procure and maintain 100 pairs of headphones.
Measures
The tablet locally captured data on the game as well as the assessment measures described below. No feedback was given after test responses. Measures were always administered in the same order, Figure 1 shows the design.

Figure 1. Schematic for the study’s design.
Science identity
SI1- Like Science. The first question addressed how much the students liked science. This was queried on a Likert scale of 1 (not very much) to 5 (very much). Variations of this study’s two identity questions have been asked on multiple Science Identity scales (Moore and Hill Foy, 1997; Stets et al., 2017). The two answers were significantly correlated during pretest (Pearson r = 0.44, p < 0.001). Still, one can like science without wanting to make it a career and so the two variables are analyzed separately.
SI2 – Want to be a Scientist. The second question was asked to understand whether seeing the film in a certain format would affect students’ desire to be a scientist. The exact query was, “Do you want to be a scientist when you grow up?” This was also queried on a Likert scale of 1 to 5, it comes from Question 36 in the Science Attitude Inventory (SAI II; Moore and Hill Foy, 1997).
Science knowledge
Three traditional science knowledge questions were delivered by the tablet at all three time points. The answers to the three questions were summed and the total final score ranged from 0 to 6.
Which Type Disappeared – Science Question 1.
Players saw an image with four pictures of butterflies at the end of the Butterfly videogame at level 2, one species was not in the level they just played. They were queried:
“Which butterfly type disappeared by the end of the game?”
They tapped on their choice. The score ranged from 0 to 1. This question allows the participants to show that they understood the difference in wing patterns and that one type of butterfly (species pattern) was not among the new generation.
Open-ended – Science Question 2.
This science knowledge question used an open-ended response which provides a deeper probe of knowledge (recall) compared to multiple choice questions (recognition), which have the attendant problems associated with guess rates. At the end of a the butterfly gameplay set, a specific type (species) of non-poisonous butterfly was no longer present in the game. After answering the previous question regarding which type of butterfly was no longer present they were queried:
“Why do you think that type disappeared by the end of the game?”
Participants typed in answers, after a starter stem of: “That type disappeared because ….” A digital keyboard appeared on the bottom of the tablet. Misspelled words were underlined in red, but not auto-corrected. Scores ranged from 0 to 4. A rubric was created with three subject matter experts (SME’s). The SME’s were evolutionary and learning scientists with PhD’s in their fields; they iterated through the scoring rubric (blind to condition) three times to make sure all instances of answers were accounted for, and that all disagreements were resolved through consensus. There were no examples in the literature of the sorts of wide ranging answers that 5th graders would create, so it is hoped that this rubric adds to that database for scoring middle school STEM responses. See Appendix B for the rubric. Using the expert rubric, two blind scorers (undergraduates) scored all the students’ responses. The interrater reliability was significant, r = 0.81.
Want to Change – Science Question 3.
This final multiple choice question was asked to understand if students held the misconception of intentionality, i.e., do animals have the intention or desire to mimic.
“Did the non-poisonous butterflies want to change their appearance?”
(A) Yes, to live.
(B) Yes, to blend with the trees.
(C) No, they do not want to change, but change happens over generations.
(D) No, they do not really change, it just seems like that over generations.
Scores ranged from 0 to 1.
Note: A recall task was also included at the end of the posttest and followup. Viewers were asked to recall up to four animals that Bates interacted with. They typed in animals with no spellcheck function. These ranged from 0 to 7 instances. There were no significant conditional differences at posttest, nor at followup. In order to reduce the length of this article, those results have not been included.
Catch a mimic – Natural selection butterfly videogame
More design details of the tablet videogame are included in Appendix C. A free derivation of the original tablet game can be played in a Web browser at (https://www.embodied-games.com/games/natural-selection-catch-a-mimic/play-catch-a-mimic/), additionally a 3D virtual reality (VR) version has been created and can be played for free at (https://www.embodied-games.com/games/natural-selection-catch-a-mimic/).
Game design
In the film, the naturalist Walter Bates realizes, that when the non-poisonous butterflies’ wing patterns more resemble the poisonous ones, they have a better chance for surviving into the next generation. The game was designed to allow the players to also make this deduction. They are not taught it. Players play in the role of a predator that needs to deduce which types of butterflies would make the predator feel “ill.” Players tap on the moving butterflies and via immediate game feedback begin to comprehend that they should avoid the poisonous ones. Two sets of butterflies were developed, Set 1 = easier, orange butterflies, and Set 2 = more difficult, spotted blue butterflies. The butterflies flew across the tablet screen from the right to the left edge, similar to a slow infinite runner/platformer game. As levels progressed, it became more difficult to ascertain the wing pattern differences between the non-poisonous and poisonous ones. Butterflies would spawn from the right edge of the screen and “fly off “when they reached the left edge. Each level consisted of 40 butterflies (20 non-poisonous and 20 poisonous) that flew across the screen in 60 s (thus, each of the three levels lasted 1 mins each). The white bar at the bottom of the screen in Figure 2 showed a bird moving across the white bar and served as a timer. A finger tap would essentially mean the player had “eaten” the butterfly. In place of where the butterfly had just been, players received immediate feedback. If they tapped a non-poisonous butterfly (correct hit), 50 was added to their total score; if they ate a poisonous butterfly (false alarm), 50 was deducted from their total score.
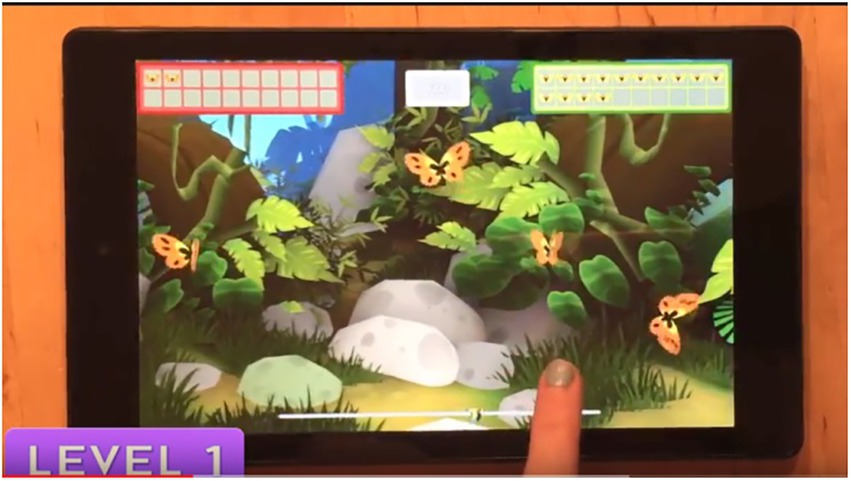
Figure 2. Screenshot of the Butterfly game on the tablet.
Figure 3 shows the level legend, or the types of wing pattern changes that occurred across the two sets. There were six levels total. The hardest level is clearly the last one, Set 2 level C.
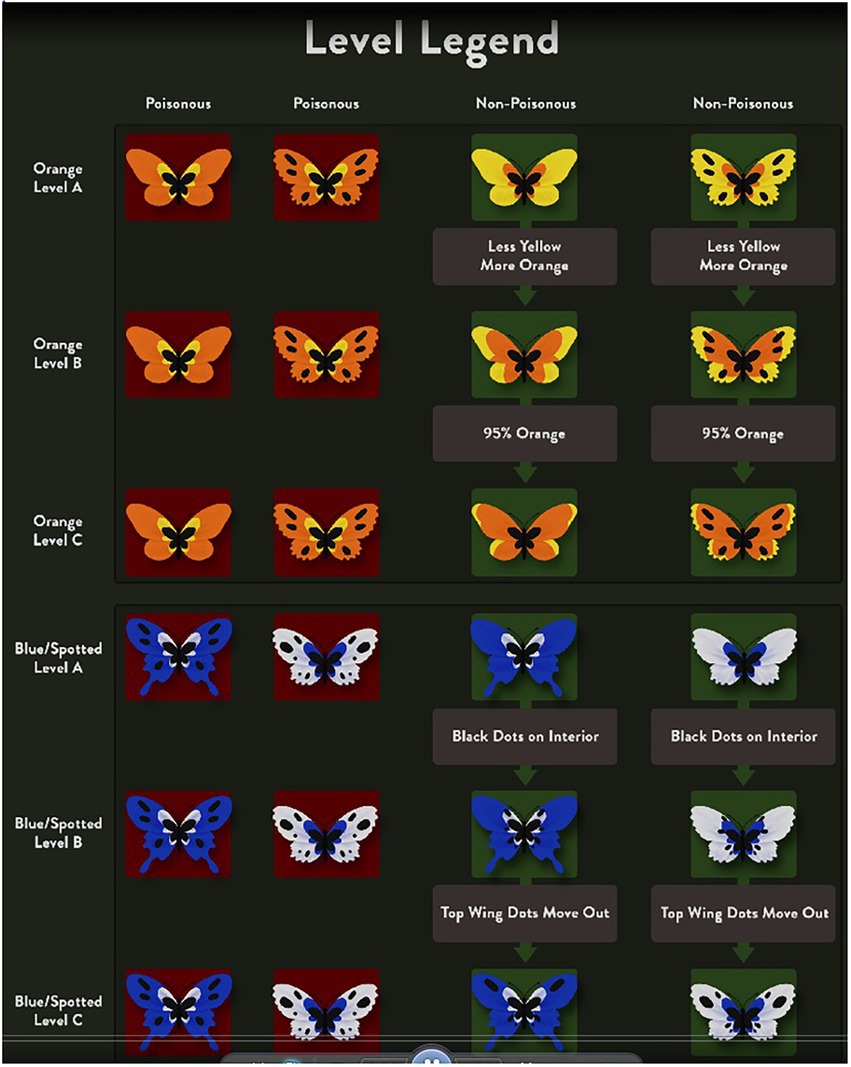
Figure 3. The level legend showing how the butterflies differed across levels and between poisonous and non-poisonous species.
The team spent 4 days over a half a year playtesting in a middle school and iterating on the design and mechanics. These focus group sessions (12 total) helped us to also finetune the instructions in the tablet videogame and the science knowledge questions.
Cut scenes – The importance of time passing
One of the hardest concepts about natural selection for students to understand is that generations need to pass for changes to become prevalent. Before each level, participants saw a short animated cut scene. The words “Many generations have passed” was displayed on the bottom of the screen. The design team felt it was important to include the phrase about time passing because natural selection is complex, students need to understand it is dynamic change over multiple generations and is affected by random mutations and environmental pressures. See Figure 4 for cut scene screenshot and see Appendix A for more on the difficulties of teaching evolution and more our iterative piloting and playtesting.
Protocol of experiment
Students arrived in buses to the science centers and museums. Last minute parental consent forms were collected. Classroom teachers remained in the rooms with the experimenters during testing. Assent forms were distributed, read to the students, students signed them, and the forms were collected. A short paper-based test was distributed and collected. The tablets were then distributed and participants saw an opening screen with the name “Butterfly Game” displayed (we did not want to prime them with the idea of natural selection or evolution).
The students were told:
“Here is another task. You are going to play a game on this tablet and answer some questions. Just do the best you can. Please do not talk to your neighbors. Wait until I give you the code to put into the white box before starting.”
The tester would then call out a two digit code that opened the assessment. Occasionally students needed to be reminded to not talk to each other.
Sequence of the tablet test
Opening demographics screen. Students typed in their first and last names, these were then turned into subject IDs. Students then chose gender.
The two science identity questions were asked.
Opening game screen. Opening text: “You are a bird living in a rainforest that eats butterflies to survive. Eat as many NON-POISONOUS butterflies as possible, while avoiding POISONOUS butterflies, to earn the most points.” Tap the START button.
5–9 min of play. Players immediately start tapping on butterflies, playing the game and deducing which are poisonous via the immediate feedback. Some errors need to be made in the early seconds because players only learn which are poisonous by seeing the feedback post-tap. Experimenters agreed that by the middle of the first minute of play almost all players understood the game mechanic and appeared to be engaged with the game and enjoying it. At pretest, only Set 1 was played (approximately 5 mins of play). At posttest and followup, both Set 1 and the harder Set 2 were played and that play lasted approximately 9 mins, depending on the student’s reading speed.
Test questions. Test questions appeared after the butterfly gameplay. After submitting final answers on the tablet, the following text appears.
“Thank you please put down your tablet and raise your hand.” The tablet screen automatically locked for 60 s after the final answer was submitted. This gave the testers time to collect it. This was good design since many students tried to play the game immediately again, and complained when they could not.
It should be noted again that at post-intervention, Set 2 with the blue butterflies was novel for all participants. Only Set 2 results will be used in our analyses. This set required more attention and cognitive evaluation because the differing species had multiple, subtle phenotype differences. Set 2 butterflies were blue and white (due to color blindness in the human population, the designers were careful to stay away from red and green as the primary identification colors), and BOTH spot locations and wing morphology changed over time.
Results
The results section addresses the major research questions in the following order:
RQ1 – Change in Science Identity: Like Science and be a Scientist, and gender analyses.
RQ2 – Change in Science Knowledge and gender analyses.
RQ3 – Catch a Mimic – Natural Selection videogame performance and gender analyses.
RQ1 – Science identity – Like science
Using the subset at pretest, the four conditions were not significantly different on liking science, F (147) < 1.20. The two pretest identity variables of “I like science” and “I want to be a scientist when I grow up” were significantly correlated with each other, r (148) = 0.44 p < 0.001.
Maximum Likelihood Estimation. The pretest to posttest, and posttest to followup correlations were stable (r = 0.71 to r = 0.81, respectively) and the decision was made to run the time analyses with the entire group (full set, N = 406). Maximum Likelihood Estimation (MLE) was used so that all the pretest, posttest and followup data could be included in a single ANOVA (otherwise, most analyses delete participants listwise, so those who did not have pretest scores, i.e., 62% of the participants, would be excluded). Using MLE provides analyses with higher statistical power compared to listwise deletion, as all available data from the three timepoints are used. It is a well-supported choice for this type of dataset, especially because other variables (i.e., gender) are included (Enders, 2005) and the pretest scores were not significantly different between the subset groups. Note: When engaging in a pretest activity would affect posttest performance and bias the results, the MLE model would not be an appropriate choice (i.e., as in the Butterfly videogame with pretest learning/practice effects due to playing Set 1). Tables 3A–D list the Descriptives for the all of the main dependent variables in the study, Table 3A lists those for the “I like Science” question.

Table 3A. All Descriptives. “I like Science” Descriptives for the four conditions at three time points.
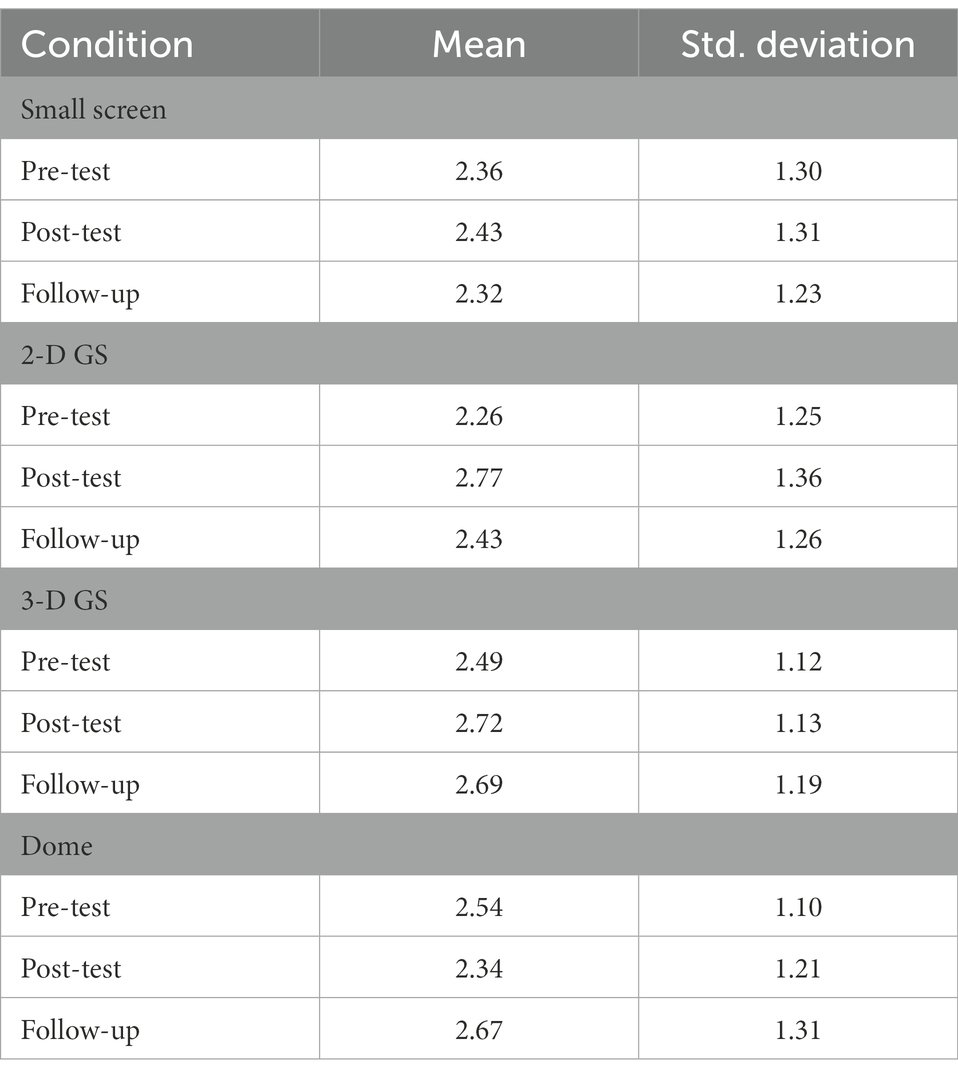
Table 3B. “I would Like to Be a Scientist” – Descriptives for the four conditions at three time points.
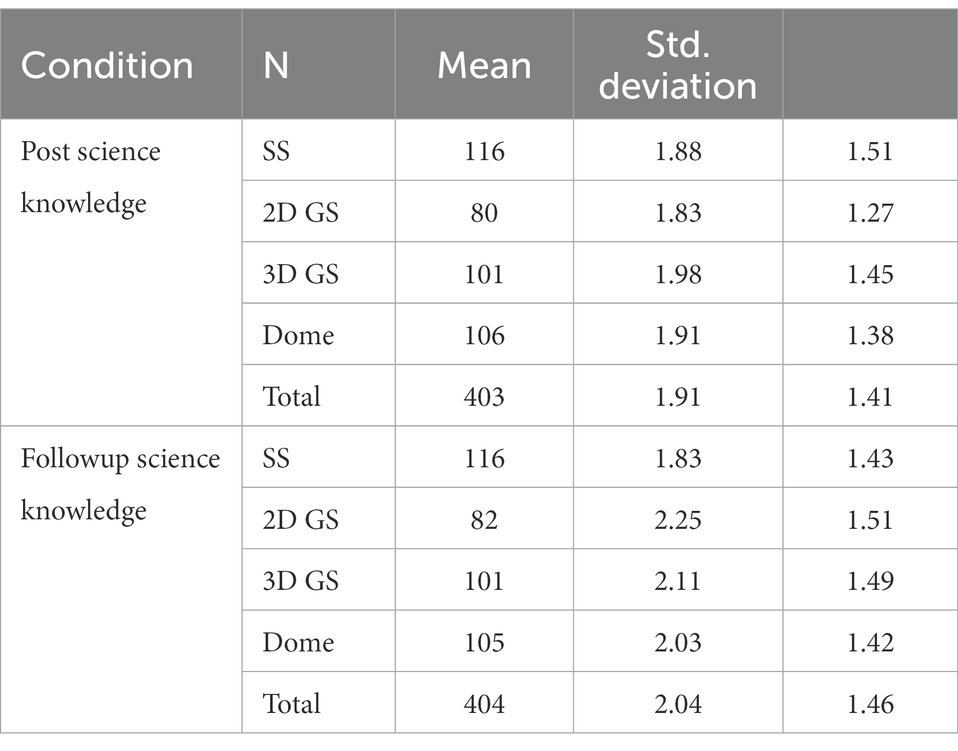
Table 3C. Descriptives for posttest and followup natural section science knowledge.
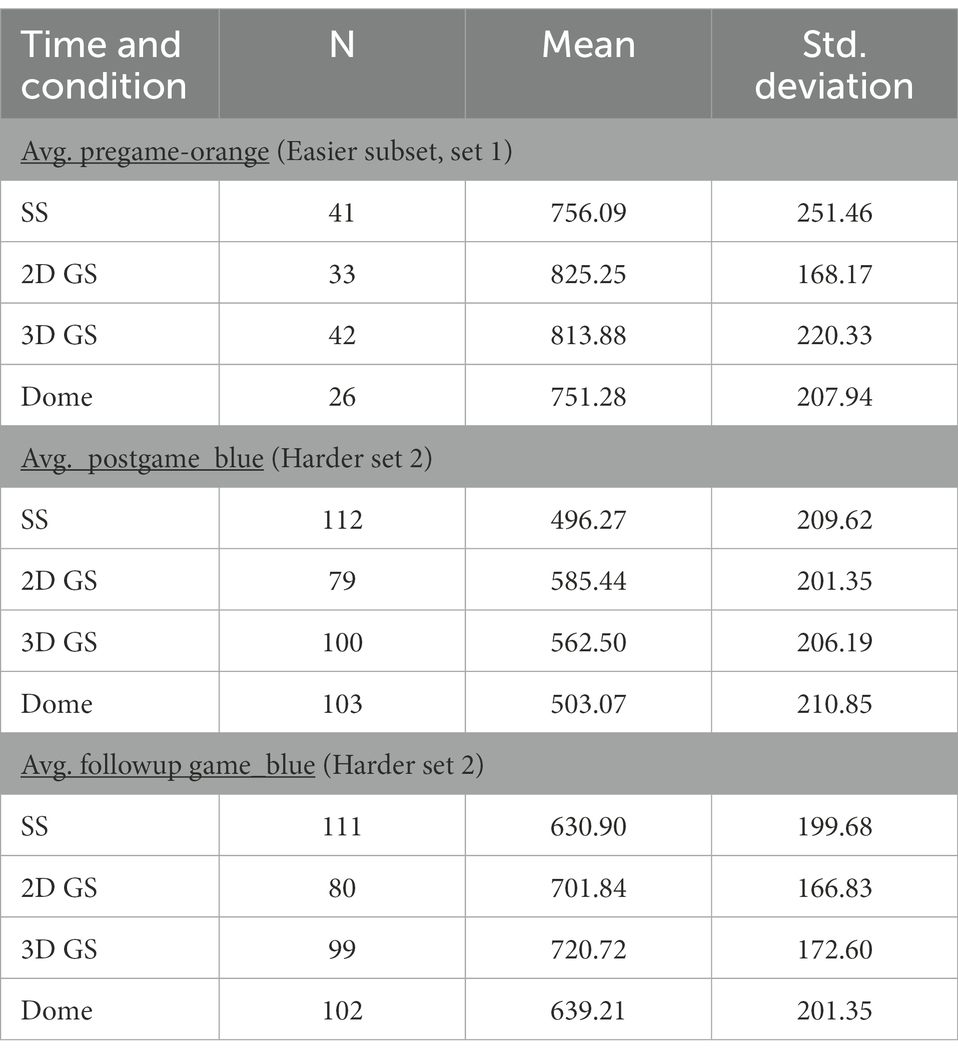
Table 3D. Descriptives of gameplay.
The MLE ANOVA revealed that time and condition were significant factors, but the time by condition interaction was not significant, see Table 4 and Figure 5.
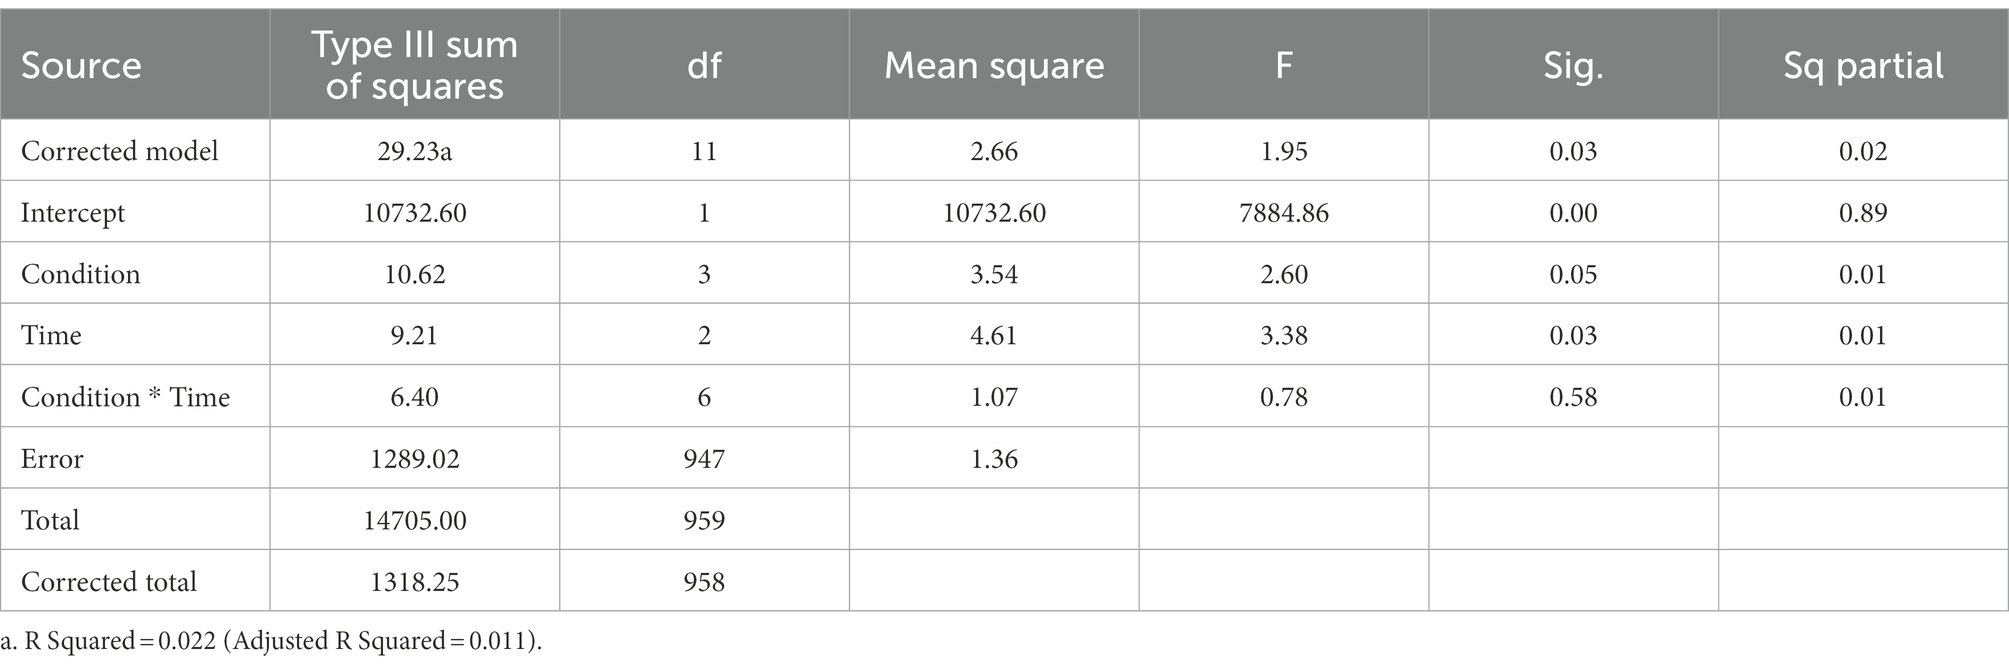
Table 4. “I Like Science” MLE univariate tests.
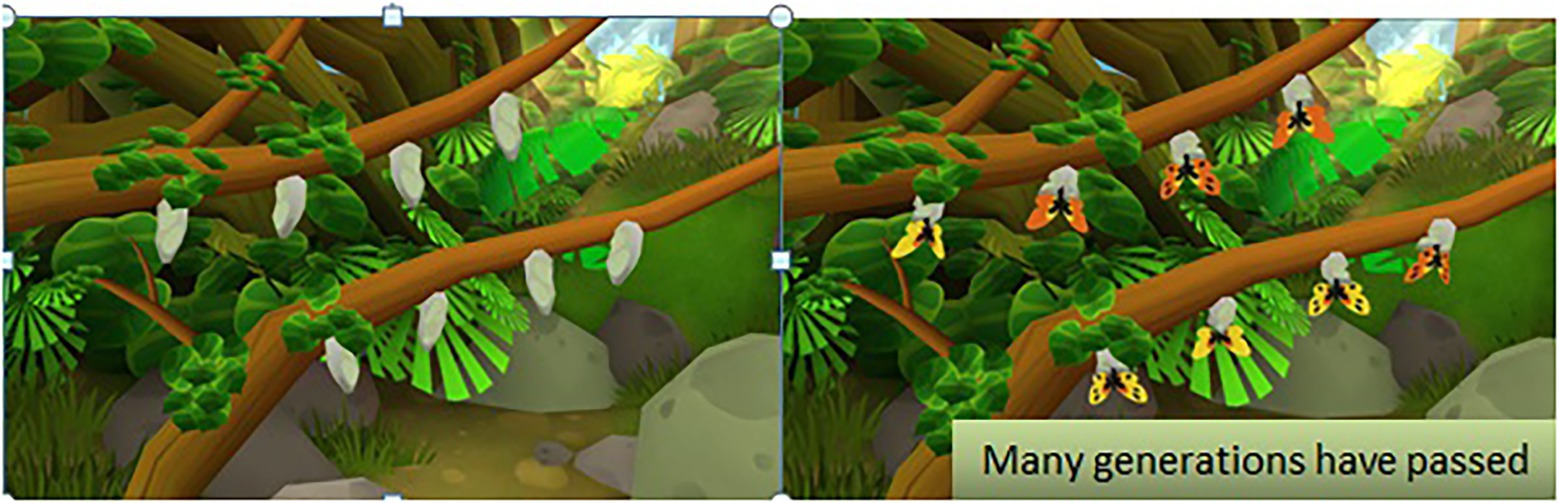
Figure 4. The cutscene between levels.
On average, all conditions decreased in liking science after watching the movie. At followup, the conditions were holding steady except for the Small Screen condition which decreased even further.
Small Screen compared to more immersive formats. An ANOVA comparing the Small Screen response at followup to the average of the three other conditions revealed that Small Screen was significantly lower than the larger screen formats. The Small Screen condition apparently liked science significantly less than the three larger more immersive conditions 2 months after viewing the film.
I Like Science – Gender analyses.
As had been predicted, at pretest there were no simple gender differences in liking science for the smaller subset, F (147) < 1.5, N.S. An MLE analysis with the fullset revealed there was a significant effect for Condition, Time and a significant 2-way interaction for Gender by Condition. Table 5 shows the results.
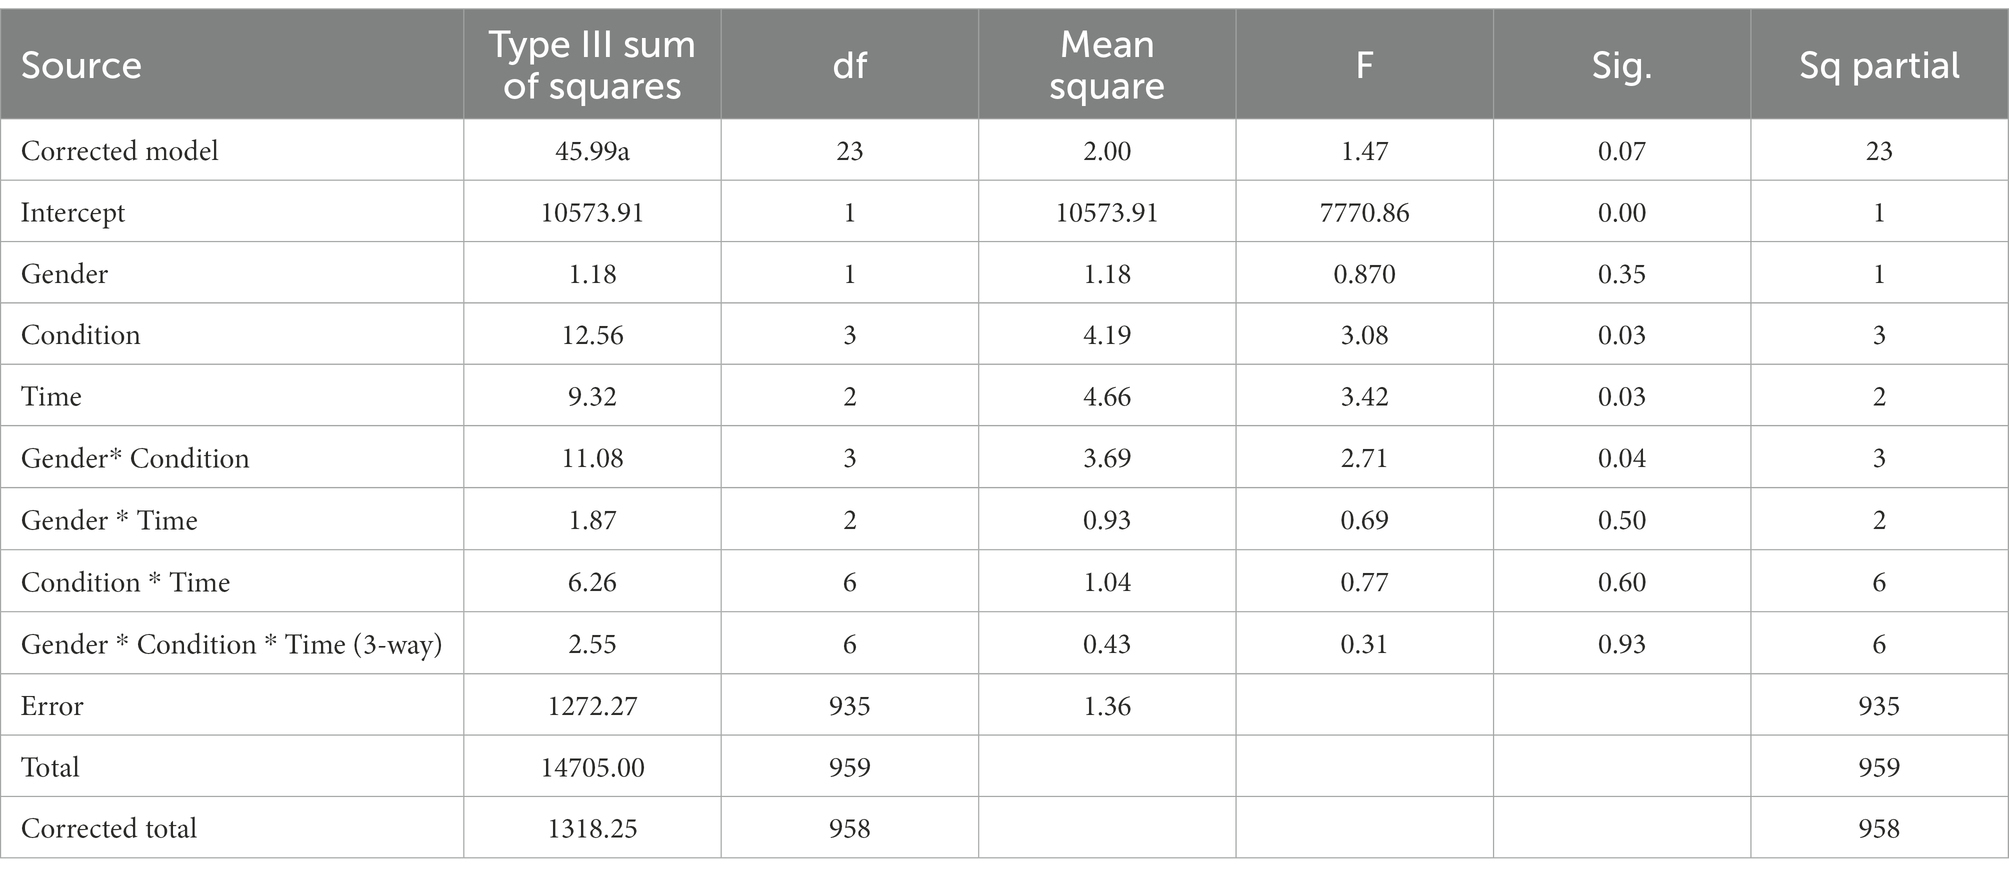
Table 5. I like Science – gender by condition analyses.
Figure 6 shows the females dropped from pretest to posttest in liking science (except for the very low Small Screen condition, that rose somewhat). However, by followup, the more immersive 3D Flat and Dome are starting to rise again in liking science while the lower immersivity conditions of Small Screen and 2D Flat are falling again. Figure 7 shows that the males basically, monotonically dropped from pretest to posttest to followup in liking science. In the discussion section, we explore social desirability effects when youth answer science identity questions at science centers and museums and why there may have a been a drop post-viewing.
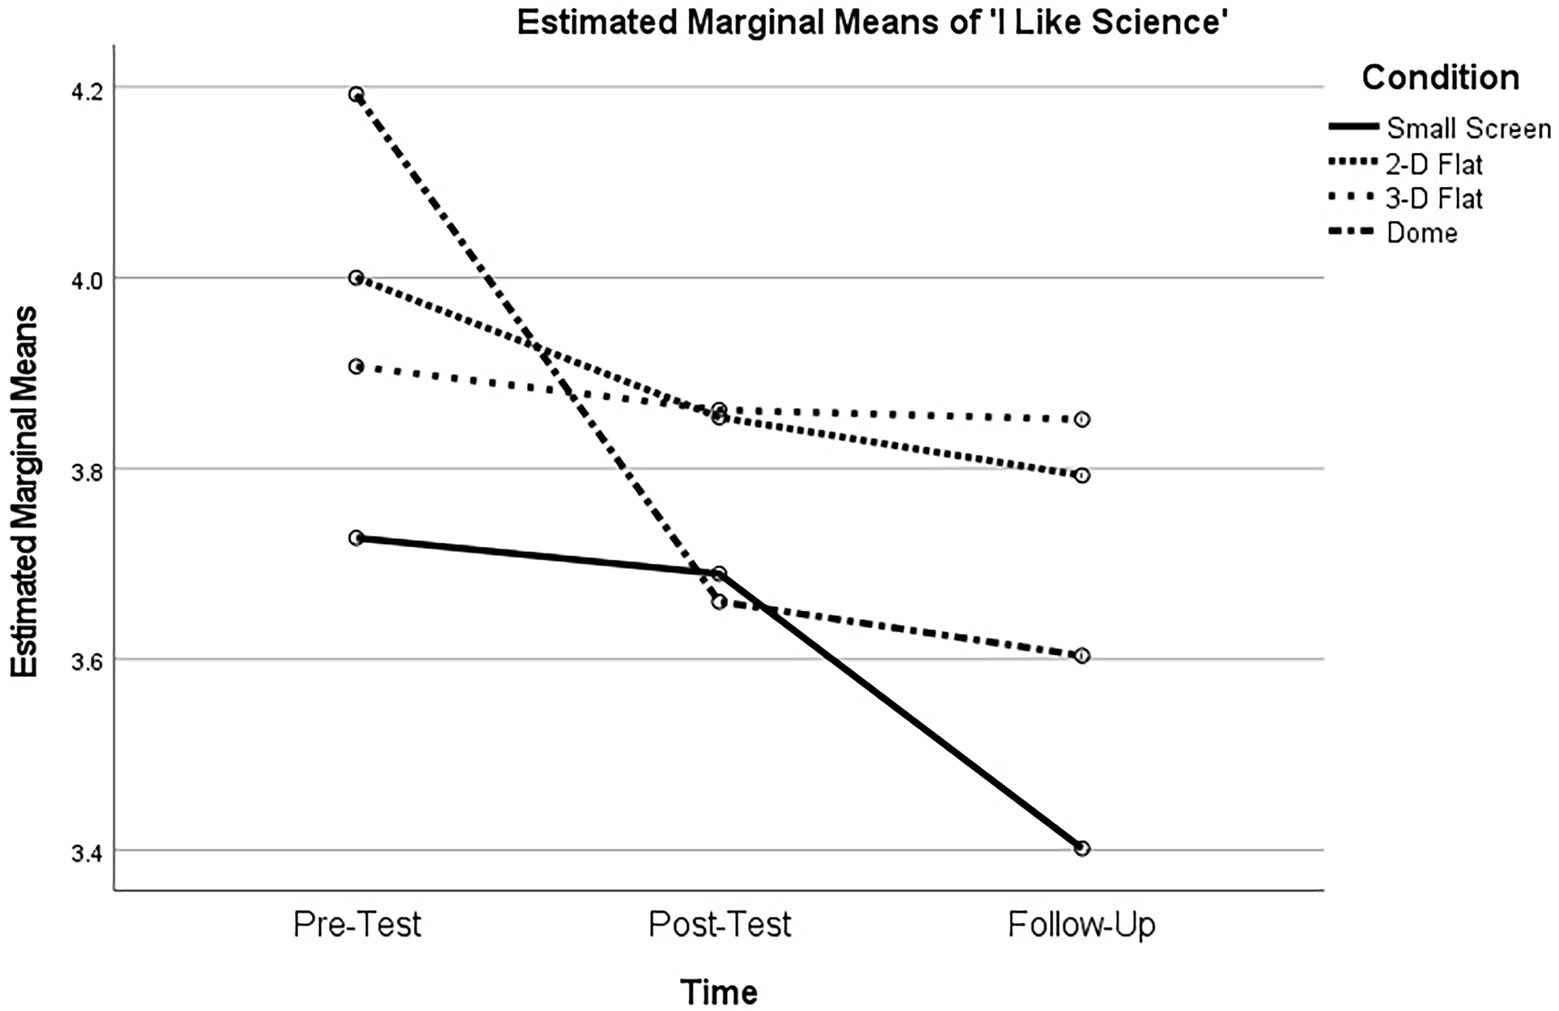
Figure 5. “I like science” question performance for the four groups.

Figure 6. “I like science” performance for the females only.
Science identity – Be a scientist
The question, “I would like to be a scientist when I grow up” is a somewhat different question from liking science. Although, at pretest these two questions correlated significantly, they account for only 19% of the variance in a linear model. The pretest subset of conditions was matched, F (147) < 2.00. Table 3B includes the Descriptives for I Would Like to Be a Scientist.
An ANOVA revealed that significant differences between the conditions were seen at posttest, F (4, 459) = 3.24, p < 0.05, and at followup. At posttest, the conditions have moved in their desire and the only condition decreasing was Dome. There were significant differences between 2D Flat and Dome, p < 0.02, and 3D flat and Dome, p < 0.03. Although by followup, those differences disappear (a similar pattern to the “Like Science” question). At followup, those who were in the Small Screen condition are less interested in being a scientist compared to the average of the three groups in the most immersive 3D and Dome platforms (Table 6).
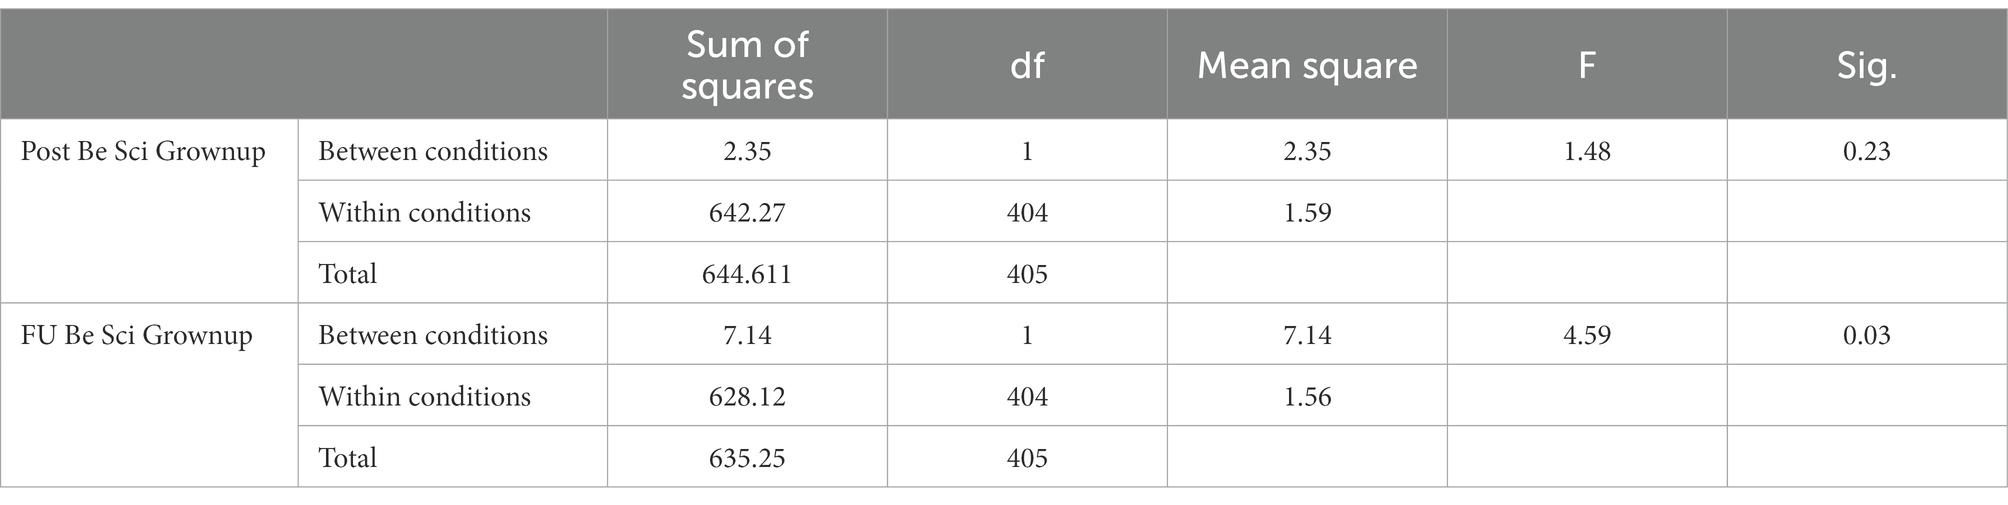
Table 6. Be a Scientist – Small screen to more immersive formats.
Figure 8 reveals the patterns.
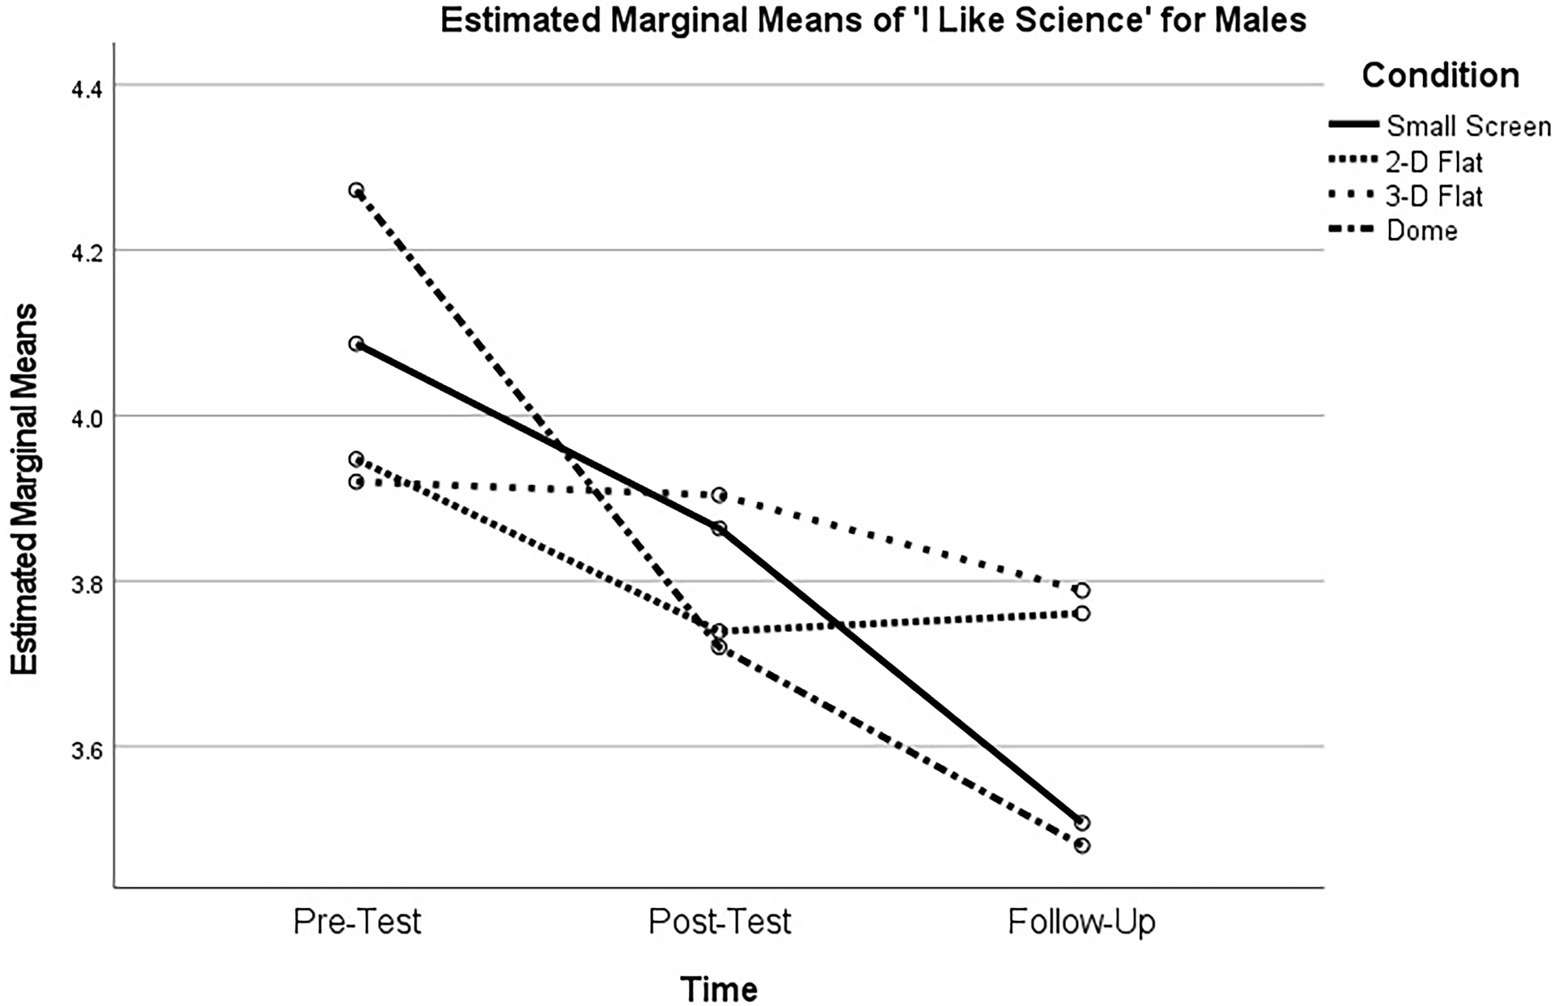
Figure 7. “I like science” performance for the males only.
Table 7 shows the ANOVA results for small screen compared to the average of the three giant formats.

Table 7. Be a Scientist – MLE analysis with time, condition, and gender.
This targeted ANOVA supports the notion that by followup those who saw the giant format screen versions would like to be a scientist significantly more than those who saw the Small Screen version, F (1, 405) = 4.59, p < 0.03.
Be a scientist- gender analyses
At pretest, there was a significant gender difference in the subset in wanting to be a scientist F (147) = 4.01, p < 0.047. At pretest, males wanted to be a scientist more than females: Males, n = 78, M = 2.59 (1.22): Females, n = 70, M = 2.20 (1.14). An MLE analysis found a trend for a Condition effect and a significant 2-way interaction for Gender by Condition. Table 7 reports the ANOVA results.
Figure 9 shows that for males, only two male conditions increased in wanting to be a scientist: the flat screen 2D and 3D giant screen conditions. Interestingly, for the males at followup, all males scored close to and clustered around 2.50 regardless of screen condition. For the females in Figure 10, those same two conditions (2D and 3D giant screen) increased at posttest, while the Dome condition decreased. For females at followup, the most immersive conditions of 3D Flat and Dome actually wanted to be a scientist more than the females in the less immersive conditions.
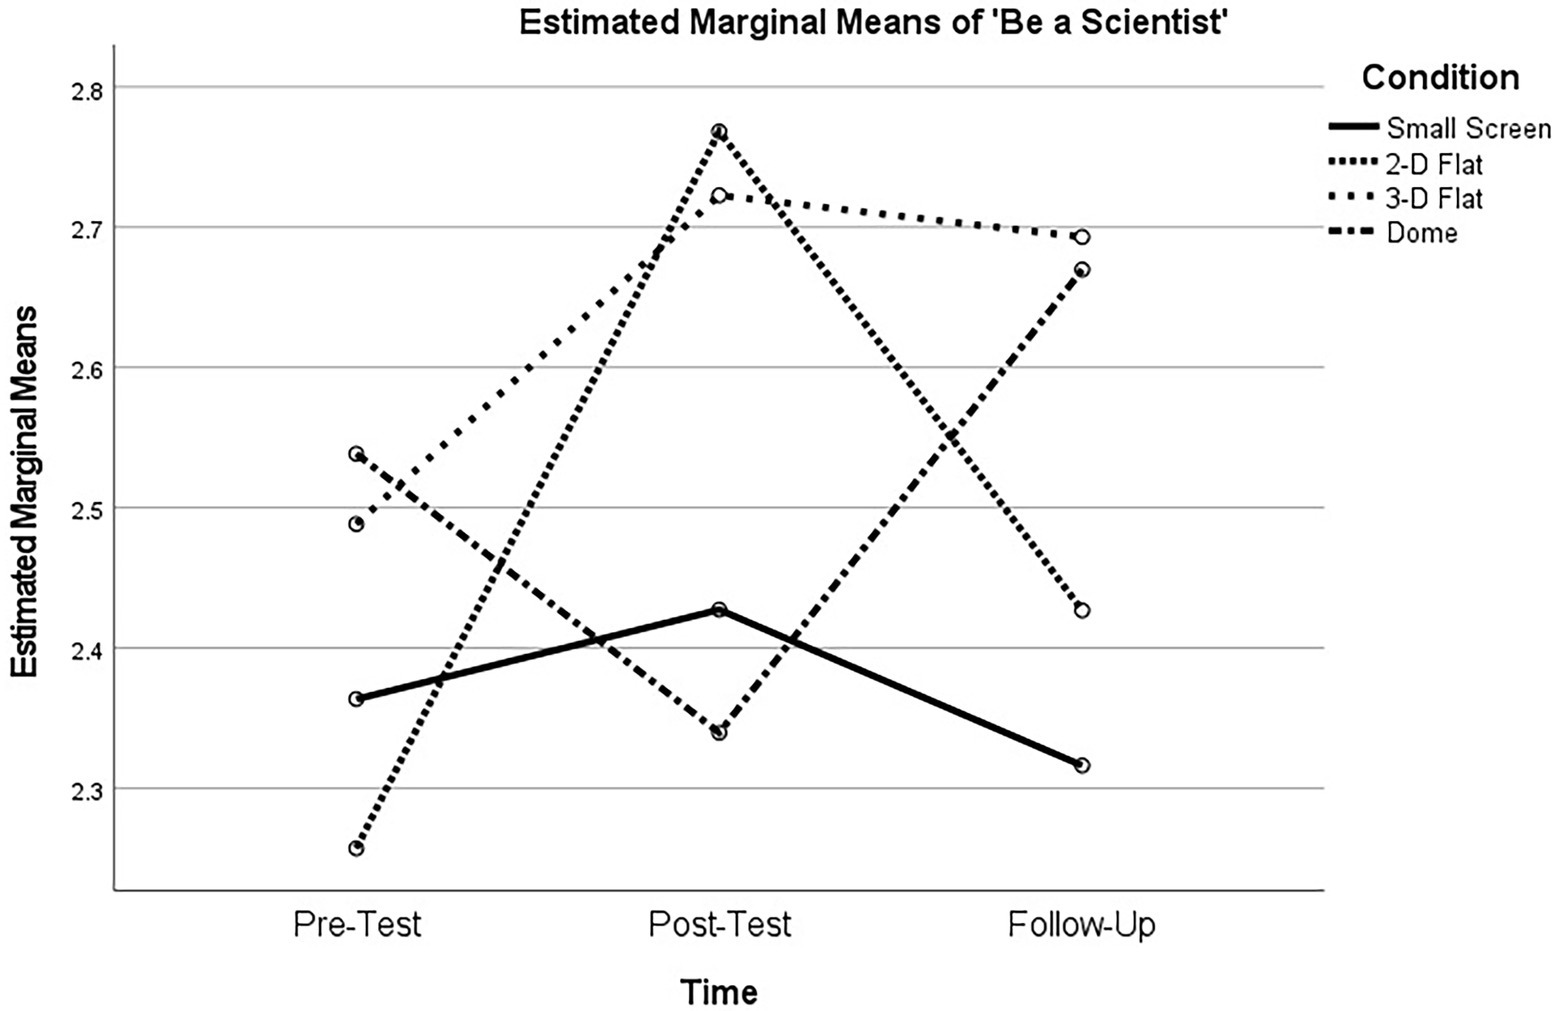
Figure 8. “Be a Scientist when I grow up” performance for the four groups.
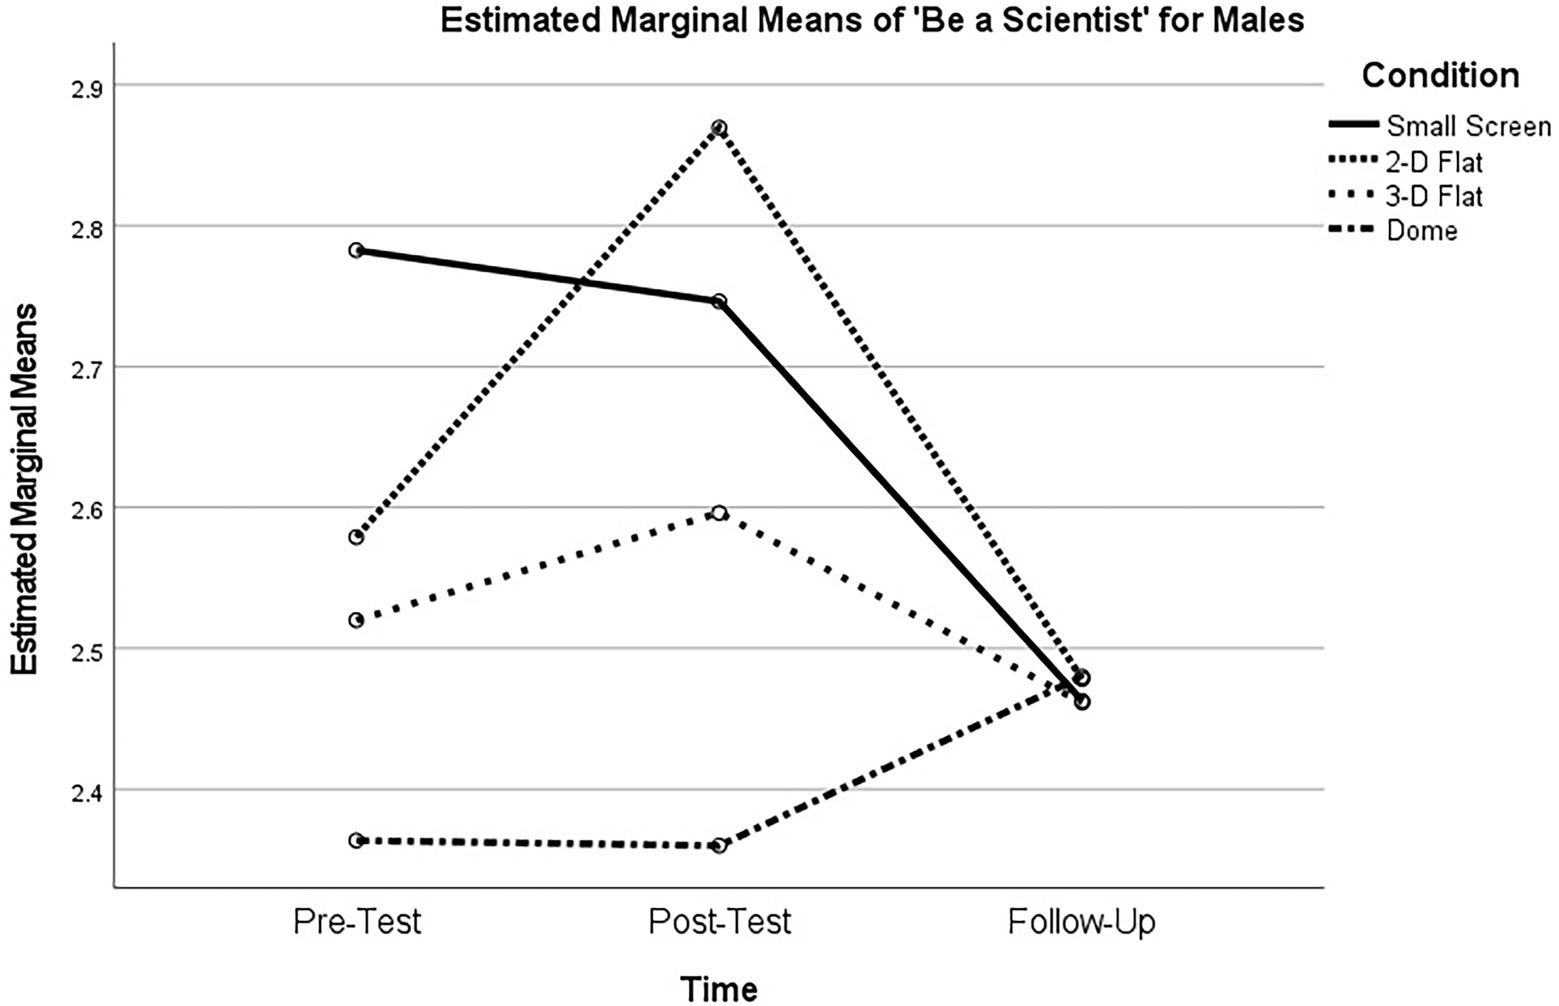
Figure 9. “Be a scientist” performance for the males only.

Figure 10. “Be a scientist” performance for the females only.
At Followup, the males showed little variability in wanting to be a scientist while the females showed more variability, and that apparently appears to be driving the significant interaction at followup because the two most immersive conditions were much higher (Female 3D M = 2.94; Female Dome M = 2.84, while the females in the two less immersive conditions stayed below the Male’s Mean of 2.50). This appears to support the previous finding seen in adult females who viewed an entertainment 3D film, they were more affected by the 3D format than the males (Salmimaa et al., 2009).
RQ 2 –Science knowledge
The science knowledge variable was created by summing the science questions delivered on the tablet: (1) Which butterfly disappeared?; (2) Why did it disappear? (open response); Did it want to disappear? (multiple choice), Max = 6. The four subset conditions were matched at pretest on science knowledge and did not significantly differ, F < 1.50, N.S.
Repeated measures general linear model
GLM was used and a two-factor repeated measures analysis revealed that the gain from pretest to posttest (for the smaller subset) was significant for all four conditions, F (1,141) = 4.43, p < 0.04. A pairwise post hoc analyses did not reveal any condition difference at posttest t < 1.00, N.S. Using all three time points of pretest, posttest and followup, a significant effect of time was seen, but still there was not a significant condition by time interaction. On average the more immersive conditions scored higher in a linear manner over time, the Small Screen condition dropped somewhat at followup. Table 3C shows the Descriptives and Table 8 the GLM analysis.

Table 8. GLM analyses for natural section science knowledge.
At followup, there was a trend for the Small Screen condition to perform worse than the average of the three large screens. F(1, 402) = 3.34, p < 0.068. The conditions were matched at pretest, but the subset sample was also run using an ANCOVA with the pretest as the covariate and the results remained the same.
Gender analyses. There were no significant gender interactions on science knowledge variable.
RQ 3 Natural Selection videogame performance – Catch a Mimic
Another type of science knowledge was gathered via videogame play with the Catch a Mimic videogame. Recall that the game was composed of a simpler orange set, called Set 1 and a more difficult Set 2 with blue butterflies. Only the easy Set 1 was used in the pretest and only a smaller subset of participants played that. For the four conditions in the smaller subset an ANOVA revealed that the pretest scores were matched. F < 0.1.0. Because only a subset of participants were exposed to Set 1 (orange) butterflies, it was determined that the orange Set 1 butterflies seen at Time 2 (posttest) and Time 3 (Followup) could not be analyzed due to a carryover effect. A regression revealed this to be the case – those that played the orange Set at pretest played significantly better at posttest. Using Time 2 (posttest scores Set 1) as the Dependent Variable and a dummy code for playing Set 1 at pretest, the effect of pretest play was significant on posttest play, t = 5.09, p < 0.001. Therefore, only Set 2 data with the more difficult, and novel-to-all, blue butterflies were analyzed; Set 2 was only given at posttest and followup.
Videogame participants
There were 13 participants who scored 0 on multiple game levels. These participants may not have understood the instructions, or they may have decided to not take the game seriously. Experimenters reported that some students said out loud they wanted to just “capture every butterfly, that’s fun.” Scores started at 0. With a correct tap on a non-poisonous butterfly +50 was added, with an incorrect tap −50 was deducted. The score was constrained to never go below 0. With 40 butterflies, the maximum score was 1,000. To achieve a level score of 0 twice in a row, a participant would have to either tap on every single butterfly, tap on more poisonous than non-poisonous, or tap on none and let the timer run out. All of those scenarios evidence nonstandard and problematic gameplay; inclusion of those data would only add noise to the analyses. Those players were deselected from the gameplay analyses. The condition affiliations for the deselected participants were: Small Screen = 7, Giant 2D = 2, Giant 3D = 2, and Dome = 2. A chi square nonparametric test revealed that no students were deselected significantly from any one condition, X2 (3) = 4.86, p = 0.303. Technical difficulties in transferring the scores from the tablets were also encountered and the final total of participants with posttest and followup Butterfly videogame scores was 392.
Videogameplay and science knowledge correlations
Pearson correlations were run on the average Set 2 scores on the posttest and followup science knowledge variables: posttest gameplay score correlated significantly with posttest science knowledge scores, r (384) = 0.20, and posttest gameplay score correlated significantly with follow-up science knowledge scores, r (384) = 0.26, both p < 0.001. Therefore, gameplay score is significantly predictive of science knowledge. Finally, posttest gameplay score is significantly predictive of follow-up gameplay score, r (384) = 0.54, p < 0.001.
Videogameplay performance at pretest
Pretest was analyzed with the smaller subset of players. The four conditions were matched at pretest, F (138) < 1.50 N.S. Table 3D shows the Descriptives across the three time points.
Table 9 with ANOVA results reveals that at posttest and followup the conditions differed significantly when using all participants on the Set 2 data.
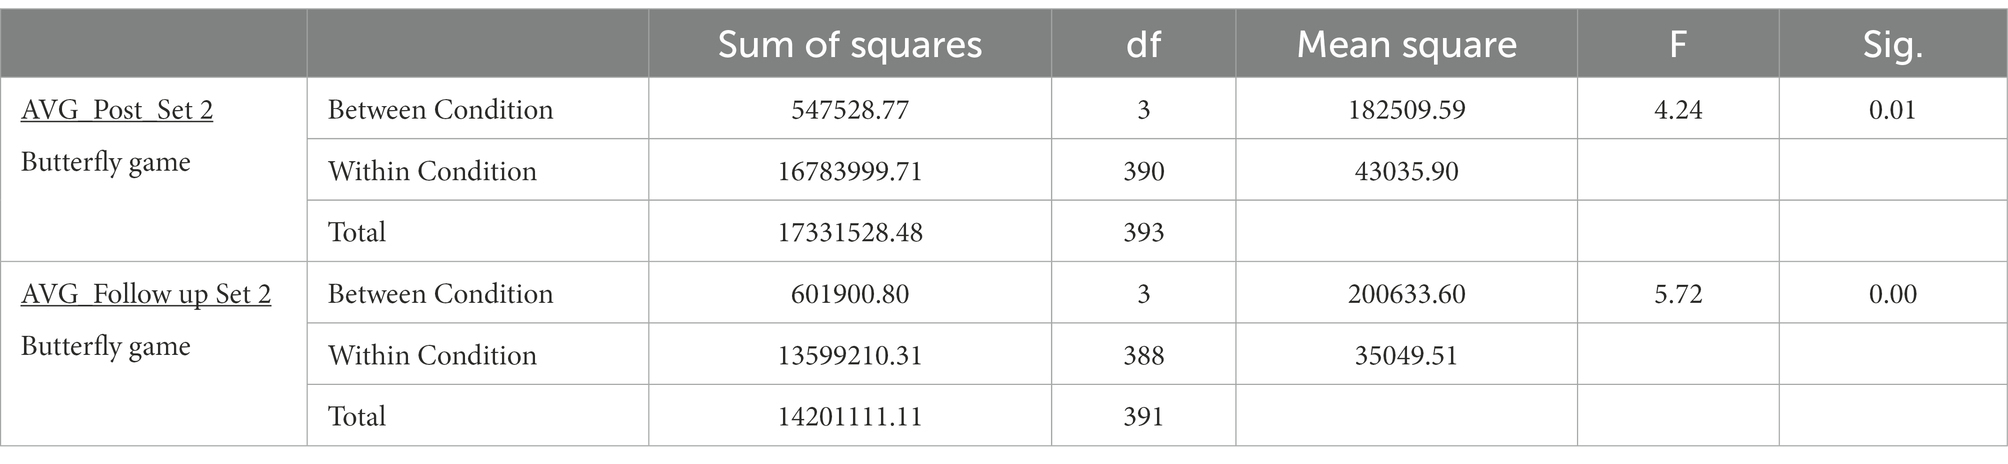
Table 9. Butterfly Game – ANOVA results of post and followup play.
The pattern is as follows, the two large screen conditions that viewed the content not on a curved Dome screen performed significantly better on the natural selection game after the film and at followup. So, 2D GS and 3D GS outperformed both the Small Screen and the curved Dome conditions. Table 10 lists the p values for the significant LSD pairwise comparisons.
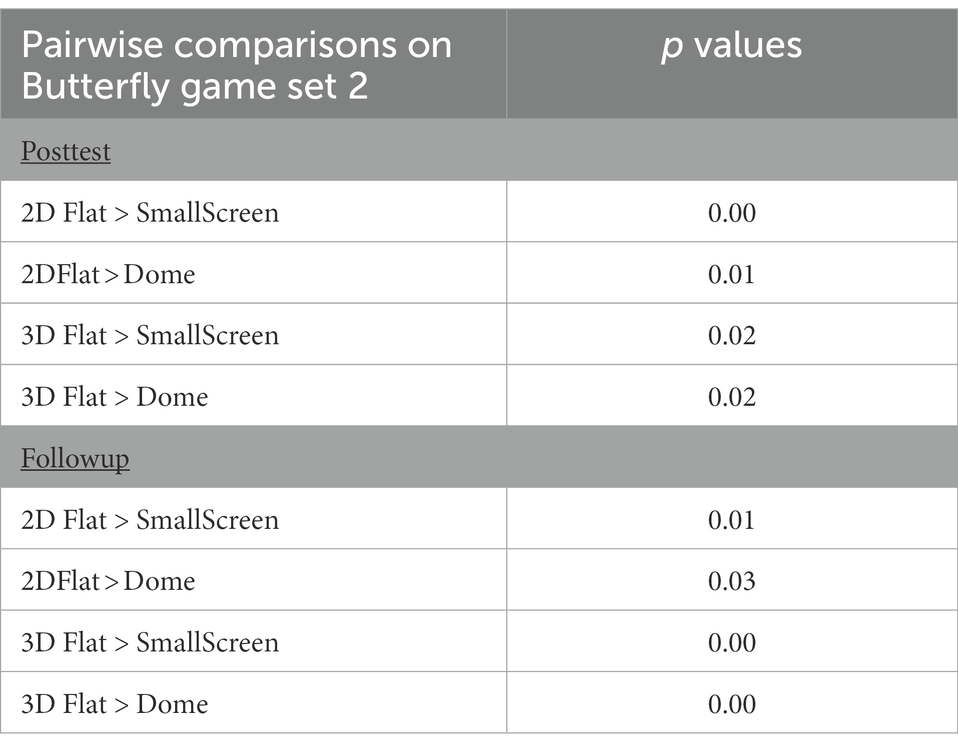
Table 10. Conditional pairwise comparisons on the Butterfly gameplay for posttest and followup.
RQ 3 Videogameplay and gender analyses
At pretest, using the smaller subset on Set 1, 53% of the players were male. There were no gender differences at pretest for the subset of students playing, F < 2.0, N.S.
For the posttest and followup fullset data (N = 392), again it was the case that 53% were male. At posttest, there were now significant gender differences, F (1, 392) = 6.15, p < 0.014; however, these results favored the females, Female M = 560.01 (193.50) vs. Male M = 514.20 (216.74). At followup, the same pattern held with the difference still favoring the females, F (1, 391) = 5.83, p < 0.016: Female, M = 693.00 (177.88) vs. Male, M = 647.95 (199.31). This had not been predicted. The gender by viewing condition interaction was not significant, F < 0.40.
Discussion
RQ1 – Identity – I like science
The question of “liking science” had not been predicted to decrease between pretest and posttest. Indeed, we were skeptical that one film would have much impact on liking science. We have not seen research with a short film as an intervention embedded within three time points for liking science. We agree it would have been better to have more questions on science identity, we also think it is important to put the Means and Effects Sizes of unexpected and null results out into the literature.
Research on liking or enjoying science is usually asked at one time point. One example is the Glynn et al. (2009) Science Motivation Questionnaire study wherein they assessed the construct validity of the motivation questionnaire with college-age non-science majors. The questionnaire’s first query is, “I enjoy learning the science.” They found that (in 2007) non-science major males and females reported the same level of motivation to learn science. An exploratory factor analysis confirmed that the “enjoy science” query fell under the largest of the five dimensions for learning science, i.e., intrinsic motivation/personal relevance. Our population of 5th graders included a mixture of some students who would presumably go onto become science majors. Research on science identity trajectories over time are limited and they usually start with older students; such research “largely focuses on a select group, namely college students. A few studies chart science identity development during high school and for individuals who do not attend college.” p. 2396 (Puente et al., 2021).
We have also not seen a three time point, science identification query for 5th graders that started at a science center/museum and ended up in the students’ classroom. We hypothesize that location of the test may influence response. One reason for the “liking science” decrease from pretest to posttest result may be that at pretest there were situational and social desirability effects that influenced the children when they first arrived at the science centers and museums. The children were bussed on field trips. They were excited to be in a new environment and they were surrounded by adults whom they (appropriately) assumed “liked science.” These students may have felt they were supposed to like science as well. This sort of location-based social desirability effect may be caused by impression management (IM; Lautenschlager and Flaherty, 1990), which is a conscious action. The students may have been biased in wanting to upgrade others’ impressions of them; IM in surveys is known to be influenced by contextual factors (Lautenschlager and Flaherty, 1990). Given that the pretest “like science” scores were perhaps inflated, it appears that a meaningful decrease occurred; however, it may be the case that posttest scores are the truer, more reflective scores representing students’ affect of liking science (albeit potentially mixed with platform viewing effects). A recent meta-analysis on pro-environmental activities (e.g., reported recycling) showed that even though social desirability effects may be small (0.08 to.13), such effects should not be completely disregarded by psychologists as potential confounders (Vesely and Klöckner, 2020).
We further hypothesize that by posttest, when queried for a second time, some of the social desirability effects would have attenuated since the students were becoming acclimated to the environment and the testers over the intervening 1.25 h. If we consider the posttest measurements to reflect more accurate scores, then we also must take into account that those scores could potentially have been influenced by film viewing condition. If reduction of social desirability is occurring at the same time that condition is effecting “liking science,” then the slope of interest may not be from pretest to posttest, but from posttest to followup. Followup testing occurred back in the students’ 5th grade classrooms, so there would be even less of a prime for impression management with the final followup scores. The posttest to followup slopes in the three more immersive conditions were stable, and only the Small Screen condition further declined after 2 months. The final ANOVA showed that on average, the participants in the three giant screen formats did not significantly change in liking science from post to followup; however, those who saw the film on the Small Screen decreased significantly in liking science over 2 months. Perhaps watching an adventurous science film on larger and more immersive formats encouraged students to continue liking science even 2 months after viewing. In conclusion, we stress that it is difficult to generalize about “liking science” from an experience with one film.
RQ1 – Attitude – Like science by gender
The male “like science” scores basically decreased monotonically from pretest to posttest to followup. The females also decreased from pretest to posttest (again, perhaps reflective of the social desirability effect for both genders). Interestingly, for the females only, by followup the more immersive 3D flat and Dome conditions are starting to increase in liking science while the two less immersive conditions continue to decrease for the females. It may be that upon reflection after 2 months of time, the females in the more immersive formats were influenced by that immersivity to be more positively inclined to liking science. The results for an immersivity effect at followup are being driven by the females and not the males. A previous study (Salmimaa et al., 2009) showed that females were differentially affected by viewing a 2D versus 3D film. These results suggest that the two highest immersion conditions of 3D and Dome were associated with a positive and upward inclination from posttest to followup for females only in liking science.
RQ1 – Attitude – Be a Scientist
The second attitude question addressed whether students wanted to be scientists when they grew up. The Small Screen and Dome conditions were the lowest at posttest in wanting to be a scientist. Again, due to social desirability effects, it may be more accurate to take the posttest score as the true score and look at the difference from posttest to followup. The time variable in the models was not a significant simple predictor, nor was it predictive in an interaction with condition and gender. However, at the followup time point, the three more immersive conditions increased in their desire to be a scientist. The hypothesis is that, on average, students who saw the three giant screen formats may have been more moved by the experience and it may have altered their desire to be a scientist. Perhaps with reflection, students in the more immersive giant screen conditions were able to relive and retain some of the interest and excitement felt during the viewing of the film? The next question is whether this was the same for males and females.
RQ1 – Identity – Be a scientist by gender
When the conditions are split by gender, we see that Small Screen females started the lowest in their desire and stayed low at all three time points in their desire to be a scientist; however, the males in the Small Screen condition actually started at the highest point at pretest, but they dropped steeply at both post and followup. The males seemed to more affected by the lowest immersivity condition compared to the females. Intriguingly, all males at followup showed little variability by group condition, all conditions clustered around 2.5. While the females varied by condition at followup and in the two most immersive conditions (similar to the previous variable of “liking science” the 3D and Dome), the females reported averages higher than the males for a desire to be a scientist. Per the Salmimaa et al. (2009) study, there is some evidence that higher immersivity affects females differently. In that study, the females in the 3D condition reported significant differences for deeper feelings of “psychological immersion” and engagement; they reported that the females concentrated more on the movie and that everything in the virtual world looked “more real and vivid,” compared to the males in that study. Apparently females in those two more immersive viewing groups were not negatively affected by in wanting to be a scientist seeing a male protagonist.
RQ 2 – Science knowledge
There was a significant linear effect of time for all four viewing conditions, showing that at posttest and followup all had learned more about natural selection. There were no significant conditional interactions. At posttest, all four viewing conditions appear to increase in declarative knowledge on the science topic equivalently, with Small Screen retaining somewhat less after 2 months (a statistical trend). There had been no gender effects predicted, and none were found.
The prediction had been that those in the more immersive conditions would learn and retain more science knowledge. In the Price et al. (2014) study, they hypothesized that viewing content in 3D “has limited benefit when used with simple visualizations and tasks. It is best used for more complex and demanding situations. Stereoscopic films can expose the audience to a longer interaction with an object by fluidly showing it from many angles and with many different relations with its surroundings.” This leads to questions regarding content fit and format. The science content learned in the Amazon Adventure film was not particularly multidimensional in its nature, thus it may not have been a good “fit” for the multidimensional format. Examples of multidimensional STEM phenomena include electromagnetic waves and protein folding. There is a call for designers and creators to design content that is enhanced by the format’s affordances using 3D media (Johnson-Glenberg, 2018, 2019) and in augmented reality (AR) as well (Radu and Schneider, 2019). If a 3D film might leave a more accurate and lasting image of “a highly spatial scientific object” (Price et al., 2014), then the content of the film should highlight the multiple dimensions of objects and content in the film. We note that STEM-detail 3D effects (e.g., panning around the entire butterfly) were not in the current film.
The film was more of a biography than a traditional STEM education production. The hazards and joys of collecting specimens were highlighted, and perseverance was a theme throughout, but explicit instruction of certain science topics occurred infrequently. Again, there is one specific passage where Bates does a “think out loud” as he realizes that one species has evolved to mimic another. We see an overlay on the screen of both the mimic and model butterfly species, but it is not a dynamic 3D shot. One prediction had been that in the more immersive and especially 3D scenarios, the overlay and the detail in that scene would have resonated (been encoded) differently depending on audience viewing condition. Significant effects on comprehension of natural selection and mimicry were not unearthed, at least not with the more traditional, text-based format of assessment. Perhaps conditional knowledge differences would emerge when measured with a more visual and gamified assessment?
RQ3 – Performance on the natural selection videogame
At pretest, the groups in the four viewing conditions (smaller subset) played similarly in the game. However, after viewing the film, significant conditional differences emerged. At posttest and followup, all students warmed up playing the easier orange Set 1 of butterflies. Analyzing only the more difficult Set 2 performance, it appears that the two flat giant screen conditions performed significantly better at both posttest and at followup. All conditions improved the second time they played Set 2 at followup, but the two flat giant screen conditions (2D and 3D) maintained their leads. The pattern can be explained as follows: students in the two large screen conditions that viewed the content not on a curved Dome screen, or a small screen, performed significantly better on the natural selection butterfly game after the film and on the two-month followup test. We are not certain why the Dome condition was not as positively affected as the two other giant screen conditions since Dome is considered to be the most immersive. For some students there may be an inverted U shaped function across levels of immersivity for learning in a large curved Dome? Anecdotally it has been noted that very large Domes can sometimes feel too engulfing and intense.
RQ3 – Butterfly tablet game performance by gender
At pretest with the smaller subset, there were no gender differences. It had been predicted that males would play better because, on average, males spend two to three times more time per day on videogames than females (Greenberg et al., 2010; Rideout et al., 2010; Twenge and Martin, 2020). We had not expected that the females would perform better on the tablet videogame compared to the males at both posttest and followup. This suggests that we designed a game that was appealing to both genders, but especially for the females.
Gameplay takeaways
When designing assessment games, it is important to pilot test frequently with the appropriate age group. There were multiple pilot iterations on the butterfly test at a local middle school with mixed gender 4th and 5th graders. After each playtest, the design team learned how to enhance the game mechanics and test sensitivity on the measure, e.g., how to more appropriately level up the difficulty, adjust the flight time of the butterflies, decrease the amount of distractors (e.g., there should be no falling leaves onscreen, etc.). We believe the game was, therefore, well-calibrated for 5th graders. Although there was a timer of 1 mins for capturing the butterflies in each level, this did not feel like a ‘twitch-style’ game (a typical fast, shooter-style game). A recent survey showed that only 7% of young females play shooter games (Yee, 2017). Females tend to play more puzzle and world-building games, 69% female (Yee, 2017) and they prefer some strategy. A survey by Greenberg et al. (2010) with 141 female 5th graders revealed that the “traditional” games were their favorites (e.g., classic board games, puzzles), and they least preferred what are called “physical games (Sports, fighters, shooters, and racing/speed genres).”
It appears that the students in the two giant screen (non-curved) formats did better on this natural selection game post-viewing. Students in the immersive giant screen format of Dome did not perform as well and it may be that there is something overwhelming about the most immersive experience that may somewhat attenuate knowledge acquisition when that knowledge is embedded in an ‘adventure’ film. Meshing action/adventure with learning science content in a very immersive format may affect learning in ways that are not well understood – that is, there may be a film genre by content by platform interaction. Future research could focus on a narrative vs. expository genre comparison, and consider crossing those studies with film viewing platform.
Gamification of assessments
The butterfly game was designed to assess a different “type of deductive learning,” one that would not be contingent on declarative recall. It was also designed to be an engaging proxy for traditional knowledge tests. The gamification of educational assessment (Arena and Schwartz, 2014; Johnson-Glenberg et al., 2015; Shute et al., 2020; Zainuddin et al., 2020) and job-based skills assessment (Armstrong and Landers, 2018; Landers and Sanchez, 2022) is a growing field. Designers need to be cognizant of the gender differences in game preference, and potentially, gender differences in expertise in a certain types of play. The highly visual and interactive butterfly gameplay correlated significantly with the more verbal and declarative science knowledge measure in this study, but there was still a large amount of unexplained variance. Using a more engaging format to assess knowledge may help some students, especially those with test anxieties, to stick with the task. The assumption is that the butterfly game was more engaging because multiple children asked to play the tablet game again, and we never heard that request at the end of the more traditional paper tests [additionally, previous RCT research from our lab shows that adding a game component makes a STEM learning task more engaging (Johnson-Glenberg and Megowan-Romanowicz, 2017)].
If the butterfly game were measuring the exact same knowledge as the more verbal and declarative test then one would expect to see more variance accounted for (beyond 4%) and to see the same group-wise, conditional performance. However, on the more verbal science knowledge test, the Dome condition performs on par with the two other Giant Screen conditions (see Table 10), whereas on the butterfly game, the Dome condition performed significantly worse compared to the 2D GS and 3D flat GS conditions. So, the butterfly game must be tapping into some different constructs. The butterfly game is a multi-faceted task and may be tapping into constructs more aligned with general intelligence or g (Carroll, 1993). The term g stands for the general positive manifold, i.e., the all-positive pattern of correlations among diverse cognitive tests. It is generally agreed upon by researchers that multiple cognitive processes are part of intelligence and that the strongly correlated test performance seen over decades across multiple tasks is an emergent property of intelligence (Kovacs and Conway, 2016). Appendix C on game design lists some of the multiple mental and physiological components that must be activated to play our videogame well. Thus, the tablet gameplay on the butterfly assessment probably tapped into more divergent processes (e.g., perception, sensor-motor skills, etc.) than the verbal, more traditional natural selection science knowledge questions asked in a text-based, declarative manner. The butterfly videogame may overlap in assessing overall g and is not a pure, domain specific natural selection assessment. This is not necessarily a limitation, but it is something that should be highlighted if instructors or researchers wish to use interactive videogames like these in the future (especially ones with a motoric component like finger taps). Gamifying an assessment may increase engagement and motivation, but there can also be unexpected randomness in the method of play that children use – as seen with the few players who said they wanted to only “capture every butterfly” and did not play seriously.
Limitations
Differential post-viewing instruction
As with many real world intervention studies, it is difficult to determine if teachers covered more content on natural selection in the two intervening months from posttest to followup. We did not systematically query the teachers. Research shows that, in general, most teachers do little or no pre-trip nor post-trip preparation for science center visits (Cox-Petersen and Pfaffinger, 1998).
Truncated pretest N
This research is part of larger study with two arms. All of the variables analyzed in this article were administered in the tablet-based arm of the study. The first author could not prevail to get all students in the cohort pretested with the tablet. Where appropriate, Maximum Likelihood Estimations (MLE) have been used to make up for the loss in power. Nesting and sample size issues precluded running a Solomon design analysis.
Film genre or type
STEM learning (science knowledge) differences were not seen on the more traditional knowledge test. However, the film was not a traditional STEM education film, it was more narrative, more of a “bio-pic” compared to the usual expository science education format. This may have led to smaller learning effects than expected on questions about natural selection, and have made finding differential learning gains by condition even more difficult. The knowledge tests in this study focused on mimicry in natural selection, but there were no concessions in the film to showing mimicry in a particularly immersive or 3D manner. Thus, some of the advantages for seeing content in multi-dimensions (see Price et al., 2014) may have been missed (e.g., would seeing 3D animations of wing morphology changes across generation have made a difference?). We would be interested in seeing film genre or type (narrative vs. more expository) by viewing platform studies in the future.
Testing in the wild: Time constraints
We were only allowed time for very few test questions. The students were on tight bus timetable schedules, the busses needed to be back at schools long before class dismissal and on several occasions entire classes were not able to finish the posttests (data not included in this article). Due to these constraints test questions needed to kept to a minimum. Thus, only two science identity questions could be asked. Classic and straightforward questions were chosen: (1) “I like science” and (2) “Do you want to be a scientist when you grow up?” (Moore and Hill Foy, 1997). Future studies should include more science identity questions and several with reverse coding for reliability and validity reasons. It would be of interest to ask the questions before students get to the science center and then ask them again before viewing and after viewing the film. The last two times would be at the science center and analyses would answer our hypothesis about the impression management effect.
Videogameplay test sensitivities may be gender specific
This may not be a limitation, per se, but it did surprise the researchers that the 5th grade females outperformed the males on the videogame at posttest and followup. It is an important finding and serves to remind test designers that students (aka players) are not monolithic. Yee (2019) defines six major gamer player motivations, the first is called “action” and it is defined by destruction and excitement. This is strongest in males under the age of 18. Recall that 13 of the players scored multiple zeros and played anomalously. The percentage of students who performed atypically was small =3.2%; however, 12 of those were males (92%). More research should be done on the topic of player motivations, because if a test is designed to be a rigorous, gamified assessment, test designers need to know that certain game genres may come with hidden biases that favor one gender (or player-type) over another. It may also be the case that, on average, females in 5th grade are more advanced in some of the many components of general intelligence or g that the game tapped into.
Educational game designers need to be aware that certain genders favor certain game genres, and that players’ preference rankings change with age (Greenberg et al., 2010). If younger females prefer a puzzle-like strategy game (like ours) and younger males prefer action “physical” competition games, then does that leave the males at a disadvantage? One solution might be to create a second assessment game with the same content but in a different genre, for example, a more competitive slant on the game that is strongly time-delimited and highlights leaderboards? Perhaps students should be allowed to pick the genre or version they prefer at onset? This would be expensive and time-consuming to create two versions of one educational game, but it may set to rest questions of test validity and gender bias. Another solution might be to create one broad, multi-genre game for youth that embraced multiple gameplay components (e.g., role playing, strategy, competition, some embedded puzzles as well). But, a small n study suggests there is more to gender differences than game genre and time spent playing games; Tawfik et al. (2012) suggest that several human computer interaction (HCI) components like “concept interaction, sustained challenge, directions, and navigation” affect males and females differently. These need to be kept in mind as well and should serve as instructional design principles for future educational video games construction.
Conclusion
This study assessed how viewing a Giant Screen film affected multiple science variables of interest in 5th graders. Using three time points, pretest, immediate posttest and two-month followup, the strongest pattern seen at a high level was that the more immersive Giant Screen conditions of 2D Flat, 3D Flat, and Dome outperformed the Small Screen condition. This was seen on liking science, desire to be a scientist, and on certain gains in natural selection knowledge. Using a novel game-based natural selection test, two of the higher immersive conditions performed significantly better at posttest and followup: 2D Flat and 3D Flat. The tablet-based assessment game was engaging for users and correlated with the other science knowledge measure, but it also may also tap into more cognitive and attentional constructs associated with general intelligence, or g, that go beyond knowledge about natural selection.
Interesting gender interactions were unearthed. Females in the two most immersive conditions of 3D and Dome liked science significantly more and wanted to be a scientist more according to analyses from posttest to followup. Thus, delayed effects may occur for science identities after watching Giant Screen films, and level of immersivity may differentially affect females compared to males, with the effects being greater for females. It had not been predicted that the females would play the butterfly videogame significantly better than the males at posttest and followup, but there is some evidence that more males played in an anomalous manner (just tapping for fun without regard to score) and test designers should keep this in mind as more educational assessment games are being designed and used in an applied manner. There are potential interactions between game type and gender that should be accounted for in the future when designing and interpreting games as assessments.
In sum, for two of the three research questions, the Small Screen viewing condition performed significantly worse at followup compared to the more immersive giant screen formats (2D Flat, 3D Flat and Dome). Females reported more positive changes in science identities and these were seen in the more immersive viewing conditions. Implications for science centers are that immersive giant screen viewing may have delayed effects on science identity and those effects may be more positive for girls compared to boys. Giant and immersive screens can affect liking science and wanting to be a scientist more than smaller sized screens can. Using a computerized game assessment of natural selection knowledge (in this sample of 5th graders), girls in the two flat Giant Screen conditions outperformed the boys at posttest and followup. For this age group, it may be more meaningful and precise to report future gamified test results in terms of gender by game type interactions.
Data availability statement
The raw data supporting the conclusions of this article will be made available by the authors, without undue reservation.
Ethics statement
The studies involving human participants were reviewed and approved by Rutgers University. Written informed consent to participate in this study was provided by the participants’ legal guardian/next of kin.
Author contributions
MJ-G co-designed the study and helped to run participants, designed the videogame, created the test items and the data spreadsheets, helped analyze the statistics, and wrote the majority of the manuscript. MK helped to write the manuscript and edit. HO helped create the data spreadsheets and analyze the data. All authors contributed to the article and approved the submitted version.
Funding
The work was supported by the National Science Foundation 1423655.
Acknowledgments
This research could not have been done without Diane Carlson at the Pacific Science Center and Dr. Mary Nucci. The film in this article, Amazon Adventure, was made in partnership with SK Films and the Howard Hughes Medical Institute’s Tangled Bank Studios. The videogame assessment was made by The Embodied Games Lab at Arizona State University. Special thanks to James Comstock, Tyler Agte, and Jude Abishek Rayan.
Conflict of interest
The authors declare that the research was conducted in the absence of any commercial or financial relationships that could be construed as a potential conflict of interest.
Publisher’s note
All claims expressed in this article are solely those of the authors and do not necessarily represent those of their affiliated organizations, or those of the publisher, the editors and the reviewers. Any product that may be evaluated in this article, or claim that may be made by its manufacturer, is not guaranteed or endorsed by the publisher.
Supplementary material
The Supplementary material for this article can be found online at: https://www.frontiersin.org/articles/10.3389/feduc.2022.1096889/full#supplementary-material
Footnotes
1. ^https://www.nextgenscience.org/pe/3-ls3-1-heredity-inheritance-and-variation-traits
2. ^https://www.giantscreencinema.com/Awards/Past-Award-Winners/2017-Award-Winners
References
Alaraj, A., Lemole, M. G., Finkle, J. H., Yudkowsky, R., Wallace, A., Luciano, C., et al. (2011). Virtual reality training in neurosurgery: review of current status and future applications. Surg. Neurol. Int. 2:52. doi: 10.4103/2152-7806.80117
Arena, D. A., and Schwartz, D. L. (2014). Experience and explanation: using videogames to prepare students for formal instruction in statistics. J. Sci. Educ. Technol. 23, 538–548. doi: 10.1007/s10956-013-9483-3
Armstrong, M. B., and Landers, R. N. (2018). Gamification of employee training and development. Int. J. Train. Dev. 22, 162–169. doi: 10.1111/ijtd.12124
Carlone, H. B., and Johnson, A. (2007). Understanding the science experiences of successful women of color: science identity as an analytic lens. J. Res. Science Teaching: The Official J. National Association for Res. Science Teaching 44, 1187–1218. doi: 10.1002/tea.20237
Carlson, D., Nucci, M., and Johnson-Gleberg, M. C. (2019). Amazon adventure: A giant screen film, educational outreach and research about 2D, 3D & dome formats using a gaming assessment tool-project outcomes report. Retrieved from https://www.nsf.gov/awardsearch/showAward?AWD_ID=1423655
Carroll, J. B. (1993). Human cognitive abilities: A survey of factor-analytic studies. Cambridge: Cambridge University Press.
Cox-Petersen, A. M., and Pfaffinger, J. A. (1998). Teacher preparation and teacher-student interactions at a discovery center of natural history. J. Elem. Sci. Educ. 10, 20–35. doi: 10.1007/BF03173782
Crowley, K., Barron, B. J., Knutson, K., and Martin, C. K. (2015). Interest and the development of pathways to science. Washinton, DC.
Cummings, J. J., and Bailenson, J. N. (2016). How immersive is enough? A meta-analysis of the effect of immersive technology on user presence Media Psychology 19, 272–309. doi: 10.1080/15213269.2015.1015740
Dalgarno, B., and Lee, M. J. W. (2010). What are the learning affordances of 3-D virtual environments? Br. J. Educ. Technol. 41, 10–32. doi: 10.1111/j.1467-8535.2009.01038.x
Dasgupta, N., and Stout, J. G. (2014). Girls and women in science, technology, engineering, and mathematics: STEMing the tide and broadening participation in STEM careers. Policy Insights Behav. Brain Sci. 1, 21–29. doi: 10.1177/2372732214549471
Dede, C. (2009). Immersive interfaces for engagement and learning. Science 323, 66–69. doi: 10.1126/science.1167311
Eccles, J. S. (2007). Where are all the women? Gender differences in participation in physical science and engineering. United States: American Psychological Association.
Enders, C. (2005). “Maximum Likelihood Estimation” in Encyclopedia of statistics in behavioral science. eds. B. S. Everitt and D. Howell (United States: John Wiley & Sons).
Fraser, J., Heimlich, J. E., Jacobsen, J., Yocco, V., Sickler, J., Kisiel, J., et al. (2012). Giant screen film and science learning in museums. Museum Manag. Curatorship 27, 179–195. doi: 10.1080/09647775.2012.674322
Gee, J. P. (2003). What video games have to teach us about learning and literacy. New York, NY: Palgrave Macmillan, 1.
Gee, J. P. (2007). Good video games and good learning: Collected essays on video games, learning and literacy. New York: Peter Lang Publishing.
Glynn, S. M., Taasoobshirazi, G., and Brickman, P. (2009). Science motivation questionnaire: construct validation with nonscience majors. J. Res. Sci. Teach. 46, 127–146. doi: 10.1002/tea.20267
Greenberg, B. S., Sherry, J., Lachlan, K., Lucas, K., and Holmstrom, A. (2010). Orientations to video games among gender and age groups. Simul. Gaming 41, 238–259. doi: 10.1177/1046878108319930
Hickey, D. T., Ingram-Goble, A. A., and Jameson, E. M. (2009). Designing assessments and assessing designs in virtual educational environments. J. Sci. Educ. Technol. 18, 187–208. doi: 10.1007/s10956-008-9143-1
Huang, W., Roscoe, R., Johnson-Glenberg, M. C., and Craig, S. (2021). Motivation, engagement, and performance across multiple virtual reality sessions and levels of immersion. J. Comput. Assist. Learn. 37, 745–758. doi: 10.1111/jcal.12520
Hyder, J. (2009). What is immersive? LF examiner, may (August 23, 2021). Retrieved from https://lfexaminer.com/2009/05/what-is-immersive/
IJsselsteijn, W. A., de Kort, Y. A. W., and Haans, A. (2006). Is this my hand i see before me? The rubber hand illusion in reality, virtual reality, and mixed reality. Presence: Teleoperators and virtual environments 15, 455–464. doi: 10.1162/pres.15.4.455
Janicke, S. H., and Ellis, A. (2013). The psychology of the 3D experience. Paper presented at the Stereoscopic Displays and Applications XXIV.
Johnson-Glenberg, M. C. (2018). Immersive VR and education: Embodied design principles that include gesture and hand controls. Front. Robot. AI 5. doi: 10.3389/frobt.2018.00081
Johnson-Glenberg, M. C. (2019). “The necessary nine: design principles for embodied VR and active STEM education,” in Learning in a Digital World - Perspective on Interactive Technologies for Formal and Informal Education. eds. A. Ioannou and K. Bhagat (Springer), in press.
Johnson-Glenberg, M. C., Bartolomea, H., and Kalina, E. (2021). Platform is not destiny: Embodied learning effects comparing 2D desktop to 3D virtual reality STEM experiences. J. Comput. Assist. Learn. doi: 10.1111/jcal.12567
Johnson-Glenberg, M. C., Birchfield, D., Megowan-Romanowicz, M. C., and Snow, E. L. (2015). If the gear fits, spin it! Embodied education and in-game assessments. Int. J. Gaming Comput.-Mediat. Simul. 7, 40–65. doi: 10.4018/IJGCMS.2015100103
Johnson-Glenberg, M. C., and Megowan-Romanowicz, M. C. (2017). Embodied science and mixed reality: How gesture and motion capture affect physics education. Cogn. Res.: Princ. Implic. 2. doi: 10.1186/s41235-017-0060-9
Kim, A., Chang, M., Choi, Y., Jeon, S., and Lee, K. (2018). The effect of immersion on emotional responses to film viewing in a virtual environment. Paper presented at the IEEE conference on virtual reality and 3D user interfaces (VR).
Kovacs, K., and Conway, A. (2016). Process overlap theory: a unified account of the general factor of intelligence. Psychol. Inq. 27, 151–177. doi: 10.1080/1047840X.2016.1153946
Landers, R. N., and Sanchez, D. R. (2022). Game-based, gamified, and gamefully designed assessments for employee selection: definitions, distinctions, design, and validation. Int. J. Sel. Assess. 30, 1–13. doi: 10.1111/ijsa.12376
Lautenschlager, G. J., and Flaherty, V. L. (1990). Computer administration of questions: more desirable or more social desirability? J. Appl. Psychol. 75, 310–314. doi: 10.1037/0021-9010.75.3.310
Lee, E., Wong, K. W., and Fung, C. C. (2010). How does desktop virtual reality enhance learning outcomes? A structural equation modeling approach. Comput. Educ. 55, 1424–1442. doi: 10.1016/j.compedu.2010.06.006
Lin, J., Duh, H., Parker, D., Abi-Rached, H., and Furness, T. (2002). Effects of field of view on presence, enjoyment, memory, andsimulator sickness in a virtual environment. Paper presented at the Proceedings-Virtual Reality Annual International Symposium.
Loup, G., Serna, A., Iksal, S., and George, S. (2016). Immersion and persistence: Improving learners’ engagement in authentic learning situations. Paper presented at the European conference on technology enhanced learning, Lyon, France.
Makowski, D., Sperduti, M., Nicolas, S., and Piolino, P. (2017). "being there" and remembering it: presence improves memory encoding. Conscious. Cogn. 53, 194–202. doi: 10.1016/j.concog.2017.06.015
Makransky, G., and Petersen, G. B. (2019). Investigating the process of learning with desktop virtual reality: a structural equation modeling approach. Comput. Educ. 134, 15–30. doi: 10.1016/j.compedu.2019.02.002
Malone, T. W. (1980). What makes things fun to learn? A study of intrinsically motivating computer games. Palo Alto, CA:
Moore, R. W., and Hill Foy, R. L. (1997). The scientific attitude inventory: a revision (SAI II). J. Res. Sci. Teach. 34, 327–336. doi: 10.1002/(SICI)1098-2736(199704)34:4<327::AID-TEA3>3.0.CO;2-T
Nucci, M. (2019). “Amazon adventure: research report,” in Caise Community Repository. Retrieved from https://resources.informalscience.org/amazon-adventure-research-report
Park, J., Kim, Y. J., and Yun, B. (2016). Stereoscopic 3D objects evoke stronger saliency for nonverbal working memory: an fMRI study. Int. J. Imaging Syst. Technol. 26, 76–84. doi: 10.1002/ima.22159
Pölönen, M., Salmimaa, M., Aaltonen, V., Häkkinen, J., and Takatalo, J. (2009). Subjective measures of presence and discomfort in viewers of color-separation-based stereoscopic cinema. J. Soc. Inf. Disp. 17, 459–466. doi: 10.1889/JSID17.5.459
Price, A., Lee, H. S., and Malatesta, K. (2014). Stereoscopy in static scientific imagery in an informal education setting: does it matter? J. Sci. Educ. Technol. 23, 721–734. doi: 10.1007/s10956-014-9500-1
Price, A., Lee, H., Subbbarao, M., Kasal, E., and Aguilera, J. (2015). Comparing short- and long-term learning effects between stereoscopic and two-dimensional film at a planetarium. Sci. Educ. 99, 1118–1142. doi: 10.1002/sce.21185
Puente, K., Starr, C. R., Eccles, J. S., and Simpkins, S. D. (2021). Developmental trajectories of science identity beliefs: within-group differences among black, Latinx, Asian, and white students. J. Youth Adolesc. 50, 2394–2411. doi: 10.1007/s10964-021-01493-1
Radu, I., and Schneider, B. (2019). What can we learn from augmented reality (AR)? Benefits and drawbacks of AR for inquiry-based learning of physics. Paper presented at the Proceedings of the 2019 CHI Conference on Human Factors in Computing Systems.
Rideout, V., G, F. U., and F, R. D. (2010). Generation M2: Media in the Lives of 8-to 18-year-OIds. Washington, D. C.: Kaiser Family Foundation Study. Available at: https://files.eric.ed.gov/fulltext/ED527859.pdf.
Salmimaa, M., Aaltonen, V., Häkkinen, J., and Takatalo, J. (2009). Subjective measures of presence and discomfort in viewers of color separation-based tereoscopic cinema. J. Soc. Inf. Disp. 17, 459–466. doi: 10.1889/JSID17.5.459
Schild, J., LaViola, J., and Masuch, M. (2012). Understanding user experience in stereoscopic 3D games. Paper presented at the Proceedings of the SIGCHI Conference on human factors in computing systems.
Schubert, T., Friedmann, F., and Regenbrecht, H. (1999). Decomposing the sense of presence: factor analytic insights. Paper presented at the 2nd annual international workshop on presence, Colchester, UK.
Shute, V. (2011). Stealth assessment in computer-based games to support leanring. Computer Games and Instruction 20, 503–523.
Shute, V., Rahimi, S., Smith, G., Ke, F., Almond, R., Dai, C., et al. (2020). Maximizing learning without sacrificing the fun: stealth assessment, adaptivity and learning supports in educational games. J. Comput. Assist. Learn. 1–22. doi: 10.1111/jcal.12473
Slater, M., and Sanchez-Vives, M. V. (2016). Enhancing our lives with immersive virtual reality. Front. Robotics and AI 3:0074. doi: 10.3389/frobt.2016.00074
Slater, M., Usoh, M., and Steed, A. (1994). Depth of presence in virtual environments. Presence 3, 130–144. doi: 10.1162/pres.1994.3.2.130
Stets, J. E., Brenner, P. S., Burke, P. J., and Serpe, R. T. (2017). The science identity and entering a science occupation. Soc. Sci. Res. 64, 1–14. doi: 10.1016/j.ssresearch.2016.10.016
Tawfik, A. A., Moore, J. L., He, Z., and Vo, N. (2012). Human-computer interaction factors in designing educational video games. Current Issues in Education 15, 1–11.
Tian, F., and Wang, H. (2021). Comparison of repeated viewing in traditional 2D and VR movies: a study on brain waves. Paper presented at the 2021 6th International Conference on Intelligent Computing and Signal Processing (ICSP).
Twenge, J. M., and Martin, G. N. (2020). Gender differences in associations between digital media use and psychological well-being: evidence from three large datasets. J. Adolesc. 79, 91–102. doi: 10.1016/j.adolescence.2019.12.018
van Beurden, M. H. P. H., Ijsselsteijn, W. A., and Juola, J. F. (2012). Effectiveness of stereoscopic displays in medicine: A review. 3D Res. 3:3. doi: 10.1007/3DRes.01(2012)3
Vesely, S., and Klöckner, C. A. (2020). Social desirability in environmental psychology research: three meta-analyses. Front. Psychol. 11:1395. doi: 10.3389/fpsyg.2020.01395
Vincent-Ruz, P., and Schunn, C. (2018). The nature of science identity and its role as the driver of student choices. Int. J. STEM Educ. 5:48. doi: 10.1186/s40594-018-0140-5
Williams, M. M., and George-Jackson, C. (2014). Using and doing science: gender, self-efficacy, and science identity of undergraduate students in STEM. J. Women Minorities Sci. Eng. 20, 99–126. doi: 10.1615/JWomenMinorScienEng.2014004477
Witmer, B. G., and Singer, M. J. (1998). Measuring presence in virtual environments: A presence questionnaire. Presence: Teleoperators and virtual environments 7, 225–240.
Wouters, P., van Nimwegen, C., van Oostendorp, H., and van der Spek, E. D. (2013). A meta-analysis of the cognitive and motivational effects of serious games. J. Educ. Psychol. 105, 249–265. doi: 10.1037/a0031311
Yee, N. (2017). Beyond 50/50: breaking down the percentage of female gamers by genre. Retrieved from https://quanticfoundry.com/2017/01/19/female-gamers-by-genre/
Yee, N.. (2019). A closer look into the 12 gamer motivations. Retrieved from https://medium.com/ironsource-levelup/a-closer-look-into-the-12-gamer-motivations-8d156ff0151a
Yim, M. Y., Cicchirillo, V., and Drumwright, M. (2012). The impact of stereoscopic three-dimensional (3-D) advertising. J. Advert. 41, 113–128. doi: 10.2753/JOA0091-3367410208
Keywords: STEM education, giant screen, 2D compared to 3D, stereoscopy, game-based assessments, gender effects, media platform effects
Citation: Johnson-Glenberg MC, Kosa M and O'Rourke HP (2023) STEM learning, science identity and immersivity: Giant screen films comparing 2D, 3D, and dome formats including a videogame assessment. Front. Educ. 7:1096889. doi: 10.3389/feduc.2022.1096889
Edited by:
Patsie Polly, University of New South Wales, AustraliaReviewed by:
Jodi Asbell-Clarke, Technical Education Research Centers, United StatesVanessa Camilleri, University of Malta, Malta
Copyright © 2023 Johnson-Glenberg, Kosa and O'Rourke. This is an open-access article distributed under the terms of the Creative Commons Attribution License (CC BY). The use, distribution or reproduction in other forums is permitted, provided the original author(s) and the copyright owner(s) are credited and that the original publication in this journal is cited, in accordance with accepted academic practice. No use, distribution or reproduction is permitted which does not comply with these terms.
*Correspondence: Mina C. Johnson-Glenberg, ✉ mina.johnson@asu.edu