 Mitra Asgari
 Asha M. Miles
 Maria Sol Lisboa
 Mark A. Sarvary
94% of researchers rate our articles as excellent or good
Learn more about the work of our research integrity team to safeguard the quality of each article we publish.
Find out more
ORIGINAL RESEARCH article
Front. Educ., 15 November 2021
Sec. STEM Education
Volume 6 - 2021 | https://doi.org/10.3389/feduc.2021.740344
Classroom observation tools are used to evaluate teaching and learning activities, and to provide constructive feedback to instructors. To help instructors with selecting a suitable tool based on their needs and available resources, in this study, a group of observers assessed lectures of an introductory biology course using three, broadly cited classroom assessment tools in the STEM field: the Classroom Observation Protocol for Undergraduate STEM (COPUS); the Practical Observation Rubric to Assess Active Learning (PORTAAL); and the Decibel Analysis for Research in Teaching (DART). From a user’s perspective, we evaluated 1) the type and extent of information each tool provides, and 2) the time investment and difficulty of working with each tool. The assessment result of each tool was compared, with a list of expected outcomes generated by surveying a group of college instructors and with the result of a self-teaching assessment tool, Teaching Practices Inventory (TPI). Our findings conclude that each tool provided valuable assessment with a broad range of outcomes and time investment: PORTAAL offered the most detailed information on the quality of teaching practices and students’ engagement, but it demanded the greatest time investment. DART provided a basic estimation of active learning proportion with the least effort. The level of assessment outcome and the time investment when using COPUS was found to be less than PORTAAL, and more than DART. The TPI self-assessment outcome was found to be slightly optimistic regarding the proportion of active learning practices used in the studied course. This comparative study can help instructors in selecting a tool that suits their needs and available resources for a better assessment of their classroom teaching and learning.
Previous studies have shown considerable improvement in students’ learning when active learning instructional techniques were used instead of traditional (lecture-based) methods in science, technology, engineering, and mathematics (STEM) courses (Knight and Wood 2005; Freeman et al., 2007; Prather et al., 2009; Deslauriers et al., 2011; Gasiewski et al., 2012; Watkins and Mazur 2013; Mortensen and Nicholson 2015). Active learning, also sometimes called student-centered learning, refers to the situations where instructors use a series of activities to help students be active and engaged during instruction and in their learning processes (Handelsman et al., 2007; Driessen et al., 2020). Active learning teaching practices represent a collection of techniques such as polling, discussion, group work, metacognition, problem-based learning, and peer instruction (Handelsman et al., 2007; Driessen et al., 2020). In addition to improving the learning outcomes, the use of active learning techniques has been shown to positively impact students’ attendance, attitudes toward their discipline, course retention (Umbach and Wawrzynski 2005; Freeman et al., 2007; Deslauriers et al., 2011; Watkins and Mazur 2013; Wilton et al., 2019) and to reduce the achievement gap among student populations (Haak et al., 2011; Eddy and Hogan 2014). In the past 2 decades, multiple reports (Handelsman et al., 2007) and national initiatives such as the American Association for the Advancement of Science (2012), the President’s Council of Advisors on Science and Technology Engage to Excel report (2012), and the Association of American Universities, 2017 have called for widespread adoption of research-based active learning techniques in undergraduate STEM education.
In response to this demand, several classroom observation tools have been developed to assess and improve classroom teaching and learning (Sawada et al., 2002; Smith et al., 2013; Eddy et al., 2015; Owens et al., 2017). When using a classroom observation assessment tool, one or multiple observers evaluate classroom teaching and learning activities in real-time or by reviewing classroom recordings. Previous research has shown that self-reporting evaluations of teaching tend to be subjective and overestimate the use of active learning in classrooms (Fung and Chow 2002; Ebert-May et al., 2011; Cosbey et al., 2019). Classroom observation tools instead can be an objective method for evaluating the prevalence of active learning instructional practices in college classrooms (Lund et al., 2015). These tools can be categorized into unstructured and structured ones (Hora 2013). In unstructured observation tools, an observer takes extensive notes on classroom teaching and learning activities without following any specific directions. This can make the comparison of the assessment result among multiple observers or courses more challenging. In structured tools on the other side, one or more observers use a standardized protocol and follow specific instructions to describe the teaching practices and students activities that occur in a classroom. In this method, assessment results would be less subjective, and the outcomes can easily be compared among observers and courses.
Some of the most well-cited structured classroom observation protocols developed for post-secondary settings in recent years include the Reformed Teaching Observation Protocol (RTOP) (Sawada et al., 2002), the Teaching Dimensions Observation Protocol (TDOP) (Hora et al., 2013), the Classroom Observation Protocol for Undergraduate STEM (COPUS) (Smith et al., 2013), the Practical Observation Rubric to Assess Active Learning (PORTAAL) (Eddy et al., 2015), the Measurement Instrument for Scientific Teaching (MIST) (Durham et al., 2017), and the Decibel Analysis for Research in Teaching (DART) (Owens et al., 2017). These protocols provide an opportunity to quantitatively assess the frequency and extent of various teaching and learning activities in a course.
Course instructors can use these tools to showcase the use of active learning practices in their classrooms or the improvement of their teaching practices over time. The classroom assessment results can also be added to teaching portfolios or evidence of teaching effectiveness documents for faculty position applications and tenure packages. However, considering the heavy workload of most instructors, the additional time investment to select a suitable tool may be challenging. Finding a volunteer peer instructor, costs associated with hiring and training external observers, and difficulty of learning the tools and interpreting the classroom assessment results may be among other obstacles to their use. A 2013 study reviewed key characteristics and strengths and weaknesses of different classroom observation tools used in post-secondary settings (Hora 2013), mainly for faculty developer audiences. To the best of our knowledge, no study has yet compared different classroom observation tools to address their utility from instructors’ perspectives.
Therefore, to assist instructors who are interested in evaluating and receiving feedback on teaching and learning in their classrooms, we compared three well-cited classroom observation tools in STEM post-secondary environments: the Classroom Observation Protocol for Undergraduate STEM (COPUS Profiles, 2008) (Smith et al., 2013) (cited by 4701); the Practical Observation Rubric to Assess Active Learning (PORTAAL) (Eddy et al., 2015) (cited by 1382); and the Decibel Analysis for Research in Teaching (DART) (Owens et al., 2017) (cited by 493). In addition to using the number of citations as a selection criterion, we considered the level of assessment granularity of different tools during the selection too. Granularity refers to the level (broad vs. fine) in which the teaching and learning activities are being assessed (for further discussion of granularity see Hora 2013). The presence of variation in assessment granularity of COPUS, PORTAAL, and DART made them suitable for answering questions about time investment, the difficulty of working with each tool (effort), and the type and extent of information (outcome) each tool provides.
This study was conducted at a large research university in the United States during the 2018–2019 academic year. To compare the three classroom observation tools of COPUS, PORTAAL, and DART, we focused on the lecture part of a large enrollment (∼400 students), introductory biology course (hereafter, “Course”). Most of those enrolled in this course are first-year and second-year students. In this Course during weekly 50-min lectures instructor provided background information related to the lab sessions and assessed students’ understanding of critical concepts in interactive ways (Deane-Coe et al., 2017; Sarvary and Gifford 2017).
In this Course lectures were routinely video-recorded from the back of the room, focusing mainly on the instructor and the projection screen. The recordings were shared with students through the Learning Management System (LMS) at the end of each lecture day. For this study, rather than live observation, we used Course lecture recordings from a different semester to avoid classroom disruption. Of twelve lectures in the Course, nine were instructor-led while three lectures were dedicated to students’ presentations. By assessing multiple lectures, we aimed to account for the within-course variability in teaching and learning behaviors that may exist in STEM classrooms (Owens et al., 2017).
COPUS (Smith et al., 2013) was designed to capture instructor- and student-led activities in STEM classrooms. A total of 25 codes are used, characterizing instructor and student behavior at 2-min intervals (Supplementary Table 1A). For example, one can record whether the instructor is lecturing or asking questions, or whether students are listening or responding to questions. When complete, the inputs are summarized in two pie charts reflecting the frequency of instructor and student behavior during the class. In a later version of COPUS (Smith et al., 2014), the 25 original codes were collapsed into four categories for instructors (presenting, guiding, administrative activities, other instructor activities) and four categories for students (receiving information, working, talking to the class, and other student activities), streamlining interpretation of classroom behavior trends (Supplementary Table S1B). COPUS claims that educators with a background in STEM, from K-12 to college instructors, can use COPUS successfully after 1.5 h of training following the COPUS training guide. Also, when more than one observer was involved, COPUS showed to have high interrater reliability (IRR, >0.8) (Smith et al., 2013, 2014; Lund et al., 2015), calculated by Cohen’s kappa coefficient (Cohen 1960).
PORTAAL (Eddy et al., 2015) was developed to assess the frequency and duration of 21 research-supported active learning best practices that have been shown to increase college students’ learning in large enrollment lectures. The 21 teaching practices are categorized into 4 dimensions: 1) practice, 2) logic development, 3) accountability and 4) apprehension reduction (Supplementary Table S2). Instead of focusing on the entire lecture, this tool only evaluates the periods of a classroom when students are working on an activity or a question. Each engagement period or activity is divided into three phases: 1) Introduction, where a question/activity is introduced to students; 2) Student Engagement, where students are working on the question/activity, and 3) Debriefing, where the instructor reveals the answer and related discussion occurs. Instead of a single score, PORTAAL depicts the frequency or the duration of each of the 21 teaching strategies used in a lecture. PORTAAL hypothesizes that greater learning can be achieved when these 21 teaching elements are used in classrooms more often. By assessing the alignment of teaching strategies used in the classroom with PORTAAL suggested practices, this tool provides specific feedback to instructors about their teaching strengths and the areas that can be improved. PORTAAL provides a detailed user manual and claims that observers with varied backgrounds and no deep pedagogical or course content expertise can use PORTAAL successfully after an average of 5 training hours.
DART (Owens et al., 2017) was designed to document the presence and frequency of lecture and non-lecture (active learning) activities in STEM classrooms, which is assessed from classroom audio recordings. DART distinguishes between three categories of classroom sounds: single voice (e.g., lecture with Q/A), multiple voice (e.g., group or pair discussions), and no voice (e.g., clicker questions) (Supplementary Table S3). Without the need for a human observer, DART claims that its algorithm (https://sepaldart.herokuapp.com/) can assess a 2-h class session in about 5 min. In addition to the tool’s paper (Owens et al., 2017), the FAQ section of the DART website (https://sepaldart.herokuapp.com/) provides valuable information on how to use the tool.
The research team consisted of a senior lecturer, an education postdoctoral associate, and two graduate student laboratory teaching assistants working at the same research university during the time of the study. The diverse academic instructional experiences of the research team, including teaching lectures and laboratory sessions for small and large courses, allowed the incorporation of a variety of perspectives when comparing the three tools. The team was cast into the roles of “Course Instructor” (M.A.S) and three “Observers” (M.A, A.M.M, and M.S.L). Only the Observers conducted the Course lectures assessments using the tools. None of the Observers had prior experience working with the classroom assessment tools compared here.
Observers compared how COPUS, PORTAAL, and DART assess teaching and learning activities in the Course lectures (Table 1).
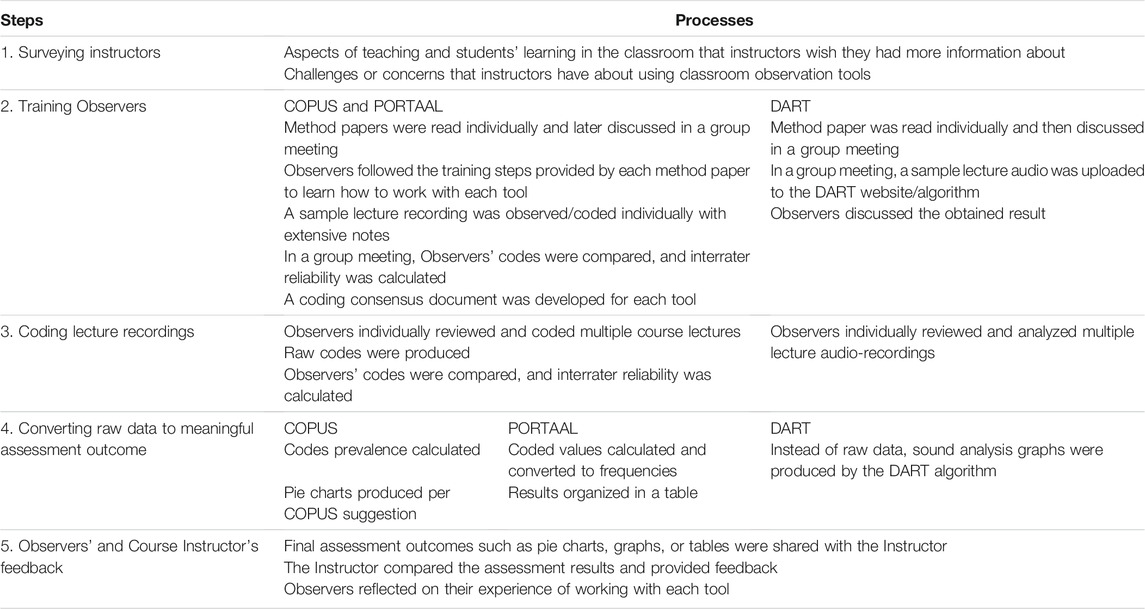
TABLE 1. The steps were taken to compare the teaching and learning activities in the Course lectures, using COPUS, PORTAAL, and DART.
To create a list of expected outcomes and efforts when using a classroom observation tool, an anonymous survey consisting of two open-ended questions (stated in Table 1, Step 1) was shared with a group of STEM college instructors from the study institution (N = 26, including the Course Instructor). The Observers performed an inductive content analysis to qualitatively code the instructors’ responses and identify recurring themes (Patton 1987). During this process, first Observers independently reviewed the instructors’ responses looking for recurring themes such as “proportion of active learning and lecturing”. This led to the development of a list of outcome and effort items (Table 2) which then was used to review the instructors’ responses looking for the presence and frequency of these items. The outcome items were also used to evaluate the assessment results from each tool.
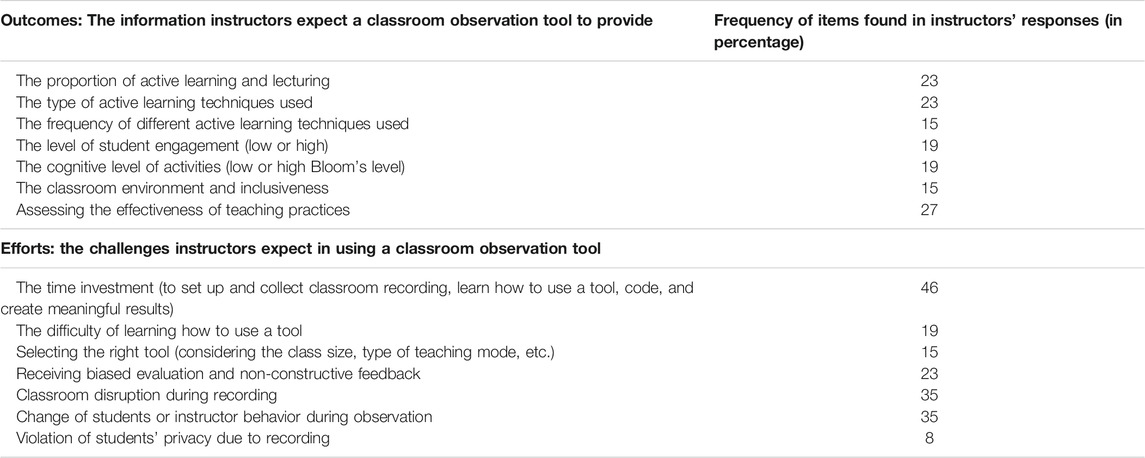
TABLE 2. A list of possible outcomes and efforts when using a classroom observation tool, generated from responses of a group of STEM instructors surveyed.
During the training phase (Table 1, Step 2), Observers focused on one tool at a time in the following order: COPUS, PORTAAL, and DART. The method paper describing each tool (Smith et al., 2013; Eddy et al., 2015; Owens et al., 2017) was individually read by the Observers, followed by a group discussion to become familiar with 1) what each tool aims to capture and 2) the names and descriptions of the codes. The training guide provided by COPUS and PORTAAL (Smith et al., 2013; Eddy et al., 2015) was also reviewed. For COPUS, Observers independently coded 2, 8, and 10 min of a sample lecture recording, followed by group discussion and comparing of the individual codes. Next, Observers individually reviewed and coded another sample course lecture and then met to discuss their coding and calculate the IRR using Fleiss’s kappa coefficient (Fleiss 1971). When the IRR was found to be low (κ < 0.75) this process was repeated for another sample lecture. For PORTAAL, Observers individually studied the PORTAAL manual first. As part of this training, each Observer responded to the PORTAAL comprehension test to assess their understanding of the user manual content. The PORTAAL manual was consulted in a group meeting to discuss the concept of Bloom’s Taxonomy (Bloom 1956) and to assess Observers’ capability in categorizing the classroom questions to low- or high-level cognitive thinking. Per PORTAAL’s recommendation, the 3 training videos provided by PORTAAL were independently coded and then discussed in a group meeting. Each Observer also reviewed three sample lecture recordings (of the studied course taught by the same instructor from a different semester). A coding consensus document was developed by Observers, with detailed notes to make codes easier to understand for the next step. The two-way agreement, single measures Intraclass correlation (ICC) analysis in R was used to measure interrater reliability, as the data coded were in percentages. The Observers moved to the actual review phase only after a reasonably high IRR value was attained (>0.75). For DART, the method paper (Owens et al., 2017) and FAQ section on the DART website (https://sepaldart.herokuapp.com/) were reviewed. Since DART uses only audio lecture recordings for classroom analyses, all classroom recordings were converted to audio files before being uploaded for further analysis. For training, a sample course lecture audio file was uploaded to the DART website and was processed by the related algorithm. Observers then discussed the assessment outcome figures yielded by the DART algorithm.
Observers independently reviewed multiple lectures in the order of COPUS, PORTAAL, and DART. All lecture recordings were used for coding by COPUS and DART. However, because 3 of the Course lectures focused on students’ presentations and did not contain activities led by the Course Instructor (PORTAAL’s focus), they were excluded from the PORTAAL analysis. Each Observer used a random number generator (https://www.random.org/) to order the lectures reviewed, minimizing bias introduced by increased proficiency with the method. At the end of the review phase for each method, individual codes and notes were compared and the IRR for each coded lecture was calculated. For DART, Observers did not have to code or review lecture audio recordings. They were processed by the DART algorithm.
For COPUS, the prevalence of each code was calculated by dividing the number of times a specific code was recorded (over 2-min time intervals) by the total number of codes recorded (Smith et al., 2013). As suggested by COPUS, two pie charts were created for each lecture showing the frequency of instructor and student activities during the lecture. The COPUS Analyzer (http://www.copusprofiles.org/) was also used to create heatmaps of COPUS code frequencies.
Observers used the provided conversion rubric for PORTAAL to calculate the percentage of the 21 teaching elements represented. The PORTAAL developers (Eddy et al., 2015) suggest after the assessment, instructors compare their element scores with the scores of reference instructors reported in the PORTAAL method paper, to understand what instructors are doing well and in which areas improvement may be needed. Beyond that, PORTAAL does not make any recommendations for data visualization and here we evaluated PORTAAL scores in a table format.
No further data processing or visualization was required for DART outside of the graphs generated by their algorithm.
Step 5: Observers’ and Course Instructor’s Feedback
After each review phase, Observers shared the outcomes of each assessment tool with the Course Instructor. In addition to providing qualitative feedback about the outcomes, he also compared the assessment result of three tools with a list of expected outcomes generated from surveying the STEM instructors. Before seeing the outcomes of each assessment tool, the Course Instructor performed a self-teaching assessment for the studied course using the Teaching Practices Inventory (TPI) (Wieman and Gilbert 2014) via responding to a short survey (<15 min). The TPI offers a detailed scoring system and the higher the overall score is, the more research-based teaching practices are shown to be used in the course. The Instructor then evaluated the TPI results with the assessment outcomes of COPUS, PORTAAL, DART to examine the alignment between the information these tools provide.
Observers also compiled feedback on the time spent and their experience working with each tool.
The list of items and frequency of their use, generated by analyzing responses of the STEM instructors surveyed (Table 1, Step 1), are shown in Table 2. These items focus on 1) information instructors expect a classroom observation tool to provide (outcomes) and 2) the challenges instructors expect when using a classroom observation tool (efforts).
To demonstrate the type of assessment outcomes provided by COPUS, PORTAAL, and DART, the assessment result for a single lecture of the Course evaluated is shown here. The same lecture was assessed using the 3 tools. The assessment outcomes for multiple lectures of the Course are shown in Supplementary Figures S1, S2 and Supplementary Table S4.
The assessment outcome of the lecture analyzed with COPUS is shown in pie charts, suggested by COPUS developers (Smith et al., 2013), (Figure 1A) and the heatmaps, produced by COPUS Analyzer (http://www.copusprofiles.org/) (Figures 1B,C). The pie charts depict the type and prevalence of the classroom activities (COPUS codes) for students (Figure 1A left) and instructor (Figure 1A right) during the single lecture analyzed. The students’ pie chart shows the frequency of the COPUS codes in the following order during the class period: students listened 68% of the time, did individual thinking 16% of the time, asked questions 11% of the time, and answered the instructor’s questions about 5% of the class period. During the same lecture, the COPUS showed the instructor lectured 78% of the class period, asked clicker questions for 16%, and asked non-clicker questions for 6% of the class period. The heatmap produced by COPUS Analyzer is an alternative visual representation (Figure 1B), that provides information about the timing and duration of COPUS codes compared to pie charts. For example, by looking at the heatmap, students and instructors seem to be listening and lecturing respectively for the entire lecture period. On the other hand, activities such as students answering questions or the instructor posting questions were coded only at certain times during the lecture period. The COPUS Analyzer also provided the collapsed version of the 25 original COPUS codes into eight categories for instructor and student codes (Figure 1C). These eight categories, instructors presenting, instructors guiding, instructor administrative activities, other instructor activities, students receiving information, students working, students talking to the class, and other student activities, enhance our understanding of existing behavior trends for both groups.
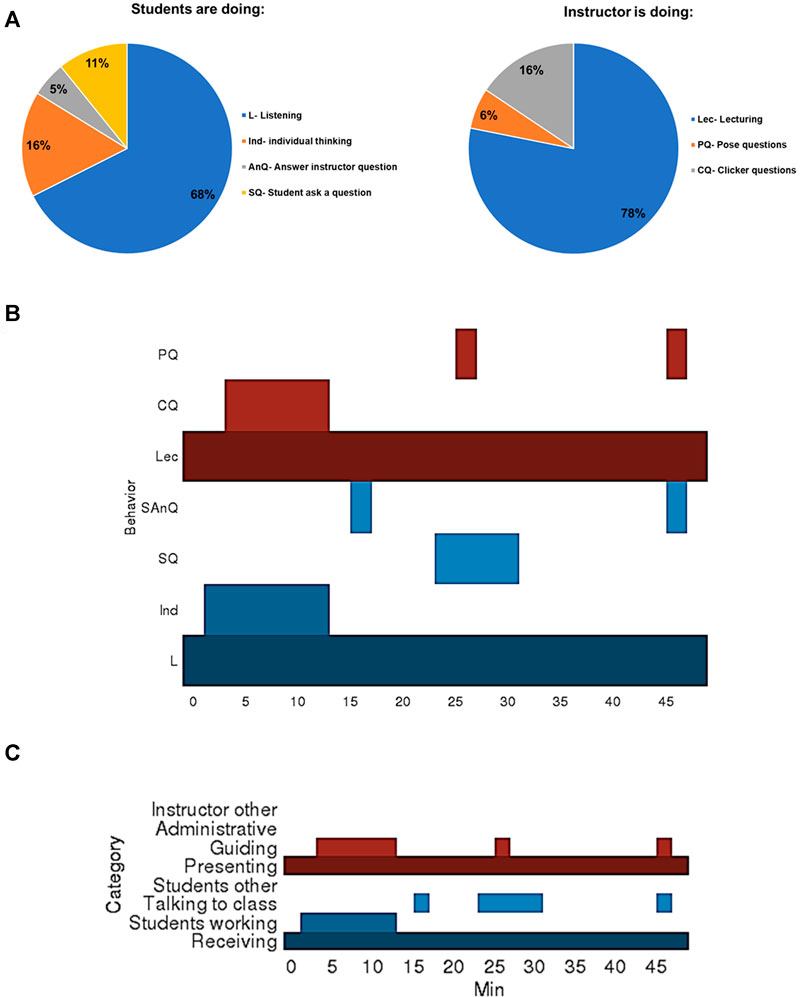
FIGURE 1. COPUS assessment outcome for a single Course lecture evaluated. The two pie charts (A) show the type and frequency (percentage) of the activities done by students and instructors in the classroom. The heatmap (B) produced by the COPUS Analyzer (unmodified output produced by the website) demonstrates the type and timing of the activities done by students (blue) and instructor (red) in the classroom during the same lecture. Out of the 25 existing codes, only a few of the COPUS codes were identified during this lecture that is shown in this figure. L, Listening; Ind, individual thinking; AnQ, Answering instructor question; SQ, Student asks a question; Lec, Lecturing; PQ, Posing questions; CQ, Clicker questions. The other heatmap (C), also produced by the COPUS Analyzer, shows the COPUS results (unmodified output) for the same lecture collapsed into four categories for students (blue) and four categories for the instructor (red).
For the same lecture, the PORTAAL codes were converted to frequency or duration (in percentage) for each of the 21 teaching elements identified, suggested by the tool’s developers (Eddy et al., 2015), and used to create Table 3. The outcome shows how often and how long each of the teaching practices suggested by PORTAAL was implemented during the period in which students were engaged in an activity or a question in the classroom. For the evaluated lecture, the PORTAAL assessment shows that at least one item from each of the four dimensions (practice, logic development, accountability, and reduce apprehension) was incorporated during the time students were engaged in a particular activity. The two incorporated elements of the “practice” dimension suggest that students were engaged 25% of the class period (element P1) and that 20% of the questions were asked by the instructors, required higher-order thinking skills (e.g., reasoning, analyzing, applying) from the students (P2 element). The L3 element of the “logic development” that was incorporated in the lecture, shows that every time a question was asked by the instructor, the students were provided the opportunity to think on their own first, before being asked to share their answers with another student, a group of students, or the entire class. Also, L1 similar to P2, highlights that 20% of the activities proposed by the instructor required a higher-order level of critical thinking. For the “accountability” dimension, the only element coded (A1) suggests that 35% of the activities and questions that students were engaged with during the lecture, were graded. For the “reduce apprehension” dimension, the results show that 65% of the time when students were engaged in an activity, the instructor reminded them that making mistakes and errors is a natural part of learning (element R5).
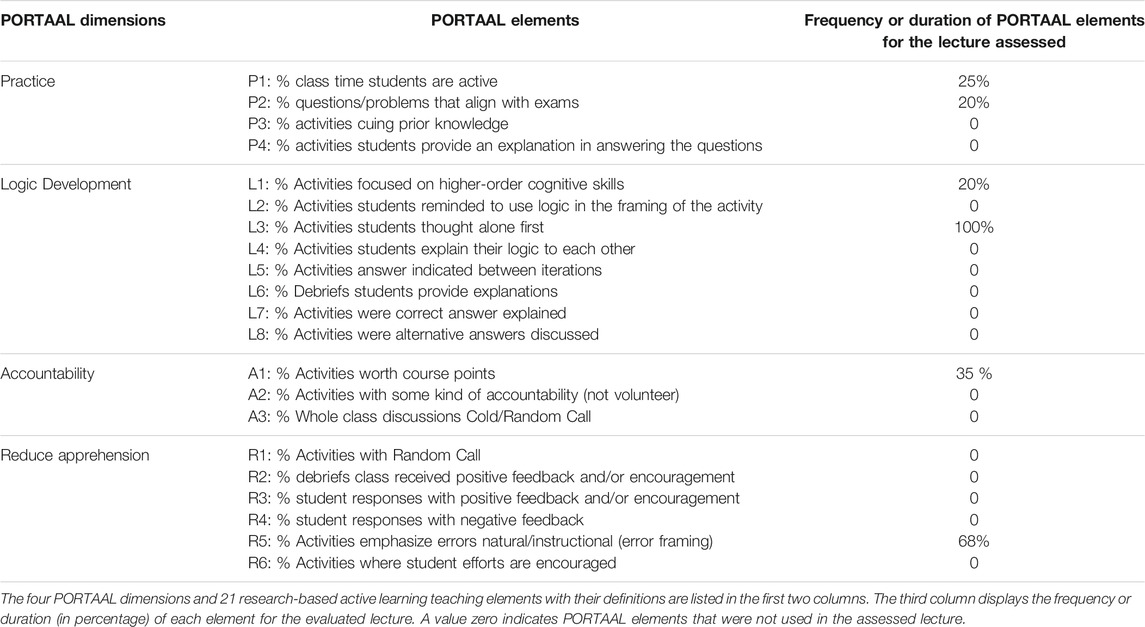
TABLE 3. The PORTAAL assessment outcome for a single lecture.
The DART outcome was produced by uploading the audio file of the lecture to the DART website (https://sepaldart.herokuapp.com/) (Figure 2). The top graph (Figure 2A) shows the classroom noise (decibels) throughout the lecture (minutes) in waveform. The middle graph (Figure 2B) depicts the DART prediction of the waveform, where the colors indicate three different audio modes of single voice (green), multiple voice (orange), and no voice (blue) added to the clean waveform figure. The bottom graph (Figure 2C) shows the approximate duration of each of the three DART sound categories identified within the classroom. For this lecture, about 83.4% of the lecture period is identified as a single voice, which could point to the period when the instructor was lecturing or streaming a video. About 13.6% of the class period was identified with multiple voices, which could indicate the moments when students were talking to each other or responding to the instructor (think-pair-share or group discussion). Finally, no sound was detected about 2.9% of the classroom period, which could describe the period students were individually working on a question or an activity.
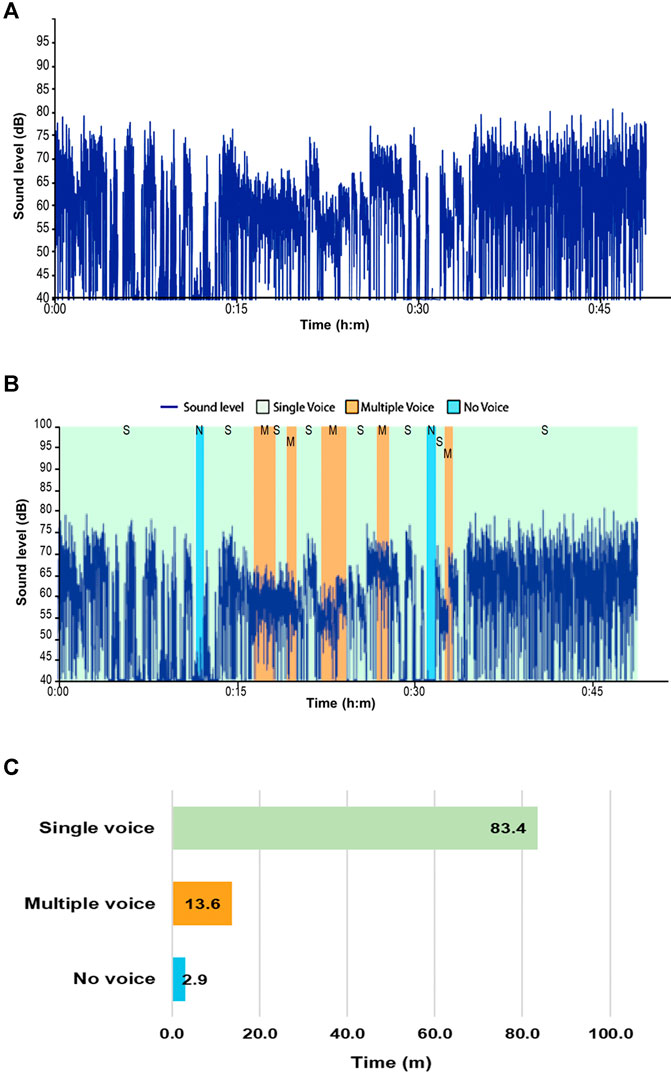
FIGURE 2. The DART sound analysis of a single lecture showing (A) the clean waveform of the classroom sound (decibels) throughout the lecture (hour: minute), (B) DART prediction of the waveform, where colors indicating three different modes of single voice (green), multiple voice (orange), and no voice (blue) are added to the clean waveform, (C) the approximate duration of each of the three DART sound categories identified within a classroom. The figures are original outputs produced by the DART algorithm.
The final assessments generated (Figures 1, 2; Table 4 and Supplementary Figures S1, S2 and Supplementary Table S4) were compared with the expected outcomes produced from surveying the STEM instructors (Table 2) and are presented in Table 4.
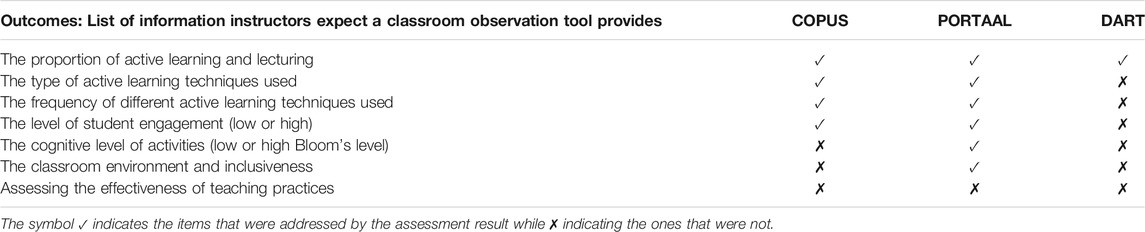
TABLE 4. Comparison of the final assessment outcomes of COPUS, PORTAAL, and DART with the list of outcomes developed from surveying STEM instructors.
This comparison indicates that the sound analysis of DART provides an estimation of the frequencies of active learning and lecturing without specifying the types of activities used in the classroom. DART did not meet any other expected outcomes. The other two tools, COPUS and PORTAAL provide additional layers of information about the teaching practices and activities that students are involved in within the classroom. From the COPUS output, one can deduct the types of active learning techniques used in the classroom, such as students asking questions, giving presentations, discussing answers, or responding to formative assessment, using clickers. In addition to the information DART and COPUS provided, PORTAAL assessed the cognitive level of activities and questions asked during class time. Along with assessing other teaching practices, this tool provides assessment information about the presence and frequency of inclusive teaching practices such as the use of positive feedback and encouragement towards the class (Table 4).
The Instructor found DART final assessment results (Figure 2 and Supplementary Figure S2) to be the easiest to understand with the shortest time investment, followed by COPUS (Figure 1 and Supplementary Figure S1) and PORTAAL (Table 3 and Supplementary Tables S4), with approximately the same time commitment.
Regarding DART, the Instructor explained
“I could very quickly distinguish between the amount of time when I was passively lecturing and when the students were actively participating in the classroom. In my mind, I thought the students were part of the dialogue much more frequently. The lack of noise in the classroom told me when the students were answering poll questions or were thinking about a solution for a problem. DART helped me recognize that I need more activities in the classroom, however, this tool did not help me identify what those tools are.”
Regarding COPUS, the Instructor explained that after dedicating some time to become familiar with the description of the codes (Supplementary Table S1), he found the COPUS graphs easily understandable, providing straightforward information about teaching practices and students’ activities during lectures. He added,
“It is very helpful that I can see the pattern of either lecturing or student participation. I can see when students are active, so it helps me determine how to adjust activities. The assessment clearly highlighted how much I lectured. According to the bubble graph, overall, I lecture 80–100% of the time, with only a couple of lectures when students are more active (25 and 50% of the time). I was surprised to see that the discussion of poll questions and student presentations were near zero in some lectures. Clearly, I incorrectly thought that those were activities I used in class very frequently to engage students.”
The Instructor stated that the PORTAAL results were also easy to comprehend. He indicated that he only needed to consult the dimensions and the elements listed and the conversion chart (Supplementary Table S2) in a few cases. He added,
“The detailed outcome of analyzing my lectures with this tool helped me identify the exact gaps I had in my teaching. For example, it made me realize that I do not allocate any time for students to explain their logic to each other, or I do not praise my class enough to encourage them. I haven’t thought of some of these activities before, and these results help me focus on those gaps.”
The overall TPI score (self-teaching assessment survey) of the Course based on the Instructor’s responses was 32 out of 67 possible points (47.7%). The Item III of TPI, which is related to In-Classroom activities (Supplementary Table S5), shows the Instructor’s assessment of the proportion of time typically spent on lecturing (40–60%) and other in-classroom assessed items. In comparison with COPUS, PORTAAL, and DART assessment outcomes (Supplementary Figures S1, S2 and Supplementary Table S4), the Instructor found that the TPI self-assessment outcome was slightly optimistic regarding the proportion of active learning practices he used during the lectures.
The time Observers spent during the training phase and coding of a typical 50-min Course lecture, as well as converting raw data into meaningful outcome results is shown in Table 5. This comparison showed the following time commitment: PORTAAL > COPUS > DART. The time spent working with COPUS and PORTAAL was about nine times more than that spent working with DART, most of which was spent during the training. The low interrater reliability values (<0.8) when working with these two tools led to more individual coding and group discussions, and the development of a coding consensus document. During the reviewing phase, the average time spent (coding) on a 50-min lecture was 1.5 h for PORTAAL, 1.1 h for COPUS, 0.2 h for DART. In PORTAAL and COPUS the additional time was spent on pausing, rewinding of the recording, and consulting the coding consensus document. For COPUS and PORTAAL, slightly more than half an hour (0.6 h) was spent on data processing and visualization of the results. The DART algorithm processed and produced the visual representation of the results, so no additional time was spent by the Observers at this stage.
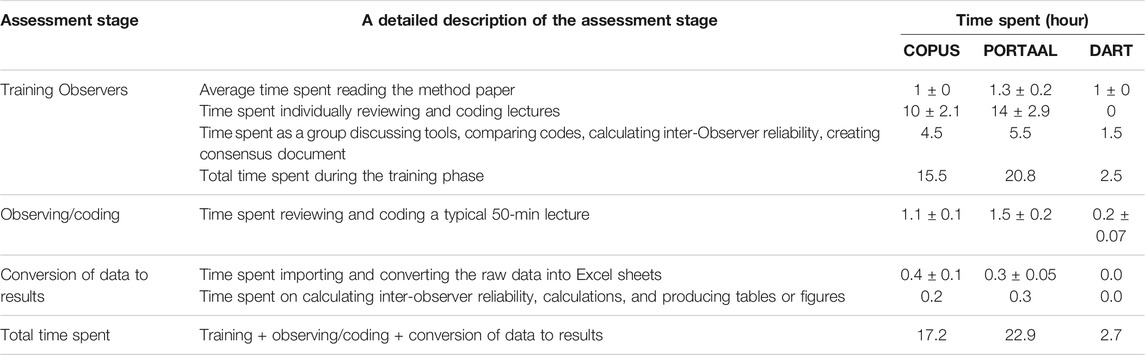
TABLE 5. The amount of time (mean ± SD) Observers spent, in hours, during the training, reviewing/coding, and curating raw data when working with COPUS, PORTAAL, and DART to assess a typical 50-min Course lecture.
Finally, Table 6 summarizes the information gained from COPUS, PORTAAL, and DART. This can provide further guidance to instructors aiming to assess their classroom activities and can assist them with selecting the most suitable tool based on their needs and available resources.
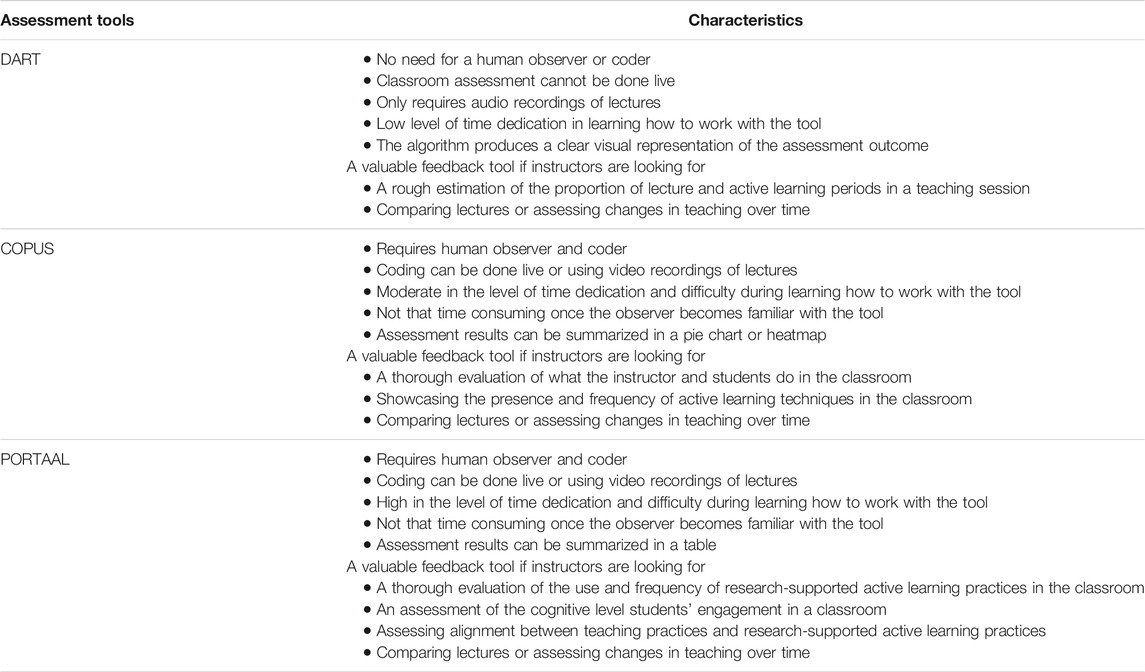
TABLE 6. A summary of COPUS, PORTAAL, and DART characteristics.
In this study, from the instructors’ perspective, we compared the assessment outcome and the efforts associated with using 3 classroom observation protocols: COPUS, PORTAAL, and DART. Our study shows that all 3 tools provide valuable information about teaching and learning in the classroom, however, the detail of the outcome and invested effort differed among the tools. While PORTAAL provided the most detailed outcome about the quality of teaching and student engagement, it demanded the greatest effort by the Observers. A rough estimation of the frequency of active learning in the classroom was provided by DART and it demanded the least effort from the Observers. The level of assessment outcome and the effort when using COPUS was found to be less than PORTAAL, and more than DART.
Several studies that have used COPUS (Lund et al., 2015, AuerbachAnna Jo and Andrews 2018, Kranzfelder et al., 2019; Weir et al., 2019) found it an efficient and objective instrument in assessing the activities instructor and students do in the classroom. Similar to our experience, most of these studies found the need to practice COPUS coding using multiple lecture videos (n = 3–7) to attain reasonable IRR (Lund et al., 2015; Kranzfelder et al., 2019; Weir et al., 2019). The importance of having a high agreement among multiple observers is greater when the classroom assessment outcome is going to be used for education research. However, when the purpose is self or peer assessment, a single instructor or observer should be adequate to conduct the coding using COPUS or other classroom observation tools. This way the time investment during the training phase can be reduced as well. Coding recorded teaching sessions can be also helpful in the early stages of learning the tool and allow the reviewer to pause, rewind and check codes for more confident coding. After mastering COPUS, the tool can be used during live lectures by an experienced observer (Meaders et al., 2019). Although PORTAAL is cited by several studies in the research context (Wiggins et al., 2017, AuerbachAnna Jo and Andrews 2018, Cooper et al., 2018; Weir et al., 2019), we could not find any published study that used this tool for classroom assessment to date. However, this tool might have been used by instructors or staff at Centers for Teaching and Learning at different institutions and the outcome has not been publicly available. Studies report DART as a quick and easy tool for providing classroom feedback to teachers (Howard et al., 2018) with a conservative and objective prediction of the frequency of active learning for multiple courses in a department (Owens and Gloriana TrujilloBlair. 2018). Because of the broad nature of the assessment outcome DART provides, the tool developers (Owens et al., 2017) suggest an assessment follow-up with other tools such as RTOP (Sawada et al., 2002) or COPUS if more detailed information is needed. There is also evidence of some coding mismatches with DART in this and other studies (Owens et al., 2017; Howard et al., 2018). For example, DART reported a higher proportion of Instructor lecturing compared to COPUS and PORTAAL (Figures 1A, 2C and Table 3), a false-positive for single voice misclassification which may require manual re-checking (Owens and Gloriana TrujilloBlair, 2018).
To select the most appropriate tool, we recommend instructors consider their desired outcome and resources (e.g., time, human observer). The assessment motive, which could be self-reflection, teaching improvement, or documentation of teaching excellence to be included in a portfolio or promotion documents, is an important factor in tool selection and may guide the user towards a descriptive or evaluative assessment tool. Both COPUS and DART can be categorized as descriptive assessment tools (Hora 2013), as they describe what happens in a classroom without an evaluation of the quality of the classroom teaching and learning. PORTAAL could be categorized more as an evaluative assessment tool as it is focused on the frequency of research-supported active learning practices which have been correlated with higher student achievement. PORTAAL developers suggest instructors assess the alignment between their teaching practices and PORTAAL’s suggested practices and work on improving their teaching according to the dimensions and items this tool describes. Another relevant criterion for the selection of a tool is the level of assessment granularity (broad vs fine). For example, DART provides a very broad level of assessment by focusing only on the frequency of active and non-active moments during lectures. However, if details on the type of activities during class are desired, COPUS is a better option as it offers a finely grained assessment. PORTAAL provides even greater resolution by zooming into the moments that students are active in the classroom and assessing the quality of teaching practices implemented. The granularity of assessment in terms of time is another important element that an instructor may need to consider when selecting a tool. Holistic tools require observers to evaluate items at the end of a class period such as RTOP (Sawada et al., 2002). However, in segmented tools such as COPUS, PORTAAL, and DART, observers record the presence of certain activities during short periods.
Some of the concerns raised by the group of STEM instructors surveyed in this study, were classroom disruption during the observation, the impact of the observation on student and instructor behavior, and the violation of students’ privacy during recording (Table 2). All of these are valid concerns in situations where the cameras or the observers are visible to the students and the instructor, for example in smaller-size courses or if the classroom recording is not a routine practice of a course. In the Course evaluated here, students were aware of the lecture recording and it was a routine part of the Course and, the cameras were not obvious as they were integrated into the audio-visual equipment of the lecture hall. This lowered the chances of classroom disruption and change of behavior due to the observation and recording. At the time of the recording, the instructor was also unaware of the future use of the recording for this study, therefore his behavior was not possibly altered as a result. Student privacy was another concern of the surveyed instructors. Observers must seek advice and consult the privacy rules of their institutions before any use of classroom observation or video/audio-recording tools where students or their conversations can be identified individually. In this work, the Institutional Review Board reviewed the study and did not state any related concern with the way classroom data were gathered and analyzed here.
Classroom observation is a powerful tool for assessing teaching and learning. In comparison to the end-of-semester student evaluations or unstructured peer evaluations which can produce more biased or subjective outcomes, these structured classroom observation tools can provide quantitative, objective, and standardized information about teaching and learning activities in a classroom. Like students overestimating their works (Biango-Daniels and Sarvary 2020), instructors have been shown to overestimate the frequency of active learning practices used in their classroom when their responses were compared with the information collected by a classroom observation tool (Ebert-May et al., 2011). In this study, the Teaching Practices Inventory (Wieman and Gilbert 2014) self-assessment survey taken by the Course Instructor also shows a slight overestimation of the use of active learning in the classroom when compared with COPUS, PORTAAL, and DART outcomes. In contrast, some research shows an alignment between faculty estimation of active learning in their courses and the outcome of a classroom observation tool (Owens and Gloriana TrujilloBlair, 2018). These varying results could be another reason for instructors to complement traditional evaluations of their courses with more independent classroom assessment tools like the ones studied here.
Since in this study, the outcomes and efforts of the different classroom observation tools were assessed only in a large-enrollment lecture environment, we recommend caution in generalization of the current findings to courses with different characteristics, such as small-enrollment or laboratory courses. Due to resource limitations, we could only focus on 3 classroom assessment tools out of so many existing ones. Future research may consider comparing a larger number of classroom observation tools and include various teaching and learning environments including different types of institution types to provide a more helpful guideline for instructor users in selecting the most suitable tool.
This study aimed to provide a guide for instructors interested in evaluating active learning in their classrooms by comparing the outcomes and efforts associated with 3 commonly used classroom observation tools. We found that COPUS, PORTAAL, and DART, can all be used to objectively inform instructors about the frequency of active learning in their classrooms. Instructors interested in an extensive evaluation of active learning periods in the classroom may choose to use PORTAAL, noting that it requires the largest effort to implement. A broad characterization of active learning can be achieved using DART with minimal time investment by the instructor but may require follow-up using a tool such as COPUS which provides more resolution regarding the types of activities occurring in the classroom. Selecting the appropriate tool will depend on factors related to the information the instructor desires and the time they can commit to obtaining it. There is a need for objective classroom assessment as instructors tend to overestimate the active learning that occurs in their classrooms. In combination with self-evaluation, the implementation of these tools can be used to showcase improvement and excellence of teaching to be included in teaching applications, promotion packages, and tenure dossiers, and may contribute to greater student achievement.
The original contributions presented in the study are included in the article/Supplementary Material, further inquiries can be directed to the corresponding author.
The studies involving human participants were reviewed and approved by Cornell University Institutional Review Board (IRB) (Protocol ID #1906008897). The patients/participants provided their written informed consent to participate in this study.
MA, AMM, MSL, and MAS equally contributed to the conceptualization and design of the study. MA processed the data visualization and wrote the first draft of the manuscript. All authors contributed to the review and editing of the manuscript.
The authors declare that the research was conducted in the absence of any commercial or financial relationships that could be construed as a potential conflict of interest.
All claims expressed in this article are solely those of the authors and do not necessarily represent those of their affiliated organizations, or those of the publisher, the editors and the reviewers. Any product that may be evaluated in this article, or claim that may be made by its manufacturer, is not guaranteed or endorsed by the publisher.
We thank KC Ryan and Chelsea Maceda of the Investigative Biology Teaching Laboratories for their assistance with preparing the lecture recordings.
The Supplementary Material for this article can be found online at: https://www.frontiersin.org/articles/10.3389/feduc.2021.740344/full#supplementary-material
Association of American Universities (2017). Progress toward Achieving Systemic Change: A Five-Year Status Report on the AAU Undergraduate STEM Education Initiative. online. Washington, DC. Available at: https://www.aau.edu/sites/default/files/AAU-Files/STEM-Education-Initiative/STEM-Status-Report.pdf (Accessed 2020 July 7).
AuerbachAnna Jo, A. J. J., and Andrews., T. C. (2018). Pedagogical Knowledge for Active-Learning Instruction in Large Undergraduate Biology Courses: A Large-Scale Qualitative Investigation of Instructor Thinking. IJ STEM Ed. 5 (1), 19. doi:10.1186/s40594-018-0112-9
Biango-Daniels, M., and Sarvary, M. (2020). A challenge in Teaching Scientific Communication: Academic Experience Does Not Improve Undergraduates' Ability to Assess Their or Their Peers' Writing. Assess. Eval. Higher Edu., 46. September, 809–820. doi:10.1080/02602938.2020.1812512
Bloom, B. S. (1956). Taxonomy of Educational Objectives, Handbook: The Cognitive Domain. New York: David McKay.
Cohen, J. (1960). A Coefficient of Agreement for Nominal Scales. Educ. Psychol. Meas. 20 (1), 37–46. doi:10.1177/001316446002000104
Cooper, K. M., Downing, V. R., and Brownell, S. E. (2018). The Influence of Active Learning Practices on Student Anxiety in Large-Enrollment College Science Classrooms. Int. J. STEM Educ. 5 (1), 23. doi:10.1186/s40594-018-0123-6
COPUS Profiles. COPUS Profiles. 2008. [online]. Available from: http://www.copusprofiles.org/. [Accessed 2021 March 10].
Cosbey, R., Wusterbarth, A., and Hutchinson, B. (2019). “Deep Learning for Classroom Activity Detection from Audio,” in ICASSP 2019 - 2019 IEEE International Conference on Acoustics, Speech and Signal Processing (ICASSP), Brighton, United Kingdom (IEEE), 3727–3731. doi:10.1109/ICASSP.2019.8683365
Deane-Coe, K. K., Sarvary, M. A., Owens, T. G., and Owens, Thomas. G. (2017). Student Performance along Axes of Scenario Novelty and Complexity in Introductory Biology: Lessons from a Unique Factorial Approach to Assessment. CBE Life Sci. Educ. 16 (1), ar3. doi:10.1187/cbe.16-06-0195
Describing and measuring undergraduate STEM teaching practices 2020 Council of Graduate Schools [online]. Available at: https://cgsnet.org/describing-and-measuring-undergraduate-stem-teaching-practices [Accessed 2020 Aug 23].
Deslauriers, L., Schelew, E., and Wieman, C. (2011). Improved Learning in a Large-Enrollment Physics Class. Science 332 (6031), 862–864. doi:10.1126/science.1201783
Driessen, E. P., Knight, J. K., Smith, M. K., and Ballen, C. J. (2020). Demystifying the Meaning of Active Learning in Postsecondary Biology Education. CBE Life Sci. Educ. 19 (4), ar52. doi:10.1187/cbe.20-04-0068
Durham, M. F., Knight, J. K., and Couch, B. A. (2017). Measurement Instrument for Scientific Teaching (MIST): A Tool to Measure the Frequencies of Research-Based Teaching Practices in Undergraduate Science Courses. CBE Life Sci. Educ. 16 (4), ar67. doi:10.1187/cbe.17-02-0033
Ebert-May, D., Derting, T. L., Hodder, J., Momsen, J. L., Long, T. M., and Jardeleza, S. E. (2011). What We Say Is Not what We Do: Effective Evaluation of Faculty Professional Development Programs. BioScience 61 (7), 550–558. doi:10.1525/bio.2011.61.7.9
Eddy, S. L., Converse, M., and Wenderoth, M. P. (2015). PORTAAL: A Classroom Observation Tool Assessing Evidence-Based Teaching Practices for Active Learning in Large Science, Technology, Engineering, and Mathematics Classes. CBE Life Sci. Educ. 14 (2), 14–ar23. doi:10.1187/cbe.14-06-0095
Eddy, S. L., and Hogan, K. A. (2014). Getting under the Hood: How and for Whom Does Increasing Course Structure Work. CBE Life Sci. Educ. 13 (3), 453–468. doi:10.1187/cbe.14-03-0050
Fleiss, J. L. (1971). Measuring Nominal Scale Agreement Among many Raters. Psychol. Bull. 76 (5), 378–382. Available here:. doi:10.1037/h0031619
Freeman, S., O'Connor, E., Parks, J. W., Cunningham, M., Hurley, D., Haak, D., et al. (2007). Prescribed Active Learning Increases Performance in Introductory Biology. CBE Life Sci. Educ. 6, 132–139. doi:10.1187/cbe.06-09-0194
Fung, L., and Chow, L. P. Y. (2002). Congruence of Student Teachers' Pedagogical Images and Actual Classroom Practices. Educ. Res. 44 (3), 313–321. doi:10.1080/0013188022000031605
Gasiewski, J. A., Eagan, M. K., Garcia, G. A., Hurtado, S., and Chang, M. J. (20122012). From Gatekeeping to Engagement: A Multicontextual, Mixed Method Study of Student Academic Engagement in Introductory STEM Courses. Res. High Educ. 53, 229–261. doi:10.1007/s11162-011-9247-y
Haak, D. C., HilleRisLambers, J., Pitre, E., and Freeman, S. (2011). Increased Structure and Active Learning Reduce the Achievement Gap in Introductory Biology. Science 332 (6034), 1213–1216. doi:10.1126/science.1204820
Hora, Matthew. 2013. A Review of Classroom Observation Techniques in Postsecondary Settings. Available at: https://wcer.wisc.edu/publications/abstract/wcer-working-paper-no.-2013-01. [Accessed 2021 July 6].
Hora, Matthew. T., Oleson, Amanda., and JosephFerrare, J. (2013). Teaching Dimensions Observation Protocol (TDOP) User’s Manual, 28.
Howard, S. K., Yang, J., Ma, J., Ritz, C., Zhao, J., and Wynne, K. (2018). “Using Data Mining and Machine Learning Approaches to Observe Technology-Enhanced Learning,” in 2018 IEEE International Conference on Teaching, Assessment, and Learning for Engineering (TALE), 788–793. doi:10.1109/TALE.2018.8615443
Knight, J. K., and Wood, W. B. (2005). Teaching More by Lecturing Less. Cell Biol Educ 4 (4), 298–310. doi:10.1187/05-06-0082
Kranzfelder, P., Lo, A. T., Melloy, M. P., Walker, L. E., and Warfa, A.-R. M. (2019). Instructional Practices in Reformed Undergraduate STEM Learning Environments: A Study of Instructor and Student Behaviors in Biology Courses. Int. J. Sci. Edu. 41 (14), 1944–1961. doi:10.1080/09500693.2019.1649503
Lund, T. J., Pilarz, M., Velasco, J. B., Chakraverty, D., Rosploch, K., Undersander, M., et al. (2015). The Best of Both Worlds: Building on the COPUS and RTOP Observation Protocols to Easily and Reliably Measure Various Levels of Reformed Instructional Practice. CBE Life Sci. Educ. 14 (2), ar18. doi:10.1187/cbe.14-10-0168
Meaders, C. L., TothTothKelly, E. S. A. L., Lane, A. K. S., Shuman, J. K., Couch, B. A., Stains, M., et al. (2019). "What Will I Experience in My College STEM Courses?" an Investigation of Student Predictions about Instructional Practices in Introductory Courses. CBE Life Sci. Educ. 18 (4), ar60. doi:10.1187/cbe.19-05-0084
Mortensen, C. J., and Nicholson, A. M. (2015). The Flipped Classroom Stimulates Greater Learning and Is a Modern 21st century Approach to Teaching Today's Undergraduates. J. Anim. Sci. 93 (7), 3722–3731. doi:10.2527/jas.2015-9087
Owens, M. T., Seidel, S. B., Wong, M., Bejines, T. E., Lietz, S., Perez, J. R., et al. (2017). Classroom Sound Can Be Used to Classify Teaching Practices in College Science Courses. Proc. Natl. Acad. Sci. U S A. 114 (12), 3085–3090. doi:10.1073/pnas.1618693114
Owens, M. T., TrujilloBlair, G. K. M. F. H. P. B. J. R., Seidel, S. B., Harrison, C. D., Farrar, K. M., Benton, H. P., et al. (2018). Collectively Improving Our Teaching: Attempting Biology Department-wide Professional Development in Scientific Teaching. CBE Life Sci. Educ. 17 (1), ar2. doi:10.1187/cbe.17-06-0106
PCAST Engage to Excel. 2020. [online]. Available at: https://obamawhitehouse.archives.gov/sites/default/files/microsites/ostp/pcast-engage-to-excel-final_2-25-12.pdf [Accessed 2020 July 7].
Prather, E. E., Rudolph, A. L., Brissenden, G., and Schlingman, W. M. (2009). A National Study Assessing the Teaching and Learning of Introductory Astronomy. Part I. The Effect of Interactive Instruction. Am. J. Phys. 77, 320–330. doi:10.1119/1.3065023
RANDOM.2021 ORG - True Random Number Service. [online]. Available at: https://www.random.org/. [Accessed 2021 March 14].
Sarvary, M. A., and Gifford, K. M. (2017). The Benefits of a Real-Time Web-Based Response System for Enhancing Engaged Learning in Classrooms and Public Science Events. J. Undergrad Neurosci. Educ. 15 (2), E13–E16. PMID: 28690444; PMCID: PMC5480850.
Sawada, D., Piburn, M. D., Judson, E., Turley, J., Falconer, K., Benford, R., et al. (2002). Measuring Reform Practices in Science and Mathematics Classrooms: The Reformed Teaching Observation Protocol. Sch. Sci. Maths. 102 (6), 245–253. doi:10.1111/j.1949-8594.2002.tb17883.x
SEPAL/CCLS DART. 2021. SEPAL/CCLS DART. [online]. Available at: https://sepaldart.herokuapp.com/. [Accessed 2021 March 3].
Smith, M. K., JonesJonesGilbert, F. H. Sarah. L., Gilbert, S. L., and Wieman, C. E. (2013). The Classroom Observation Protocol for Undergraduate STEM (COPUS): a New Instrument to Characterize university STEM Classroom Practices. CBE Life Sci. Educ. 12 (4), 618–627. doi:10.1187/cbe.13-08-0154
Smith, M. K., VinsonVinson, E. L. J. A. S. J. D. L., Smith, J. A., Lewin, J. D., and Stetzer, M. R. (2014). A Campus-wide Study of STEM Courses: New Perspectives on Teaching Practices and Perceptions. CBE Life Sci. Educ. 13 (4), 624–635. doi:10.1187/cbe.14-06-0108
Umbach, P. D., and Wawrzynski, M. R. (2005). Faculty Do Matter: The Role of College Faculty in Student Learning and Engagement. Res. High Educ. 46 (2), 153–184. doi:10.1007/s11162-004-1598-1
Watkins, J., and Mazur, E. (2013). Retaining Students in Science, Technology, Engineering, and Mathematics (STEM) Majors. J. Coll. Sci. Teach. 42 (5), 36–41. May/June 2013. https://www.jstor.org/stable/43631580.
Weir, L. K., BarkerBarkerMcDonnellRodela, M. K. L. M. N. G. S. T. M., McDonnell, L. M., Schimpf, N. G., Rodela, T. M., and Schulte, P. M. (2019). Small Changes, Big Gains: A Curriculum-wide Study of Teaching Practices and Student Learning in Undergraduate Biology. PLOS ONE 14 (8), e0220900. doi:10.1371/journal.pone.0220900
Wieman, C., and Gilbert, S. (2014). The Teaching Practices Inventory: A New Tool for Characterizing College and University Teaching in Mathematics and Science. CBE Life Sci. Educ. 13 (3), 552–569. doi:10.1187/cbe.14-02-0023
Wiggins, B. L., EddyEddyGrunspan, S. L. D. Z., Grunspan, D. Z., and Crowe, A. J. (2017). The ICAP Active Learning Framework Predicts the Learning Gains Observed in Intensely Active Classroom Experiences. AERA Open 3 (2), 233285841770856. doi:10.1177/2332858417708567
Keywords: teaching, learning, instructor, COPUS, PORTAAL, DART, classroom observation, classroom assessment
Citation: Asgari M, Miles AM, Lisboa MS and Sarvary MA (2021) COPUS, PORTAAL, or DART? Classroom Observation Tool Comparison From the Instructor User’s Perspective. Front. Educ. 6:740344. doi: 10.3389/feduc.2021.740344
Received: 12 July 2021; Accepted: 26 October 2021;
Published: 15 November 2021.
Edited by:
Nancy Longnecker, University of Otago, New ZealandReviewed by:
Christian Bokhove, University of Southampton, United KingdomCopyright © 2021 Asgari, Miles, Lisboa and Sarvary. This is an open-access article distributed under the terms of the Creative Commons Attribution License (CC BY). The use, distribution or reproduction in other forums is permitted, provided the original author(s) and the copyright owner(s) are credited and that the original publication in this journal is cited, in accordance with accepted academic practice. No use, distribution or reproduction is permitted which does not comply with these terms.
*Correspondence: Mitra Asgari, bWFzZ2FyaTFAYXN1LmVkdQ==
Disclaimer: All claims expressed in this article are solely those of the authors and do not necessarily represent those of their affiliated organizations, or those of the publisher, the editors and the reviewers. Any product that may be evaluated in this article or claim that may be made by its manufacturer is not guaranteed or endorsed by the publisher.
Research integrity at Frontiers
Learn more about the work of our research integrity team to safeguard the quality of each article we publish.