 Shannon Hall-Mills
- School of Communication Science and Disorders, Florida State University, Tallahassee, FL, United States
In the United States, the Response to Intervention framework provides tiered levels of support in general education (kindergarten through grade 12) to improve student outcomes and may relate to special education determinations. While broadly applied to eligibility determinations for children with specific learning disability, the Response to Intervention model also presents an interesting consideration for children with language impairment. The requirement of the Response to Intervention framework in education policy may have a significant impact on the identification and eligibility processes for children with special educational needs. The aim of the present study was to explore whether this policy implementation altered the prevalence of students with disabilities ages 3–21 years who were determined to be eligible for special education under the categories of specific learning disability and language impairment. Longitudinal data was examined to determine whether significant changes occurred in the prevalence rates in a state that mandated implementation of Response to Intervention policy. The results revealed that significant changes occurred in the prevalence rates from pre-to post implementation of Response to Intervention policy; language impairment prevalence increased and specific learning disability prevalence decreased. Prevalence changes have maintained over multiple subsequent school years. The findings have important implications for policy and practices focused on the identification of these common disabilities throughout the school years.
Introduction
Specific learning disability (SLD) and speech-language impairment (S/LI) are the highest incidence disabilities in schools in the U.S. Nationwide, more than 50% of all students with disabilities (Pre-Kindergarten through grade 12) have a primary disability of either specific learning disability (SLD: 34.5%) or speech-language impairment (S/LI: 20%; United States Department of Education, 2018). Learning disabilities are the result of “neurobiological differences in brain structure and function and affect a person’s ability to receive, store, process, retrieve or communicate information” (Cortielle and Horowitz, 2014, p. 3). Students with LD comprise a heterogenous population and are at risk for academic and behavioral challenges throughout the school years (Cortielle and Horowitz, 2014; Backenson et al., 2015).
In the United States, students with disabilities may qualify for special education and related services under one or more categories of exceptionality that are specified in the Individuals With Disabilities Education Act (2004), referred heretofore as IDEA. To receive services under the IDEA qualifying category of SLD, a student must have difficulty with reading, writing, oral language, or math difficulties in the absence of other cognitive, sensory, neurological, or behavioral deficits (IDEA, 2004). Many types of learning disability are acknowledged under the umbrella of SLD (e.g., dyslexia, dyscalculia, dysgraphia). To qualify for services under the category of S/LI, a student must have communication difficulties in speech or language that adversely affect the child’s educational performance (IDEA, 2004). Although in federal law it is referred to as a single qualifying category, speech-language impairment (S/LI) reflects two distinct sub-categories of communication disorders in childhood. Speech impairment includes disorders of speech articulation, fluency (e.g., stuttering), and vocal production, whereas language impairment (LI) involves significant impairment in language development and language use across modalities due to deficits in comprehension and/or production across any of the five major language domains (i.e., phonology, morphology, syntax, semantics, pragmatics; ASHA, 1993).
While either a speech or language impairment can adversely affect a child’s educational performance, children with language impairment face greater risks for prolonged difficulties during and after the school years. Students with LI are adversely affected in the learning environment by deficits in oral and/or written language, and they are at risk for literacy and behavioral difficulties during the school years (Catts et al., 2002; Yew and O’Kearney, 2013). Young children and children who have a language disorder at the time of school entry are at risk for reading-based learning disabilities in later grades. As early as the second grade, a majority of students with LI place in the bottom quartile on reading comprehension measures (Catts et al., 2002), and continue to struggle with literacy into the later grades (Nippold, 2017). Furthermore, these significant risks for children with LI can have a lasting impact into adulthood (Young et al., 2002; Tomblin et al., 2003).
Given the special educational needs associated with SLD and LI, it is important for schools to identify and address language and learning deficits at the earliest possible juncture. The process of identification of disabilities among school-age children is governed by federal, state, and local regulations and policies. In the U.S., early identification mechanisms occur within the broader multi-tiered system of supports (MTSS). Policies that alter processes for special education identification can impact child count data (Samuels, 2017). Therefore, the present study explores the potential impact of statewide RTI implementation in a state where policy stipulates that special education decisions for both SLD and LI categories are intertwined with general education intervention processes.
Response to Intervention
The basic tenets of an RTI model include the provision of high-quality instruction and intervention tailored to student need and the use of learning rate over time and level of performance to make important decisions (Kurns and Tilly, 2008). The first tier of support reflects the core instruction provided to all students, includes universal screening for all students, and promotes progress monitoring of students at-risk for academic or behavioral difficulties. The second tier of RTI includes small-group, low intensity intervention for students who have been identified at-risk of further academic or behavioral difficulties with continued progress monitoring. Students who have not made adequate progress via tier two interventions may receive more individualized and intensive interventions in the third tier. Possible referral for a special education evaluation may be determined for low responders receiving tier three interventions. In some models of RTI, a fourth tier is described as the initiation of special education and related services for students with disabilities who have been determined eligible (Berkeley et al., 2009).
RTI policies are abundant throughout public school systems in the U.S. and in a growing number of school systems in the European Union (Grosche and Volpe, 2013; Hauerwas et al., 2013). Between 2008 and 2011, engagement in RTI practices doubled (Spectrum K12 School Solutions, 2011). Thirty-two states and U.S. territories include RTI/MTSS in their state’s plan for general education and as part of their strategy for addressing outcomes for students with disabilities (Burns and VanDerHeyden, 2006; Fuchs and Fuchs, 2007; Bailey, 2018). For states that implement RTI, the policy is either recommended or mandated, which can create variability in implementation among states (Hauerwas et al., 2013). Looking more closely at the data sourced from a state in which RTI is required in statewide education policy and regulations offers an opportunity to examine child count data by IDEA disability category over several years of RTI implementation.
Impact of RTI Policy on Disability Prevalence
Proponents of RTI initially proclaimed the potential for RTI to increase general education inclusion for students with disabilities, thereby reducing the number of students receiving core instruction in special education environments (Ehren and Nelson, 2005; Groshe and Volpe, 2013; Maier et al., 2016). The delivery of general education interventions was thought to have preventive value for common disabilities such as SLD in reading and LI. Some evidence suggests that RTI can result in fewer diagnoses of reading disabilities and improve reading performance among students who later qualify for SLD support in reading (O’Connor et al., 2005; Fuchs et al., 2008). However, a survey of state education directors revealed that few states have been systematically evaluating the effectiveness of RTI to reduce disability prevalence (Hudson and McKenzie, 2016).
Results from previous research show mixed results for the relation among RTI and prevalence of disabilities qualified for services under IDEA, with some investigators suggesting a link exists between the implementation of RTI and changes in special education enrollment. Samuels (2017) reported a 14 and 11% decrease in students identified as having SLD and S/LI, respectively, during a 10 year period (2006–2015) and suggested the changes were related to broad adoption of multitiered systems of supports. Pullen et al. (2020) also used data reported by the Office of Special Education Programs (OSEP) in the United States Department of Education to examine SLD prevalence and variability across multiple states and school years (2000–2011), noting a decline in the SLD prevalence rates as a national trend. They also determined that as the SLD prevalence decreased, the interstate prevalence variability increased. (Pullen et al., 2020) speculated that the changes in SLD prevalence and variability may have been related to states’ adoption of RTI and its implications for SLD identification. However, they did not analyze specific states’ RTI adoption timelines against changes in SLD prevalence. Moreover, (Pullen et al., 2020) did not examine LI specifically as a diagnostic category apart from the combined S/LI data.
In contrast, other researchers have noted changes in the opposite direction. VanDerHeyden et al. (2007) found a decrease in the number of referrals for special education evaluation, but an increase in special educational needs identification for students who were referred for special education eligibility determination. This suggests that the implementation of RTI processes resulted in significant prevention effects as well as decreased false positives through the referral process as a greater proportion of referrals were deemed eligible for special education services. Other data sources have indicated no changes in special education placements as a result of RTI implementation (Marston et al., 2007; O’Connor et al., 2014). Finally, a review of 13 published field studies regarding RTI programs indicated there were minimal to no significant changes in special education referral and placements rates, with a few studies noting slight decreases in referrals and placements (Hughes and Dexter, 2011). However, it was not reported whether the decreases were associated with one or more specific disability categories.
To date there has been only one investigation that focused on LI prevalence rates associated with RTI implementation. Hall-Mills (2019) provided an initial report on changes that occurred in the prevalence of children identified as eligible under the LI category before and after implementation of a statewide RTI policy in the state of Florida in the U.S. Increases in the proportion of the student population that was identified with a primary disability of LI were noted in the years immediately following the RTI mandate but leveled off in subsequent years. However, the report focused only on the prevalence changes for the category of LI and did not report data related to the proportion of students identified under the category of SLD. Because of the broad application of the RTI framework to guide identification for students with SLD, it is equally important to consider any potential impacts on SLD prevalence within an established RTI model. As in Hall-Mills (2019), the present study focuses on the portion of the state’s S/LI prevalence count that is specific to LI. The current study also extends prior research by incorporating the SLD prevalence data and lengthening the period of time examined post-RTI mandate.
Response to Intervention Policy in Florida
The implementation of policy initiatives such as RTI, scientifically, research-based instruction, and evidence-based interventions in decision-making have required states in the U.S. to reconsider methods for special educational needs evaluation, eligibility determination, and implementation of services for students with disabilities. In some states, eligibility determination for special education is conceived as part of a broader approach to identification of and intervention for students who are struggling in the classroom. As part of Florida’s initiative to implement general education interventions prior to special education evaluation, the regulations for the identification of students with disabilities were substantially revised in recent years and directly connect the evaluation and eligibility criteria for students to qualify for special education and related services under the IDEA categories of SLD and LI specifically (FDOE, 2016). In this way, Florida pioneered a statewide program connecting general education and special education initiatives and efforts. Specifically, general education intervention procedures and activities such as the provision of evidence-based interventions to address the area(s) of need via a problem-solving process are required prior to obtaining consent for an initial psychoeducational or language evaluation. Minimal evaluation procedures and documentation of an eligibility determination require, among other things, review of a student’s RTI data. There is no longer a reliance on cognitive referencing criteria for the identification of SLD (Kavale and Spaulding, 2008), nor is there a discrepancy model for the identification of LI. The problem-solving model of RTI is used commonly (Thomas et al., 2020) and SLD identification via RTI mechanisms may have better identification consistency than discrepancy methods (Maki and Adams, 2020). These changes equated to a paradigm shift for the local school agencies in terms of the mechanism of determining eligibility for students with high incidence disabilities such as SLD and LI (National Center on Response to Intervention, 2010).
Specific types of decisions for students (e.g., eligibility for special education and related services) must be considered within the multi-tiered system of supports (MTSS) for all students. Thus, in policy and regulation, there is a blending of general and special education processes. However, it has been challenging for schools to blend these systems despite decades of knowledge and educational programming campaigns designed to merge the general and special education processes. A frequently noted concern of stakeholders has been the potential impact of RTI policy implementation on special education enrollment and identification of language and learning disabilities. Yet, states may not be engaged in close monitoring of their data for such factors (Hudson and McKenzie, 2016).
Aim
Previously, researchers have examined single-year data to measure changes in the number of students identified with disabilities within school systems that utilize an RTI model. The prior studies produced mixed results on the impact of RTI policy implementation on special education enrollment. Furthermore, only one prior study reported longitudinal analyses (Samuels, 2017), but it did not separate the LI data from the combined S/LI data. To date, there has been only one report of longitudinal data examining the timing of RTI mandates with LI prevalence rates specifically (Hall-Mills, 2019), and no previous reports have examined both SLD and LI over multiple school years of RTI policy implementation. Longitudinal data are needed to examine whether the policy affects the numbers of children identified for high incidence disabilities such as SLD and LI and whether those impacts maintain with time. Thus, the present study addresses gaps in the literature via the following research questions:
Research Questions
1) Does the proportion of students identified as eligible for special education in the categories of SLD and LI differ significantly before and after RTI policy implementation?
2) If significant differences exist pre to post RTI policy implementation, are those differences maintained over time across multiple school years?
Materials and Methods
Data Source
The author obtained approval from the university’s institutional review board for human subjects research to examine publicly available data. The federal reporting standards only require states to report the combined number of students identified with speech or language impairment (S/LI), which does not allow for analysis of cases of speech impairment vs. cases of language impairment as a primary exceptionality. However, in the state of Florida, speech impairment and language impairment are considered, coded, and tracked as two distinct categories of eligibility for special education and related services. This level of tracking provides data that are specific to the prevalence of language impairment (LI) as a primary disability.
Data were reviewed from 67 school districts (LEAs) in the state of Florida over an 11 year range of the state’s disability prevalence data for children enrolled in preschool through grade 12 (ages 3–21 years). Prevalence data included the number of children who were identified as eligible for special education with the primary disability of SLD or LI. The data were drawn from school district reports published by the state education agency, for each year beginning with 2 years prior to mandated RTI implementation (2008) through the eighth year after (2018) and entered in a data spreadsheet by the primary investigator. Entries were checked for accuracy against printouts of the original state data reports by a graduate research assistant. Disability prevalence data was derived from the fall reports of Full Time Equivalent Child Count Growth for the 67 individual school districts. The reporting procedures for Child Count Growth reports were standardized for all school districts in the state.
A standard method is to calculate prevalence rates by dividing the number of individuals in the sample with the diagnosis of interest (SLD, LI) by the total number of individuals in the sample (National Institute of Mental Health, 2017). In the present study, a specific value for the SLD and LI prevalence rates was calculated by dividing the number of students with a primary disability of SLD or LI by the total number of students in the general population, for each school district and for each school year in the period 2008–2018. The overall student population of a school district can fluctuate over time, and changes in the number of students identified with SLD or LI could be a function of changes in the general population student count. Thus, this calculation of prevalence controls for changes in school district population size across time.
Analysis
Comparisons of SLD and LI prevalence rates for 67 school districts across 11 school years occurred via SPSS Version 25 with repeated measures analysis of variance (RM-ANOVA). Effect sizes from RM-ANOVA are reported in partial eta squared (ƞp2) and interpreted with the following values (Ellis, 2010): 0.01 (small), 0.06 (medium), and 0.14 (large). An a priori estimate of sample size confirmed the sample size (N = 67) exceeded the minimum sample necessary to detect a small effect.
Results
Changes in SLD and LI Prevalence Rates
To determine whether there were significant differences in SLD and LI prevalence rates over time, two, one-way repeated-measures analyses of variance (RM-ANOVA) were conducted with year as the within-subjects factor and either SLD or LI prevalence rates as the repeated measure. Mauchly’s test indicated that the assumption of sphericity had been violated; therefore, degrees of freedom were corrected using Greenhouse-Geisser estimates of sphericity. In both analyses, there was a significant effect for year with a large effect size for SLD prevalence rates F (2.26, 148.90) = 18.08, p < 0.001, ƞ2 = 0.22, and for LI prevalence rates F (3.02, 199.37) = 9.41, p < 0.001, ƞ2 = 0.14. Repeated contrasts were conducted to compare year by year because the temporal order of the data was important. Significance was established at p < 0.005 after a Bonferroni correction for multiple comparisons. Repeated contrasts produced several significant results for differences in the prevalence from 2008 to each year after RTI implementation (e.g., 2010 and beyond), and are reported below. Tables 1, 2 summarize the descriptive statistics. Proportion values are reported in the tables, and interpreted as the proportion of the student population with the respective category of special educational need. For example, the SLD prevalence proportion value for 2008 was 0.065, which equates to 6.50% of the student population.
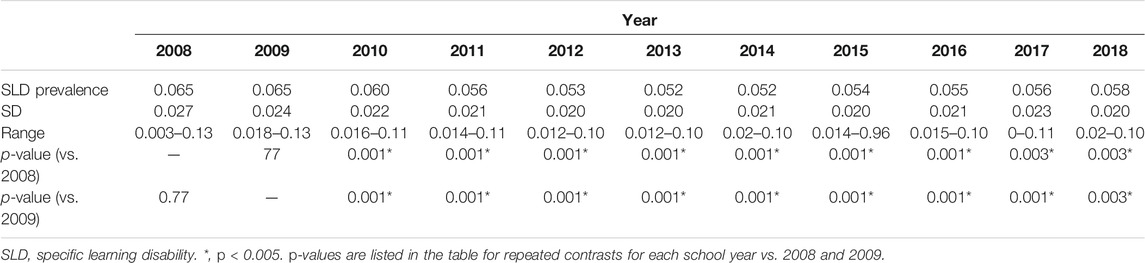
TABLE 1. Descriptive statistics for SLD prevalence rates (N = 67).
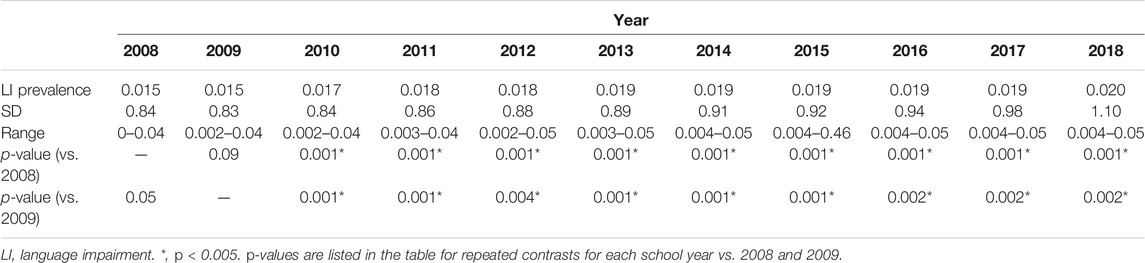
TABLE 2. Descriptive statistics for LI prevalence rates (N = 67).
Longitudinal Stability of Disability Prevalence Rates
Specific Learning Disability
The average 2008 SLD prevalence rate across all districts (M = 0.065) was significantly higher than the average rate in 2010 (M = 0.060), 2011 (M = 0.056), 2012 (M = 0.056), 2013 (M = 0.052), 2014 (M = 0.052), 2015 (M = 0.054), 2016 (M = 0.055), 2017 (M = 0.056), and 2018 (M = 0.058). The 2008 SLD prevalence rate was not significantly different from the average rate in 2009 (M = 0.066). Similarly, the average 2009 SLD prevalence rate was significantly higher than all years 2010–2018. Furthermore, the 2010 SLD prevalence rate was significantly lower than 2008 and 2009 and significantly higher than subsequent years 2011–2018. Remaining pairwise comparisons between years in the 2011–2018 range were not significant, indicating prevalence rates remained at similar levels across seven subsequent school years post RTI implementation.
Language Impairment
The mean 2008 LI prevalence rate (M = 0.015) was significantly lower than the rates in 2010 (M = 0.017), 2011 (M = 0.018), 2012 (M = 0.018), 2013 (M = 0.019), 2014 (M = 0.019), 2015 (M = 0.019), 2016 (M = 0.019), 2017 (M = 0.019), and 2018 (M = 0.020). Similarly, the average 2009 LI prevalence rate (M = 0.015) was significantly lower than all years 2010–2018. Furthermore, the 2010 LI prevalence rate was significantly higher than 2008 and 2009 and significantly lower than subsequent years 2011–2018. Remaining pairwise comparisons between years in the 2011–2018 range were not significant, indicating LI prevalence rates remained at similar levels across seven subsequent school years post RTI implementation.
In summary, the first significant changes in the average SLD and LI prevalence rates occurred in the fall of 2010, the first school year that the RTI policy mandate went into effect for the state. Moreover, after one full school year of RTI policy implementation, another significant increase occurred in the average LI prevalence rate, and a simultaneous decrease in the average SLD prevalence rate. Both trends in disability prevalence have maintained in the years since 2010. Figure 1 provides a graphic illustration of the mean prevalence rates across time.

FIGURE 1. SLD and LI prevalence rates as the proportion of all students in the population across 11 years (in separate file).
Discussion
The goal of this study was to determine whether significant changes occur in the prevalence of students with disabilities who were determined eligible for special education under two high incidence categories of disability (e.g., SLD and LI) across grade level and school year, including a comparison of rates before and after a statewide mandate requiring RTI policy implementation in the public schools. This is important information for a range of stakeholders including local and state educators in general and special education programs, policymakers, and administrators. The results for both research aims are considered further below.
Changes in Prevalence
The first aim was to determine whether the proportion of students identified as eligible for special education in the categories of SLD and LI differed significantly before and after RTI policy implementation. The results indicated that there were significant changes in the prevalence for both categories of exceptionality. The greatest change was observed in the decrease in the mean SLD rate immediately following mandated implementation of RTI policy. Moreover, as the SLD rate significantly decreased, the LI prevalence rate demonstrated the opposite trend, with a significant increase following RTI policy implementation. The finding of prevalence changes for the categories of SLD and LI contributes to the extant literature by illustrating the temporal relation between a broad policy mandate and prevalence data for the two highest incidence disabilities in the school years.
Maintenance of Change Over Time
The second aim was to determine whether any significant differences in the prevalence rates from pre to post RTI implementation were maintained across multiple school years. The results revealed that the trends of decline in SLD prevalence and the increase in LI prevalence post RTI policy implementation maintained over ten subsequent school years. In other words, the SLD and LI prevalence rates did not return to pre-RTI levels. This finding sheds light on the longitudinal nature of SLD and LI prevalence rates during a decade of RTI policy implementation. Results of this study may help illuminate ways in which policy implementation of systemic changes such as an RTI model relate to changes in the proportion of students who are identified with special educational needs.
Comparison to Prior Research
The finding of significant prevalence changes for both disability categories aligns with and departs from previous research. First, the present findings are in contrast to some previous research indicating no changes in special education enrollment via an RTI model (Marston et al., 2007; O’Connor et al., 2014). Second, the comparison of the present findings to the national sample reported by Samuels (2017) are mixed. Samuels suggested that decreases in SLD and S/LI prevalence were related to RTI policy implementation. However, the national data examined by Samuels did not include LI prevalence separately from SI nor were specific dates of pre and post RTI policy implementation reported. Samuels also found a decrease in student counts for both disability categories, whereas the present data reflected a decrease in SLD but an increase in LI prevalence post RTI policy implementation. One possible explanation for the contrast with Samuels’ findings is that Samuels reported the combined S/LI data which masks the relative contribution of the SI vs. LI cases in the data. Furthermore, when controlling for population size in the present dataset, the degree of SLD prevalence change from the first to the eleventh year was smaller (10.8% decrease) than Samuels (14% decrease in SLD). The degree of change for LI prevalence (33% increase) was both a different direction of change and a greater level of change than reported in Samuels (11% decrease). Third, the increase in LI prevalence is consistent with the findings of Hall-Mills (2019) and may corroborate VanDerHeyden et al.’s (2007) finding of larger portions of evaluated students determined eligible for special education via an RTI model in a suburban school district in Arizona. Moreover, VanDerHeyden and colleagues posited that RTI processes could result in decreases in SLD qualification simultaneously with increases in other disability categories such as S/LI.
Finally, the present findings in part confirmed the findings of Pullen et al. (2020), with significant decreases in SLD prevalence over the time examined. However, the present findings also differ from Pullen et al. (2020) in terms of the prevalence rates observed. The national data reviewed by (Pullen et al., 2020). indicated a lower SLD and higher LI prevalence rate than the Florida data suggest. One possible reason for the difference is the variability in the age ranges reported. The present study examined data derived from children ages 3–21 years, whereas the data reviewed by (Pullen et al., 2020). included children ages 6–17 years. It is plausible that the Florida data reflect a slightly higher prevalence rate for the full range of 3–21 because the state reports many 5-year-old children in kindergarten and 18–21 year old students in high school who are identified with SLD. The same is true for the LI data reported herein (ages 3–21). Additionally, the data in the present study includes only LI, not the combined S/LI data as in other studies that utilize the combined data available through OSEP. If Florida’s prevalence of speech impairment was combined with that of language impairment, the prevalence rate of S/LI as a joint category of disability would be similar to the S/LI prevalence reported elsewhere, including (Pullen et al, 2020).
It is important to monitor the prevalence rates over multiple years. Some fluctuations in IDEA-eligibility disability prevalence may occur over time with or without known triggers such as specific changes in policy or practice. If the state’s prevalence rates for SLD and LI were already on a trajectory of significant decreases and increases (respectively) prior to RTI policy implementation, it would be difficult to determine the level of impact of the initiation of the RTI mandate on the subsequent rates. The data reflected in Figure 1 indicated that SLD and LI prevalence in Florida has remained consistently different than pre-RTI levels across multiple school years. When an additional five school years of data prior to RTI implementation are considered (2003–2007), the SLD and LI prevalence rates appear devoid of any significant fluctuations for several years prior to RTI implementation in the state (SLD prevalence of 6.6%; LI prevalence of 1.44%). Furthermore, the maintenance of the prevalence trends following a large-scale policy initiative such as RTI illustrate that the SLD and LI prevalence rates have not returned to pre-RTI levels. The stability in the prevalence rates for several years prior and subsequent to RTI policy implementation with the most significant changes occurring immediately upon the policy mandate suggests that the implementation of the RTI model may have brought about long-term adjustments in the proportion of Florida’s student population identified with a primary disability of SLD or LI. Two of the weaknesses in prior research are the lack of longitudinal data and specificity to LI; thus, the present investigation adds to the current literature in those regards.
Limitations and Future Research Directions
Future researchers should note some practical limitations associated with the data utilized for the current study. First, the data source only included primary disability counts. Primary disability reporting is the standard practice in public schools in the U.S. However, the addition of secondary disability data would provide further insight to secondary disability determinations before and after implementation of policies such as RTI. This is especially relevant for the LI prevalence data. Language impairment may occur in the presence of a range of other conditions that are also recognized as categories of disability within IDEA, including autism spectrum disorder, developmental disabilities, intellectual disabilities, hearing loss, and traumatic brain injury, among others (ASHA, 1993). Many more children have a secondary disability of LI than have a primary one. Therefore, true LI prevalence likely is underestimated by examining only the data reflecting the primary disability category.
Second, the data examined do not support causal analysis. It cannot be stated with certainty the exact degree of influence that RTI policy implementation had in changes that occurred in the proportion of children deemed eligible under the categories of SLD and LI. However, the data do reveal a connection may exist in the timeline of broad policy changes and fluctuations in student counts for select categories of disability. Local education agencies have access to school-level data which would be more revealing as to the patterns that may exist among RTI policy and process implementation, evaluation referral rates, and eligibility determinations in individual categories of disability under IDEA. Moreover, school-level data could allow further examination of the role of school demographics or implementation of specific RTI practices (e.g., fidelity data) in changes following institution of statewide RTI policy. Finally, future researchers may investigate whether shifts in policy result in changes in existing disparities in SLD or LI for certain subgroups of students.
Third, generalization of findings from data sourced from one state in the United States may be limited to school systems with similar programs and demographics. It is not known how the current findings would line up with RTI procedures in other states with a recommended vs. mandated policy for RTI, especially considering the wide inter-state variability in RTI practices (Hudson and McKenzie, 2016). The data reported herein may be especially applicable for other states that experienced policy mandates in recent years that may have affected disability prevalence rates. The state of Florida is the focus of this analysis because the data collected was robust and allowed for analysis of the LI data in addition to SLD with very clear pre and post implementation time points. Further research could compare special education enrollment and prevalence data across a greater range of states and state timelines of RTI implementation.
Fourth, the data was examined collectively across all grade levels. Future studies should include an examination of the prevalence data by grade level. There is some prior evidence to suggest variations in RTI implementation by school level (e.g., elementary vs. secondary) that may alter the prevalence trends within specific grade levels (Fuchs et al., 2010; Thomas et al., 2020). Thus, it is important to explore further grade level effects to align resources in support for RTI efforts, and to examine more closely the mechanism by which children with SLD and LI are identified and educated.
Implications for Practice
Regulatory shifts such as mandated implementation of RTI policy can impact the rate of referrals and eligibility determination under IDEA for high incidence categories of disability such as SLD and LI. The present data indicate that a statewide RTI policy standard appears to have had a significant impact on the prevalence of SLD and LI in at least one large, demographically diverse state. The simultaneous decrease in SLD prevalence and increase in LI prevalence has implications for local school systems that must align resources and staff to address the special educational needs of a growing number of students who are eligible for special education as students with LI.
Disability prevalence changes within individual school systems may reflect local-level variance among multidisciplinary teams in how RTI policy is implemented (Zirkel and Thomas, 2010) and/or a lack of fidelity with RTI implementation (Maier et al., 2016). These are two notable reasons why schools need to evaluate the systems and procedures that are in place (Castillo and Batsche, 2012). Measures of RTI implementation fidelity in combination with monitoring of disability prevalence data would provide a mechanism for data-driven improvements. In addition to prevalence rates, continued monitoring of special education referral and determination data are necessary to ensure fidelity within the processes in place.
Regulatory adjustments such as the mandated implementation of RTI policy have the potential to foster positive changes in student outcomes. If the essence of RTI policy is prevention and earlier intervention than what was feasible in the traditional model of referral and evaluation for special education, then it begs the question of whether RTI is indeed preventing or mitigating the potential educational impacts for children with special educational needs such as SLD and LI. It is not yet established whether more students are having their educational needs met with effective programming, which is the ultimate goal of such policies. To truly know whether implementation of RTI policy results in better outcomes for students at risk for SLD and LI, further research is warranted to track student outcomes more specifically. This will require research and school partnerships and finer-grained analyses of school-level data.
Data Availability Statement
Publicly available datasets were analyzed in this study. This data can be found here: https://edudata.fldoe.org/.
Ethics Statement
The studies involving human participants were reviewed and approved by Human Subjects Committee, Florida State University. Written informed consent for participation was not required for this study in accordance with the national legislation and the institutional requirements.
Author Contributions
The author confirms being the sole contributor of this work and has approved it for publication.
Conflict of Interest
The author declares that the research was conducted in the absence of any commercial or financial relationships that could be construed as a potential conflict of interest.
References
American Speech-Language-Hearing Association (1993). “Definitions of Communication Disorders and Variations,”. [Relevant paper]. Available from www.asha.org/policy.
Backenson, E. M., Holland, S. C., Kubas, H. A., Fitzer, K. R., Wilcox, G., Carmichael, J. A., et al. (2015). Psychosocial and Adaptive Deficits Associated with Learning Disability Subtypes. J. Learn. Disabilities 48 (5), 511–522. doi:10.1177/0022219413511861
Bailey, T. R. (2018). Is MTSS/RTI here to stay? All signs point to yes! [Blog post]. Center on Response To Invention At American Institutes For Research. Retrieved from https://rti4success.org/blog/mtssrti-here-stay-all-signs-point-yes.
Berkeley, S., Bender, W. N., Peaster, L. G., and Saunders, L. (2009). Implementation of Response to Intervention: A Snapshot of Progress. J. Learn. Disabilities 42 (1), 85–95. doi:10.1177/0022219408326214
Burns, M. K., and VanDerHeyden, A. M. (2006). Using Response to Intervention to Assess Learning Disabilities [Special Issue]. Assess. Eff. Intervention 32 (1), 3–64. doi:10.1177/15345084060320010201
Castillo, J. M., and Batsche, G. M. (2012). Scaling up Response to Intervention: The Influence of Policy and Research and the Role of Program Evaluation. Communique 40 (8), 14–16.
Catts, H. W., Fey, M. E., Tomblin, J. B., and Zhang, X. (2002). A Longitudinal Investigation of Reading Outcomes in Children with Language Impairment. J. Speech Lang. Hearing Res. 45 (6), 1145–1157. doi:10.1044/1092-4388(2002/093
Cortielle, C., and Horowitz, S. (2014). The State of Learning Disabilities: Facts, Trends, and Emerging Issues. 3rd ed. New York: National Center for Learning Disabilities.
Ehren, B. J., and Nelson, N. W. (2005). The Responsiveness to Intervention Approach and Language Impairment. Top. Lang. Disord. 25 (2), 120–131. doi:10.1097/00011363-200504000-00005
Ellis, P. D. (2010). The Essential Guide to Effect Sizes: Statistical Power, Meta-Analysis, and the Interpretation of Research Results. New York: Cambridge University Press.
Florida Department of Education, FDOE (2016). State Board of Education Rule 6A-6.030121 (Florida Administrative Code). Exceptional Student Education Eligibility for Students with Language Impairments and Qualifications and Responsibilities for the Speech-Language Pathologists Providing Language Services. Retrieved from http://www.flrules.org
Fuchs, D., Compton, D. L., Fuchs, L. S., Bryant, J., and Davis, G. N. (2008). Making “Secondary Intervention” Work in a Three-Tier Responsiveness-To-Intervention Model: Findings from the First-Grade Longitudinal Reading Study of the National Research Center on Learning Disabilities. Reading Writing: Interdiscip. J. 21 (4), 413–436. doi:10.1007/s11145-007-9083-9
Fuchs, D., and Fuchs, L. S. (2007). Responsiveness to Intervention [Special Issue]. Teach. Exceptional Child. 39 (5), 4–67. doi:10.1177/004005990703900503
Fuchs, L. S., Fuchs, D., and Compton, D. L. (2010). Rethinking Response to Intervention at Middle and High School. Sch. Psychol. Rev. 39 (1), 22. doi:10.1080/02796015.2010.12087787
Grosche, M., and Volpe, R. J. (2013). Response-to-intervention (RTI) as a Model to Facilitate Inclusion for Students with Learning and Behavior Problems. Eur. J. Spec. Needs Edu. 28 (3), 254–260. doi:10.1080/08856257.2013.768452
Hall-Mills, S. (2019). A Comparison of the Prevalence Rates of Language Impairment before and after Response-To-Intervention Implementation. Lang. Speech Hearing Serv. Schools 50 (4), 703–709. doi:10.1044/2019_LSHSS-18-0144
Hauerwas, L. B., Brown, R., and Scott, A. N. (2013). Specific Learning Disability and Response to Intervention: State-Level Guidance. Exceptional Child. 80 (1), 101–120. doi:10.1177/001440291308000105
Hudson, T. M., and McKenzie, R. G. (2016). Evaluating the Use of RTI to Identify SLD: A Survey of State Policy, Procedures, Data Collection, and Administrator Perceptions. Contemp. Sch. Psychol. 20 (1), 31–45. doi:10.1007/s40688-015-0081-7
Hughes, C. A., and Dexter, D. D. (2011). Response to Intervention: A Research-Based Summary. Theor. Into Pract. 50 (4), 4–11. doi:10.1080/00405841.2011.534909
Individuals with Disabilities Education Act (2004). Individuals With Disabilities Education Act 20 U.S.C. § 1400 U.S. Department of Education.
Kavale, K. A., and Spaulding, L. S. (2008). Is Response to Intervention Good Policy for Specific Learning Disability? Learn. Disabilities Res. Pract. 23 (4), 169–179. doi:10.1111/j.1540-5826.2008.00274.x
Kurns, S., and Tilly, W. D. (2008). Response To Intervention Blueprints: School Building Level Edition. Alexandria, VA: The National Association of State Directors of Special Education.
Maier, M. P., Pate, J. L., Gibson, N. M., Hilgert, L., Hull, K., and Campbell, P. C. (2016). A Quantitative Examination of School Leadership and Response to Intervention. Learn. Disabilities Res. Pract. 31 (2), 103–112. doi:10.1111/ldrp.12100
Maki, K. E., and Adams, S. R. (2020). Specific Learning Disabilities Identification: Do the Identification Methods and Data Matter? Learn. Disabil. Q. 32 (2), 63–74. doi:10.1177/0731948719826296
Marston, D., Lau, M., and Muyskens, P. (2007). “Implementation of the Problem-Solving Model in the Minneapolis Public Schools,” in Handbook of Response to Intervention: The Science and Practice of Assessment and Intervention. Editors S. R. Jimerson, M. K. Burns, and A. M. VanDerHeyden (Boston, MA: Springer), 279–287. doi:10.1007/978-0-387-49053-3_21
National Center on Response to Intervention (2010). Essential Components of RTI: A Closer Look at Response To Intervention. Washington, DC: U.S. Department of Education, Office of Special Education Programs, National Center on Response to Intervention.
National Institute of Mental Health (2017). What Is Prevalence? Retrieved from https://www.nimh.nih.gov/health/statistics/what-is-prevalence.html
Nippold, M. A. (2017). Reading Comprehension Deficits in Adolescents: Addressing Underlying Language Abilities. Lang. Speech Hearing Serv. Schools 48 (2), 125–131. doi:10.1044/2016_LSHSS-16-0048
O’Connor, R. E., Bocian, K. M., Sanchez, V., and Beach, K. D. (2014). Access to a Responsiveness to Intervention Model: Does Beginning in Kindergarten Matter. J. Learn. Disabilities 47 (4), 307–328. doi:10.1177/0022219412459354
O’Connor, R. E., Fulmer, D., Harty, K. R., and Bell, K. M. (2005). Layers of Reading Intervention in Kindergarten through Third Grade: Changes in Teaching and Student Outcomes. J. Learn. Disabilities 38 (5), 440–455. doi:10.1177/00222194050380050701
Pullen, P. C., Ashworth, K. W., and Ryoo, J. H. (2020). Prevalence Rates of Students Identified for Special Education and Their Interstate Variability: A Longitudinal Approach. Learn. Disabil. Q. 43 (2), 88–100. doi:10.1177/0731048719837912
Samuels, C. A. (2017). Special Education Enrollment Rose in 2015-16; 2015-16 Numbers Boosted by Students with Autism. Education Week 36 (19), 6.
Spectrum K12 School Solutions (2011). Response to Intervention Adoption Survey 2011. Available via http://www.spectrumk12.com.
Thomas, E. R., Conoyer, S. J., and Lembke, E. S. (2020). Districtwide Evaluation of RTI Implementation: Successes, Challenges, and Self-Efficacy. Learn. Disabilities Res. Pract. 35 (3), 118–125. doi:10.1111/ldrp.12226
Tomblin, J. B., Zhang, X., Buckwalter, P., and O’Brien, M. (2003). The Stability of Primary Language Disorder: Four Years after Kindergarten Diagnosis. J. Speech Lang. Hearing Res. 46 (6), 1283–1296. doi:10.1044/1092-4388(2003/100
U.S. Department of Education. (2018). Thirty-ninth Annual Report to Congress on the Implementation of the Individuals with Disabilities Education Act: 2007. Online at: http://www2.ed.gov/about/reports/annual/osep/2007/parts-b-c/index.html
VanDerHeyden, A. M., Witt, J. C., and Gilbertson, D. (2007). A Multi-Year Evaluation of the Effects of a Response to Intervention (RTI) Model on Identification of Children for Special Education. J. Sch. Psychol. 45 (2), 225–256. doi:10.1016/j.jsp.2006.11.004
Yew, S. G., and O’Kearney, R. (2013). Emotional and Behavioural Outcomes Later in Childhood and Adolescence for Children with Specific Language Impairments; Meta-Analyses of Controlled Prospective Studies. J. Child Psychol. Psychiatry 54 (5), 516–524. doi:10.1111/jcpp.12009
Young, A. R., Beitchman, J. H., Johnson, C., Douglas, L., Atkinson, L., Escobar, M., et al. (2002). Young Adult Academic Outcomes in a Longitudinal Sample of Early Identified Language Impaired and Control Children. J. Child Psychol. Psychiatry 43 (5), 635–645. doi:10.1111/1469-7610.00052
Keywords: special education, learning disabilities, language impairment, response to intervention, prevalence
Citation: Hall-Mills S (2021) Shifting Prevalence Patterns for Special Educational Needs in the Era of Response-to-Intervention Policy. Front. Educ. 6:676646. doi: 10.3389/feduc.2021.676646
Received: 05 March 2021; Accepted: 30 April 2021;
Published: 24 May 2021.
Edited by:
Susana Castro-Kemp, University of Roehampton London, United KingdomReviewed by:
Rosanna Yuen-Yan Chan, The Chinese University of Hong Kong, ChinaKonstantinos M. Ntinas, Ministry of Education, Research and Religious Affairs, Greece
Copyright © 2021 Hall-Mills. This is an open-access article distributed under the terms of the Creative Commons Attribution License (CC BY). The use, distribution or reproduction in other forums is permitted, provided the original author(s) and the copyright owner(s) are credited and that the original publication in this journal is cited, in accordance with accepted academic practice. No use, distribution or reproduction is permitted which does not comply with these terms.
*Correspondence: Shannon Hall-Mills, U2hhbm5vbi5IYWxsLU1pbGxzQGNjaS5mc3UuZWR1