 Laurie Delnoij*
 Jose Janssen
 Kim Dirkx
 Hieronymus Gijselaers
 Renate H. de GrootJoyce NeroniMarion de BieRob Martens
- Faculty of Educational Sciences, Open Universiteit, Heerlen, Netherlands
Non-completion is an ongoing concern in higher education, and even more so in higher online education. One way to address this problem is to take initiatives prior to student enrollment, enabling informed decision making. In line with this, an institution for open higher online education seeks to develop a (non-committal) online self-assessment for prospective students. To identify variables (tests) to be included in this self-assessment, the present study aims at validating variables–previously identified as “predictive of completion in higher education and open to intervention before enrollment”—within the current higher online education context. Results of correlational analyses indicate that the following modifiable variables are relevant to include: hours planned to study, employment hours, study intention, discipline, discipline confidence, basic mathematical skills, and social support. Based on a sensitivity cut-off of 95% (to minimize false negatives) about 13% of the actual non-completers could be identified correctly. Implications for future development of the self-assessment are discussed.
Introduction
Higher online education is expanding (Seaman et al., 2018). But the openness and flexibility of such online delivery, compared to traditional higher education (e.g., face-to-face education), comes at a price. That is, the number of students not completing a course or program in higher online education is impending, despite diverse initiatives taken by educational institutions (Rovai, 2003; Simpson, 2010, 2013; Vossensteyn et al., 2015). It is important for both the student and the educational institution that non-completion is kept to a minimum. For the institution, non-completion amounts to wasted effort (time and money invested), and possibly reputational damage, as completion is often one of the performance criteria presented in catalogues for prospective students’ study decisions, and in some countries funding for educational institutions depends on such outcomes as completion rates (Vossensteyn et al., 2015). For the student, non-completion is also an issue in regard to the invested time and money. In addition, (repeatedly) concluding that the chosen study path does not fit one’s characteristics (e.g., knowledge, skills and goals) and/or situation (e.g., combining a study with other responsibilities) might have a demotivating effect for future studies. One way to address this problem is to take initiatives (interventions) prior to student enrollment, to help students choosing a study program that optimally suits them, and to ensure that prospective students’ expectations with regard to their courses or studies are realistic (Menon, 2004; Oppedisano, 2009; Vossensteyn et al., 2015; Muljana and Luo, 2019). One course of action in the direction of such an improved orientation prior to student enrollment is the development of (non-committal) self-assessments. It has been assumed that non-selective, but adequate and personalized information will help prospective students to make an informed study decision (McGrath et al., 2014). We define these kinds of self-assessments as “the active participation of students in making judgments about their own characteristics (i.e., knowledge, skills, and expectations), in order to foster reflection on the extent to which these characteristics fit with studying in a specific context” (definition adapted from Dochy et al., 1999, p. 334). However, interventions aimed at decreasing non-completion implemented prior to student enrollment are not yet strongly flanked by scientific research (Delnoij et al., 2020). To the extent that interventions prior to student enrollment are systematically researched, these studies largely took place in the context of traditional higher education, typically characterized by a target group of students enrolling right after obtaining their high school degree (Fonteyne and Duyck, 2015).
We aim to design and develop a non-committal online self-assessment (i.e., hereafter referred to as “the self-assessment” or SA) to inform prospective students in open higher online education about the match between their characteristics (e.g., knowledge, skills, and expectations), and what is conducive to study in higher online education. This SA is aimed at identifying prospective students with lower chances for completion and provide feedback on how they can enhance their chances for completion. It will be non-committal, as prospective students will not be obliged to fulfill this assessment, and students will not be selected based on their self-assessment results as the institute operates according to an open access policy. To determine the relevant variables to be included in such a self-assessment (i.e., to ensure evidence-informed study decision making), we investigated predictors of non-completion in higher education through a review of reviews (Delnoij et al., 2020). As a second step, it is important to verify predictors resulting from that study in the current context for which the SA is being developed. The aim of the present study, therefore, is to validate the use of previously identified predictors for completion in the context of higher online education and to examine which of these variables need to be included in the SA as constituent components. Theoretical considerations underpinning the validation process are elaborated in Theoretical Framework. The (selection of) possible predictors included in this validation study will be discussed in sections 2.2 and 2.3. The results of this study will be used to develop the SA.
Theoretical Framework
Validation as a Process
Validity can be defined as an “overall evaluative judgment of the degree to which empirical evidence and theoretical rationales support the adequacy and appropriateness of interpretations and actions based on test scores or other modes of assessment” (Messick, 1989, p.2). In line with this definition above, as well as modern validity theories, we consider validity to refer to the inferences (interpretations and actions based on assessment scores) rather than the instrument itself, and validation as a process requiring ongoing evaluation of evidence, rather than a “once and for all” conclusion (Royal, 2017). In this respect, the validation process described in this paper must be considered as “first steps” of evidence collection concerning the validity of inferences supported by the self-assessment. The Standards for Educational and Psychological Testing developed by the American Educational Research Association (AERA), the American Psychological Association (APA), and the National Council on Measurement in Education, mention five sources of evidence (Cizek, Bowen, and Church, 2010; Creswell, 2014): evidence based on the test content (e.g., expert opinions), evidence based on response processes (e.g., interviews with test-takers on their experiences with the test), evidence based on the internal structure (e.g., dimensionality and internal consistency), evidence based on relations to other variables (e.g., the predictive value on an expected outcome), and evidence based on the consequences of testing (either intended or not, positive or negative, etc.). The latter type of evidence, according to St-Onge et al. (2016) can be evaluated from both an individual and a societal perspective. In the context of the current self-assessment, the anticipated individual consequence involves the decision to enroll (or not), based on the test scores and feedback. At a societal level, the implicated consequence is a positive impact of the self-assessment on completion rates. Figure 1 illustrates the various evidence sources and their relevance at various stages of the (design-based) development of the current self-assessment. Currently, this process is still at the stage of Analysis. Following a previous selection of evidence on predictors ‘in general’ by means of a literature review, this study investigates the relationship of these predictors with completion in the current context. Once this relationship has been established on the predictor level, it will be further investigated at the model level (i.e., the prediction accuracy of the combined predictors). Prior to investigating the predictive value of predictors measured by means of (sub)scales, it is important to secure the internal structure and consistency of these variables in the present context.
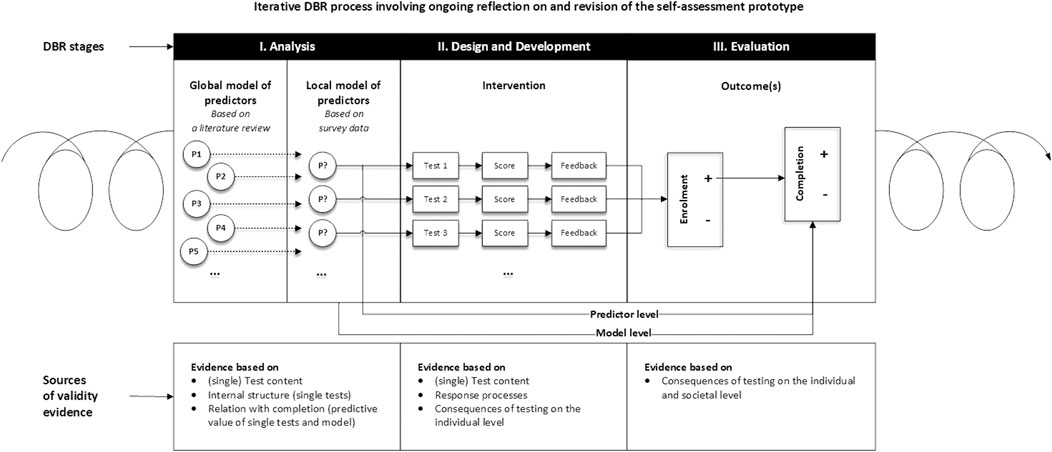
FIGURE 1. Online Self-Assessment Development and Validation Process.
In the next stages of the development and validation process, further evidence will be collected in regard to test content (e.g., user experiences) and response processes. Regarding the latter, a general point of concern is that self-assessments, i.e., self-report measures, may be subject to all kinds of measurement errors, due to, for instance, inaccurate self-perceptions (Dunning et al., 2004) or social desirable answering (Viswesvaran and Ones, 1999; Niessen et al., 2017). Furthermore, as explained above, evidence with respect to the consequences of testing from both an individual (e.g., enrollment decision based on test scores and feedback) as well as a societal perspective (e.g., impact on completion rates) is required in the future stages of the validation process.
Predictor Selection Criteria
Taking into account that predictors are to be selected as input for a non-committal SA prior to student enrollment, several requirements are formulated to select the possible predictors from prior research. First, predictors need to be identified as variables relevant prior to admission, as it would not make sense to obtain information prior to student enrollment on variables that, in nature, can only play a role after enrollment (e.g., academic adjustment). Prior-to-admission variables identified by Rovai (2003) for instance comprise student characteristics (e.g., academic preparation) and student skills (e.g., time management). Second, the modifiability of variables is a requirement in the present study. That does not mean that non-modifiable variables cannot explain non-completion, or are irrelevant in this context. However, modifiability is required, as the SA needs to give insight into where there is room for improvement and how prospective students can raise their chances for completion. According to our definition, a variable is modifiable if the variable is changeable or can be advised upon. For instance, self-regulation skills (e.g., learning strategies) are trainable (Patterson et al., 2014), and the number of hours a student plans to study can be advised upon (but not be changed directly). Third, as there has been carried out a lot of research on predictors of non-completion in higher education, consistency of prior results is a requirement we take into account. Previous research in this domain is on specific predictors or carried out in specific study programs. Review studies are merely carried out in the context of traditional higher education, and effect sizes are often not reported. This means that conclusions on the predictive value of variables in the context of higher online education need to be drawn with caution. We aim to validate predictors from prior research that preferably have been demonstrated consistently (Delnoij et al., 2020). All in all, we aim to include modifiable variables, relevant prior to student enrollment, which review studies have consistently identified as possible predictors of non-completion in higher (online) education.
Selected Predictors
Our previous extensive literature review (Delnoij et al., 2020), yielded potential predictors meeting the selection criteria: academic self-efficacy, employment (hours), basic mathematical skills, study intentions, goal orientation, learning strategies, and social support. Therefore, these predictors are included in the current study. In this previous literature review, motivation, as a possible predictor, surprisingly did not meet the consistency criterion. However, in the context of higher online education, it has been argued that a related concept–volition–might actually be more re levant than motivation (Deimann and Bastiaens, 2010). Volition has been defined as “the tendency to maintain focus and effort toward goals despite potential distractions” (Corno, 1994, p. 229). In the case of adults combining a study with a job and family or other responsibilities, distractions or obstacles interfere with the study process. According to Deimann and Bastiaens (2010), motivation might not be enough to overcome these distractions or obstacles. It has been argued that whereas motivation is relevant for initiating activity, volition might be more relevant in accomplishing that certain activity (Deimann and Bastiaens, 2010). It seems that volition possibly is a relevant variable in relation to our outcome measure of interest. Therefore, we added volition as a potential predictor to our list.
All in all, the current study focuses on the predictors as listed and defined in Table 1. The operationalization and measurement of these variables are further elaborated in the methodology section.
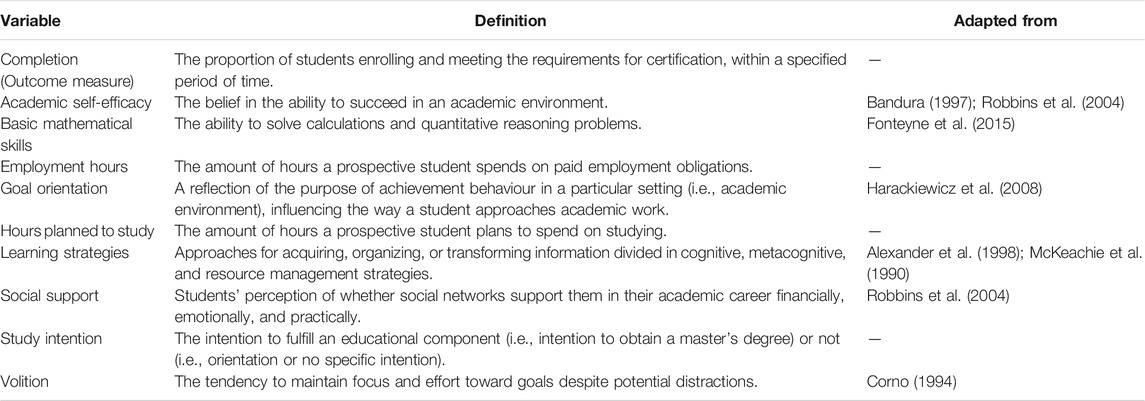
TABLE 1. Definitions of Variables.
Research Questions
The present study aims to gain insight into whether the predictors selected from prior literature are relevant in explaining completion in higher online education. Also, we aim to gain insight into the extent to which actual completers and non-completers can be classified correctly by the predictors of non-completion in the context of the Open University of the Netherlands (OUNL), as we want to minimize the risk of falsely discouraging prospective students. Before we investigate the predictive value of the selected variables and the accuracy of classifying non-completers, it is important to secure the internal structure of predictor operationalization in the current context. Hence, three research questions are subsequently addressed in the current study.
1. To what extent can the internal structure of the instruments used to operationalize the selected predictors be validated in higher online education?
2. To what extent is the (relative) predictive value of the selected variables verified by data from a higher online educational context?
3. To what extent can prospective students be accurately identified as completers or non-completers by the validated predictors?
Materials and Methods
Context and Design
The present study is part of a design-based research process (Van den Akker et al., 2013). As illustrated in Figure 1, the results of the analysis phase give input for the design and development of an intervention in a certain context. In the present research, the intervention is the non-committal online SA in the context of the OUNL (i.e., an institute for higher distance education). The OUNL also has to contend with relatively high non-completion rates. For example, approximately 40% of the course participants enrolling in September 2018 did not obtain any study credits within the valid registration period. Education in the OUNL is provisioned mainly online, occasionally combined with face-to-face meetings. Academic courses up to full study programs are provided to obtain a bachelor’s or master’s degree in the following study directions: law, management sciences, informatics, environmental sciences, cultural sciences, educational sciences, and psychology. The OUNL operates according to an open access policy, which means that for bachelor programs, no prior education is required, and the only requirement is a minimum age of 18 years. Students can choose to study a single course or a combination of courses, up to a full bachelor- or master’s program. In general, students have three examination attempts for each course within 14 months after enrollment, after which registration for a course is no longer valid.
The present study can be characterized as a correlational (prediction) design (Creswell, 2014), which means that no conclusions on causality can be drawn from the results. The data is based on two different student surveys, of which the first, most elaborative survey was used to collect data between August 2012 and December 2014 (Neroni et al., 2015). Hereafter, this part of the data is referred to as data collection or dataset 1. As these data did not cover all selected variables, supplementary data collection was executed between September 2017 and February 2019, hereafter referred to as data collection or dataset 2. Data from both data collections were supplemented with data from the student information system on the criterion measure: completion within 14 months after enrollment.
Participants
All (approached) participants were first time enrolling students in the OUNL, as a proxy for the eventual target group of the intervention, prospective students of the OUNL. In Table 2 an overview of the sample(s) is provided.
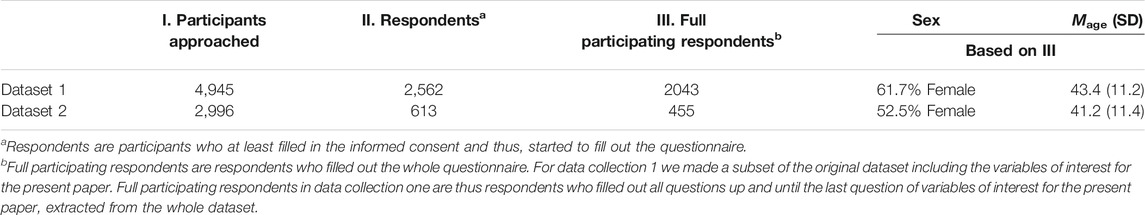
TABLE 2. Sample Information.
Procedure
The data collection procedure for the two data collections was nearly the same. Newly enrolled students received an email explaining the purpose of the study with an invitation to fill out the online questionnaire. Informed consent was obtained online, preceding the actual questionnaire. Full completion of the questionnaire took approximately 45–60 min in data collection 1 and 30 min for the questionnaire used in data collection 2. Respondents were able to pause and return to the questionnaire if they wished so. Response-enhancing measures included sending out email reminders (both data collections) and follow up phone calls (data collection 1). Besides, in data collection 2, the invitation email was signed by the rector of the educational institution to enhance participation.
Measures
Scale Measures
An overview of all independent measures’ factors, number of items, and reliabilities (expressed in Cronbach’s alpha) based on prior research are given in Table 3.
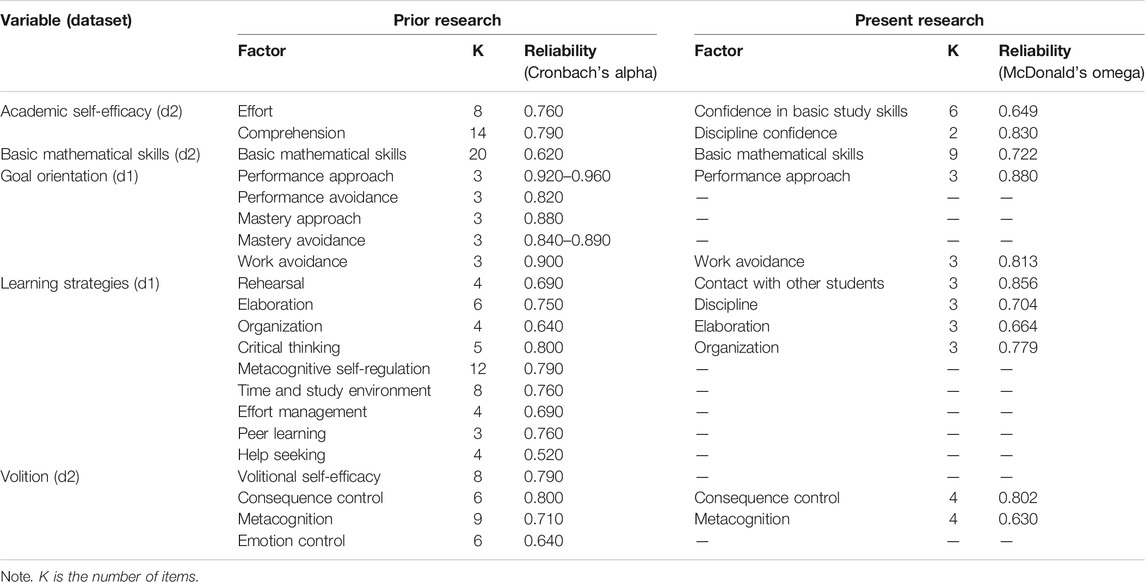
TABLE 3. Factor Structure per Variable and Reliability per Factor in Prior and Present Research.
Academic self-efficacy was measured by the College Academic Self-Efficacy Scale, adjusted by Fonteyne et al. (2017), which we, in turn, adapted to better fit the context of adult and online learning (i.e., we changed some terms and added three items). The eventual questionnaire consists of 23 items. Respondents were instructed to rate all items on a scale of 1 (completely unable to) to 5 (completely able to). Fonteyne et al. (2017), reported a 2-factor structure with factors identified as effort (e.g., “Attending class regularly”), and comprehension (e.g., “Understanding most ideas you read in texts”).
Basic mathematical skills were measured by a set of 20 items based on work by Fonteyne et al. (2015, 2017). The test consists of open questions, yes/no questions, and multiple-choice questions. One example item is “If x/y = 0.25, then y/x = ?”. There was no time limit and respondents were not allowed to use calculators, although we could not control for that as the test was fulfilled online.
Goal orientation was measured by the Achievement Goal Questionnaire developed by Elliot and McGregor (2001), supplemented by the Work Avoidance Scale (Harackiewicz et al., 2008). In total 15 items, equally divided in five categories are measured: mastery approach (e.g., “I want to learn as much as possible from this class”), mastery avoidance (e.g., “I am worried that I will not understand everything in this class as thoroughly as I would want to”), performance-approach (e.g., “It is important for me to do well compared to others in this class”), performance-avoidance (e.g., “I just want to avoid doing poorly in this class”), and work avoidance (e.g. “I want to do as little work as possible in this class”). In the present study, to fit the adult and online learning context, the word “class” was replaced by “course”. All items are rated on a scale of 1 (totally disagree) to 7 (totally agree).
Learning strategies were measured by part B of the Motivated Strategies for Learning Questionnaire (MSLQ) (Pintrich et al., 1993), adapted to the adult and distance learning context (e.g., replacing “class” by “course”). The original questionnaire consists of 50 items divided in nine factors: rehearsal (e.g., “When I study for this course, I practice saying the material to myself over and over”), elaboration (e.g., “When I study for this course, I pull together information from different sources, such as lectures, readings, and discussions”), organization (e.g., “When I study the readings for this course, I outline the material to help me organize my thoughts”), critical thinking (e.g., “I often find myself questioning things I hear or read in this course to decide if I find them convincing”), metacognitive self-regulation (e.g., “When reading for this course, I make up questions to help focus my reading”), time and study environment management (“I usually study in a place where I can concentrate on my course work”), effort regulation (e.g., “I work hard to do well in this course even if I don’t like what we are doing”), peer learning (e.g., “When studying for this course, I often set aside time to discuss course material with a group of students from the course”), and help seeking (e.g., “I ask the instructor to clarify concepts I don’t understand well”). Respondents were instructed to consider these items in relation to the way in which they intend to study. All items are rated on a scale of 1 (totally disagree) to 7 (totally agree).
Volition was measured by an adapted version of the Academic Volitional Strategy Inventory (McCann and Turner, 2004; Deimann and Bastiaens, 2010). All items were introduced as follows: “If at any point I notice that I'm not working in a targeted manner and with little concentration, then...”. This questionnaire consists of 32 items, divided in four factors: volitional self-efficacy (e.g., “I think about my strengths in order not to get blocked by my weaknesses”), consequence control (e.g., “I think about the negative effects of not finishing my tasks or projects”), emotion control (e.g., “I try to think about joyful things”), and metacognition (e.g., “I reflect on my planning and adjust the associated goals if necessary”). All items are rated on a scale of 1 (completely not applicable to me) to 5 (completely applicable to me).
Single Indicator Measures
As single indicator measures do not comprise a full questionnaire, they are taken into account only in relation to research questions two and 3. An overview of “single indicators” (except covariates) is provided in Supplementary Material S1.
Employment hours was measured as the number of hours in a paid employment contract. Respondents indicating they were not employed, were given value 0.
Hours planned to study was measured by one open-ended question: “How many hours do you expect to study on average per week?”.
Social support is divided into financial, emotional, and practical support and measured by newly developed questions, resulting in three dichotomous variables indicating whether respondents receive support (1) or not (0).
Study intention was measured by one multiple-choice question in which respondents were asked to indicate their achievement intentions. Their answers were coded 0 if they indicated no specific study intention (i.e., no explicit intention to obtain study credits) and one if they indicated the intention to fulfill a course or program (i.e., in other words, to obtain study credits). Details about these questions and answer options can be found in Supplementary Material S1.
Covariates taken into account are prior level of education, gender, age, and faculty. These variables were obtained by the student administration office of the educational institution, or inquired by a multiple-choice (e.g., age) or open ended (age) question.
Criterion Measure
Completion data was distracted from the student information system, with a score of one being assigned to those students completing at least one course within 14 months (after which registration is no longer valid), else a score of 0.
Statistical Analyses
Research question 1: To what extent can the internal structure of the instruments used to operationalize the selected predictors be validated in higher online education? To answer the first research question, analyses of descriptives (SPSS Version 24.0), factor analyses, and reliability analyses (Jamovi version 0.9.5.12) were conducted. Prior to factor analyses, items were checked and removed if skewness and kurtosis indicated significant non-normality (Field, 2009; Mayers, 2013; Trochim and Donnelly, 2006). In case no substantial alterations were made to the scale, and sufficiently detailed information was available from prior research, a confirmatory factor analysis (CFA) was carried out. If CFA could not be performed, factor analyses involved several steps. First, the data was randomly split in half, on which exploratory factor analysis (EFA), followed by an EFA in the CFA framework (E-CFA) (Brown, 2015) on one random half of the dataset. Subsequently, the model resulting from the exploratory analyses was cross-validated by means of CFA using the second half of the data. After that, a CFA on the final model was performed in the whole dataset, of which the results are presented in this paper. We applied relatively strict criteria with the aim to reach an optimal (i.e., most parsimonious) solution, as in the eventual self-assessment, we do not want to burden the respondents unnecessarily. The exact process of and cut-off values applied in factor analyses can be found in Supplementary Material S2. For reliability, McDonald’s omega was chosen over Cronbach’s alpha, as Cronbach’s alpha depends on the assumption that each item contributes equally to the factor. McDonald’s omega allows items to vary in factor loadings and thereby, fits better to our data. In addition, in using omega there is less risk of overestimation or underestimation of reliability as compared to alpha (Zinbarg et al., 2005; Graham, 2006; Revelle and Zinbarg, 2009).
Research question 2: To what extent is the (relative) predictive value of the selected variables verified by data from a higher online educational context? Analyses regarding this research question started with a check for normality and outliers through descriptive statistics (Trochim and Donnelly, 2006; Field, 2009; Mayers, 2013). Next, various analyses were conducted to gain insight into the relationship between the variables. Pearson correlation coefficients are reported for the relationship between continuous variables. Omega-squared (ω2) was chosen as the reported effect size for associations between categorical and continuous variables (Analysis of Variance (ANOVA)) because it gives the least biased view on the effect size in analyses in which the assumption(s) of homogeneity of variances and/or normality are not met, which was incidentally the case (Yigit and Mendes, 2018). To decide which categorical variables should be included in the self-assessment, associations between categorical variables (including the outcome measure) are examined using Cramer’s V (Cohen, 1988). To decide which continuous variables should be included in the self-assessment, Confidence Interval-Based Estimation of Relevance (CIBER) analyses were conducted in R (Version 3.6.1), based on work by Crutzen and Peters (2019). The CIBER analysis was chosen for several reasons. First, it is recommended to base decisions for selecting predictors on confidence intervals for bivariate associations, combined with the variables’ distributions and means. Confidence intervals should be used instead of point estimates (e.g., regression coefficients), as confidence intervals give insight in estimation accuracy as well. For instance, a broad confidence interval means that the point estimate is unreliable and can have a substantially different value in a new sample. In the context of selecting variables for the self-assessment, regression coefficients would provide little information on the relevance of specific predictors, because they are conditional upon the other predictors in the model. In regression analyses, it would be hard to distinguish between the contribution of associated predictors in predicting the outcome measure. Second, CIBER data visualization has two advantages for the selection of predictors in the context of our research:
• It facilitates the comparison of the effects of different variables.
• The relative width of the distribution and variation in estimates is presented, which facilitates a cautious and well-considered decision for variable selection.
Research question 3: To what extent can prospective students be accurately identified as completers or non-completers by the validated predictors? To gain insight into the proportion of explained variance in the outcome measure, the selected variables were included in a multivariate logistic regression together with background variables (i.e., age, sex, faculty, and prior level of education). Given that the SA is constructed to identify those prospective students who have a lower probability for completion, classification accuracy was evaluated in Jamovi (Version 0.9.5.12).
Results
Internal Structure and Reliability of Scale Variables
In Table 3, an overview is presented of the results discussed in this section. In Table 4, the factor score means, standard deviations, and the minimum and maximum factor scores are presented. For all measurements, the eventual set of items can be found in Supplementary Material S1.
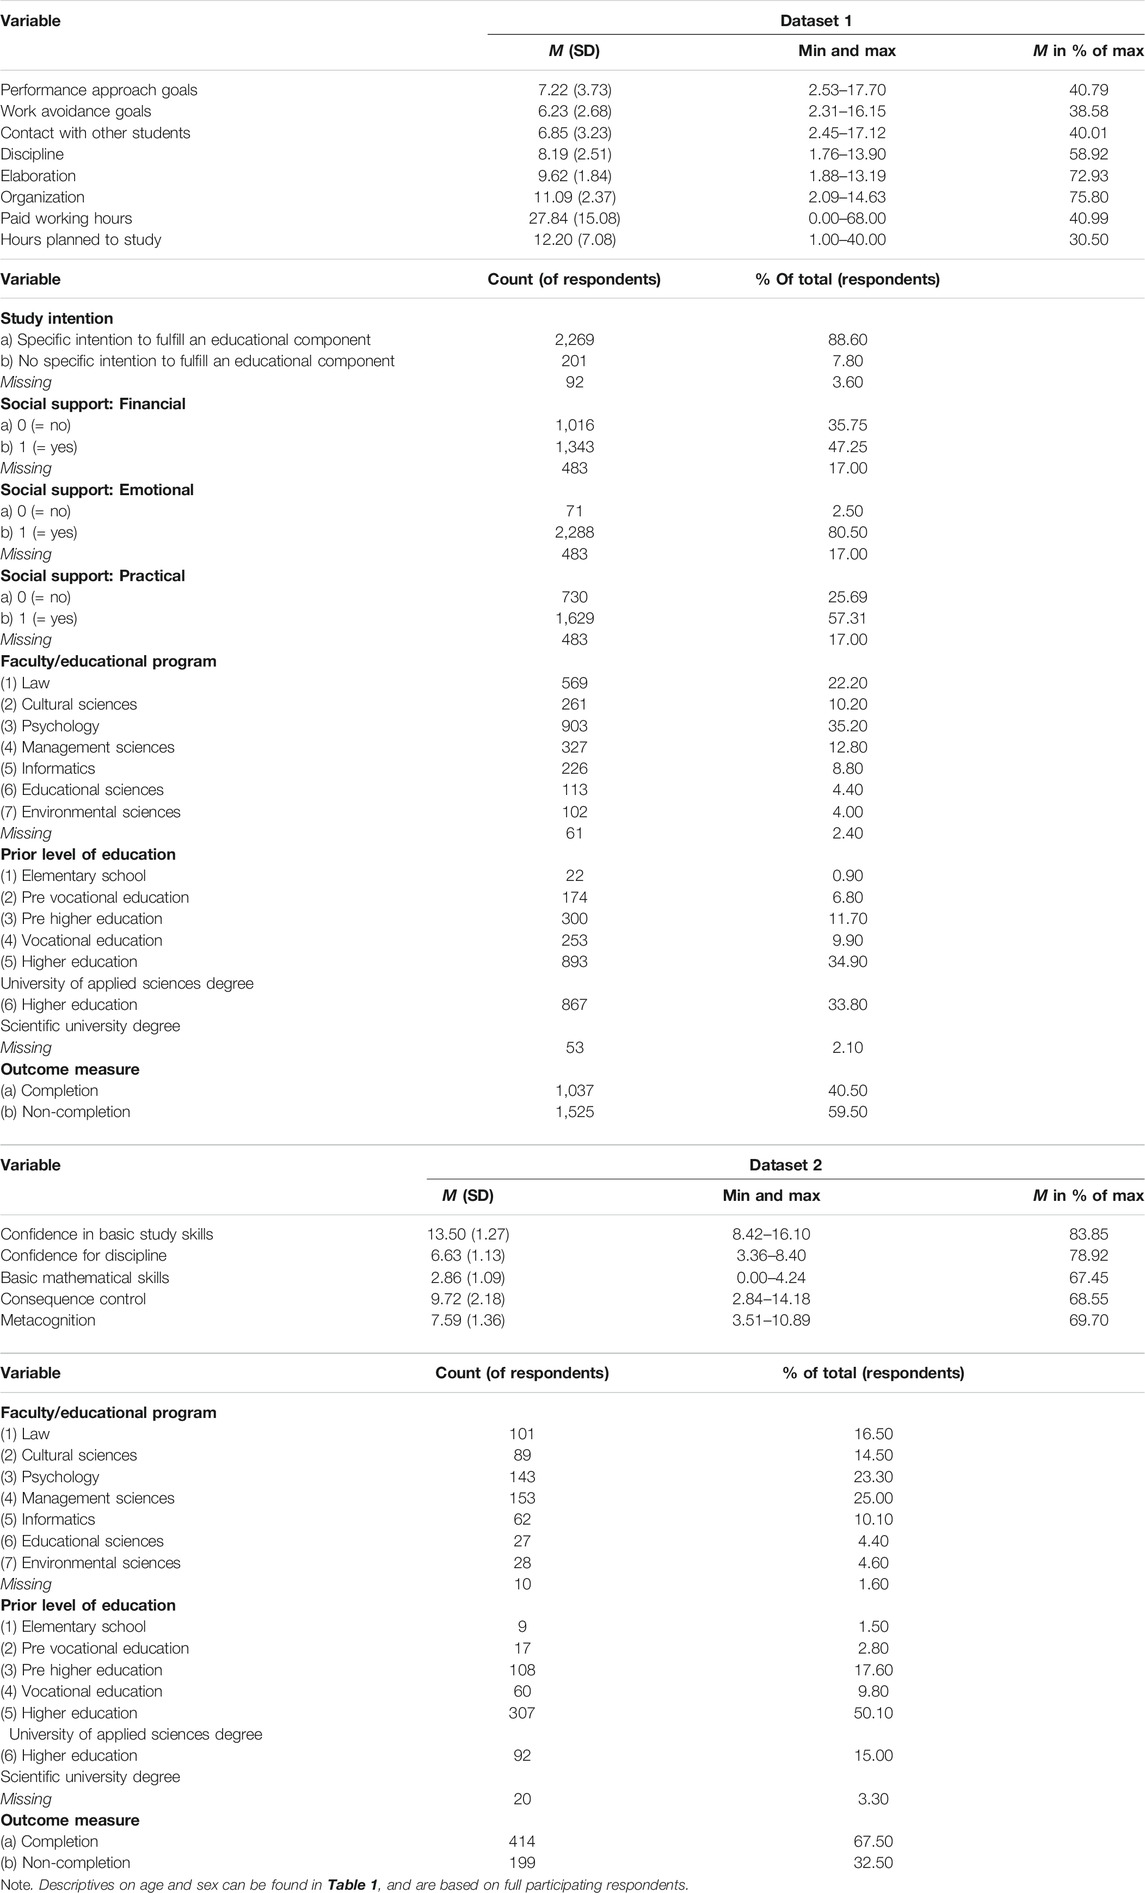
TABLE 4. Descriptive Statistics per Variable, per Dataset.
Academic self-efficacy. The EFA, E-CFA and CFA procedure resulted in two factors, labeled as confidence in basic study skills (6 items, McDonald’s omega = 0.649) and discipline confidence (2 items, McDonald’s omega = 0.830). The correlation between these two factors is 0.178 and significant at the 1% level. This CFA revealed a good fit with SRMR of 0.035, RMSEA of 0.053, TLI of 0.954 and CFI of 0.969 (χ2(19) = 49.2, p < 0.001).
Basic mathematical skills. Based on prior research (Fonteyne et al., 2015) a CFA was performed in which we examined the fit of a model with one factor including all items. Though the fit of this model was reasonably good (i.e., four out of five fit indices were within cut-off values), there were indications for modifications, and as we aimed for the most parsimonious test, we decided to perform the EFA, E-CFA and CFA procedure. One factor was found, consisting of nine items (McDonald’s omega = 0.772). The CFA on the complete data set revealed a good fit with SRMR of 0.026, RMSEA of 0.008, TLI of 0.998, and CFI of 0.998 (χ2(27) = 27.9, p = 0.419).
Goal orientation. Based on prior research, a CFA was performed (Harackiewicz et al., 2008). Here too, we found indications for modifications, despite a reasonably good fit of the model, so we performed the EFA, E-CFA and CFA procedure. Two factors were found, labeled as work avoidance goals (3 items, McDonald’s omega = 0.813) and performance-approach goals (3 items, McDonald’s omega = 0.880). The correlation between these two factors was not statistically significant. The CFA on the complete data set revealed a good fit with SRMR of 0.010, RMSEA of 0.019, TLI of 0.998, and CFI of 0.999 (χ2(8) = 13.8, p = 0.088).
Learning strategies. CFA based on prior research showed that the original structure did not fit our sample (i.e., two out of five fit indices within cut-off values). The EFA, E-CFA and CFA procedure resulted in four factors, labeled as contact with other students (3 items, McDonald’s omega = 0.856), discipline (3 items, McDonald’s omega = 0.704), elaboration (3 items, McDonald’s omega = 0.664), and organization (3 items, McDonald’s omega = 0.779). The model fit of the CFA on the complete data set was good with SRMR of 0.031, RMSEA of 0.041, TLI of 0.965, and CFI of 0.975 (χ2(48) = 216, p < 0.001). All correlations between these factors were significant at the 1% level.
Volition. CFA could not be performed, as the required information was not available. EFA, E-CFA, and CFA resulted in two factors, labeled as consequence control (4 items, McDonald’s omega = 0.802) and metacognition (4 items, McDonald’s omega = 0.630). The correlation between these two factors was not statistically significant. The model fit of the CFA on the complete dataset was good with SRMR of 0.039, RMSEA of 0.051, TLI of 0.956, and CFI of 0.970 (χ2(19) = 44.2, p < 0.001).
Predictive Analyses
Explorative Analysis
Variable means, standard deviations, minimum and maximum scores are presented in Table 4, for the two data collections separately. For categorical variables (including the outcome measure), also frequencies are reported.
Tables 5, Tables 6 provide an overview of relationships between variables, for both data collections separately. Pearson correlations were calculated for relations between continuous variables. None of the correlations (in both datasets) exceeds 0.6, and therefore none of the associations is interpreted as high (Evans, 1996). Associations between categorical and continuous variables were examined via Analyses of Variance, of which the effect sizes in ω2 are reported. Values over 0.14 are considered high (Field, 2009). Table 5 indicates several medium-size effects (a ω2 between 0.06 and 0.14, see Field, 2009). In dataset one this is the case for the associations between faculty and age (ω2 = 0.064), and between sex and organization (ω2 = 0.0.67). In dataset two the effect sizes on the association between faculty and age, prior level of education and age, prior level of education and basic mathematical skills, and sex and basic mathematical skills are medium-size (ω2 = 0.070, 0.062, 0.074, and 0.060, respectively). Associations between categorical variables (Cramer’s V) are presented in Table 6. The interpretation of this effect size, ranging from 0 (no association) to 1 (perfect association), is dependent on the degrees of freedom (Cohen, 1988), i.e., the number of possible values of the variable with the least categories. In the present study, no strong associations between categorical variables were found. Medium associations were found between faculty and sex in both datasets (Cramer’s V(1) = 0.378 and 0.376 for dataset one and two, respectively). In dataset 1 a medium association was found between faculty and prior level of education (Cramer’s V(5) = 0.179).
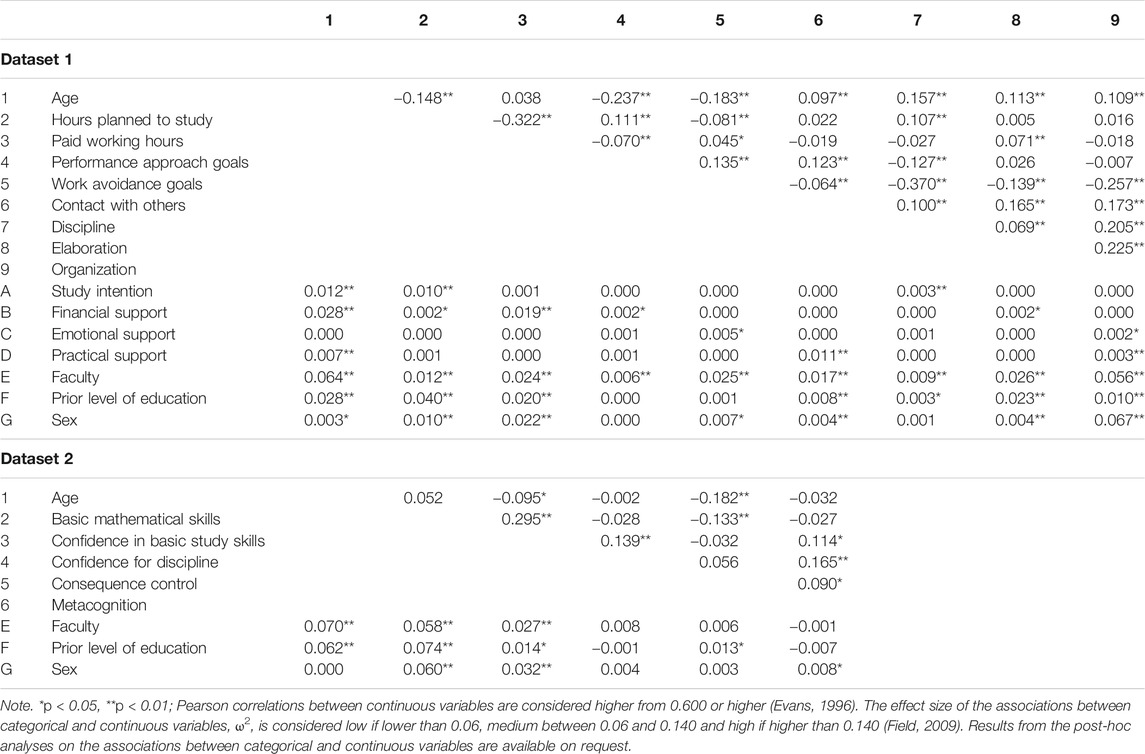
TABLE 5. Pearson Correlation Coefficients of Associations between Continuous Variables and ω2 of Associations between Categorical and Continuous Variables, per Dataset.
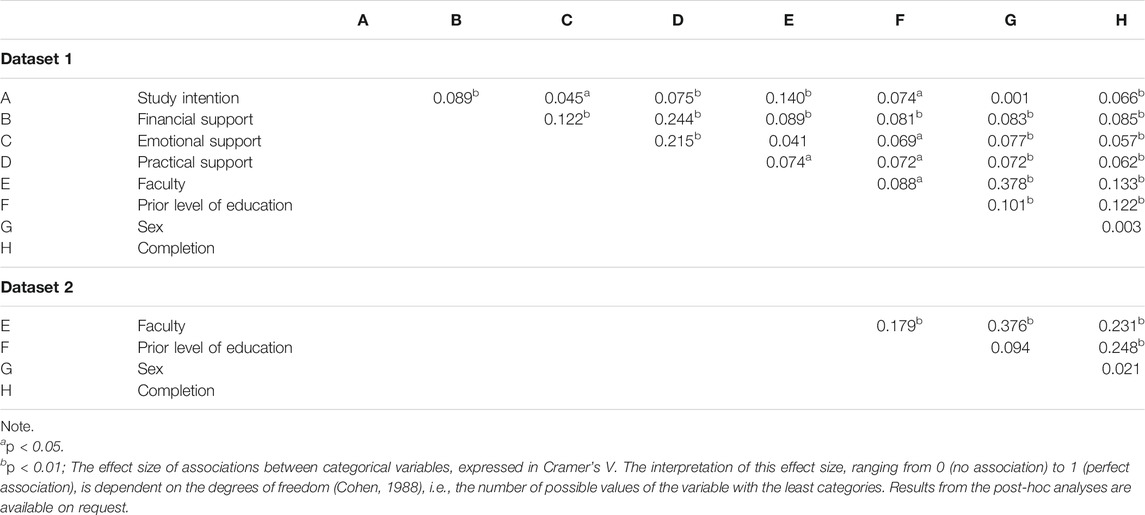
TABLE 6. Associations between categorical variables (including the outcome measure) in Cramer’s V.
Selecting Determinants of Completion
Dataset 1. The relationship between categorical variables and the outcome measure was examined by means of Chi-square analyses, of which the effect sizes (Cramer’s V) are presented in Table 6. Study intention, financial support, emotional support, practical support, faculty, and prior level of education show to be significantly associated with completion. However, the effect size of the association between study intention and completion is less than small (i.e., Cramer’s V(1) < 0.10). Also, the association of financial, emotional, and practical support with completion is very small (i.e., all Cramer’s V(1) < 0.10). The associations of both faculty and prior level of education with completion, are slightly stronger, but still small (i.e., Cramer’s V(1) = 0.133 for faculty and 0.122 for prior level of education). CIBER analyses results indicating the association strengths between continuous variables and the outcome measure are presented in a diamond plot (Figures 2, 3). The left-hand panel shows the item scores of all participants: in green for completers, and in purple for non-completers. The diamonds in the right-hand panel indicate the association strengths (i.e., with 95% confidence intervals). The color of the diamonds indicates the association direction (i.e., red indicates a negative association, green indicates a positive association, and gray indicates weak associations). The wider the diamond, the wider the confidence interval of the association between a certain variable and completion, meaning that in another sample, a different association between predictor and outcome could be found. Furthermore, some confidence intervals (diamonds) overlap the zero-line (e.g., performance-approach goals and completion), which means that an association of 0 could be a possible outcome as well, in a 95% confidence interval. For dataset 1, the diamond plot (Figure 2) shows that performance-approach goals, work avoidance goals, contact with other students, elaboration, and organization are not strongly associated with completion (i.e., indicated by the gray diamonds, overlapping the zero-line). Hours planned to study and discipline positively associated with completion. Age and employment hours are negatively associated with completion. Of these associations, the association between discipline and completion differs the most from 0.
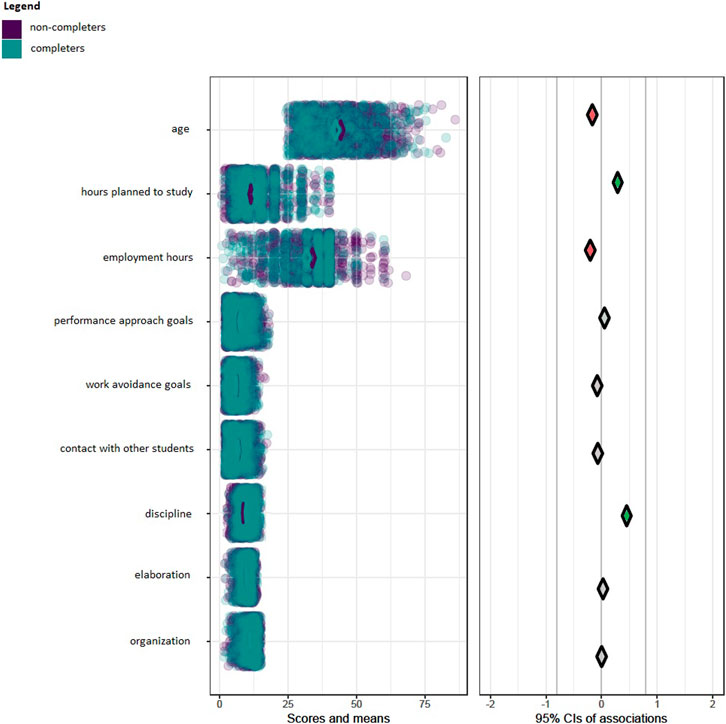
FIGURE 2. Diamond Plot of the Associations between Continuous Variables and Completion in Dataset 1.
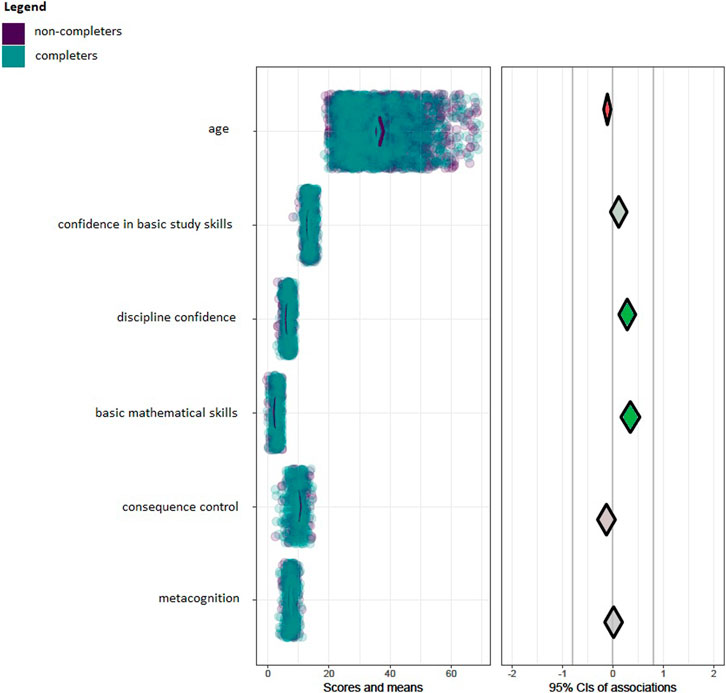
FIGURE 3. Diamond Plot of the Associations between Continuous Variables and Completion in Dataset 2.
Based on the Chi-square and CIBER analyses the following modifiable variables are selected for the proposed self-assessment: study intention, hours planned to study, employment hours, discipline, financial support, emotional support, and practical support.
To gain insight into the proportion of explained variance, these variables were combined with all background variables (i.e., age, sex, faculty, and prior level of education), in a logistic regression model. Together, they explain 16.3% of the variance (Nagelkerke R2) in the completion outcome in dataset 1. Excluding the background variables, 8.92% of the variance in completion can be explained by the selected modifiable predictors of completion.
Dataset 2. Faculty and prior level of education show to be significantly associated with completion indicating small to medium effect sizes (Cramer’s V(1) = 0.231 for faculty and 0.248 for prior level of education). The diamond plot in Figure 3 shows that confidence in basic study skills, consequence control, and metacognition are not strongly associated with completion, indicated by the gray diamonds, overlapping with the zero-line in the right-hand panel. Discipline confidence and basic mathematical skills are positively associated with completion, in which the association between basic mathematical skills and completion differs the most from 0. Age is negatively associated with completion, as was the case in dataset 1. Note though, that the confidence interval is not far from including 0.
Based on Chi-square and CIBER analyses discipline confidence and basic mathematical skills have been selected as (modifiable) predictors. These variables were added, together with all background variables, in a logistic regression model. Together, they explain 21.7% of the variance in the completion outcome in dataset 2. Excluding the background variables, 7.62% of the variance in completion can be explained by the selected modifiable predictors of completion.
Resulting Local Model of Predictors of Completion
Figure 1 (Theoretical Framework) described the development and validation process of the current self-assessment. As explained, this study focused on collecting validity evidence regarding the internal structure of the selected variables in the current context (research question 1), as well as their relations to completion (research question 2), to establish a local model of predictors. Figure 4 zooms in on the analysis stage of Figure 1 to clarify the ‘filled out’ local model of predictors, resulting from the analyses described so far.
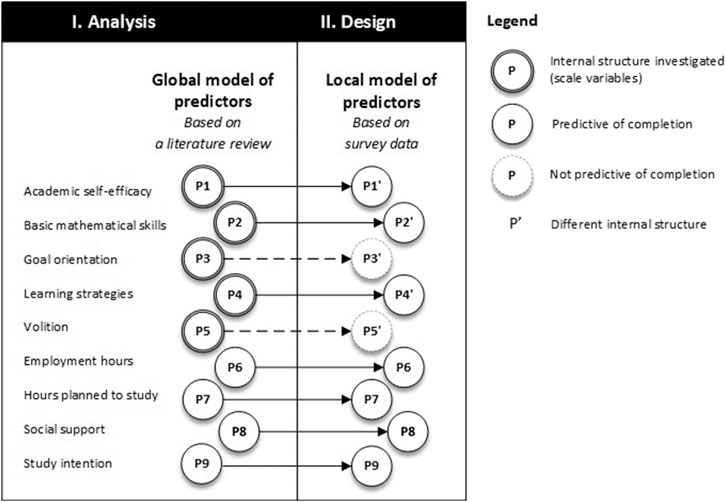
FIGURE 4. Local Model of Predictors of Completion.
Predictors requiring an investigation of internal structure evidence are indicated with a double contour in the general model in Figure 4. As it happens, the internal structure of all these predictors appeared to differ in the present study, as with an accent mark for these predictors in the local model of predictors. Of the nine variables, originally identified as predictors in the general model (Delnoij et al., 2020), seven are verified (at least partly) as predictors in the current context, and hence, included in the local model of predictors: academic self-efficacy, basic mathematical skills, employment hours, hours planned to study, learning strategies, social support, and study intention. Two variables, goal orientation and volition, are not verified as predictors of completion in the local context (indicated by the dotted arrows toward and the dotted contour of these predictors in the local model).
Identification and Classification
The self-assessment aims at identifying prospective students with lower chances for completion to provide them feedback on where there is room for improvement and how their chances for completion can be enhanced. In light of the open access policy in the current context, it is paramount that the risk discouraging prospective students who, in fact, would have been successful should be kept at a minimum. In other words, we strive to reduce the likelihood of false-negative predictions, at the expense of an increased likelihood of false-positive predictions. For this reason, high sensitivity cut-offs were required. We explored results for two different sensitivity cut-offs: 95 and 99%, which corresponds to a maximum of respectively, 5 and 1% of the prospective students possibly unjustly classified as non-completers. For the sake of comparability with previous studies, background variables were excluded in these analyses. Using the 95% sensitivity cut-off, 13.78 and 12.87% of the actual non-completers were correctly identified as such in dataset one and dataset two respectively. Using 99% sensitivity, 3.82 and 2.27% of the actual non-completers were correctly identified in dataset one and dataset two, respectively.
Discussion
The main objective of this study was to select variables to be included in the self-assessment, as a means to enhance informed decision making prior to enrollment. All in all, this study has led to the inclusion of the following modifiable variables in the self-assessment: hours planned to study, employment hours, study intention, discipline, discipline confidence, basic mathematical skills, financial support, emotional support, and practical support. In line with findings of the literature (Muljana and Luo, 2019; Delnoij et al., 2020) these variables cover characteristics of both the student him/herself (e.g., discipline), and the students’ environment (e.g., social support). The present study’s findings on employment are in line with previous studies of dropout in online courses (Lee and Choi, 2011) and higher education in general (Riggert et al., 2006). Additionally, discipline seems to be an important topic in the predictors of completion in higher online education. In the present study, discipline appeared a predictor of completion. This association in the context of higher online education has previously been stressed in survey research (Waschull, 2005) as well as qualitative research (Gaytan, 2013). The present study’s results for academic self-efficacy were (partly) in line with findings of review studies in the context of higher (online) education (Lee and Choi, 2011; Bowles and Brindle, 2017). However, it is not clear how academic self-efficacy was operationalized in these review studies. Our results showed that, as a factor of self-efficacy, discipline confidence is associated with completion. Furthermore, the association between mathematical skills and completion is in line with findings using the same measurement (albeit in face-to-face education; cf. Fonteyne et al., 2017), as well as studies in the context of online education, using standardized tests (Morris et al., 2005). Finally, our findings on social support are in line with findings in comparable contexts (Asbee and Simpson, 1998; Park and Choi, 2009; Lee and Choi, 2011). However, some results are not in line with previous research or theories on predictors of completion. For instance, goal orientation (i.e., performance-approach and work avoidance goals) did not appear to be related to completion in the present study. A possible explanation lies in the context of the present study, which is characterized by a merely adult student population, combining a study with a job and/or family responsibilities. In this context, specific intentions, rather than the orientation of one’s goals (e.g., oriented to outperform others), might be more important for completion. Though the effect was small, this was also suggested by our results, as we did find an association between study intentions and completion. In that regard, research carried out in the context of MOOCs (i.e., another example of open higher online education), demonstrated that intention is an important requisite for completion (Henderikx et al., 2017). Besides that, although performance approach goals (i.e., whether or not students’ are oriented at outperforming others) might not relate to completion, they appear predictive for other correlates of students’ success, such as grade point average (Neroni et al., 2018). Furthermore, in the present study, no association was found between volition (i.e., consequence control and metacognition) and completion. Theories in the field of distance education suggested that volition might be an important predictor of performance and achievement in this context (Corno and Kanfer, 1993; Keller, 2008). However, to our knowledge, there is no empirical evidence for the relationship between volition and completion, although some evidence exists for a relation between volition and academic procrastination in this context (Ucar and Bozkurt, 2019). Overall, we must note that rather strict cut-off values were applied in factor analysis, as we aimed for the most parsimonious tests, which was explained in the method section. This explains differences in the dimensionality of the measures used in the present study and, in turn, might explain differences in our results, compared to previous research.
The variables selected for the self-assessment, together with background variables explain 16.3% (dataset 1) and 21.7% (dataset 2) of the variance in completion. Whether or not these proportions of explained variance are meaningful, is open to debate. According to Allen et al. (2009), this depends on the practical utility of the test scores. In that sense, we consider these proportions of explained variance meaningful, taking into account the results on prediction accuracy of actual non-completers by selected modifiable predictors of the self-assessment irrespective of background variables: 13.78 and 12.87% (dataset 1 and 2, respectively) with a sensitivity of 95%. These are promising results, especially in comparison with similar research in traditional higher education, in which 3.7% of the failing students were identified correctly (Fonteyne et al., 2017). Note that in both cases the results have been achieved in a total sample prediction. Fonteyne et al. (2017) also investigated the classification results in program-specific contexts. Interestingly, 13.4% of the actual failing students were identified correctly using a program-specific prediction. In relation to the open access policy in the current context, in which we want to avoid unduly discouraging prospective students, we might consider being even stricter in setting a sensitivity cut-off. Therefore, we examined the prediction accuracy of actual non-completers also at a sensitivity of 99%, resulting in 3.82 and 2.27% of non-completers that were classified as such in dataset 1 and 2, respectively. These results illustrate a trade-off in which a higher sensitivity results in less false negatives (i.e., maximally 5% at a sensitivity of 95 vs. 1% at a sensitivity of 99%) but at the expense of correct classification of actual non-completers. Note though that the percentage of actual non-completers - that can be classified correctly with a stricter sensitivity (99%) in the present study-is in line with the results obtained at a more liberal sensitivity of 95% in the context of traditional higher education (Fonteyne et al., 2017). In addition, in evaluating the effectiveness of interventions in education, it is not only important to take into account practical utility, but also factors like, for instance, cost-effectiveness and scalability (Kraft, 2020). Considering the latter, the self-assessment seems a promising intervention.
Limitations and Directions for Future Research
Several limitations are noteworthy in regard to the present study, as they point out directions for future research in this field of study. In regard to the practical application of newly constructed scales, the step from “predictor” to “test” (Figure 1) requires an extra step in terms of collecting evidence on (single) test content.
In light of the selected variables for the self-assessment, elaboration of interaction effects was not the focus of the present study. As these relationships might have implications for practice (e.g., gender differences in the relevance of certain variables for completion), a recommendation for future research is to examine these possible interactions, including specific study programs. As shown by Fonteyne et al. (2017), insight in program-specific relationships between factors and completion might result in better prediction accuracy and might have practical implications for feedback to be provided. Furthermore, a considerable part of the variance in completion remains unexplained. In that respect, there might be other modifiable factors associated with completion, which can possibly be included in the SA to establish a better prediction of completion, and thereby enhance the validity of the SA. For instance, in a review study by Muljana and Luo (2019), it has been shown that technological skills might be a relevant factor, especially in higher online education. Finally, in the next steps of the (design-based) development process of the SA, it is recommendable to include additional measures of actual behavior (e.g., sample tests) next to self-reported behavior, to enhance the predictive validity and fairness of the self-assessment (Kuncel et al., 2001; Niessen et al., 2016, 2018; Sackett et al., 2016). Actual (study) behavior in these sample tests is mimicked by a simulation of representative parts of academic programs in a certain context (Niessen et al., 2016). For instance, such a sample might involve studying literature and/or watching video-lectures, followed by a short exam.
Implications for Practice and Research
Currently, there is a high need and demand for online education, because of the covid-19 pandemic. Accessibility to educational programs will widen further when universities decide to continue offering (partly) online education after the pandemic (Gomez Recio and Colella, 2020). In that regard, (prospective) students need support in making a well-informed study or program choice. To that end, self-assessments prior to student enrollment seem a promising approach (Kubinger et al., 2012; Lee et al., 2013; Fonteyne and Duyck, 2015; Muljana and Luo, 2019; Nolden et al., 2019). Such approaches aim at achieving optimal alignment of students’ skills, motivation and cognitive beliefs on the one hand and required skills and attitudes of a particular educational program on the other hand by raising awareness and providing early remediation (Menon, 2004; Hachey et al., 2013; Fonteyne and Duyck, 2015; Nolden et al., 2019). The present study revealed seven predictors of completion in the context of higher online education that are to be included as subtests in such a self-assessment. By these predictors, about 13% of actual non-completers could be correctly identified (with a sensitivity of 95%). It goes without saying that access to higher education constitutes a sensitive ethical issue, especially in the context of (open) online education. Therefore, development and implementation of self-assessments in this context requires thorough and careful validation, not only of the assessment as an instrument but also of the way it is used and whether it affects the decision-making process as intended (Niessen and Meijer, 2017). In the present study, the content, internal structure and predictive aspects of validity were investigated. Though validation is not a “once and for all” call and these aspects remain under evaluation (i.e., as the population and educational practice change over time), next steps should focus on the other aspects of validity as well. Prospective students’ response processes need to be examined to determine whether the self-assessment is used as intended (Beckman et al., 2005; Downing and Haladyna, 2004). Furthermore, to determine the self-assessment’s impact, the consequential aspect of validity needs to be evaluated (Beckman et al., 2005; Cook et al., 2014). This involves investigation of, for instance, the impact on prospective students’ study choice certainty, enrollment behavior and study progress after enrollment.
Data Availability Statement
The raw data supporting the conclusions of this article will be made available by the authors, without undue reservation.
Ethics Statement
The studies involving human participants were reviewed and approved by the Research ethics committee (cETO) Open Universiteit. The patients/participants provided their written informed consent to participate in this study.
Author Contributions
LD: conceptualization, methodology, formal analysis, investigation, resources, data curation, writing (original, review and editing), visualization. JJ: conceptualization, methodology, investigation, resources, data curation, writing (review and editing), visualization, supervision. KD: conceptualization, methodology, formal analysis, writing (review and editing), supervision, project administration. HG: methodology, investigation, resources, data curation, writing (review and editing), supervision. RG: resources, writing (review and editing), supervision. JN: methodology, investigation, resources, data curation, writing (review and editing). MB: investigation, resources, data curation, writing (review and editing). RM: conceptualization, writing (review and editing), supervision, project administration.
Conflict of Interest
The authors declare that the research was conducted in the absence of any commercial or financial relationships that could be construed as a potential conflict of interest.
Acknowledgments
We thank Astrid Kokkelkorn from the Open University of the Netherlands for extracting outcome measure data from the student administration database. We thank Gjalt-Jorn Peters from the Open University of the Netherlands for his mentoring in and contribution to the CIBER analyses.
Supplementary Material
The Supplementary Material for this article can be found online at: https://www.frontiersin.org/articles/10.3389/feduc.2021.668922/full#supplementary-material
References
Alexander, P. A., Graham, S., and Harris, K. R. (1998). A Perspective on Strategy Research: Progress & Prospects. Educ. Psychol. Rev. 10, 129–154. doi:10.1023/A:1022185502996
Allen, J., Robbins, S. B., and Sawyer, R. (2009). Can Measuring Psychosocial Factors Promote College success?. Appl. Meas. Educ. 23 (1), 1–22. doi:10.1080/08957340903423503
Asbee, D. S., and Simpson, O. (1998). Partners, Families and Friends: Student Support of the Closest Kind. Open Learn. J. Open, Distance e-Learning 13 (3), 56–59. doi:10.1080/0268051980130309
Beckman, T. J., Cook, D. A., and Mandrekar, J. N. (2005). What is the Validity Evidence for Assessments of Clinical Teaching?. J. Gen. Intern. Med. 20 (12), 1159–1164. doi:10.1111/j.1525-1497.2005.0258.x
Bowles, T. V., and Brindle, K. A. (2017). Identifying Facilitating Factors and Barriers to Improving Student Retention Rates in Tertiary Teaching Courses: A Systematic Review. Higher Educ. Res. Develop. 36 (5), 903–919. doi:10.1080/07294360.2016.1264927
Brown, T. A. (2015). Confirmatory Factor Analysis for Applied Research. 2nd ed. New York, NY, US: Guilford Publications.
Byrne, B. M. (2010). Multivariate Application Series. in Structural Equation Modeling with AMOS: Basic Concepts, Applications, and Programming. 2nd ed. New York, NY, US: Routledge/Taylor & Francis Group.
Chin, W. W., Peterson, R. A., and Brown, S. P. (2008). Structural Equation Modeling in Marketing: Some Practical Reminders. J. Marketing Theor. Pract. 16 (4), 287–298. doi:10.2753/MTP1069-6679160402
Cizek, G. J., Bowen, D., and Church, K. (2010). Sources of Validity Evidence for Educational and Psychological Tests: A Follow-Up Study. Educ. Psychol. Meas. 70 (5), 732–743. doi:10.1177/0013164410379323
Cohen, J. (1988). Statistical Power Analysis for the Behavioural Sciences. 2nd ed. Hilssdale, New Jersey: Lawrence Erlbaum Associates.
Comrey, L. A., and Lee, H. B. (1992). A First Course in Factor Analyses. 2nd ed. Hillside, HJ: Lawrence Erlbaum Associates.
Cook, D. A., Zendejas, B., Hamstra, S. J., Hatala, R., and Brydges, R. (2014). What Counts as Validity Evidence? Examples and Prevalence in a Systematic Review of Simulation-Based Assessment. Adv. Health Sci. Educ. 19 (2), 233–250. doi:10.1007/s10459-013-9458-4
Corno, L. (1994). “Student Volition and Education: Outcomes, Influences and Practices,” in Self-regulation of Learning and Performance. Issues and Educational Applications. Editors D. H. Schunk, and B. J. Zimmermann (Hilsdale, NJ: Erlbaum), 229–254.
Corno, L., and Kanfer, R. (1993). “The Role of Volition in Learning and Performance,” in Review of Research in Education. Editor L. Darling-Hammond (Itasca, IL: F.E. Peacock Publishes), 19, 301–341. doi:10.2307/1167345
Costello, A. B., and Osborne, J. (2005). Best Practices in Exploratory Factor Analysis: Four Recommendations for Getting the Most from Your Analysis. Pract. Assess. Res. Eval. 10 (7), 1–9. doi:10.7275/jyj1-4868 Retrieved from: https://pareonline.net/getvn.asp?v=10%26n=7.
Creswell, J. W. (2014). Educational Research: Planning, Conducting, and Evaluating Quantitative and Qualitative Research. 4th ed. Edinburgh Gate: Pearson Education Limited.
Crutzen, R., and Peters, G.-J. Y. (2019). The Book of Behavior Change. 1st Edn. Retrieved from: https://a-bc.gitlab.io/bbc/.
Deimann, M., and Bastiaens, T. (2010). The Role of Volition in Distance Education: An Exploration of its Capacities. Irrodl 11 (1), 1–16. doi:10.19173/irrodl.v11i1.778
Delnoij, L. E. C., Dirkx, K. J. H., Janssen, J. P. W., and Martens, R. L. (2020). Predicting and Resolving Non-completion in Higher (Online) Education - A Literature Review. Educ. Res. Rev. 29, 100313. doi:10.1016/j.edurev.2020.100313
Dochy, F., Segers, M., and Sluijsmans, D. (1999). The Use of Self-, Peer and Co-assessment in Higher Education: A Review. Stud. Higher Educ. 24 (3), 331–350. doi:10.1080/03075079912331379935
Downing, S. M., and Haladyna, T. M. (2004). Validity Threats: Overcoming Interference with Proposed Interpretations of Assessment Data. Med. Educ. 38 (3), 327–333. doi:10.1046/j.1365-2923.2004.01777.x
Dunning, D., Heath, C., and Suls, J. M. (2004). Flawed Self-Assessment. Psychol. Sci. Public Interest 5 (3), 69–106. doi:10.1111/j.1529-1006.2004.00018.x
Elliot, A. J., and McGregor, H. A. (2001). A 2 × 2 Achievement Goal Framework. J. Personal. Soc. Psychol. 80, 501–519. doi:10.1037/0022-3514.80.3.501
Evans, J. D. (1996). Straightforward Statistics for the Behavioral Sciences. Pacific Grove, CA: Brooks/Cole Publishing.
Field, A. P. (2009). Discovering Statistics Using IBM SPSS Statistics: And Sex and Drugs and Rock ‘n’ Roll. 4th ed. London, UK: Sage.
Fonteyne, L., de Fruyt, F., Dewulf, N., Duyck, W., Erauw, K., Goeminne, K., et al. (2015). Basic Mathematics Test Predicts Statistics Achievement and Overall First Year Academic success. Eur. J. Psychol. Educ. 30 (1), 95–118. doi:10.1007/s10212-014-0230-9
Fonteyne, L., Duyck, W., and de Fruyt, F. (2017). Program-specific Prediction of Academic Achievement on the Basis of Cognitive and Non-cognitive Factors. Learn. Individual Differences 56, 34–48. doi:10.1016/j.lindif.2017.05.003
Fonteyne, L., and Duyck, W. (2015). Vraag Het Aan SIMON! [Ask SIMON!]. Thema Hoger Onderwijs (2), 56–60.
Gaytan, J. (2013). Factors Affecting Student Retention in Online Courses: Overcoming This Critical Problem. Career Tech. Educ. Res. 38 (2), 145–155. doi:10.5328/cter38.2.147
Gomez Recio, S., and Colella, C. (June, 2020). The World of Higher Education after Covid-19. Brussels: YERUN. [online publication]. Retrieved from: https://www.yerun.eu/wp-content/uploads/2020/07/YERUN-Covid-VFinal-OnlineSpread.pdf
Graham, J. M. (2006). Congeneric and (Essentially) Tau-Equivalent Estimates of Score Reliability. Educ. Psychol. Meas. 66 (6), 930–944. doi:10.1177/0013164406288165
Hachey, A. C., Wladis, C. W., and Conway, K. M. (2013). Balancing Retention and Access in Online Courses: Restricting Enrollment … Is it Worth the Cost? Is it worth the Cost? J. Coll. Student Retention: Res. Theor. Pract. 15 (1), 9–36. doi:10.2190/CS.15.1.b
Harackiewicz, J. M., Durik, A. M., Barron, K. E., Linnenbrink-Garcia, L., and Tauer, J. M. (2008). The Role of Achievement Goals in the Development of Interest: Reciprocal Relations between Achievement Goals, Interest, and Performance. J. Educ. Psychol. 100, 105–122. doi:10.1037/0022-0663.100.1.105
Hayton, J. C., Allen, D. G., and Scarpello, V. (2004). Factor Retention Decisions in Exploratory Factor Analysis: A Tutorial on Parallel Analysis. Organizational Res. Methods 7 (2), 191–205. doi:10.1177/1094428104263675
Henderikx, M. A., Kreijns, K., and Kalz, M. (2017). Refining success and Dropout in Massive Open Online Courses Based on the Intention-Behavior gap. Distance Educ. 38 (3), 353–368. doi:10.1080/01587919.2017.1369006
Hooper, D., Coughlan, J., and Mullen, M. (2008). Structural Equation Modelling: Guidelines for Determining Model Fit. Electron. J. Business Res. Methods 6, 53–60.
Keller, J. M. (2008). An Integrative Theory of Motivation, Volition, and Performance. Technol. Instruction, Cogn. Learn. 6 (2), 79–104. doi:10.1007/978-1-4419-1428-6_218
Kraft, M. A. (2020). Interpreting Effect Sizes of Education Interventions. Educ. Res. 49 (4), 241–253. doi:10.3102/0013189X2098544810.3102/0013189x20912798
Kubinger, K. D., Frebort, M., and Müller, C. (2012). “Self-assessment im rahmen der studientberatung: Möglichkeiten und Grenzen,” in Self-Assessment: Theorie und Konzepte. Editors K. D. Kubinger, M. Frebort, L. Khorramdel, and L. Weitensfelder ([German] Lengerich: Pabst Science Publishers), 9–24.
Kuncel, N. R., Hezlett, S. A., and Ones, D. S. (2001). A Comprehensive Meta-Analysis of the Predictive Validity of the Graduate Record Examinations: Implications for Graduate Student Selection and Performance. Psychol. Bull. 127 (1), 162–181. doi:10.1037/0033-2909.127.1.162
Ledesma, R. D., and Valero-Mora, P. (2007). Determining the Number of Factors to Retain in EFA: An Easy-To-Use Computer Program for Carrying Out Parallel Analysis. Pract. Assess. Res. Eval. 12 (2), 1–11. Retrieved from: http://audibmw.info/pdf/retain/4.pdf.
Lee, Y., and Choi, J. (2011). A Review of Online Course Dropout Research: Implications for Practice and Future Research. Education Tech Res. Dev 59 (5), 593–618. doi:10.1007/s11423-010-9177-y
Lee, Y., Choi, J., and Kim, T. (2013). Discriminating Factors between Completers of and Dropouts from Online Learning Courses. Br. J. Educ. Technol. 44 (2), 328–337. doi:10.1111/j.1467-8535.2012.01306.x
McCann, E. J., and Turner, J. E. (2004). Increasing Student Learning through Volitional Control. Teach. Coll. Rec 106 (9), 1695–1714. doi:10.1111/j.1467-9620.2004.00401.x
McGrath, C., Henham, M., Corbett, A., Durazzi, N., Frearson, M., Janta, B., et al. (2014). Higher Education Entrance Qualifications and Exams in Europe: A Comparison. Santa Monica: RAND Corporation. Retrieved from: http://www.rand.org/pubs/research_reports/RR574.
McKeachie, W. J., Pintrich, P. R., Lin, Y. G., Smith, D. A. F., and Sharma, R. (1990). Teaching and Learning in the College Classroom. A Review of the Research Literature. Ann Arbor: University of Michigan, National Center for Research to Improve Postsecondary Teaching and Learning.
Menon, M. E. (2004). Information Search as an Indication of Rationality in Student Choice of Higher Education. Educ. Econ. 12 (3), 267–283. doi:10.1080/0964529042000258617
Messick, S. (1989). Meaning and Values in Test Validation: The Science and Ethics of Assessment. Educ. Res. 18 (2), 5–11. Retrieved from: https://onlinelibrary.wiley.com/doi/pdf/10.1002/j.2330-8516.1988.tb00303.x. doi:10.3102/0013189x018002005
Morris, L. V., Wu, S.-S., and Finnegan, C. L. (2005). Predicting Retention in Online General Education Courses. Am. J. Distance Educ. 19 (1), 23–36. doi:10.1207/s15389286ajde1901_3
Muljana, P. S., and Luo, T. (2019). Factors Contributing to Student Retention in Online Learning and Recommended Strategies for Improvement: A Systematic Literature Review. J. Inf. Technol. Educ. Res. 18. doi:10.28945/4182
Neroni, J., Gijselaers, H. J. M., Kirschner, P. A., and de Groot, R. H. M. (2015). The Adult Learning Open University Determinants (ALOUD) Study: Biological and Psychological Factors Associated with Learning Performance in Adult Distance Education. Br. J. Educ. Technol. 46 (5), 953–960. doi:10.1111/bjet.12288
Neroni, J., Meijs, C., Leontjevas, R., Kirschner, P. A., and de Groot, R. H. M. (2018). Goal Orientation and Academic Performance in Adult Distance Education. Irrodl 19 (2). doi:10.19173/irrodl.v19i2.3440
Niessen, A. S. M., Meijer, R. R., and Tendeiro, J. N. (2018). Admission Testing for Higher Education: A Multi-Cohort Study on the Validity of High-Fidelity Curriculum-Sampling Tests. PloS one 13 (6), e0198746. doi:10.1371/journal.pone.0198746
Niessen, A. S. M., Meijer, R. R., and Tendeiro, J. N. (2017). Measuring Non-cognitive Predictors in High-Stakes Contexts: The Effect of Self-Presentation on Self-Report Instruments Used in Admission to Higher Education. Personal. Individual Differences 106, 183–189. doi:10.1016/j.paid.2016.11.014
Niessen, A. S. M., Meijer, R. R., and Tendeiro, J. N. (2016). Predicting Performance in Higher Education Using Proximal Predictors. PloS one 11 (4), e0153663. doi:10.1371/journal.pone.0153663
Niessen, A. S. M., and Meijer, R. R. (2017). Voorspellen in het kader van de studiekeuzecheck: Tijd voor verbetering. [Dutch] Onderzoek van Onderwijs 46, 5–7.
Nolden, P., Wosnitza, M., Karabenick, S. A., Peixoto, F., Gonida, E., Stepanović Ilić, I., et al. (2019). Enhancing Student Self- Reflection on the Situation at University, in The SRT Scale Inventory. Retrieved from: https://www.researchgate.net/publication/338343147_Enhancing_student_self- reflection_The_SRT_scale_inventory.
Oppedisano, V. (2009). Open University Admission Policies and Drop Out Rates in Europe. Retrieved from: https://ideas.repec.org/p/ucd/wpaper/200944.html.
Park, J. H., and Choi, H. J. (2009). Factors Influencing Adult Learners' Decision to Drop Out or Persist in Online Learning. J. Educ. Technol. Soc. 12 (4), 207–217.
Patterson, D. A., Waya, S. W., Ahuna, K. H., Tinnesz, C. G., and Vanzile-Tamsen, C. (2014). Using Self-Regulated Learning Methods to Increase Native American College Retention. J. Coll. Student Retention: Res. Theor. Pract. 16 (2), 219–237. doi:10.2190/cs.16.2.d
Pintrich, P. R., Smith, D. A. F., Garcia, T., and McKeachie, W. J. (1993). Reliability and Predictive Validity of the Motivated Strategies for Learning Questionnaire (MSLQ). Educ. Psychol. Meas. 53, 801–813. doi:10.1177/0013164493053003024
Revelle, W., and Zinbarg, R. E. (2009). Coefficients Alpha, Beta, omega, and the Glb: Comments on Sijtsma. Psychometrika 74 (1), 145–154. doi:10.1007/s11336-008-9102-z
Riggert, S. C., Boyle, M., Petrosko, J. M., Ash, D., and Rude-Parkins, C. (2006). Student Employment and Higher Education: Empiricism and Contradiction. Rev. Educ. Res. 76 (1), 63–92. doi:10.3102/00346543076001063
Robbins, S. B., Lauver, K., Le, H., Davis, D., Langley, R., and Carlstrom, A. (2004). Do Psychosocial and Study Skill Factors Predict College Outcomes? A Meta-Analysis. Psychol. Bull. 130 (2), 261–288. doi:10.1037/0033-2909.130.2.261
Rovai, A. P. (2003). In Search of Higher Persistence Rates in Distance Education Online Programs. Internet Higher Educ. 6 (1), 1–16. doi:10.1016/S1096-7516(02)00158-6
Royal, K. (2017). Four Tenets of Modern Validity Theory for Medical Education Assessment and Evaluation. Amep Vol. 8, 567–570. doi:10.2147/AMEP.S139492
Sackett, P. R., Walmsley, P. T., Koch, A. J., Beatty, A. S., and Kuncel, N. R. (2016). Predictor Content Matters for Knowledge Testing: Evidence Supporting Content Validation. Hum. Perform. 29 (1), 54–71. doi:10.1080/08959285.2015.1120307
Seaman, J. E., Allen, I. E., and Seaman, J. (2018). Grade Increase: Tracking Distance Education in the United States. Retrieved from: https://files.eric.ed.gov/fulltext/ED580852.pdf.
Simpson, O. (2010). 22%-can We Do Better? in The CWP Retention Literature Review, 47. Retrieved from: https://www.researchgate.net/profile/Ormond-Simpson/publication/342338625_'22_-can_we_do_better'-The_CWP_Retention_Literature_Review_'/links/5eee5005458515814a6f6652/22-can-we-do-better-The-CWP-Retention-Literature-Review.pdf.
Simpson, O. (2013). Student Retention in Distance Education: Are We Failing Our Students? Open Learn. J. Open, Distance e-Learning 28 (2), 105–119. doi:10.1080/02680513.2013.847363
St-Onge, C., Young, M., Eva, K. W., and Hodges, B. (2017). Validity: One Word with a Plurality of Meanings. Adv. Health Sci. Educ. 22, 853–867. doi:10.1007/s10459-016-9716-3
Trochim, W., and Donnelly, J. (2006). The Research Methods Knowledge Base. 3rd ed. Mason, OH: Atomic Dog Publishing.
Ucar, H., and Bozkurt, A. (2019). “Using Motivation, Volition, and Performance Model to Overcome Online Procrastination,” in Current Academic Studies in Social Sciences. Editors T. Erdogan, and S. Özer (Cetinje-Montenegro: IVPE), 105–112. ISBM: 978- 9940-540-64-7.
Van den Akker, J., Bannan, B., Kelly, A. E., Nieveen, N., and Plomp, T. (2013). Educational Design Research: An Introduction. Educational Design Research. Enschede. SLO.
Viswesvaran, C., and Ones, D. S. (1999). Meta-analyses of Fakability Estimates: Implications for Personality Measurement. Educ. Psychol. Meas. 59, 197–210. doi:10.1177/00131649921969802
Vossensteyn, H., Kottmann, A., Jongbloed, B. W. A., Kaiser, F., Cremonini, L., Stensaker, B., et al. (2015). Dropout and Completion in Higher Education in Europe: Main Report. European Union. Retrieved from: https://research.utwente.nl/en/publications/dropout-and-completion-in-higher-education-in-europe-main-report.
Waschull, S. B. (2005). Predicting success in Online Psychology Courses: Self-Discipline and Motivation. Teach. Psychol. 32 (3), 190–192. doi:10.1207/s15328023top3203_11
Yigit, S., and Mendes, M. (2018). Which Effect Size Measure is Appropriate for One-Way and Two-Way ANOVA Models? A Monte Carlo Simulation Study. Revstat Stat. J. 16 (3), 295–313.
Keywords: study decisions, self-assessment, predictors, completion, validation, higher online education
Citation: Delnoij L, Janssen J, Dirkx K, Gijselaers H, de Groot RH, Neroni J, de Bie M and Martens R (2021) Predicting Completion: The Road to Informed Study Decisions in Higher Online Education. Front. Educ. 6:668922. doi: 10.3389/feduc.2021.668922
Received: 17 February 2021; Accepted: 11 June 2021;
Published: 14 July 2021.
Edited by:
Adrian Castro-Lopez, University of Oviedo, SpainReviewed by:
Nicholas Daniel Hartlep, Berea College, United StatesNatali Hritonenko, Prairie View A&M University, United States
Copyright © 2021 Delnoij, Janssen, Dirkx, Gijselaers, de Groot, Neroni, de Bie and Martens. This is an open-access article distributed under the terms of the Creative Commons Attribution License (CC BY). The use, distribution or reproduction in other forums is permitted, provided the original author(s) and the copyright owner(s) are credited and that the original publication in this journal is cited, in accordance with accepted academic practice. No use, distribution or reproduction is permitted which does not comply with these terms.
*Correspondence: Laurie Delnoij, bGF1cmllLmRlbG5vaWpAb3Uubmw=