 Robert Mayes
 Kent Rittschof
95% of researchers rate our articles as excellent or good
Learn more about the work of our research integrity team to safeguard the quality of each article we publish.
Find out more
ORIGINAL RESEARCH article
Front. Educ. , 21 April 2021
Sec. STEM Education
Volume 6 - 2021 | https://doi.org/10.3389/feduc.2021.631684
This article is part of the Research Topic Future of STEM Education: Multiple Perspectives from Researchers View all 8 articles
The integration of Science, Technology, Engineering and Mathematics (STEM) programs is a national trend. The goal of implementing STEM in schools is to prepare students for the demands of the 21st century, while addressing future workforce needs. The Real STEM project focused on the development of interdisciplinary STEM experiences for students. The project was characterized by sustained professional development which was job-embedded, competency-based, and focused on the development of five STEM reasoning abilities within real-world contexts. The project promoted inclusion of tasks that drew on multiple STEM disciplines, embraced the use of authentic teaching strategies, and supported development of collaboration through interdisciplinary STEM professional learning communities and engaging STEM experts from the community. The four tenets of the project are presented and research on developing and characterizing measures of student impact are provided. Key outcomes include the construction and evaluation of measures supporting interdisciplinary STEM to assess both the impact of intervention on student attitudes toward STEM and students’ STEM reasoning abilities. Findings include reliability and validity evidence supporting attitude measurement and reasoning measurement as well as exploratory results that highlight a disconnection between STEM attitudes and STEM reasoning with the interdisciplinary STEM intervention examined.
The integration of interdisciplinary Science, Technology, Engineering and Mathematics (iSTEM) into schools is a national trend in the United States, apparent in the call to establish STEM designated middle and high schools (Executive Office of the President, 2010; President’s Council of Advisors on Science and Technology, 2010; Tanenbaum, 2016), as well as in the creation of STEM academic/career pathways for future workforce development (National Research Council, 2013). The Next Generation Science Standards (Next Generation Science Standards Lead States, 2013) and the Common Core State Standards for Mathematical Practice (National Governors Association Center for Best Practices and the Council of Chief State School Officers, 2010; Bennett and Ruchti, 2014) provide science and engineering practices and mathematical practices that support the inclusion of STEM in schools. These practices include modeling, integrating mathematics and computational thinking into science, planning and carrying out investigations of real-world problems, analyzing and interpreting data, and designing solutions.
A problematic issue for STEM researchers and practitioners is the variety of interpretations of STEM education (English, 2016). Vasquez et al. (2013) established a continuum of increasing levels of STEM integration: disciplinary, multidisciplinary, interdisciplinary, and transdisciplinary. A collaborative known as the Real STEM project has endorsed the increased push for STEM integration at the interdisciplinary (2 or more disciplines closely linked concepts/skills studied to deepen understanding) and transdisciplinary (2 or more disciplines applied to real-world problem) levels (Honey et al., 2014; Johnson et al., 2015). The Real STEM project sought to move beyond what Shaughnessy (2013) termed the STEM veneer, where approaches implemented in schools do not genuinely integrate STEM disciplines. In addition, research on the impact of STEM integration on content knowledge or interdisciplinary processes appears limited and inconclusive (English, 2016). English and Gainsburg (2016) call for research on the impact of content knowledge in STEM areas and interdisciplinary processes, including critical thinking and problem solving. Honey et al. (2014) espouse the need for the study of impact on affective factors, such as student engagement, motivation, and perseverance. The form of evidence collected to demonstrate STEM integration is also frequently lacking (Hernandez et al., 2013; Honey et al., 2014). To constructively continue the work of the Real STEM project the study reported in this paper takes steps to address gaps in research. Prior to specifying these steps some further background on the project will provide needed context.
The Real STEM project was funded by the Georgia Department of Education Innovation Fund to provide professional development. The project supported implementation of interdisciplinary STEM experiences through course modules in existing science and mathematics courses, as well as through new interdisciplinary STEM courses at the middle school and high school grade levels. The two primary student outcomes of the project were to (a) increase student engagement and persistence in STEM and (b) improve students’ STEM reasoning. The intended long-term outcomes of Real STEM were to meet future STEM workforce needs by increasing student retention in the STEM pipeline and to develop STEM literate citizens who can make informed decisions about grand challenges impacting their future. Teachers participated in a 2-week summer workshop with professional development field experiences that prepared them to guide students in authentic interdisciplinary STEM research, modeling, and design experiences. As a part of these authentic experiences, teachers were mentored on collaborating with regional STEM experts to identify authentic place-based STEM challenges. The STEM research design experience was to be student-centric, with students formulating research questions within the frame of challenges identified by STEM experts. The STEM experts were to mentor the teachers and students as students explored their problem, collected the data, analyzed the data, and reported findings to an expert panel. Students were expected to view the problem through interdisciplinary STEM lenses, bringing chemistry, biology, physics, earth sciences, computational science, engineering, and mathematics to bear on the problem where appropriate. The project leadership team led the summer workshops and conducted monthly classroom observations in the partner schools.
The Real STEM project provided sustained professional development in interdisciplinary STEM. Sustained professional development is job-embedded (Croft et al., 2010; Huffman et al., 2014) and competency-based (Burke, 2005), with the goal of building interdisciplinary professional learning communities (PLCs) consisting of school administrators and teachers of science, mathematics, technology, and engineering (Fulton and Britton, 2011). Mayes et al. (2018) describes a program which provided support and mentoring for teachers in four key tenets supporting interdisciplinary STEM teaching and learning. These tenets are as follows.
Educators ensure that STEM is taught as an interdisciplinary approach (Stohlmann et al., 2012). We took the perspective that a meaningful STEM task must incorporate at least two of the four STEM fields. We asked teachers to start by having students view problems through all four STEM lenses, before eliminating those that did not apply. We stressed use of real-world problems, which were often interdisciplinary and occurred in complex systems.
Educators incorporate project-based teaching, problem-based teaching, and place-based education strategies to actively engage students (Boud and Feletti, 1997; Thomas, 2000; Reiser, 2006; Bell, 2010; Sobel and Smith, 2010). A primary goal of integrating STEM into a school was to provide students with the opportunity to engage in real-world problem solving through hands-on experimentation, research, modeling, and design challenges. Teachers were mentored in implementing authentic teaching strategies, including project-based learning (Buck Institute for Education, 2017), problem-based learning (Strobel and van Barneveld, 2009; Savery, 2015), and place-based education (Sobel and Smith, 2010).
Educators create STEM PLCs within the school supported by community, business, research institute and school partnerships (Larson, 2001; Blankenship and Ruona, 2007). Interdisciplinary STEM requires a team approach to teaching in order to support authentic real-world ill-structured problems. Real STEM schools established interdisciplinary STEM learning communities that included teachers of science, mathematics, engineering/technology (when available), and an administrator. The PLCs were instructed to meet regularly to consult on implementing STEM tasks. Development of collaborations with STEM community experts was an expected outcome for the PLC team.
Educators set outcomes that go beyond student engagement to development of five 21st century STEM reasoning abilities identified by education experts (Wing, 2008; Schwarz, 2009; Householder and Hailey, 2012; Holland, 2014; Mayes et al., 2014). For interdisciplinary STEM programs to grow and be sustained they must do more than increase student engagement. STEM programs need to have established learning outcomes, but also need to include student-centric, ill-structured problems which are difficult to connect with predetermined STEM content standards. That is, rigid synchronizing with content standards can contradict the open-ended nature of STEM tasks. The learning outcomes we highlighted are the development of student ability to think like a scientist, a computer scientist, an engineer, and a mathematician. STEM experts have different problem-solving processes which, while they overlap, are not the same. Our examination of the literature resulted in the identification of five STEM reasoning modalities which are 21st century abilities STEM experts call for students to develop:
(1) Complex system reasoning is the ability to analyze problems by recognizing complexity, patterns, and interrelationships within a system featuring a large number of interacting components (agents, processes, etc.) whose aggregate activity is non-linear (not determined from the summations of the activity of individual components) and typically exhibits hierarchical self-organization under selective pressures (Holland, 2014).
(2) Scientific Model-based Reasoning is the ability for students to construct scientific models in order to explain observed phenomena (Schwarz, 2009).
(3) Technological Computational Reasoning is an analytical approach grounded in the computer sciences. It includes a range of concepts, applications, tools, and skill sets that allow us to strategically solve problems, design systems, and understand human behavior by following a precise process that engages computers to assist in automating a wide range of intellectual processes (Wilensky and Resnick, 1999; Wing, 2008).
(4) Engineering Design-based Reasoning is the ability to engage in the engineering design process through implementation of a series of process steps to come up with a solution to a problem. Many times, the solution involves designing a product (like a machine or computer code) that meets certain criteria and/or accomplishes a certain task (Householder and Hailey, 2012).
(5) Mathematical Quantitative Reasoning (QR) is mathematics and statistics applied in real-life, authentic situations that impact an individual’s life as a constructive, concerned, and reflective citizen. QR problems are context dependent, interdisciplinary, open-ended tasks that require critical thinking and the capacity to communicate a course of action (Mayes et al., 2014).
The Real STEM project developed instruments to begin measuring impacts of the project on teacher practice, student attitudes, and student reasoning. In this paper we focus on the measurement of student attitudes and student reasoning. Teacher practice data is presented and analyzed in a separate article (Mayes et al., 2018). The goals of the present study begin with (a) examining the measurement characteristics of the instruments developed in order to examine STEM integration impact. This will be accomplished through piloting these instruments in school intervention settings and through careful analyses of instrument qualities and the student performances. Following completion of this goal we will have established the foundation for a second goal, (b) exploratory analyses of the effect of the Real STEM intervention on teacher practice, student cognition, and student attitudes. The focus of this report is the crucial work in support of these two main goals that represent vital developmental stages for enabling subsequent and ongoing investigation of STEM integration.
A total of 898 students across six middle schools and six high schools participated in the attitude assessment portion of the study. The students were evenly split among males (50.2%) and females (49.8%), with a large percentage of Caucasian (62.4%) and Black/African American (24.1%) students. Hispanic/Latin American, Asian, Native American, and Other students constituted a combined 13.6% of the respondents. Three quarters of the students were at the middle school level (75.6%). The higher number of middle school students was due both to middle schools offering more sections of STEM courses than high schools, and the middle schools having larger enrollments per section.
A total of 1,315 students participated in the reasoning assessment portion of the study at four middle schools (N = 783) and two high school (N = 532) levels. The students were 51.8% males and 46.5% females (1.7% not indicating gender), with a large percentage of Caucasian (63.6%) and Black/African American (21.9%) students.
The STEM Student Attitude Survey consists of six questions examining student attitudes toward the four STEM subject areas and 10 questions on their attitudes toward interdisciplinary STEM. Students ranked each item from 1 for a strong negative response to 5 for a strong positive response. An example from each section of the survey is provided below:
• Student Attitudes Concerning each STEM AREA, such as scienceConfidence: How confident were you in your ability to do well in science before class versus now? 1 Very unconfident 2 Unconfident 3 Neutral 4 Confident 5 Very Confident
• Student Attitudes concerning Interdisciplinary STEMEmployment: I understand how STEM is important to many jobs in my community. 1 Strongly Disagree 2 Disagree 3 Neutral 4 Agree 5 Strongly Agree
The survey was developed by the project team consisting of a mathematics educator with extensive experience in STEM education, a science educator, and an evaluation expert. The survey items were derived from the Applied Learning Student Questionnaire (Georgia Governor’s Office of Student Achievement, 2017) developed for the Georgia Governor’s Office of Student Achievement. The survey was administered online upon completion of a STEM course. Students were asked to rate each of these areas regarding before taking the course (reflection) and after taking the course (present). The teachers were requested to have all 1,315 students participating in Real STEM courses complete the survey.
The STEM Student Reasoning Assessment was developed by the project team to provide a common measure for the Real STEM Project of student understanding of the five 21st century reasoning modalities promoted as course outcomes. The project team conducted research on each of the five reasoning areas, creating white papers that outlined key characteristics of the reasoning areas. Assessment items were then developed to evaluate student understanding of the characteristics. The items were vetted by the project team including the external evaluator. The assessment consists of 34 multiple choice questions: eight on scientific model-based reasoning, six on engineering design-based reasoning, five on complex systems reasoning, seven on technological computational reasoning, and eight on mathematical quantitative reasoning. The number of items included per reasoning category was determined through mapping of crucial question topics appropriate to the varied characteristics of each category. The lead teachers of the STEM courses were asked to administer the STEM Student Reasoning Assessment as a pre–post, but due to the variety in implementation of the STEM courses across schools, some teachers selected only to administer the reasoning assessment as a post-test and others did not administer the assessment, yielding 426 students (32%) whose pre and post tests could be matched. Sample questions from the assessment for each STEM reasoning area are provided in Box 1.
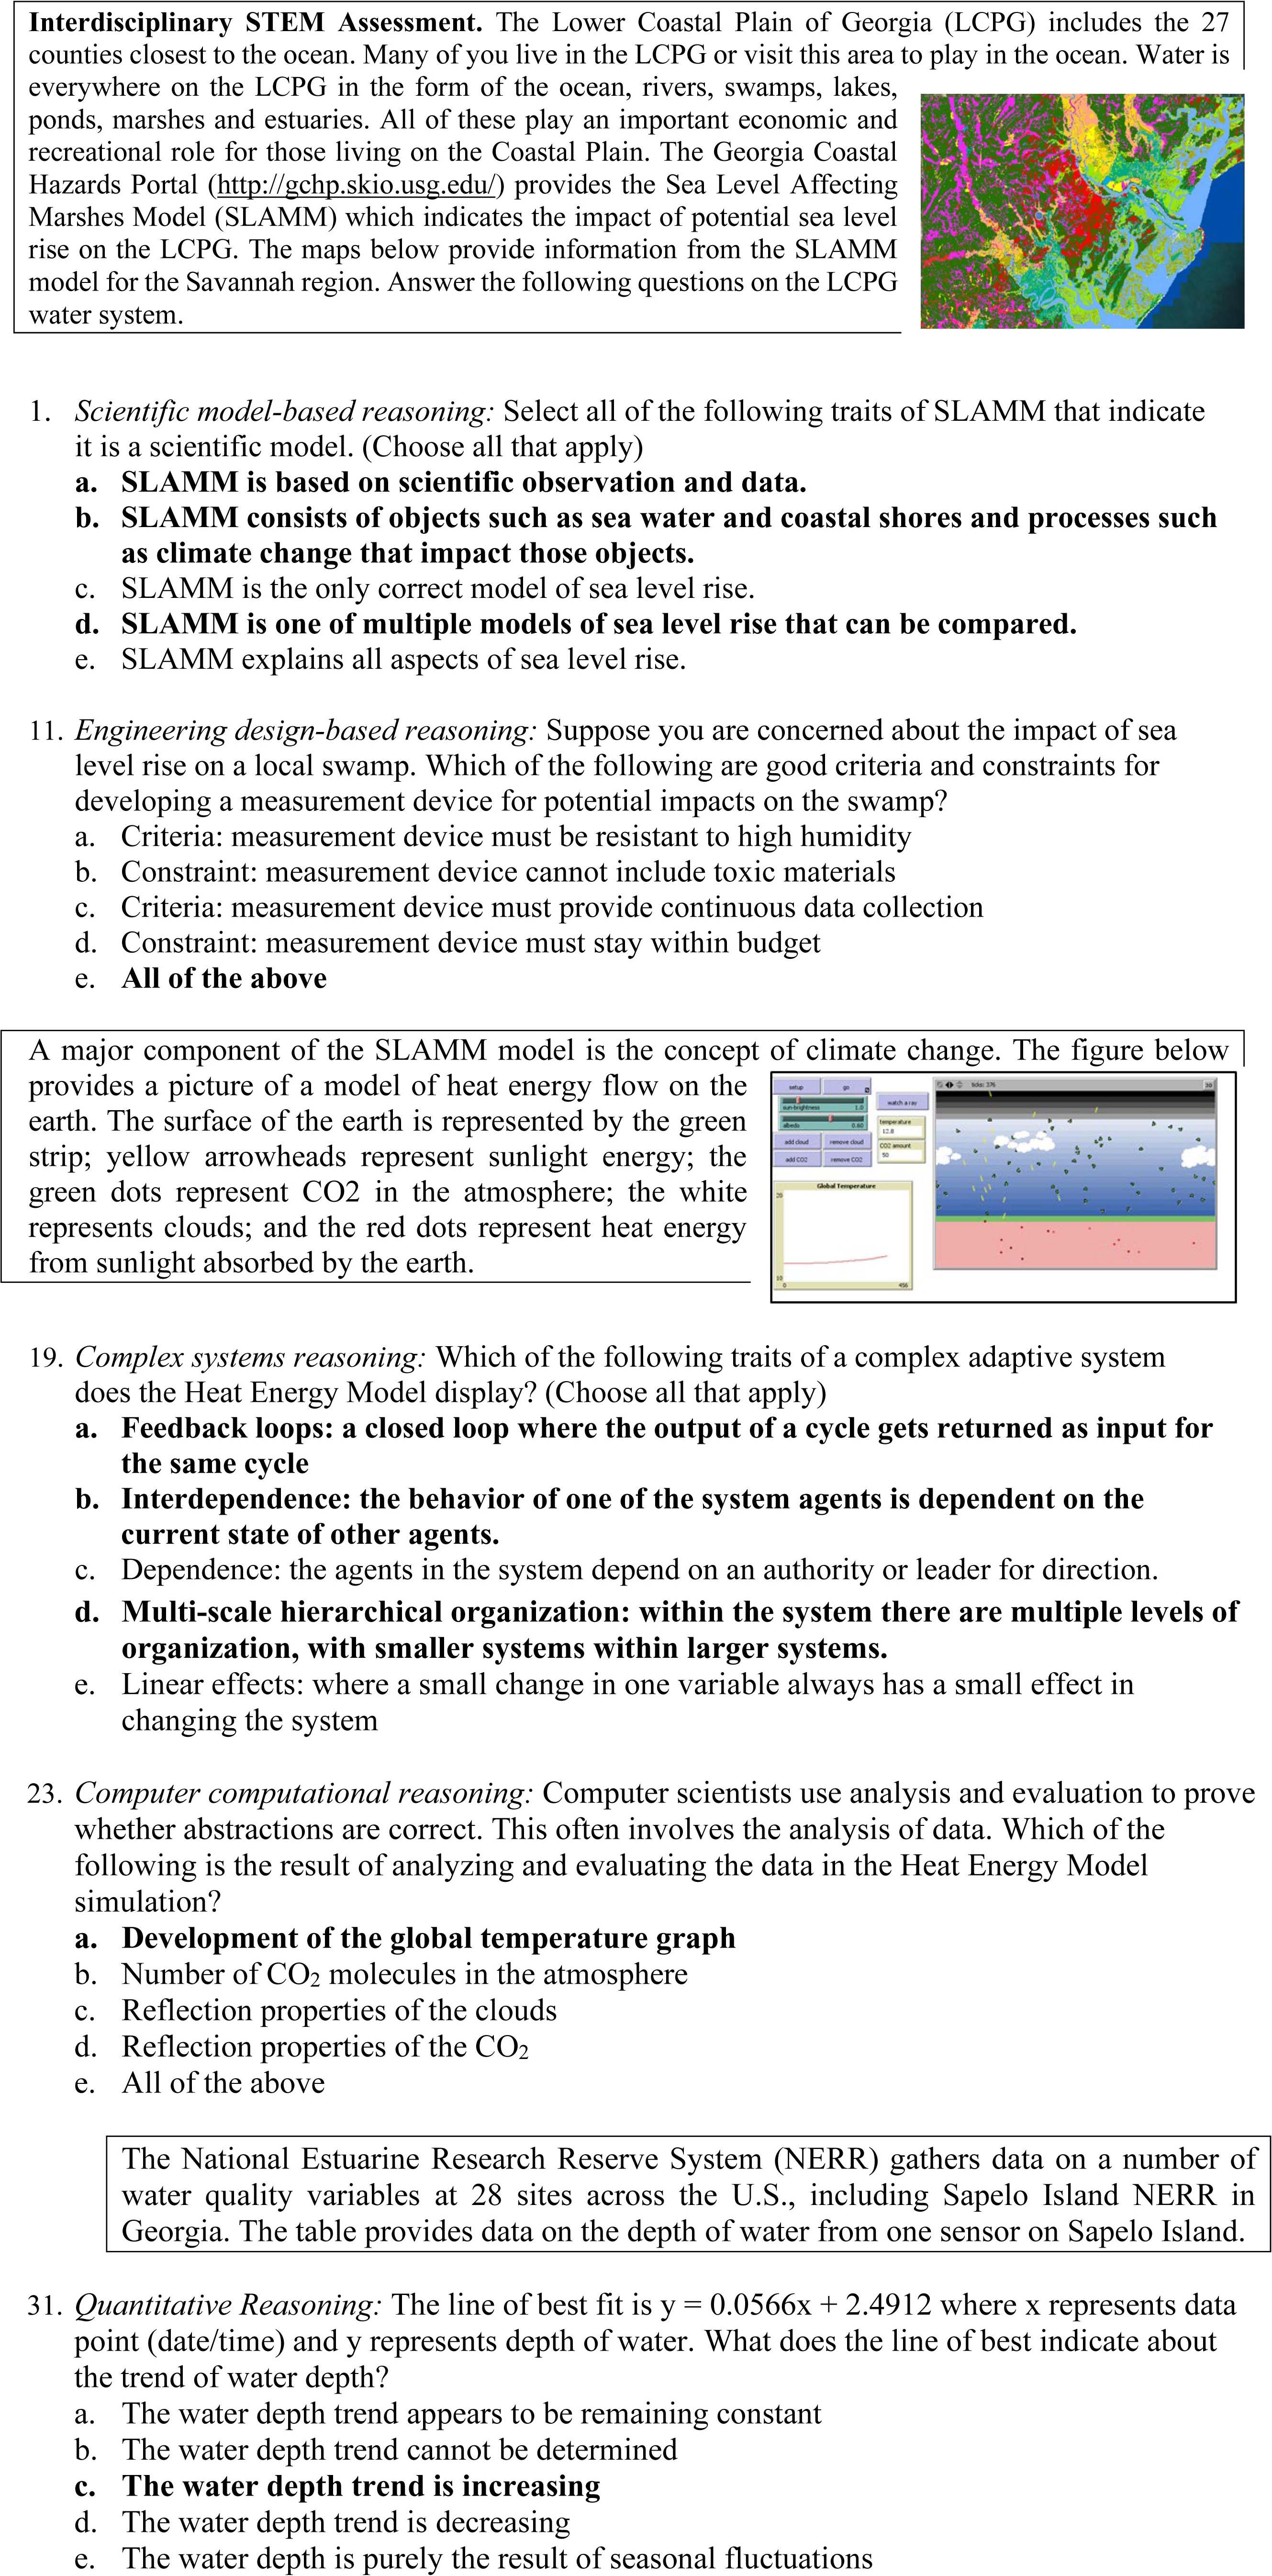
Box 1. Sample questions from the STEM Student Reasoning Assessment.
In support of the investigation goals which include piloting and evaluating two measurement instruments, the research design involved two studies, both of which included non-experimental components and the second of which also included a quasi-experimental component. The Study 1 non-experimental dependent variable was student attitude levels, examining attitude time and attitude categories within subjects. Independent variables of student gender and student school level were used. The Study 2 non-experimental dependent variable was student reasoning ability, examining reasoning categories within subjects. The quasi-experimental component of Study 2 was a pre–post-test design with the dependent variable of STEM reasoning ability and the repeated measure of test administration. The independent variables of student gender and student school level were used. IBM SPSS (IBM Corporation, 2017) and Winsteps (Linacre, 2017a) were used for statistical and measurements analyses.
Evidence on measurement validity and reliability resulting from administrations of the STEM Student Attitude Survey and the Student STEM Reasoning Assessment was examined using the Rasch rating scale model and the Rasch dichotomous model, respectively, and in accordance with the two different item types of each assessment. Both of these models assume a unidimensional measurement structure and include a difficulty parameter that differentiates the item characteristics (Andrich, 1978; Rasch, 1993). These Rasch measurement models support the examination of construct validity and content validity, as well as student reliability and item reliability (De Ayala, 2009; Engelhard, 2013; Bond and Fox, 2015).
Construct validity was evaluated using item fit statistics, item measure correlation statistics, rating scale functioning, and principal components analysis (PCA) of residuals which allows examination of a dominant dimension, or unidimensionality (Bond and Fox, 2015). Item fit statistics included infit and outfit mean square (MNSQ) values. Items with values above MNSQ = 1.3 (1.4 for rating scales) indicate underfit that does not contribute to the construct measure (Wright et al., 1994; Linacre, 2017b). Those items above MNSQ = 2.0 also indicate underfit but to a higher degree that likely distorts the construct measure (Linacre, 2002). Although values below MNSQ = 0.7, known as overfit, are not considered to distort the construct measure, they may cause misleading increases in reliability estimates. To reflect item discrimination, item point measure correlation values should be positive in value, ideally above 0.50 though no less than 0.15. Rating scale functioning statistics, relevant only for the STEM Student Attitude Survey, were examined for favorable criteria of greater than 10 observation per each of the five categories, average category measures that increase with categories (i.e., ordered), threshold calibrations that were ideally 1.4–5 logits apart, and non-overlapping rating scale distribution peaks. PCA of residuals yields eigenvalues and corresponding percentages of variance accounted for by the principal component of the construct. For strong unidimensional structure overall variance accounted for by measures would ideally be 50% or greater, with unexplained variance accounted for less than 5% to support the construct. In addition, when strong unidimensional structure is not present, overall we are looking for variance that is no less than a 20% threshold for our unidimensional analyses (Reckase, 1979).
Content validity was evaluated with regard to the measurement continuum and the sample targeting. These two characteristics reflect a portion of the content validity evidence related to expectations of the distribution of item difficulties including mean and standard deviation values. The characteristics were each examined with the graphic visuospatial assistance of an item/person map, or variable map. Variable maps consist of the item difficulty measurement distribution placed on the same continuum and scale as the person measure distribution. For the STEM Student Attitude Survey, difficulty refers to endorsement difficulty, given that data represent a rating rather than a performance level. The variable map is made possible by the Rasch calibration of items and persons to a common logit scale. Attitude and content area items should be represented across the continuum at different difficulty levels for ideal measurement, given the expectation for diverse attitude responding or diverse understanding among participants. The item measurement continuum should ideally not have significant gaps in difficulty relative to the student measures of ability or attitude. Hence, larger numbers of students and/or items typically allow for improved interpretation of the measurement continuum. Targeting refers to the overlap between item measures and person measures whereby the greater the overlap the more accurate and less error prone the measurement will tend to be. Well mirrored distributions, including means and standard deviations, reflect an appropriate matching of participants with the instrument.
Reliability was evaluated using the item separation index, the student separation index, the item reliability coefficient, and the student reliability coefficient from the Rasch model analyses (Boone et al., 2013; Engelhard, 2013; Bond and Fox, 2015; Linacre, 2017b). The separation indices reflect the spread of student ability (or attitude) and item difficulty, respectively, to allow distinct levels. Separation levels greater than 2 for persons and greater than 3 for items are expected in order to support reliable measurement. These levels respectively represent two levels on the measurements scale (e.g., high and low performance or ratings) and three levels of difficulty. The reliability indices provide a statistic based on measures rather than raw scores, which ranges between 0 and 1. Person reliability is similar to the well-known raw-score based Cronbach alpha, though preferable to alpha due to it being based on measures. Person reliability levels above 0.80 and item reliability levels above 0.90 are expected as indicators of strong reliability evidence.
The survey items, final response means, and mean change as retrospectively reported relative to each item are provided in Table 1.

Table 1. STEM student attitude survey.
Table 2 provides a summary of the validity and reliability findings for the STEM Student Attitude Survey, indicating whether the criteria used were met or flagged (bolded items in table) as concerns. Construct validity indicators of fit, scale functioning, and dimensionality (rows 3, 5, and 6) that resulted from survey calibration indicated both strengths and limitations in the overall survey measurement characteristics (column 2).
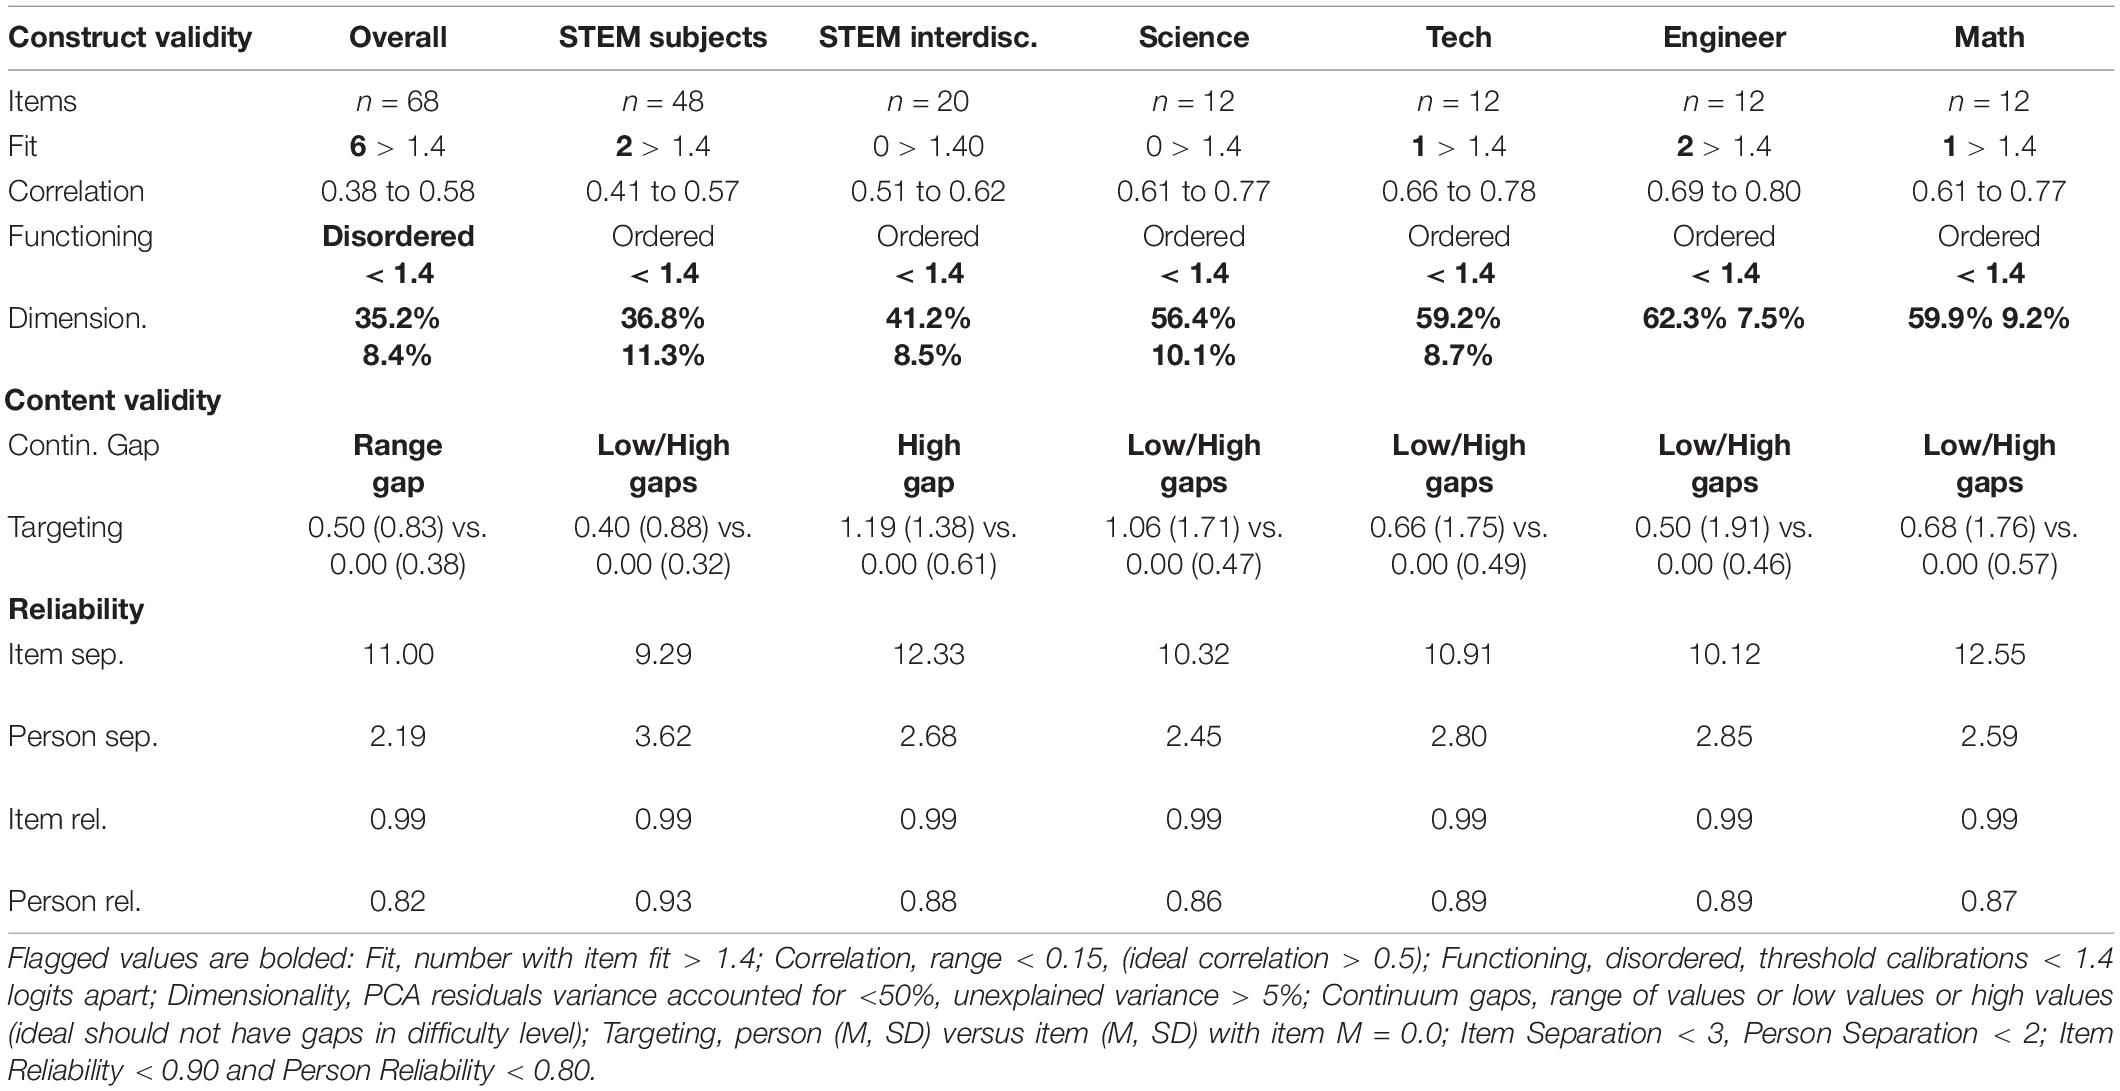
Table 2. STEM student attitude subject survey validity and reliability indicators.
Content validity indicators were partially satisfied but also revealed overall survey measurement limitations. Item and person reliability and separation indices (rows 11–14) were all at acceptable levels. Rasch analyses of meaningful subsets of the instrument were conducted including the STEM subject items (1–48; column 3), subject specific items (four sets of 12 each from 1 to 48; columns 5–8), and the general Interdisciplinary STEM items (49–69; column 4). These calibrations supported relatively strong unidimensionality, particularly for STEM subject item subsets. In addition, evidence supported consistently ordered scales and strong reliability evidence. However, with fewer items per subset examined, the widths of each item distribution were limited compared with that of the entire instrument, resulting in gaps relative to student measure locations.
Figure 1 provides the variable map for the interdisciplinary STEM attitudes calibration which illustrates the match between person measures and item measures. In sum, validity and reliability evidence supported separate subject specific attitude analyses, as well as interdisciplinary STEM attitude analyses. Analysis of attitudes across all subject areas combined together was also supported, but with weaker unidimensionality evidence. That is, the potential advantage of combining items resulted in a reduction in the strength of the dimension likely because of the construct distinctions introduced by the differing subject areas.
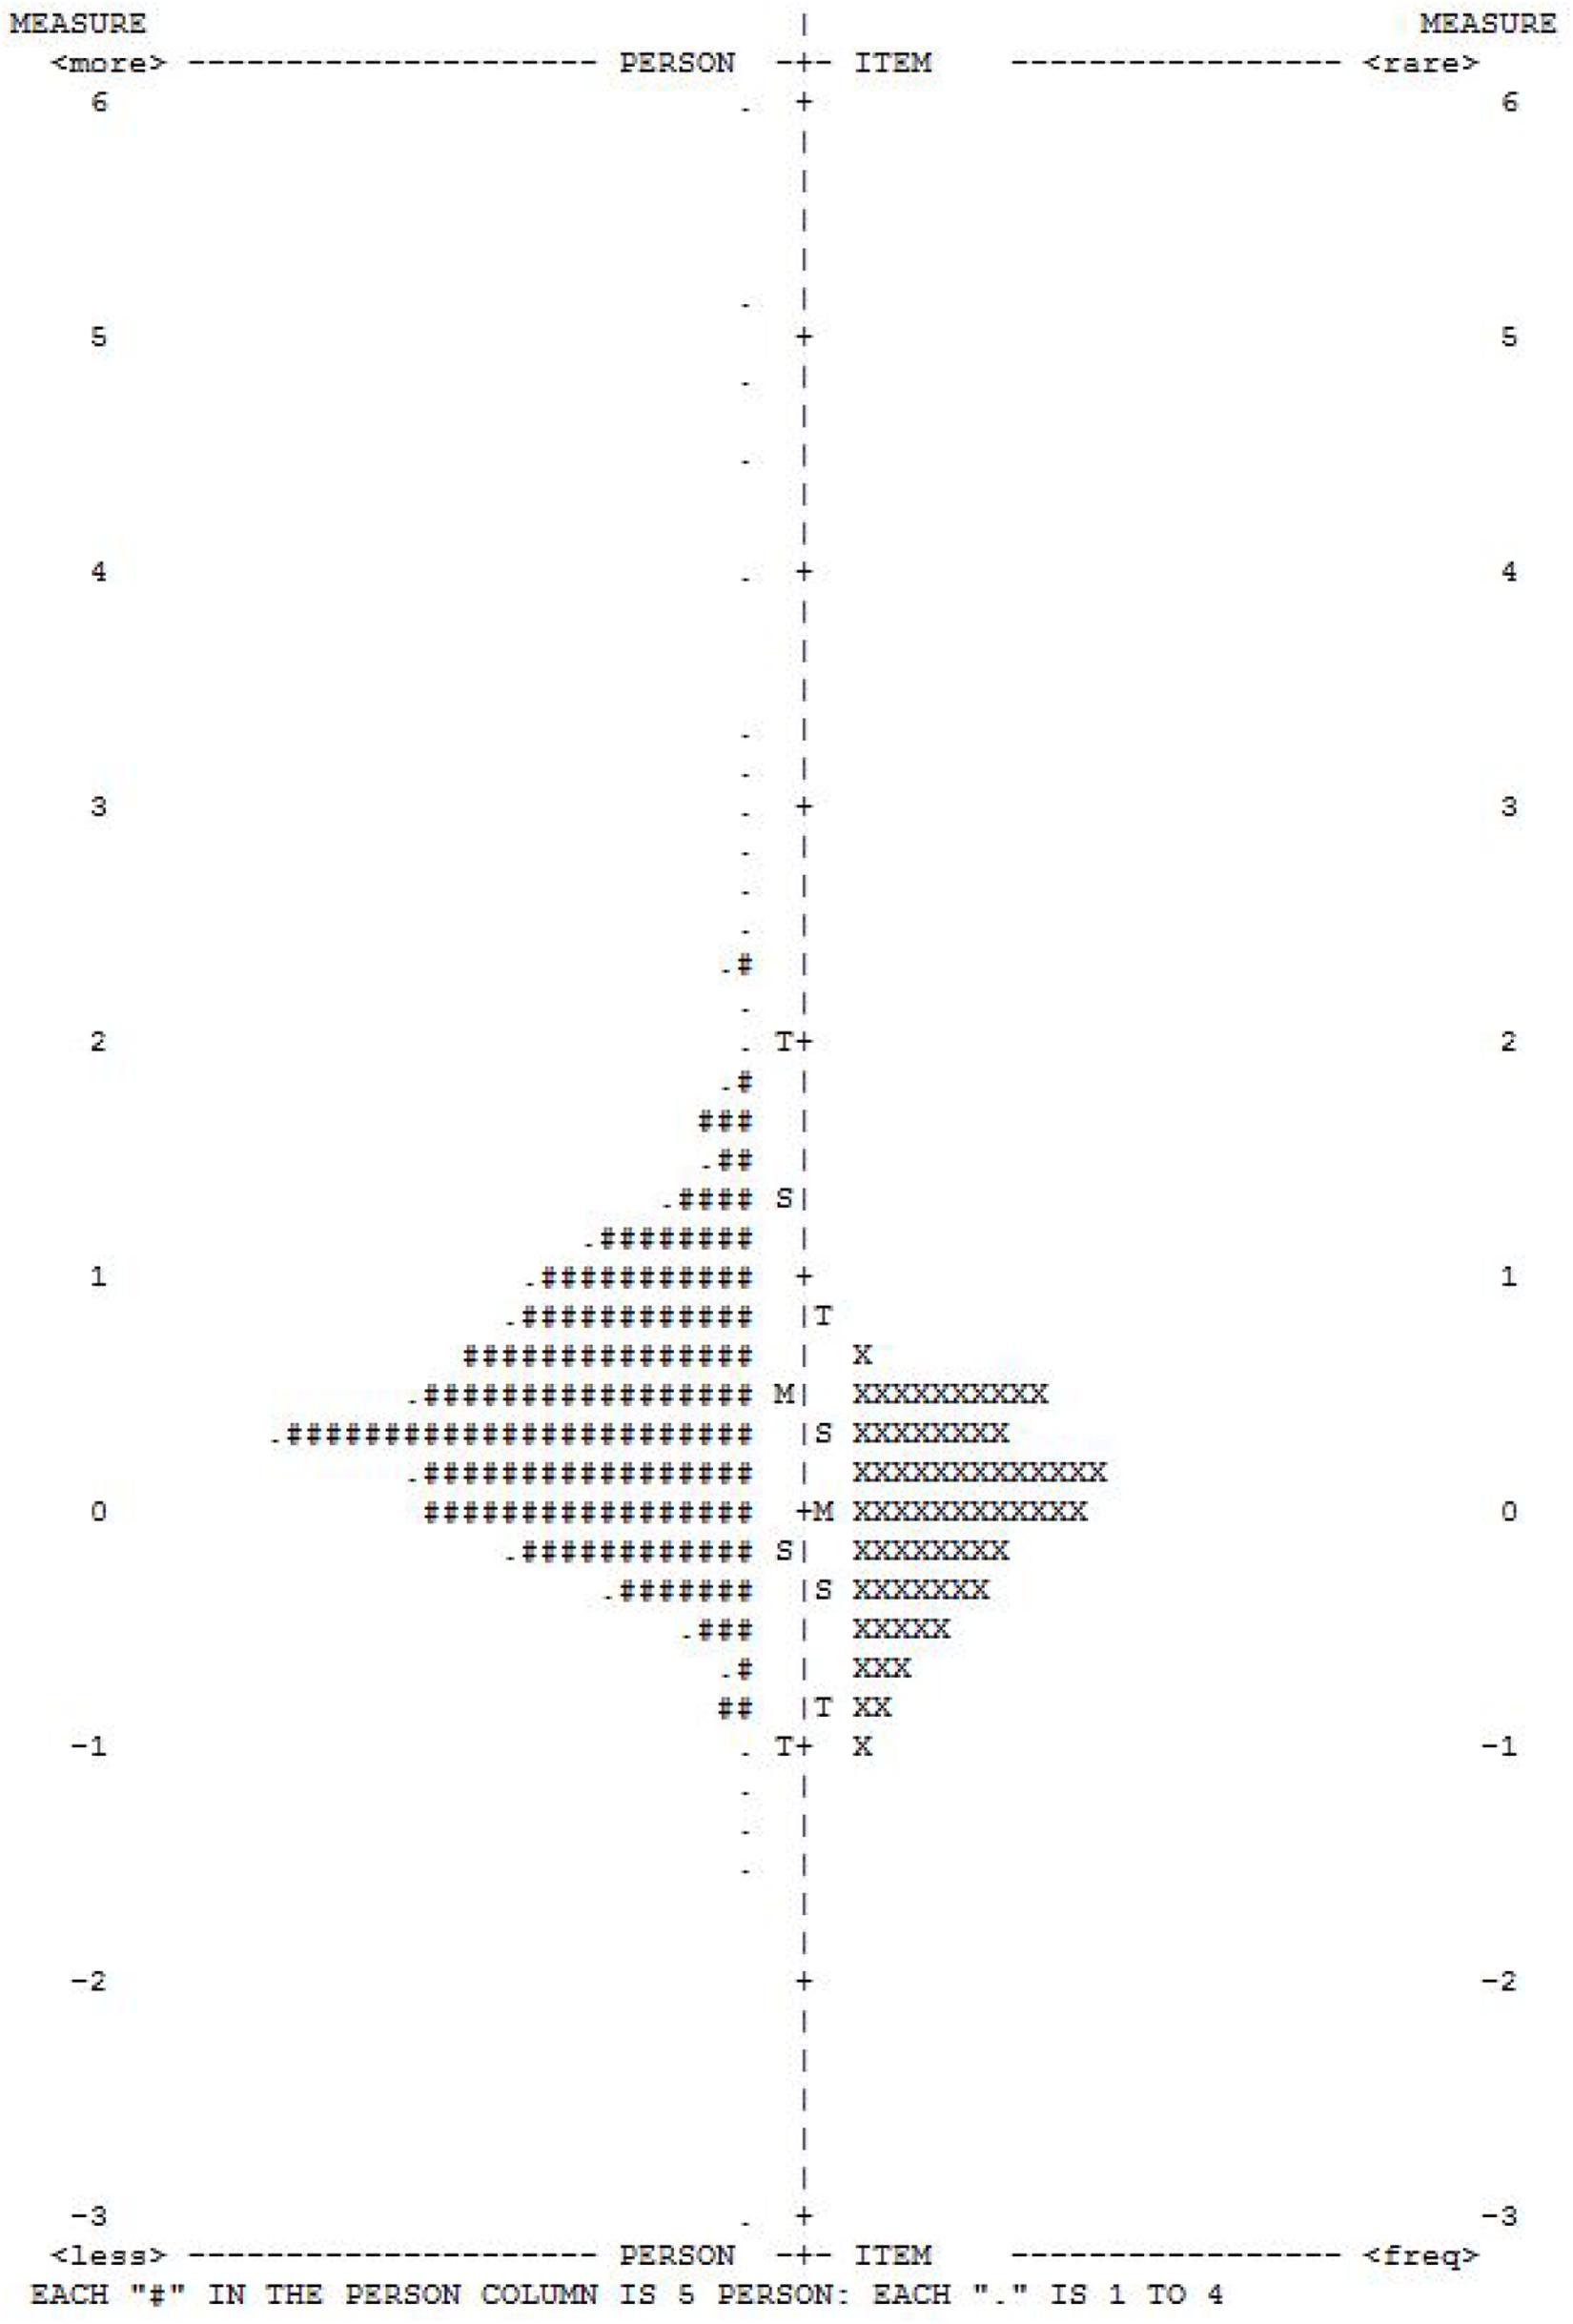
Figure 1. Variable map for the STEM Student Attitude Survey calibration which illustrates the match between person measures and item measures. EACH ″#″ IS 10: EACH ″.″ IS 1 TO 9.
To examine mean score comparisons from the STEM Student Attitude Survey statistical tests were conducted to support exploratory analyses of the resulting differences, in conjunction with difference magnitudes. Thus, responses were analyzed using correlated t-tests to initially identify overall differences in students’ attitudes, and one-way analyses of variance (ANOVA) to examine differences in attitudes between gender and school level categories individually. Following from the research questions we used one-way analyses rather than full factorial analyses as appropriate to the category sample size variations and category response differences. Thus interaction effects were not examined with this data because of the design and group size differences. A conservative p < 0.01 criteria level was used to evaluate statistical significance to help prevent Type 1 errors due to the multiple comparisons. Also, difference magnitudes as effect sizes were calculated using Cohen’s d for both within subjects (e.g., attitude change) and between-subjects (e.g., gender, school level) comparisons as we considered practical implications of findings and a standardized reference for subsequent investigations.
Analysis on the attitude survey items were conducted for (a) individual STEM subject areas by item, and (b) all STEM subjects items combined as a variable measuring attitude across STEM subject areas. The analysis of individual STEM subject area attitudes focused on reported change to addresses whether following the instructional experiences students tended to rate their attitude levels for each STEM subject area at a higher level than their recollection memory for their pre-instructional levels. This subject specific analysis of mean differences is presented in Table 3 (rows 1 through 4). Note that the survey was only administered post instruction, and they were asked to reflect on their attitude prior to instruction, yielding two attitude ratings per item. This survey rating approach is known as a recollection proxy pretest, which should not be confused with a pre-test posttest design.
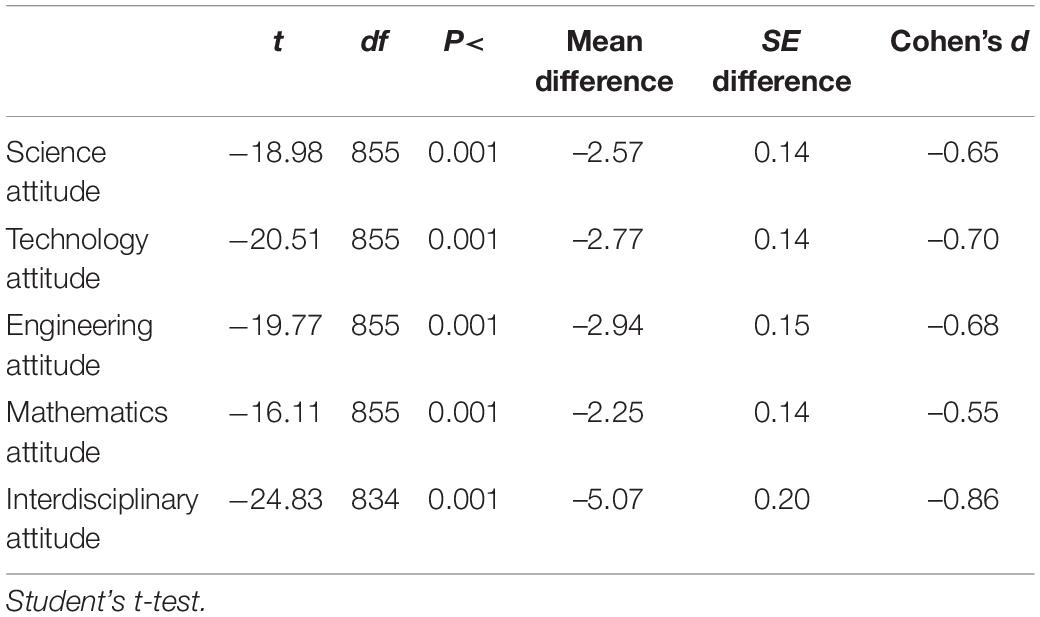
Table 3. Self-reported change in student attitude toward four STEM subjects and interdisciplinary STEM.
Analyses of attitude differences within each STEM subject area indicated statistically significant (p < 0.001) reported increase in mean overall student attitude ratings from before (retrospective) to after course in science, technology, engineering, and mathematics. The effect sizes for each STEM subject area change from their retrospective ratings were consistently above one half of one standard deviation, ranging from d = 0.55 to d = 68.
One-way ANOVAs on the individual STEM subject areas by demographic categories of gender and school level were examined. Though school level n was imbalanced, we conducted these comparisons to explore the developmental differences expected between middle and high school levels. With regard to gender, female students reported significantly more positive attitudes than male students about technology, F(1,854) = 47.59, p < 0.001, d = 0.46, and engineering, F(1,854) = 80.63, p < 0.001, d = 0.61, but differences by gender were not statistically significant for science, F(1,854) = 0.003, p = 0.96 or mathematics, F(1,854) = 0.52, p = 0.47. Middle school students reported significantly more positive attitudes than high school students in the areas of science, F(1,854) = 8.57, p < 0.004, d = 0.23, and mathematics, F(1,854) = 57.03, p < 0.001, d = 0.58, but differences by school level were not statistically significant for technology, F(1,854) = 5.64, p = 0.02, or engineering, F(1,854) = 5.06, p = 0.03.
The 10 attitude items on interdisciplinary STEM provided data on students’ mean attitude about interdisciplinary STEM ratings as well as recollections of before and after instruction attitude change magnitudes with respect to being a STEM literate citizen who can make informed decisions (items 1–3), career opportunities in STEM (item 4), connection of STEM to real world (items 5–9), and enjoyment of STEM (item 10). Analysis on the attitude survey items was carried out for all the questions as a single construct measuring interdisciplinary STEM attitudes.
Table 3 (row 5) presents this analysis on the interdisciplinary STEM attitude construct. A t-test on interdisciplinary STEM indicated a statistically significant reported increase in recalled student attitudes from before to after course, t(834) = 24.83, p < 0.001, d = 0.84. There were no significant differences in interdisciplinary STEM attitudes between gender or school level categories. The statistically significant change in recalled attitudes toward interdisciplinary STEM occurred for all levels of gender and school level (all at p < 0.001).
Table 4 provides a summary of the validity and reliability findings for the Student STEM Reasoning Assessment, indicating whether the criteria used were met or flagged (bolded items in the table) as concerns. For the overall assessment analysis, one item (Item 6: Science Reasoning) was removed prior to this calibration after it was determined to be invalid due to multiple correct responses. This left 33 items for the overall assessment analysis. Construct validity, content validity, and person reliability levels shown in the first data column of Table 4 indicate the need for improvements in the overall assessment’s measurement characteristics. Still, the instrument showed strong item reliability and separation, as well as 30 items (91%) with productive fit to the measurement model, and 26 items (79%) with discrimination levels above the criteria of.15.

Table 4. Student STEM Reasoning Assessment validity and reliability evidence.
To examine measurement further by reasoning mode, Rasch analyses of meaningful subsets of the instrument were conducted, including reasoning mode specific items (five sets of items). Summary statistics are shown in the second through sixth data columns of Table 4 for these analyses. For reasoning mode calibrations, person reliability levels were all relatively low, particularly that of systems reasoning items. Science model-based reasoning items yielded the most promising levels of unidimensionalty, targeting, and reliability, though still too low for effective use. Thus, analyses at the reasoning mode level did not improve measurement compared with that of the overall instrument, so no further analysis by reasoning mode are presented.
Figure 2 provides the variable map for the STEM Reasoning calibration which illustrates the imperfect match between person measures and item measures. The variable also shows considerable overlap among most student measures of reasoning with the majority item difficulty measures. Based on these Rasch indicators the Student STEM Reasoning Assessment data outcomes as an overall construct using all items together are reported as preliminary findings, with the awareness that the instrument and administration process require refinement to achieve the measurement of STEM Reasoning sought. However, reporting and examining these initial findings provides an important baseline for subsequent measurement given the favorable characteristics of the majority of items that make up the instrument. That is, the present findings stemming from the Student STEM Reasoning Assessment will inform our ongoing process of measurement.
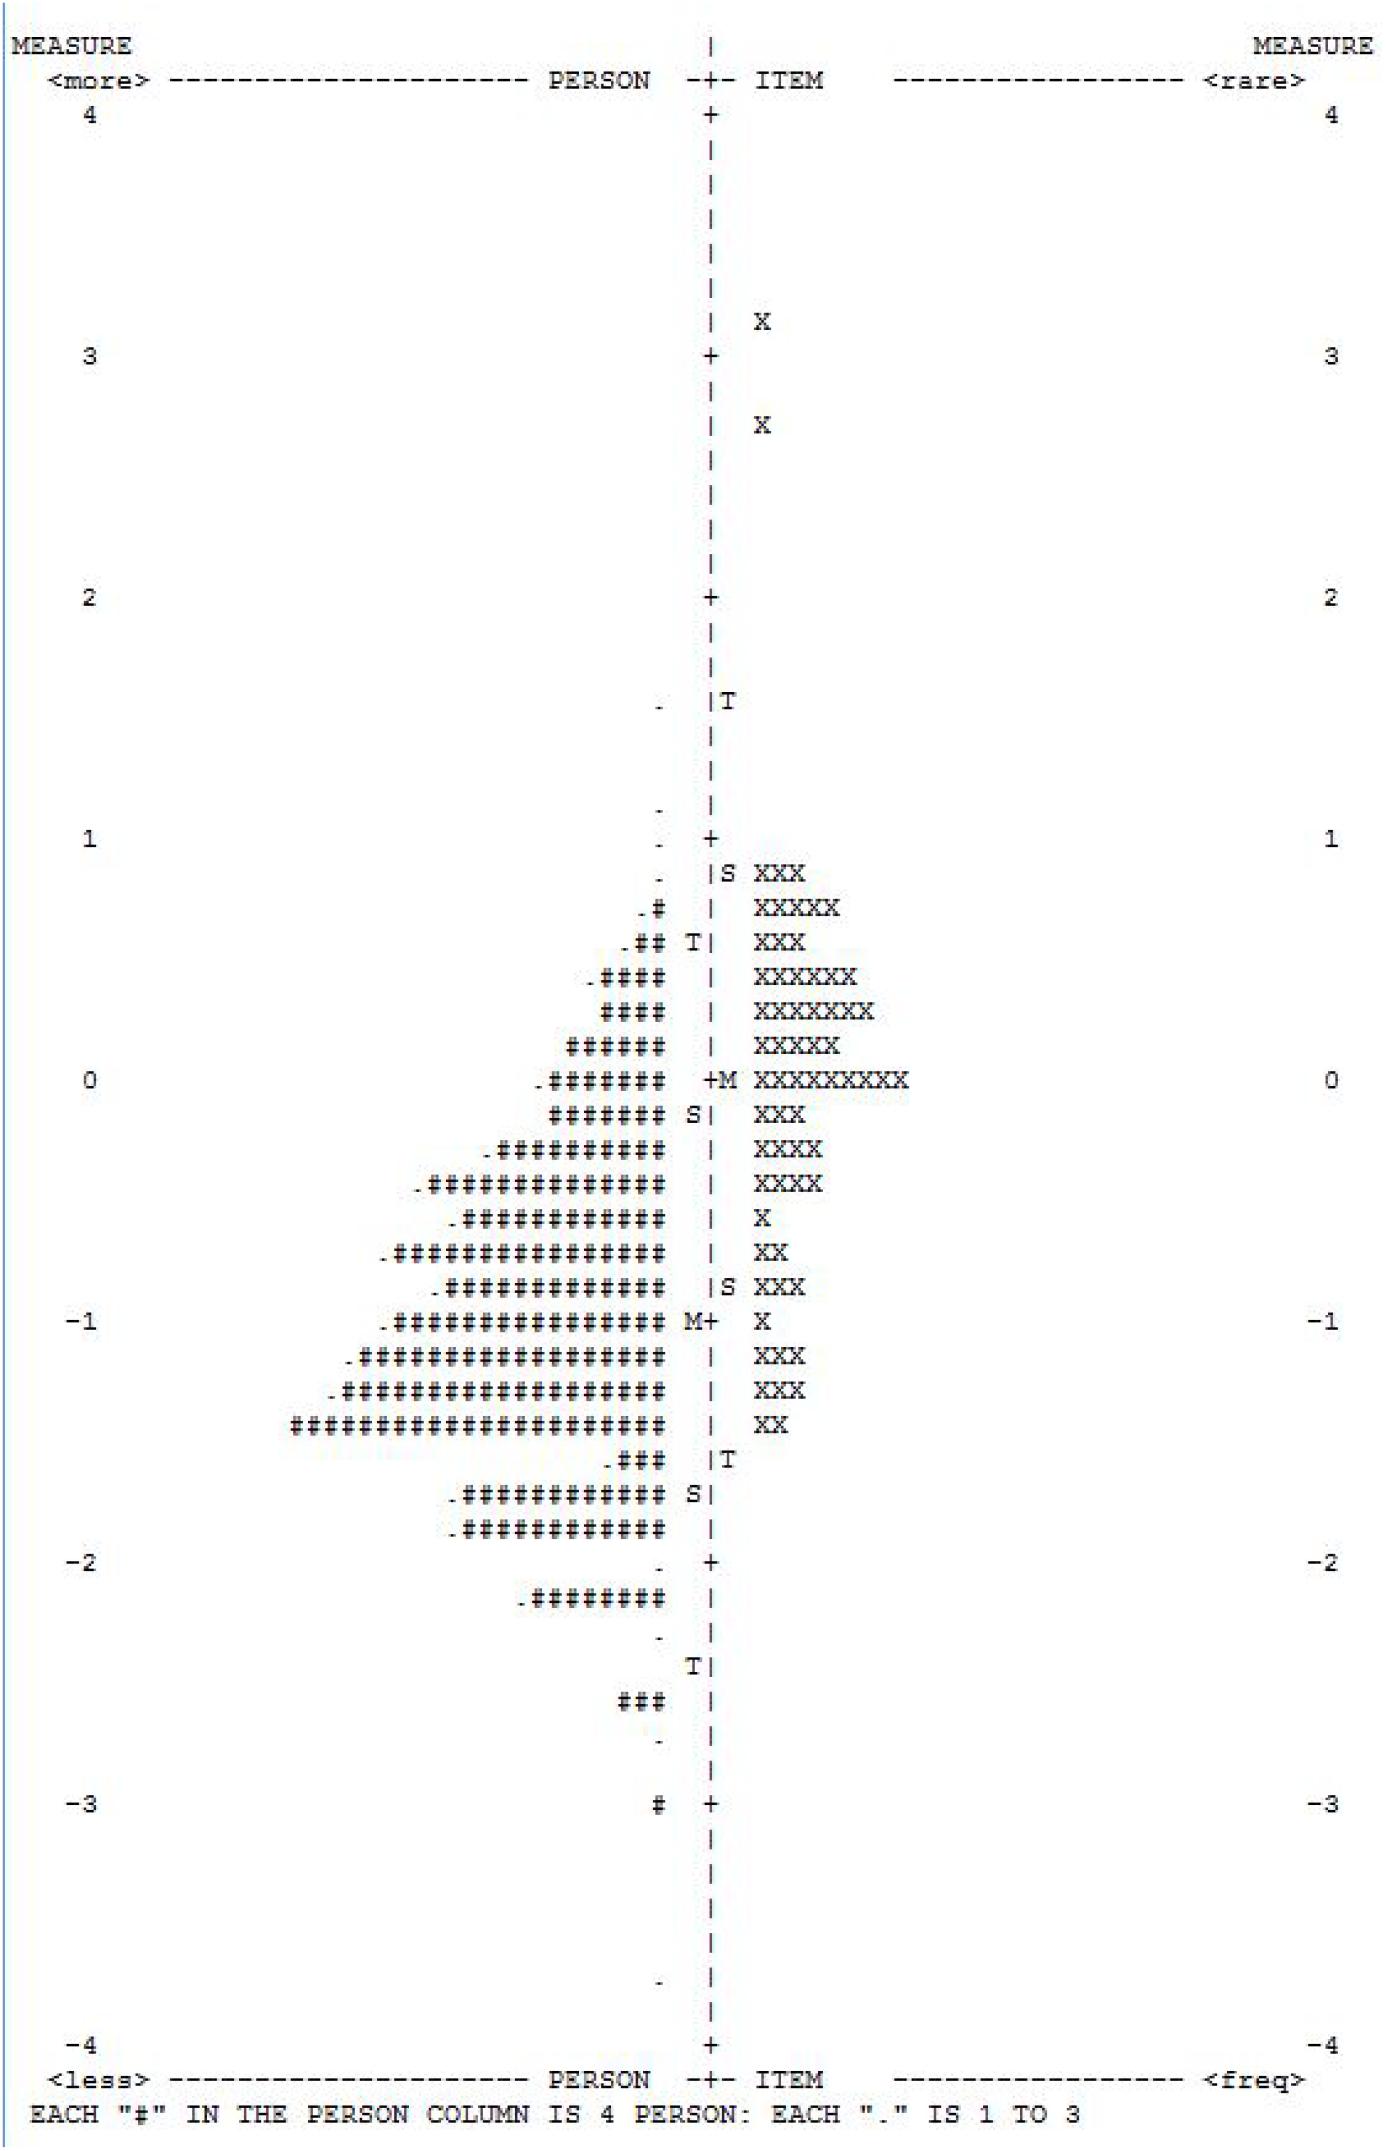
Figure 2. Variable map for the STEM Student Reasoning Assessment calibration which illustrates the match between person measures and item measures. EACH ″#″ IS 7: EACH ″.″ IS 1 TO 6.
Analyses are only reported for the overall STEM Student Reasoning Assessment, given the measurement findings reported above. A paired-sample t-test was conducted to identify statistically significant change in student understanding after exposure to the Real STEM course. Pretest and posttest statistics are provided in Table 5.
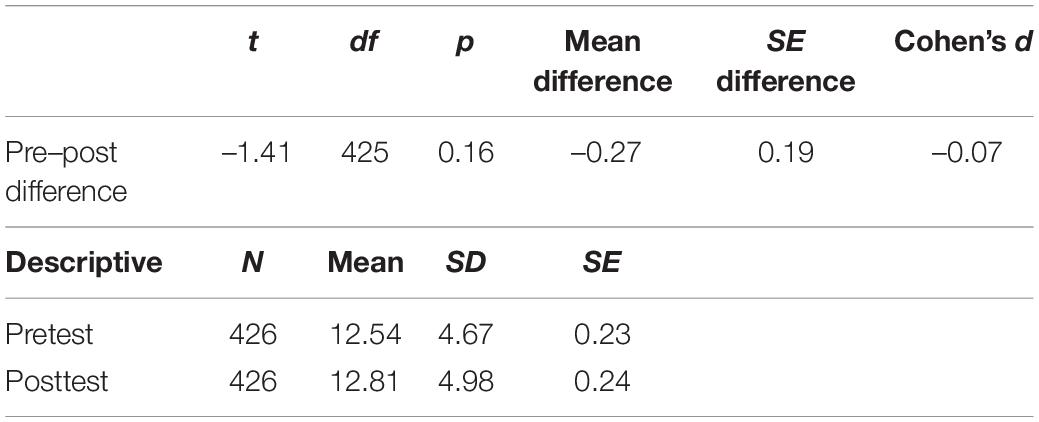
Table 5. Student STEM reasoning assessment.
The t-test indicated that there was no significant mean change from pretest to posttest in overall student STEM reasoning ability, t(425) = –1.41, p = 0.160. One-way ANOVA was used to examine between subjects mean score comparisons by gender and school level separately. Regarding gender, male students and female students did not differ significantly on mean pre-test, F(1,416) = 0.38, p = 0.54, posttest, F(1,416) = 0.24, p = 0.63, or pre-to-post difference in scores, F(1,416) = 1.81, p = 0.18. However, high school students had higher mean scores than middle school students on the pretest, F(1,424) = 190.33, p < 0.001, d = 1.3, and posttest, F(1,424) = 214.42, p < 0.001, d = 1.4, as expected, but not on the pre-to-post difference in scores, F(1,424) = 2.33, p = 0.13.
The Real STEM project allowed for a careful examination of both the attitude and reasoning instruments under investigation, in support of interdisciplinary STEM instruction and research. Data collected and analyzed were particularly valuable because each school partner was able to implement an interdisciplinary STEM program that addressed the unique needs of their students and the configuration of their school. The resulting variation in program implementation across schools represented an important contextual element and an important challenge to address for subsequent investigations. That this was not a report of a highly controlled treatment should be considered when interpreting the findings regarding the measurement characteristics and the preliminary findings regarding students’ attitudes and abilities.
With the measurement of STEM attitudes, analyses indicated supportive validity and reliability evidence particularly for subject specific attitude measurement, as well as interdisciplinary STEM attitude measurement. In addition, data suggested the potential benefit of additional items to help address the targeting of a broader range of perspective. On the other hand, with measurement of STEM reasoning the analyses favored an overall STEM reasoning rather than a subject specific measurement. Data suggested a lower than optimal level of person reliability, which may have resulted from the diversity of the items as well as the need for additional items at lower difficulty levels. In general, however, despite the imperfections identified for further consideration, testing, and development, both the attitude and the reasoning instruments provided effective tools for examining STEM impacts.
On the whole, findings from the STEM Student Attitude Survey indicated that the impact of the interdisciplinary STEM courses appeared very positive in several ways. Following instruction students reported having more favorable attitudes for the four STEM areas in all six attitude areas assessed. The course provided exposure in these areas that changed the ways students viewed them, according to what they reported. Attitude levels and change were different at moderate effect sizes, depending upon gender and school level. Female students on average reported more favorable attitudes than males toward multiple STEM areas, especially in technology and engineering. However, males on average reported no significant improvement in attitude within any of the STEM areas. Middle school students’ mean ratings reflected more favorable attitudes toward STEM areas than those of high school students in most of the six attitude areas assessed. Still, both the middle and high school students’ ratings reflected an increase in favorable attitudes for all STEM areas across six attitude items.
Attitudes toward interdisciplinary aspects of STEM were reported as more favorable following instruction for all 10 items that focused on interdisciplinary STEM. There was no significant difference in interdisciplinary STEM attitudes between gender categories in contrast to the positive differences found with females in some STEM areas. There was little difference between grade levels with respect to mean interdisciplinary STEM attitude rating, but both the middle school and high school students displayed improvement in attitudes toward interdisciplinary STEM on all 10 items.
Considering these findings on student attitudes relative to observations of the REAL STEM implementation across the schools supports recommendations for further inquiry supported by these findings. Based on our initial interpretation of the findings regarding student attitudes toward the four STEM areas and toward interdisciplinary STEM, we would recommend:
(1) Focused diverse learner strategies to increase engagement of all students and to address STEM attitude issues that have been observed in males (Saravia-Shore, 2008)
(2) Middle school and high school collaborations to determine best structures and methods for engaging students across grade levels in interdisciplinary STEM courses
(3) Increased interdisciplinary PLC interaction to sustain positive attitudes toward interdisciplinary STEM
The STEM Student Reasoning Assessment was developed to provide a common measure for student understanding of the five 21st century reasoning modalities. The assessment participation was voluntary and was not administered by all the included schools, due to not all schools addressing all five reasoning modalities. Although instrument validity and reliability evidence was likely affected by the implementation challenges, it indicated the need for further development of some items within the instrument. In addition, preliminary analyses identified some interesting group differences in STEM reasoning that are worth further investigation. The outcome that high school students outperformed middle school students overall in STEM reasoning is an expected relative to STEM exposure and related development of understanding regarding STEM. The school level performance difference lends support to the construct validity evidence of the instrument measures. The effect sizes of these grade level differences were relatively large, unsurprisingly. At the middle school level, on average, there was a slight non-significant drop in reasoning assessment scores following instruction, while at the high school level there was the expected increase, though non-significant, in average scores following instruction.
Overall the students had no significant mean improvement on the full interdisciplinary STEM assessment following instruction and the scores were relatively low (on average 38.8% correct) on what was shown to be a difficult assessment for this student sample as a whole.
As we consider the implementation challenges with variation across schools and the interdisciplinary STEM teaching and learning observed, our preliminary findings with STEM reasoning lead us to consider additional recommendations for further inquiry:
(1) Explicit identification of the STEM reasoning modalities on which to focus, including whether complex systems and computational reasoning will be a focus
(2) A deliberate focus on increasing engagement of female and male students within instruction and assessment to improve performance on STEM reasoning and support gender neutral learning
(3) Continuation with evaluation of STEM programs within schools to determine development of reasoning and problem-solving abilities as an academic outcome, with a focus on middle school STEM reasoning assessment
(4) An emphasis on evaluating the suitability of STEM reasoning instruments, including measurements that target student groups of interest, to effectively examine outcomes.
Our expectation in examining both the measurement of student attitudes about STEM and the measurement of student performance on STEM reasoning was that there would be a strong correspondence between these two measurements overall. However, an attitude and performance correspondence were not found within this investigation. Instead, though students consistently reported improved attitudes toward interdisciplinary STEM and STEM subject areas following instruction, they did not, on average, show improvement in STEM reasoning as measured. This finding of a disconnection between attitude and performance emphasizes the importance of the many considerations to bear in mind when developing an ability instrument. These considerations include the relative difficulty and content areas of the instrument items, the variation in student abilities, the consistency of the instructional contexts and delivery, and the focus of attention during administration, among other factors. As we determine ways to enhance the Student STEM Reasoning Assessment, it is important to note that while average performance did not improve, nearly half of the students (48.6%) did improve their STEM reasoning score following instruction, though most of those improvements were relatively small.
There are several factors to consider when interpreting student findings on STEM reasoning abilities. First, the STEM Student Reasoning Abilities Assessment was administered to students in 6th through 12th grade as a low-stakes classroom assessment. Only one assessment was used for all grade levels. As such, it is possible the degree of question difficulty and wording served as an obstacle to gauging the entire spectrum of change in student reasoning and understanding. This is evident in the fact that student scores were lower than expected on both the pretest and the posttest. Thus, the instructional treatment resulted in relatively small magnitudes of change using this assessment. These small effects would also tend to be less easily detected as statistically significant with the existing power, particularly within subgroup comparisons. These results also suggest the need to include a broader range of question difficulties within the assessment. The resulting mis-targeting of ability levels likely affected reliability findings.
Second, conditional factors may have influenced the collected data, given that the context represented a realistic instructional implementation of interdisciplinary STEM under low-stakes conditions rather than a tightly controlled experimental paradigm. As such, the test was not highly consequential for students relative to their course grades or other immediate concerns, which may have differentially affected motivation and persistence levels as well as memory recall for pre-instruction attitudes among students. These conditions may be associated with the gender–related and grade-related improvements found if these conditions affected females differently than males, and high school students differently than middle school students, for instance.
Finally, variation in the content validity of the assessment among different classrooms must be considered in relation to the units taught within those classrooms. While teachers were all provided with example modules and pedagogical support, they decided what to teach and how to teach the interdisciplinary STEM topics. Though some teachers strived to incorporate all the STEM reasoning modalities into their classroom, other teachers chose to focus on one or two reasoning modalities (e.g., science and mathematics) while focusing less on the others (e.g., complex systems, technology/computing, and engineering). All teachers were observed using an interdisciplinary STEM approach, but the STEM reasoning abilities assessment was designed to capture an interdisciplinary approach to STEM teaching that includes all four areas. The scores and any lack of dramatic performance improvement may partially reflect a tendency by educators to retain elements of a more traditional STEM class instructional approach, with less emphasis on the entire spectrum of interdisciplinary opportunities provided by the program.
The raw data supporting the conclusions of this article will be made available by the authors, without undue reservation.
The studies involving human participants were reviewed and approved by Georgia Southern University Institutional Review Board. Written informed consent to participate in this study was provided by the participants’ legal guardian/next of kin.
Both authors listed have made a substantial, direct and intellectual contribution to the work, and approved it for publication.
Georgia Governor’s Office of Student Achievement Innovation Fund, 39G5250, support STEM education development in Georgia, no funds provide for publication fees. Georgia Southern University Research support for publication.
The authors declare that the research was conducted in the absence of any commercial or financial relationships that could be construed as a potential conflict of interest.
Andrich, D. (1978). A rating formulation for ordered response categories. Psychometrika 43, 561–573. doi: 10.1007/bf02293814
Bell, S. (2010). Project-based learning for the 21st century: skills for the future. Clearing House 83, 39–43.
Bennett, C. A., and Ruchti, W. (2014). Bridging STEM with mathematical practices. J. Stem Teach. Educ. 49:5.
Blankenship, S. S., and Ruona, W. E. (2007). “Professional learning communities and communities of practice: a comparison of models,” in Proceedings of the AHRD 2007 International Conference, ed. F. Nafukho (Indianapolis, IN: Academy of Human Resource Development), 888–895.
Bond, T. G., and Fox, C. M. (2015). Applying the Rasch model: Fundamental measurement in the human sciences, third edition. Mahwah NJ: Lawrence Erlbaum Associates.
Boone, W. J., Staver, J. R., and Yale, M. S. (2013). Rasch Analysis in the Human Sciences. Springer Science & Business Media.
Buck Institute for Education (2017). Available online at: https://www.bie.org/about/what_pbl
Burke, J. (2005). “The Employment department/training agency standards programme and NVQs: implications for education,” in Education and Training, ed. Competency Based (New York, NY: Routledge), 77–92. doi: 10.4324/9780203974261-13
National Governors Association Center for Best Practices and the Council of Chief State School Officers (2010). Common Core State Standards for Mathematics. Washington, DC: National Governors Association Center for Best Practices and the Council of Chief State School Officers.
Croft, A., Coggshall, J. G., Dolan, M., and Powers, E. (2010). Job-Embedded Professional Development: What It Is, Who Is Responsible, and How to Get It Done Well. Washington, DC: National Comprehensive Center for Teacher Quality.
Engelhard, G. Jr. (2013). Invariant measurement: Using Rasch models in the social, behavioral, and health sciences. New York, NY: Routledge.
English, L. D., and Gainsburg, J. (2016). “Problem Solving in a 21st-Century Mathematics Curriculum,” in Handbook of International Research in Mathematics Education, eds L. D. English and D. Kirshner (New York, NY: Taylor an Francis), 313–335. doi: 10.1007/978-1-4614-7366-4_16
Executive Office of the President (2010). Prepare and Inspire: K-12 Education in Science, Technology, Engineering and Mathematics (STEM) for America’s Future. Washington, D.C.: U.S. Government Printing Office.
Fulton, K., and Britton, T. (2011). STEM Teachers in Professional Learning Communities: From Good Teachers to Great Teaching. Oxford, OH: National Commission on Teaching and America’s Future.
Georgia Governor’s Office of Student Achievement. (2017). Applied Learning Student Questionaire (ALSQ). Atlanta, GA: Georgia Governor’s Office of Student Achievement.
Hernandez, P. R., Schultz, P., Estrada, M., Woodcock, A., and Chance, R. C. (2013). Sustaining optimal motivation: a longitudinal analysis of interventions to broaden participation of underrepresented students in STEM. J. Educ. Psychol. 105:89. doi: 10.1037/a0029691
Holland, J. H. (2014). Complexity: A Very Short Introduction. New York, NY: Oxford University Press.
Honey, M., Pearson, G., and Schweingruber, H. A. (2014). STEM Integration in K-12 Education: Status, Prospects, and an Agenda for Research, Vol. 500. Washington, DC: National Academies Press.
Householder, D. L., and Hailey, C. E. (2012). Incorporating Engineering Design Challenges Into Stem Courses. Washington, DC: ERIC Publications.
Huffman, J. B., Hipp, K. A., Pankake, A. M., and Moller, G. (2014). Professional learning communities: Leadership, purposeful decision making, and job-embedded staff development. J. Sch. Leadersh. 11, 448–463. doi: 10.1177/105268460101100504
IBM Corporation (2017). IBM SPSS Statistics for Windows, Version Q3 25.0. Armonk, NY: IBM Corporation.
Thomas, J. W. (2000). A Review of Research on Project-Based Learning. San Rafael, CA: The Autodesk Foundation.
Johnson, C. C., Peters-Burton, E. E., and Moore, T. J. (2015). STEM Roadmap: A Framework for Integration. London: Taylor and Francis.
Larson, K. (2001). Business Partnerships with Schools: Policy Guidelines for Schools Seeking to Establish and Maintain Productive and Ethical Relationships with Corporations. Policy Report. Washington, DC: ERIC Publications.
Linacre, J. M. (2002). What do infit and outfit, mean-square and standardized mean? Rasch Meas. Trans. 16:878.
Linacre, J. M. (2017b). Facets Computer Program for Many-Facet Rasch Measurement, Version 3.80. 0. Beaverton, OR.
Mayes, R., Forrester, J., Schuttlefield, C., Peterson, F., and Walker, R. (2014). Quantitative reasoning learning progression: the matrix. Numeracy 7:5.
Mayes, R., Rittschof, K., Martin, C., and Gallant, B. (2018). Real STEM: an interdisciplinary STEM program. J. Res. Stem Educ. 3, 1–16. doi: 10.51355/jstem.2017.26
National Research Council (2013). Monitoring Progress Toward Successful K-12 STEM Education: A Nation Advancing?. Washington, DC: National Academies Press.
Next Generation Science Standards Lead States (2013). Next Generation Science Standards: For States, by States. Washington, D.C: The National Academy Press.
President’s Council of Advisors on Science and Technology (2010). Prepare and Inspire: K-12 Education in Science, Technology, Engineering, and Math (STEM) for America’s Future: Executive Report. Washington, DC: Executive Office of the President, President’s Council of Advisors on Science and Technology.
Rasch, G. (1993). Probabilistic Models for Some Intelligence and Attainment Tests. Chicago, IL: MESA Press.
Reckase, M. D. (1979). Unifactor latent trait models applied to multifactor tests: results and implications. J. Educ. Stat. 4, 207–230. doi: 10.3102/10769986004003207
Reiser, B. (2006). “Making authentic practices accessible to learners: Design challenges and strategies,” in The Cambridge Handbook of the Learning Sciences, ed. R. Keith Sawyer (New York, NY: Cambridge University Press), 335–354. doi: 10.1017/cbo9780511816833.021
Saravia-Shore, M. (2008). “Diverse teaching strategies for diverse learners,” in Educating Everybody’s Children: Diverse Teaching Strategies for Diverse Learners, ed. R. W. Cole (. Alexandria: Association for Supervision & Curriculum Development), 41–97.
Savery, J. R. (2015). “Overview of problem-based learning: Definitions and distinctions,” in Essential Readings in Problem-based Learning: Exploring and Extending the Legacy of Howard S. Barrows, Vol. 9, eds A. Walker, H. Leary, and C. Hmelo-Silver (West Lafayette, IND: Purdue University Press), 5–15. doi: 10.2307/j.ctt6wq6fh.6
Schwarz, C. (2009). Developing preservice elementary teachers’ knowledge and practices through modeling−centered scientific inquiry. Sci. Educ. 93, 720–744. doi: 10.1002/sce.20324
Shaughnessy, J. M. (2013). Mathematics in a STEM context. Math. Teach. Middle Sch. 18, 324–324. doi: 10.5951/mathteacmiddscho.18.6.0324
Sobel, D., and Smith, G. A. (2010). Place-and Community-Based Education in Schools. Sociocultural, Political, and Historical Studies in Education. New York, NY: Routledge.
Stohlmann, M., Moore, T. J., and Roehrig, G. H. (2012). Considerations for teaching integrated STEM education. J. Precoll. Eng. Educ. Res. 2:4.
Strobel, J., and van Barneveld, J. (2009). When is PBL more effective? a meta-synthesis of meta-analyses comparing PBL to conventional classrooms. Interdiscip. J. Probl. Based Learn. 3, 44–58.
Tanenbaum, C. (2016). STEM 2026: A Vision for Innovation in STEM Education. Washington, DC: US Department of Education.
Vasquez, J. A., Sneider, C. I., and Comer, M. W. (2013). STEM Lesson Essentials, Grades 3-8: Integrating Science, Technology, Engineering, and Mathematics. Portsmouth, NH: Heinemann.
Wilensky, U., and Resnick, M. (1999). Thinking in levels: a dynamic systems approach to making sense of the world. J. Sci. Educ. Technol. 8, 3–19. doi: 10.4324/9781003013518-2
Wing, J. M. (2008). Computational thinking and thinking about computing. Philos. Trans. R. Soc. A Math. Phys. Eng. Sci. 366, 3717–3725.
Keywords: authentic teaching, collaboration, interdisciplinary STEM, reasoning, attitudes
Citation: Mayes R and Rittschof K (2021) Development of Interdisciplinary STEM Impact Measures of Student Attitudes and Reasoning. Front. Educ. 6:631684. doi: 10.3389/feduc.2021.631684
Received: 20 November 2020; Accepted: 09 March 2021;
Published: 21 April 2021.
Edited by:
Subramaniam Ramanathan, Nanyang Technological University, SingaporeReviewed by:
Allen Leung, Hong Kong Baptist University, Hong KongCopyright © 2021 Mayes and Rittschof. This is an open-access article distributed under the terms of the Creative Commons Attribution License (CC BY). The use, distribution or reproduction in other forums is permitted, provided the original author(s) and the copyright owner(s) are credited and that the original publication in this journal is cited, in accordance with accepted academic practice. No use, distribution or reproduction is permitted which does not comply with these terms.
*Correspondence: Robert Mayes, cm1heWVzQGdlb3JnaWFzb3V0aGVybi5lZHU=
Disclaimer: All claims expressed in this article are solely those of the authors and do not necessarily represent those of their affiliated organizations, or those of the publisher, the editors and the reviewers. Any product that may be evaluated in this article or claim that may be made by its manufacturer is not guaranteed or endorsed by the publisher.
Research integrity at Frontiers
Learn more about the work of our research integrity team to safeguard the quality of each article we publish.