 Ricky Lowes
- Plymouth Business School, University of Plymouth, Plymouth, United Kingdom
Recent decades have seen increased concern for the student experience by higher education institutions, along with more pressure on students due to the highly competitive job market and the financial implications of doing a degree. The growth in the number of non-traditional students attending higher education has added to pressures on students and staff. There are impacts on the mental health and well-being of both as university education becomes massified, commodified and increasingly time-pressured. In this context, informed and kindly human interaction is crucial to mitigate negative influences. However, staff are less likely than ever to know their students well enough to have meaningful and impactful exchanges. Student record systems and learning analytics present themselves as a promising tool to be used in finding solutions to the complex problems of student achievement and well-being. This conceptual paper explores the use of big data and learning analytics to facilitate the work of personal tutors (academic advisors), illustrated by practical examples from the Student Support System used at the University of Plymouth. It will argue that learning analytics systems have the potential to facilitate communication and sharing of information, and thus enhance the quality of communication between personal tutors and their tutees to improve student engagement and support the tutee. However, the major contention of the paper is that information requires the lens of a humanistic framework in order to be transformed into knowledge and insight. The heuristic of the Johari Window is presented as a possible tool to stimulate thinking and to integrate the information from learning analytics into a meaningful framework in order to develop a powerful way of knowing tutees better and thus creating more supportive relationships with them. As such, the paper proposes an original contribution to the underexplored field of the use of learning analytics in personal tutoring in the UK, and hopes to stimulate empirical research in this area.
Introduction
Learning analytics is emblematic of the new holistic approaches to student retention and is likely to have profound implications for personal tutoring. (Webb et al., 2017, p. 6)
Recent decades have seen increased concern for the student experience by higher education institutions (HEIs) in England, Wales and Northern Ireland since the introduction of fees in 1998 and then their increase to £9,000 in 2012 (from 2017 rising with inflation). At the same time, there has been growing pressure on students due to the highly competitive job market and increased financial implications of taking a degree course (Brown, 2016). There was a decline in student satisfaction with their course 2012–2017 and, while rates are starting to recover, only 41% consider their course good or very good value for money, which drops to 38% for post-92 universities (Neves and Hillman, 2019). The widening participation agenda has meant an increase in the number of non-traditional students such as working students, students with parental responsibilities or first generation to attend higher education, who often face greater stress than students with fewer responsibilities or a family tradition of university education. This combination of pressures on students (and staff) may in part explain the growth in mental health issues and low levels of well-being currently reported (Bentley, 2016a,b; Brown, 2016; Yeung et al., 2016; Clarke et al., 2018; Hughes et al., 2018; Morrish, 2019; Neves and Hillman, 2019). Across the sector, this issue is causing concern and institutions are developing prevention strategies (Universities UK, 2017; Clarke et al., 2018).
In a massified higher education context, large classes and heavy teaching and marking loads mean that staff are less likely to know individual students—even their personal tutees—well enough to have meaningful relationships. Around a third of students feel there is too little interaction with staff (Neves and Hillman, 2019). There is a need to mitigate the effects of this pressurized situation and to supplement lack of knowledge about tutees by access to detailed and relevant information about the student from university systems that draw on large stores of data.
While reviewing agreements with the Office of Fair Access Hipkin noted two trends: one for developing or resurrecting personal tutoring policies (Hipkin, 2016a), and the other was the setting up of data driven dashboards for displaying learning analytics to academic staff and students (Hipkin, 2016b, 2017). These two trends, he felt, had potentially a very powerful synergy: “The new world of ‘data everywhere' opens up a potential game-changing opportunity to reinvent the role of academic advisor” (Hipkin, 2016b, p. 6). While there is as yet little published on the relationship between analytics and personal tutoring, Nottingham Trent University (NTU) reports that its dashboard has facilitated more effective personal tutoring (Sclater et al., 2016), and Grey et al. (2017) note an emerging trend to encourage tutors to make use of these systems. So, it would seem that the combination of personal tutoring and learning analytics presents itself as a potential solution to the problem of the pressures experienced in what has become a very high stakes environment for all, with a need for supportive and targeted interventions to support student well-being and achievement.
This paper aims to stimulate discussion by briefly exploring recent developments in the use of learning analytics in UK higher education institutions and considering their potential and their limitations. Access to data and learning analytics has great potential to have a positive effect on personal tutoring—with the proviso that this is interpreted through the lens of human understanding, that there is consideration of the “promises and pitfalls” of big data (Dede et al., 2016, elaborated on by Roberts et al., 2016), and that the former are exploited and the latter avoided. The key argument is that to lead to actionable insights, data needs to be moved up the value chain. The Johari Window will be presented as a useful heuristic for achieving this, illustrating its potential for use in personal tutoring with examples using features of the Student Support System used across all faculties at the University of Plymouth to show how it can provide a framework to explore the hinterland beyond the dashboards, but, first, the use of analytics will briefly be explored.
The Development if Analytics in Higher Education
Data collection and analysis has long been employed in the business context, and the use of analytics for motivation and self-monitoring in sport and recreation, with applications like Map My Run, is well-known. However, higher education as a sector is only recently catching up with the data revolution, in an effort to retain competitive advantage (Sclater et al., 2016; Shacklock, 2016). The Higher Education Commission in the report “From Bricks to Clicks” emphasized the potential of data collection and analysis to enhance support for students by tailoring it to the individual (Shacklock, 2016, p. 4), as long as certain conditions are met and a range of issues, such as data use and management, and staff training, are carefully considered. The commission strongly recommends that all universities should implement learning analytics systems and JISC has set up a ground-breaking large data warehousing project to support this (JISC, n.d.). JISC makes the bold claim that “learning analytics can help to improve the quality of teaching, cut drop-out rates, build better relationships between students and staff and empower students to take ownership of their learning” (Feldman, 2016).
Examples of Analytics Systems
Greenwich University's staff dashboard is described as a “Tutee on a page concept” for staff, delivered through the SRS Self-Service system with simplified access to: demographic information; course, module, and administrative information; grades and transcript data; UCAS personal statement; meeting scheduling; and comments/notes (University of Greenwich, 2016). Participation data is only accessible to personal tutors and is there to “act as a conversation starter between tutor and student.” It was reported that students were positive about the system (University of Greenwich, 2016).
De Montfort uses MyProgress, a student facing system, which Brooks and Moriarty describe as “an analytical tool to help understand student engagement within a course of study” (Brooks and Moriarty, 2015). The motivation for its development was as “A catalyst to improve student retention and progression” and reflected a desire by the university to improve the effectiveness of the personal tutoring system. The tool captures student engagement by measuring access to the library and library resources; use of BlackBoard (assignment submissions, module information, learning resources); printing, copying, and building entrances. It is highly visual in the way it presents the data to the student. Unlike Greenwich, where students were enthusiastic about the project, Brooks and Moriarty reported that some students perceived it negatively as a “big brother” approach.
Similarly, the Nottingham Trent University (NTU) Student Dashboard presents data to students on their library use, use of online learning environment, card swipes into university buildings attendance data, e-book usage, and course work submission to provide an overall engagement score. It provides information to staff such as the previous day's engagement rating, notes and alerts in addition to basic data on the student such as name, course etc. (Nottingham Trent University, 2018). These measures are presented as an engagement rating compared with peers. The handbook informs students about the likely relationship of their engagement score with their final achievement:
At NTU we have gathered strong evidence that a higher engagement level results in higher academic success. In 2013–14, 81% of final year students with a high average engagement rating achieved a 2:1 or 1 s, compared to only 42% of students with a low average engagement (Nottingham Trent University, 2016, p. 3).
Rather like De Monfort, the NTU dashboard seems to be oriented toward using data to influence students. Lawther et al. (2016) carried out a survey which indicated that the use of the dashboard has fostered positive student behaviors shown to be predictors of student success, such as a higher level of engagement with learning resources and better attendance.
The Student Support System
The University of Plymouth uses the Student Support System (S3), a mainly staff-facing dashboard designed with the aim of providing access to frequently needed (but often difficult to find/produce) reports, metrics and data. It supports academics in managing personal tutoring, supporting students, management reporting, and a number of other activities at different levels. It is unusual, in that it was a grassroots initiative, which arose directly from the perceived needs of academics in one department. The system has developed via the creator responding to feedback from users and bringing in new features in a timely and responsive manner, as required, and so has benefitted from years of user-informed, organic development. It is now used across the university and a revised version (S4) will be in place by the start of the 2020–21 academic year.
A simple interface provides access to a number of useful functions that allow staff to access information at programme and module level, as well as via the individual Student Record Card, which contains course information, attendance data, submission details, and marks. Staff can communicate with students (via email, recorded on the Record Card) and colleagues (via notes on the Student Record Card and email). The student version provides less detail in fewer fields, but is still a handy summary of the most important information a student needs to know about their course. It does not include peer comparison metrics.
For a detailed description of the Student Record Card and how S3 supports personal tutoring, see Figures A1, A2.
Whose System?
The Higher Education Commission includes a recommendation that: “HEIs should ensure that the digital agenda is being led at an appropriate level within their institution” (Shacklock, 2016, p. 8). It might be interesting to consider creatively both what is meant by “led” and “appropriate level” in order to produce a system that is really responsive to the needs of users. User engagement with any system proposed is a key factor in success. The opportunity to influence the development of the system may lead to a genuine level of buy-in from staff and greater engagement with the system. A central underpinning principle of Plymouth's S3 is that learning analytics systems should be for the benefit of the end users. Its strapline is: “Providing the right information, to the right people, in the right way, in a single location” and its development has been driven by user feedback and requests. Roberts et al. (2016) also recommend that students' views be considered in the design of learning analytics systems and both staff and student focus groups informed the development of S4.
Knowing Too Much?
As mentioned above, Roberts et al. (2016) explored students' views of their data being harvested, stored and analyzed and found they expressed some misgivings. While they saw potential benefits for personal tutoring, they also felt that access to their data could lead to assumptions being made about them, and them being labeled. Students are often surprised, and sometimes disconcerted when they realize their tutor has access to such things as their marks or the timestamp of their assignment hand-in. With that in mind, tutors must remember to make thoughtful and sensitive interpretations of the data they have access to.
The Value of Data
However, at this point it is necessary to insert a caveat: it is important to distinguish between the information captured by analytics systems (attendance data, access to resources, marks) and the behavior they are taken as a proxy for (personal engagement, study habits, learning). Dowland (2014, p. 1) pointed out “student analytics typically draws on data that is easy to measure and capture, and ignores information that is intangible,” a point echoed by a number of practitioners and researchers who question the validity of proffered proxies of behavior (Stein, 2016; Grey et al., 2017). Hipkin (2016b, 2017) warns against being drawn into a “digital illusion” and states that we will create a system doomed to failure if we separate the data easily available from learning analytics from that which may be more difficult to access—and which perhaps cannot be accessed digitally. Grey et al. (2017) point out that analytics systems and dashboards are only a tool to be used rather than a definitive solution to problems with engagement and retention, affirming that “Data is meaningless, information is valuable.” Clow (2012, p. 135) emphasizes that ‘the learning analytics cycle is not complete cycle is not complete until these metrics are used to drive one or more interventions that have some effect on learners'.
Moving Along the Value Chain
The value of learning analytics is in the interventions they facilitate. There is a value chain between data and action that rises with each step: data must be transformed into information; information to knowledge; knowledge to insight; and insight into action (Figure 1). Clearly, context will be a crucial variable, and context may be composed of factors which are internal or external to the student. Data is an excellent raw ingredient, but it requires the correct balance of elements, cooked in the right way, and then selected and served up at the right time to the right people to be nutritious and digestible.
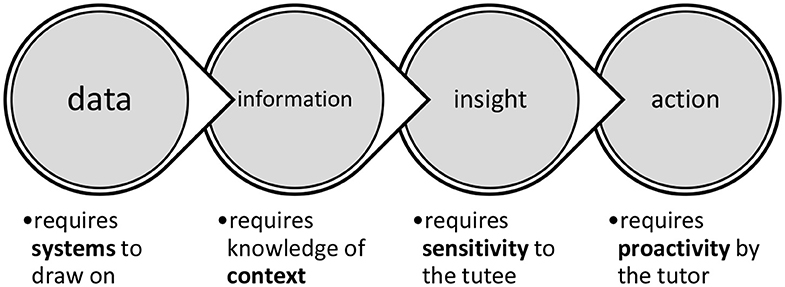
Figure 1. Moving along the value chain.
In short, it is important to use technology, but also to remain mindful of the need to draw on other sources of information and to maintain human curiosity about the data presented and what it might signify in personal terms.
Analytics and Personal Tutoring
Studies on the uses of analytics to support personal tutoring are remarkable by their absence, although tutoring is occasionally referred to in passing in general studies on the uses of big data in teaching and learning, and it is included by Ahern (2018) who examines the potential of learning analytics as a tool to support student well-being. It was mentioned in the HEA review of studies on interventions relating to access, retention attainment and progression (Webb et al., 2017) presenting recommendations of what educators could do, which included interventions relevant to personal tutoring. They suggest that tutors consider how they can draw on information from data systems to enhance their tutoring practices. However, the review also highlighted the need to understand “the social and emotional landscape of students” in order make interventions sensitive and meaningful (Webb et al., 2017, p. 8).
One practical discussion of how dashboard-based analytics can support effective tutoring is Lochtie et al.'s (2018, pp. 92–97) useful and succinct overview, which contains practical suggestions and invites readers to consider the opportunities these systems offer and their limitations. If data from learning analytics can provide information to tutors, as a first step toward allowing them to deepen their understanding of their tutees, then it may lead to effective interventions. However, for this to be the case, the data has to be interpreted and applied within a meaningful framework. One possible example of such a framework will be explored below, but first it is useful to further consider the motivation for harnessing data.
What Are we Using the Data For?
Any learning analytics solution is only as good as the action it prompts. (Lawther et al., 2016, p. 21)
For personal tutors it is hard to overstate the importance of information on students being easily accessible and in one place as a prerequisite to allow them to work more effectively with their tutees. However, there may be a variety of agendas around retention and achievement affecting what is done with student data and how it is presented (Dede et al., 2016; Roberts et al., 2016). The presentation of student data in dashboards or other such pages may reflect different slants on supporting student achievement. This begs certain questions. What information is presented, in how much detail and to who? What is the underlying motivation for presenting this data—informing or influencing? What effect does this have: Does the scrutiny of actions and presentation of data foster in students a healthy desire to improve or provoke an unhealthy anxiety that one's actions are being monitored and compared? Finally, we must consider: how is data transformed into information, and then how is that information transformed into knowledge, insight and action?
Ahern (2018) contends that data from learning analytics can be used to monitor student well-being and create more effective support systems, with the opportunity for proactive interventions at an earlier stage before problems escalate. She notes that little research has been carried out on the effectiveness of learning analytics, recognizes that data require sensitive interpretation, and acknowledges the ethical issues, a point emphasized by Roberts et al. (2016), whose research indicates that students do not regard the collection and display of their data as an unmitigated benefit, raising issues such as the potential for prejudgement and bias, invasion of privacy, the undermining of independence and creation of stress.
A JISC report claims that in general, most students perceive analytics positively (Sclater et al., 2016). However, Hipkin (2016b) is skeptical about the “unqualified good of dashboards” and warns against a simplistic view of the value of data, reminding us that “trying to create a predictive algorithm for an individual student from datasets alone will prove elusive.” With this in mind, the focus will be on how the information and functionality of a learning analytics can assist staff in providing an effective personal tutoring experience, using the functionality of a system used at the University of Plymouth. At this point, it is useful to pause and examine a framework for making the most of this information to enhance personal tutoring and to stimulate movement along the value chain.
The Johari Window
The Johari Window is a useful heuristic for understanding and developing aspects of interpersonal communication. Cipriani (2004) describes it as “a disclosure/feedback model of self-awareness, an information processing tool.” Since Luft's original article on the Window was published in 1961, it has been interpreted in many ways and adapted to various uses.
The Johari Window is a quadrant, described by Luft as “A graphic model of awareness in interpersonal relations” (Luft, 1961). It focuses on knowledge about a person (or group of people) with two dimensions: self and other, and two values: known and not known. This results in four different quadrants within the larger quadrant, as can been seen below. Each quadrant has a name reflecting the dimensions and values (Figure 2).
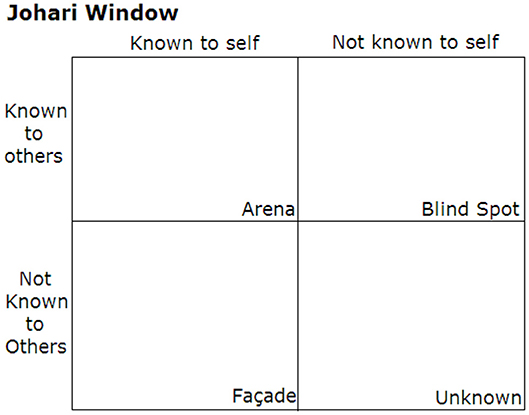
Figure 2. Johari Window.
Information that is known by both the self and others will be in the Arena, the open area. Information which is known by the self and but not by others will be in the hidden area, often known as the Façade. Information that is known to others, but not the self, is in the Blind Spot and the Unknown area contains information which is known neither to the self nor others, and which may, ultimately, be unknowable.
The four areas are not in fact equal sizes as depicted in the diagram, but will vary dynamically over time. A healthy and positive interpersonal relationship requires a large area of shared knowledge (Arena). The Arena will expand as other areas decrease in size: for example, the Blind Spot may decrease by others giving feedback on things that a person is not aware of and the Facade will decrease through disclosure of that which was hidden or private. Information in the Unknown area requires some sort of revelation, and will only be discovered via new insights or experiences.
The Window is presented as four distinct quadrants, but it may be helpful to view the divisions not as clear-cut separations but rather as blurred lines. It may be difficult to decide when something is Unknown or simply hidden behind the Façade, and it may have qualities of each. Something in the Blind Spot actually may be a latent but ill-formed intuition in the person's mind and so is half-way into the Arena. The content viewed through the Window is not fixed but fluid.
There is a limited number of studies relating to the Johari Window. A number of different disciples, such as nursing, business, education, and psychology, have published accounts of how the tool has been applied to their area without providing evidence of its effect. Few scholars have used it as the conceptual basis for empirical research, exceptions being Boxer et al. (2013) who used it to examine perceptions among members of a management team; Gallrein et al. (2013) who looked at self and others' attribution of personality traits and Shenton (2007) who examined information needs using the Johari Window framework. Hamzah et al. (2016) used the Window as the basis for a conceptualization of Customer Knowledge. The Johari window has also been applied to analyzing organizational behavior (Hase et al., 1999) and general communication issues (Horine, 1990; Cassidy, 2014). Other articles mentioning the Johari window are mainly examples of and proposals for practical application of the framework for self-development and training purposes. A number of papers on nursing education propose it as a helpful tool in developing self-awareness (Jack and Smith, 2007; South, 2007; Verklan, 2007; Jack and Miller, 2008).
The various studies show that the Johari Window seems to act as an effective device to allow a deeper exploration of a range of issues and situations. Shenton (2007) states that it can “represent existing well-recognized phenomena within a logical structure.” It can also bring clarity and a sharper focus to fuzzy or ill-organized phenomena by situating them within a logical structure that provides the user with a supportive template for thought and action.
Surprisingly, there appear to be no studies on the use of this tool in relation to personal tutoring.
How Can the Johari Window Help With Tutoring?
A common complaint from students is that their tutor does not really know them. One student in an anonymous feedback survey described it as “impersonal tutoring”! Equally, staff realize that as a tutor it is difficult to know tutees well with only sporadic contact: “And if you want to ‘reach' their behavior, earn their trust or even influence their development truly, that is not possible if the contact is only incidental” (Schut, 2017). Another issue is that not every student needs the same amount of time, attention or help, and some forewarning of whether a tutee may need more help and attention would be useful preparation for an effective tutorial. There is clearly a need for a shortcut to information that is contextual and helpful.
The systems that universities use to capture and present data on students, both static (e.g., pre-entry qualifications) and fluid (e.g., attendance data) can provide a wealth of information on students. The framework of the Johari window can help to raise awareness of how much tutors (do not) know about their tutees and suggest strategies for transforming the information provided into knowledge and insight, in order to know tutees better and hence to build a better relationship. A tutor's awareness of their tutee's capabilities, interests and needs will clearly underpin their ability to support their tutee's development, and is an important part of their competence in their role.
The diagram below represents a meeting with a new tutee. The shared area of knowledge is small, as the tutor may know very little more than the student's name and course (Figure 3).
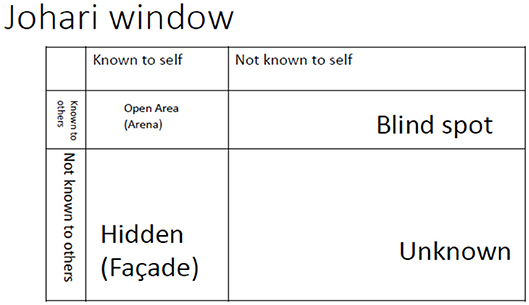
Figure 3. Johari Window for a new tutee.
Access to a well thought-out and well-organized student record system or dashboard can already enhance this knowledge by providing extra details, and a dynamic system will accrue information as the course progresses, including information input by the tutor and other members of staff, or, potentially, the student themselves if the system allows. More importantly, the information on the system can also provide an important starting point for a conversation that will increase and enrich the shared knowledge for the benefit of the student's personal and academic development. In this, the Johari window offers a constructive guiding framework. The following section will discuss how the system used at one university can provide information that, viewed through this framework, is the starting point for productive conversations.
Combining Data and the Johari Window to Enhance Tutoring
Each of the quadrants in the Johari Window can be informed by access to data.
Arena
The area of shared knowledge in the Arena can be informed by data on the course and modules studied; previous studies at partner colleges or on other courses; marks, including breakdown of marks within modules; assessment deadlines; time stamp of assignment submissions; Disability Assist Statements (e.g., evaluation reports for “reasonable adjustments”); emails sent by module tutors; notes recorded by staff; and attendance data. These can illustrate student progress and indicate areas of achievement or concern. This information can also be used to instigate pro-active advising: e.g., being able to access a student's coursework deadlines and spotting clusters may offer an opportunity to ascertain the tutee's time management skills and offer advice if appropriate. Where a dashboard is integrated with the Virtual Learning Environment, it may be possible to spot engagement patterns which offer insight how the tutee is managing their studies. Crucially, the information can pave the way for conversations that may reduce the Blind Spot or the Façade (Figure 4).
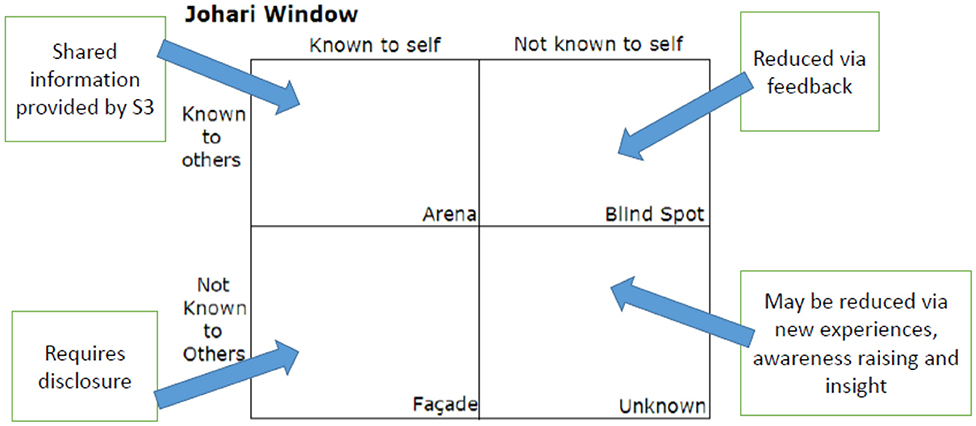
Figure 4. Johari Window and personal tutoring.
Blind Spot
Access to course-marks, and especially to the marks breakdown among different elements of assessment, such as group work presentations, essays, exams etc. opens the way for conversations about how the student is doing academically and what may be helping or hindering their development. If the student is willing, and feedback on work is accessible, then the tutor can help the student to get insight into strengths and weaknesses in various aspects of their work that may not be clear to them. Other information on the system can point out things a student was overlooking: for example, communications that they may have missed are recorded on the system and can be pointed out to them, which may make them more aware that they should develop a professional approach to checking email. A tendency to last minute submissions, recorded in the timestamp, may point to a weakness in time-management that the tutee had not considered. The Blind Spot does not, however, contain only negatives or weaknesses; there may be strengths and qualities that an individual may be unaware of until others reflect these back to them. The tutor can then signpost further support and opportunities.
Questions that can be asked:
• Did you Realize that several tutors have emailed you about your engagement?
• Did you know your attendance is below average for the module?
• I see you have done exceptionally well in your (Operations Management) module, particularly the presentation. What do you think allowed you to achieve that mark?
• You have done less well in the last assignment. What feedback did you get? Can you pull out any development points?
Façade
As information provided by the system and other issues are discussed, there are opportunities for students to disclose concerns, areas of weakness, or circumstances that are affecting their studies. A pattern of poor performance in assessment may be due to exam phobia, undiagnosed dyslexia or a fear of speaking in front of an audience. Behind poor attendance may lie a family problem, health issues, or a financial crisis. A Disability Assist Statement indicates an area that may require special support, or at least understanding. These kinds of things are possible starting points for questions or comments which invite, but do not demand, disclosure. Disclosure about strengths and interests can also be invited.
Questions that can be asked:
• I notice you usually miss Friday lectures—is something affecting your attendance?
• I see a Disability Assist Statement has just been added to your record card. Is there any support you might need?
• Are there assessment types that are easier or harder for you?
• You have done exceptionally well in modules relating to (Finance)—do you have a background in this?
Unknown
This area holds by definition things that are unknown about the person. They may be potentialities, both positive and negative. In the context of tutoring, it is useful to think of them as qualities and competences that are as yet undiscovered. New experiences and opportunities may lead to the discovery of talents and aptitudes that were previously unrealized. For example, a student who had never previously mixed with international students discovered an interest in other cultures by doing an extracurricular course in global citizenship and consequently started volunteering at a charity for resettling refugees. One of the key roles of a tutor is to signpost opportunities that lead the student to discover more about themselves and to develop new capabilities.
Questions that can be asked:
• Do you have any work experience? Are there any opportunities you might consider?
• Have you seen (e.g., of extracurricular opportunity)—do you think this might interest you?
• Have you visited the (Careers and Employability) Services for a (careers counseling) session?
• Are there any areas of skills or competencies that you might like to develop?
Finally, the areas of the window may be resized due to the movement of information. In Figure 5 below, we can see how shared knowledge has grown.
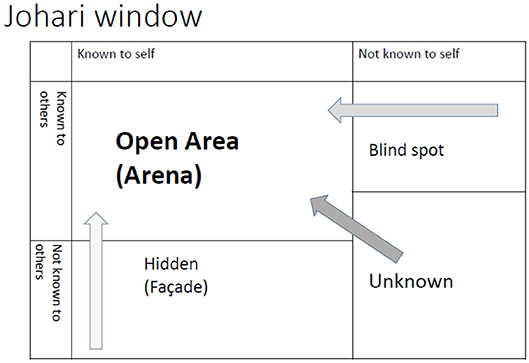
Figure 5. Johari Window with enlarged Arena.
Knowing You
The Johari window can also act as a framework for the tutor to evaluate how well they know a tutee. How big is the Arena for that tutee? Is there much that the tutor simply does not know because it remains hidden behind the Facade? Have we seen the tutee grow in self-awareness and skill as the Blind Spot becomes smaller? Have any discoveries opened up the Unknown area? The success of tutorials might be measured by whether and how the boundaries between the areas in the Johari Window have shifted.
An example from my personal experience shows how boundaries shifted by following up data on module choices: questions about these choices revealed in one student a fear of exams (she had avoided any module with assessment by examination), while another shared an ambition to become an entrepreneur. The first student then declined the opportunity to access support but decided to self-manage, while the second was signposted to a start-up mentoring programme run by the university. Basic personal information may potentially reveal a great deal if pertinent questions are asked. One student gave the same home and term time address in their contact information. When I queried this as an error, I discovered that the student was estranged from his family, had come out of care, and had no other home than his current lodgings. He confided that he was working 30 h a week to support himself. Naturally, this gave me considerably more insight into my tutee and his personal situation, a topic that might otherwise never have been broached.
As tutors, we can consider for each of our tutees how much knowledge is in the Arena and how we might draw back the curtains on the other areas. If each tutorial encounter is a small step toward greater knowledge of tutees, fast-forwarded by thoughtful interrogation of the data, then there is the chance we may create relationships that are more meaningful and effective.
Conclusion and Recommendations
Hipkin (2016b) contends that learning analytics offer a potential solution to the difficulties tutors face in providing effective support, while warning us that it is crucial to embed the information presented by learning analytics into a person-centered system of tutoring which draws on other sources of information. The heuristic of the Johari Window has been presented as a possible tool to stimulate thinking and to integrate the information from learning analytics into a meaningful framework in order to develop a powerful way of knowing our tutees better, to move us along the value chain and thus create more supportive relationships.
The scope of the present paper is limited to an exploration of ideas, grounded in the literature, and personal experience. A useful development would be to carry out research on the Johari Window (and other heuristics), to provide an evidence base for their use. While the personal tutoring relationship is a private area, which does not lend itself easily to research, it would be possible and useful to carry out a tutor and/or student evaluation of the helpfulness of heuristic tools. Do they support a way of thinking that allows a richer use of the information provided by analytics? Does such a heuristic provide support for tutors new to the role who may benefit from a mental framework to organize their knowledge of their tutees and to suggest areas for exploration? Could these approaches have a positive influence on learning, persistence, belonging, retention, and completion? Most importantly for a research agenda: how can such things be measured?
The question of what supports, nurtures, and influences relationships is an important one and should not be shied away from because it is difficult to analyze. The interaction of the quantitative data produced by analytics and the qualitative aspects of human insight and understanding has the potential to bring about a sea change in personal tutoring. This is an opportunity that we must not fail to understand and to grasp.
A study on the effect of the Johari Window, focusing on tutors, is currently underway to gather empirical data. I welcome expressions of interest in collaborating in the study.
In the meantime, it is worth us experimenting with this, and other heuristics, to deepen the relationship with our tutees and to exploit more fully the information provided by learning analytics. In the absence of rich data and supportive frameworks to maximize the effectiveness of tutorial meetings, these relationships will be condemned to subsist in the shallow soil of limited time and information.
Ricky Lowes is Senior Personal Tutor in the Plymouth Business School, and Vice-Chair of the UKAT Research Committee. Any correspondence on readers' experience of using the Johari Window or other such thinking tools for personal tutoring is warmly welcomed.
Author's Note
This is an original article where I offer insights into and a new perspective on the emerging field of learning analytics in relation to personal tutoring. This is significant because we have reached a critical moment in terms of student support and in the development of technologies to harness and present data, but there is scant mention in academic literature of the potential synergies between these two areas. The critical question is how to engage with data in a thoughtful and effective way. The framework I explore offers a way of doing this. Many practitioners will find the article relevant, and I hope stimulating, as it proposes practical strategies based on a theoretical framework to resolve the perennial problem of how to be effective in personal tutoring.
Author Contributions
The author confirms being the sole contributor of this work and has approved it for publication.
Conflict of Interest
The author declares that the research was conducted in the absence of any commercial or financial relationships that could be construed as a potential conflict of interest.
Acknowledgments
Many thanks to Emily McIntosh, Wendy Troxel, Oli Webb, Bonnie Latimer, and Richard Saundry for their helpful comments on drafts of this article.
References
Ahern, S. (2018). The potential and pitfalls of learning analytics as a tool for supporting student wellbeing. J. Learn. Teach. High. Educ. 1, 165–172. doi: 10.29311/jlthe.v1i2.2812
Bentley, A. (2016a). Student Counselling and Personal Development Annual Report. Plymouth: University of Plymouth.
Boxer, R., Perren, L., and Berry, A. (2013). SME top management team and nonexecutive director cohesion. J. Small Bus. Enterp. Dev. 20, 55–79. doi: 10.1108/14626001311298411
Brooks, N., and Moriarty, A. (2015). Using Learning Analytics to Support Personal Tutoring at DMU. Leicester: De Montfort University.
Brown, P. (2016). The Invisible Problem: Improving Students' Mental Health. HEPI Report 88, Oxford: Higher Education Policy Institute.
Cassidy, T. M. (2014). “Opening the window to lifelong learning: Applying the Johari Window framework in engineering communication curriculum,” in 2014 IEEE International Professional Communication Conference (Pittsburgh, PA). doi: 10.1109/IPCC.2014.7020391
Cipriani, J. (2004). Johari Window. Adapted by Julia Cipriani with permission from the author, Alan Chapman. Available online at: http://www.richerexperiences.com/wp-content/uploads/2014/02/Johari-Window.pdf
Clow, D. (2012). “The learning analytics cycle: closing the loop effectively,” in Proceedings of the 2nd International Conference on Learning Analytics and Knowledge - LAK '12 (New York, NY), 134–138. doi: 10.1145/2330601.2330636
Dede, C., Ho, A., and Mitros, P. (2016). Big data analysis in higher education: promises and pitfalls. Educause Rev. 51, 22–34. Available online at: https://er.educause.edu/articles/2016/8/big-data-analysis-in-higher-education-promises-and-pitfalls
Dowland, P. (2014). Analytics ‘helps engage students'. University World News. Available online at: http://www.universityworldnews.com/article.php?story=2014060508021340
Feldman, P. (2016). Jisc Response to the Higher Education Commission report ‘From Bricks to Clicks'. Available online at: https://www.jisc.ac.uk/news/jisc-response-to-the-higher-education-commission-report-from-bricks-to-clicks-22-jan-2016
Gallrein, A.-M., Carlson, E. N., Holstein, M., and Leising, D. (2013). You spy with your little eye: people are “blind” to some of the ways in which they are consensually seen by others. J. Res. Pers. 47, 464–471. doi: 10.1016/j.jrp.2013.04.001
Grey, D., McIntosh, E., and Stylianoudaki, P. (2017). Student dashboards - the case for building communities of practice. Presentation at the 2nd UKAT National Conference, Leeds: Leeds Trinity University.
Hamzah, M. I., Othman, A. K., Hassan, F., Razak, N. A., and Yunus, N. A. M. (2016). Conceptualizing a schematic grid view of customer knowledge from the johari window's perspective. Proc. Econ. Finance 37, 471–479. doi: 10.1016/S2212-5671(16)30154-X
Hase, S., Davies, A., and Dick, B. (1999). The Johari Window and the Dark Side of Organisations. Southern Cross University. Available online at: https://www.researchgate.net/publication/37358840_The_Johari_Window_and_the_dark_side_of_organisations
Hipkin, B. (2016a). What Happens When the Dial Turns Red? Efficiency Exchange. Available online at: http://www.efficiencyexchange.ac.uk/9984/happens-dial-turns-red/
Hipkin, B. (2016b). Student Support in a New Era. Graduate Market Trends Summer 2016. Available online at: https://www.hecsu.ac.uk/assets/assets/documents/gmt_29.7.16.pdf
Hipkin, B. (2017). Re: Personal tutoring chat on European First Year Experience Network Discussion List EFYEN@jiscmail.ac.uk 3 March 2017 15:41.
Horine, L. (1990). The Johari window–solving sport management communication problems. J. Phys. Educ. Recreation Dance. 61:6.
Hughes, G., Panjwani, M., Tulcidas, P., and Byrom, N. (2018). Student Mental Health: The Role and Experiences of Academics. Oxford: Student Minds.
Jack, K., and Miller, J. (2008). Exploring self-awareness in mental health practice. Mental Health Pract. 12, 31–35. doi: 10.7748/mhp2008.11.12.3.31.c6803
Jack, K., and Smith, A. (2007). Promoting self-awareness in nurses to improve nursing practice. Nurs. Stand. 21, 47–52. doi: 10.7748/ns2007.04.21.32.47.c4497
JISC (n.d.). Business Intelligence Project. A Joint Project Between Jisc the Higher Education Statistics Agency (HESA) to Develop a Business Intelligence Shared Service for UK Education. Available online at: https://www.jisc.ac.uk/rd/projects/business-intelligence-project
Lawther, S., Foster, E., Mutton, J., and Kerrigan, M. (2016). “Can the use of learning analytics encourage positive student behaviour”, in Student Behaviour and Positive Learning Cultures, eds. G. Janes, D. Nutt, and P. Taylor (London: SEDA), 17–21.
Lochtie, D., McIntosh, E., Stork, A., and Walker, B. (2018). Effective Personal Tutoring in Higher Education. Northwich: Critical Publishing
Luft, J. (1961). The Johari Window: A graphic model of awareness in interpersonal relations. Hum. Relat. Train. News. 5, 6–7.
Morrish, L. (2019). Pressure Vessels: The Epidemic of Poor Mental Health Among Higher Education Staff . HEPI Occasional Paper Number 20. Oxford: HEPI.
Neves, J., and Hillman, N. (2019). Student Academic Experience Survey 2019. HEPI. Available online at: https://www.hepi.ac.uk/wp-content/uploads/2019/06/Student-Academic-Experience-Survey-2019.pdf
Nottingham Trent University (2016). NTU Student Dashboard: A Guide for Students. Available online at: https://www4.ntu.ac.uk/current_students/document_uploads/189168.pdf
Nottingham Trent University (2018). The NTU student dashboard. Staff user guide. Available online at: https://www4.ntu.ac.uk/adq/document_uploads/running_a_course/164304.pdf
Roberts, L. D., Howell, J. A., Seaman, K., and Gibson, D. C. (2016). Student attitudes toward learning analytics in higher education: “The fitbit version of the learning world”. Front. Psychol. 7:1959. doi: 10.3389/fpsyg.2016.01959
Schut, S. H. A. (2017). Re: Personal tutoring chat on European First Year Experience Network Discussion List EFYEN@jiscmail.ac.uk 17 January 2017 16:33.
Sclater, N., Peasgood, A., and Mullan, J. (2016). Learning Analytics in Higher Education. Bristol: JISC
Shacklock, X. (2016). From Bricks to Clicks: The Potential of Data and Analytics in Higher Education. London: Higher Education Commission
Shenton, K. (2007). Viewing information needs through a johari window. Ref. Serv. Rev. 35, 487–496. doi: 10.1108/00907320710774337
South, B. (2007). Combining mandala and the johari window: an exercise in self-awareness. Teach. Learn. Nurs. 2, 8–11. doi: 10.1016/j.teln.2006.10.001
Stein, B. (2016). “Beyond the dashboard: the practical application of analytics,” in UKAT 2nd Conference (Leeds).
Universities UK (2017). Step Change: Mental Health in Higher Education. Available online at: https://www.universitiesuk.ac.uk/stepchange
University of Greenwich (2016). A Toe in the Water. Available online at: https://blogs.ncl.ac.uk/ltdev/2016/04/20/ucisa-learning-analytics-conference/
Verklan, M. T. (2007). Johari window: a model for communicating to each other. J. Perinat. Neonat. Nurs. 21. 173–174. doi: 10.1097/01.JPN.0000270636.34982.c8
Webb, O., Wyness, L., and Cotton, D. (2017). Enhancing Access, Retention, Attainment and Progression in Higher Education: A Review of the Literature Showing Demonstrable Impact. Higher Education Authority. Available online at: https://www.heacademy.ac.uk/system/files/resources/enhancing_access_retention_attainment_and_progression_in_higher_education_1.pdf
Yeung, P., Weale, S., and Perradin, F. (2016). University mental health services face strain as demand rises 50%. The Guardian. Available online at: https://www.theguardian.com/education/2016/sep/23/university-mental-health-services-face-strain-as-demand-rises-50 (accessed September 23, 2016)
Appendix
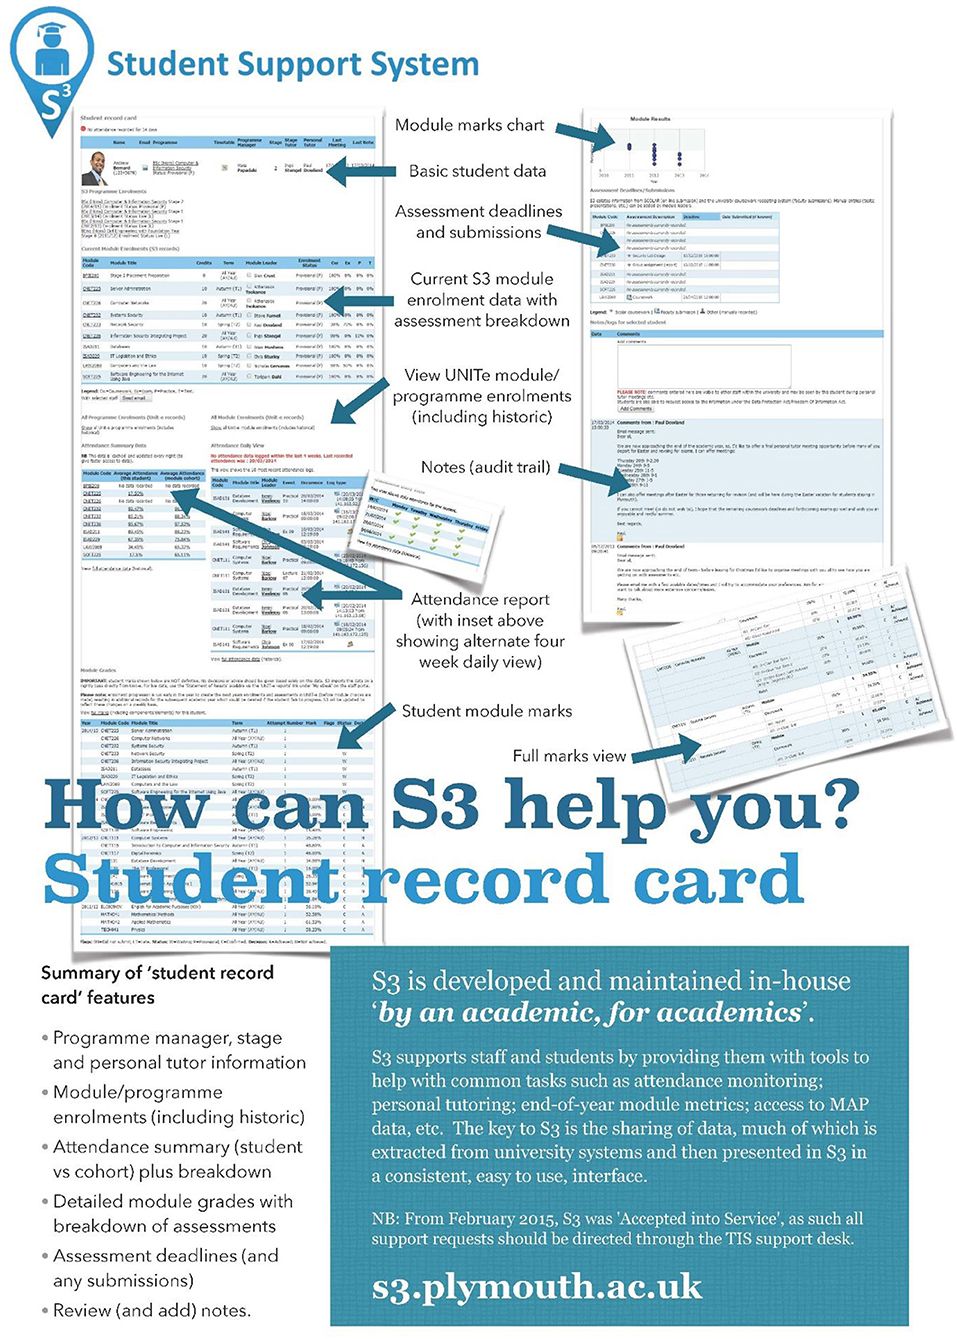
Figure A1. How can S3 help you? Student support card.
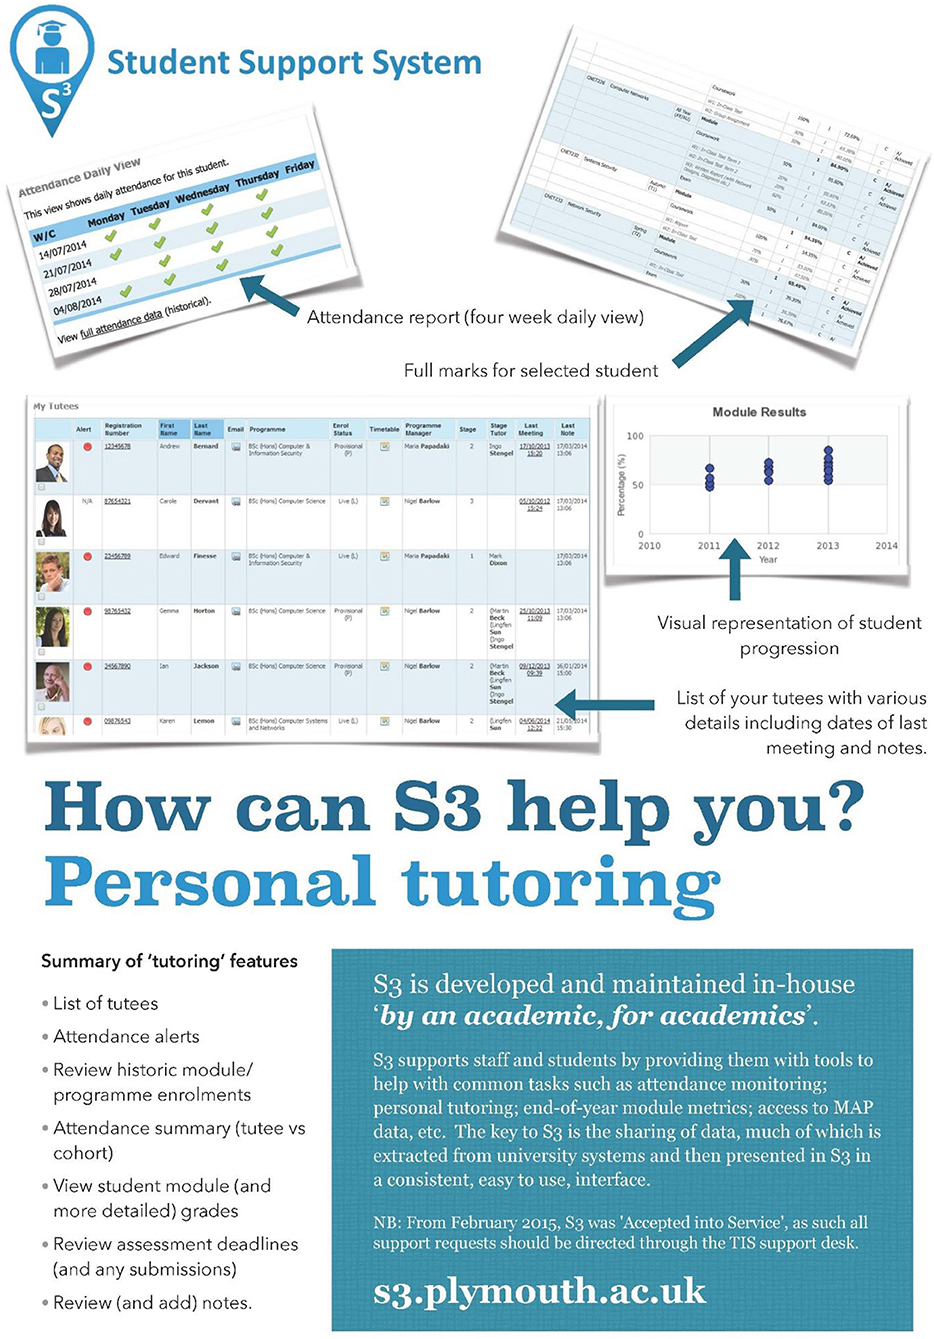
Figure A2. How can S3 help you? Personal qutoring.
Keywords: personal tutoring, learning analytics, higher education, Johari Window, dashboards
Citation: Lowes R (2020) Knowing You: Personal Tutoring, Learning Analytics and the Johari Window. Front. Educ. 5:101. doi: 10.3389/feduc.2020.00101
Received: 31 January 2020; Accepted: 03 June 2020;
Published: 21 July 2020.
Edited by:
Wendy Gates Troxel, Kansas State University, United StatesReviewed by:
Susan Smith, University of Sussex, United KingdomShantalea Johns, Wayne State University, United States
Copyright © 2020 Lowes. This is an open-access article distributed under the terms of the Creative Commons Attribution License (CC BY). The use, distribution or reproduction in other forums is permitted, provided the original author(s) and the copyright owner(s) are credited and that the original publication in this journal is cited, in accordance with accepted academic practice. No use, distribution or reproduction is permitted which does not comply with these terms.
*Correspondence: Ricky Lowes, ricky.lowes@plymouth.ac.uk