 Mary Roduta Roberts
 Chad M. Gotch
- 1Department of Occupational Therapy, University of Alberta, Edmonton, AB, Canada
- 2Learning and Performance Research Center, Washington State University, Pullman, WA, United States
The need for quality in score reporting practices is represented in the Standards for Educational and Psychological Testing (American Educational Research Association American Psychological Association National Council on Measurement in Education, 2014). The purpose of this study was to introduce a ratings-based instrument to assess the quality of score reports and examine the reliability of scores obtained. Quality criteria were derived from best-practices published within the literature (Hambleton and Zenisky, 2013). The rating scale was used to assess a sample of 40 English-language individual student score reports for K-12 accountability tests representing 42 states and five provinces in the United States and Canada. A two-facet generalizability study (i.e., sr x d x r) was completed with an overall reliability coefficient of G = 0.78. Application of the rating scale may provide a means to support empirical study of relationships between score report quality and stakeholder outcomes including interpretation, use, and impact.
Introduction
Score reporting holds a unique vantage within the enterprise of large-scale testing. A score report serves as the primary interface between the test developer and stakeholders. The vast resources devoted to test development, administration, and security, as well as in the development of educational accountability policy in many large-scale testing contexts, are all funneled into one medium. From there, stakeholders (e.g., students, teachers, school districts, communities) assess themselves, assess their educational experiences, and may respond in some way to the information that has been communicated to them. Such response may be personal, in the form of maintaining or changing study habits, or it may be broader in focus, with action taken toward school leadership or living conditions in the community.
The need for quality in score reporting practices is represented in the Standards for Educational and Psychological Testing (Ryan, 2006; American Educational Research Association American Psychological Association National Council on Measurement in Education, 2014; Zenisky and Hambleton, 2015). In addition to the centrality of score reporting to the appropriate score interpretations and uses discussed under the headings of Validity and Fairness, for example, the topic of score reporting is taken on directly in Standards 6.0 and 6.10–6.13. Across these standards, score reports are clearly identified as essential to the support of valid interpretations and uses and the minimization of potential negative consequences. An accurate score interpretation or defensible use of a score is dependent upon the quality of communication of examinee performance (O'Leary et al., 2017a).
The centrality of score reporting to the testing enterprise warrants focused and rigorous scholarly attention to the development and functioning of reports. To date, much has been written about the process of report development (e.g., Zapata-Rivera et al., 2012; Zenisky and Hambleton, 2012). Similarly, guidelines and demonstrations of report design have proliferated (e.g., Goodman and Hambleton, 2004; Roduta Roberts and Gierl, 2010; Hambleton and Zenisky, 2013; Zenisky and Hambleton, 2015). Related to design considerations, a strong focus in the literature has revolved around when it is appropriate to report subscale scores (e.g., Sinharay, 2010; Lyren, 2012; Feinberg and Wainer, 2014a,b).
The most prominent set of score reporting guidelines was introduced in 2013 by Hambleton and Zenisky, and restated and further articulated 2 years later (Zenisky and Hambleton, 2015). These guidelines consider score reports as the culminating element of the test development process. Hambleton and Zenisky foregrounded connections between score reports and validity within a testing system. The authors organized guidelines into domains, which we will discuss in greater detail below that addressed such concerns as needs assessments, design, language, and interpretive supports. Zenisky and Hambleton (2015) state that the guidelines reflect “considerations gathered from practical reporting experience, the testing literature and findings from the literature on communication of statistical results outside the domain of psychometrics” (p. 586). A key characteristic of the guidelines is that they assume the testing context strongly influences what content and form of presentation makes a report useful, understandable, and accessible (i.e., “good”). Therefore, the guidelines are presented generally and are intended to be malleable to fit a wide variety of score reports.
An implicit assumption in score reporting guidelines is that score reports developed using best practices will be of a higher quality, which in turn will facilitate more accurate interpretations and appropriate uses. The current research base, however, cannot address with confidence the assumption that higher quality reports relate to more positive outcomes. A recent review of the literature (Gotch and Roduta Roberts, 2018) documents fundamental issues in score report research, among them reliance upon small samples bounded within a particular context. Additionally, approaches to assessing score report quality have been indirect, often relying on qualitative user feedback. While published guidelines may be logical and intuitive, there exists minimal empirical support for score reporting practices grounded in such guidelines. Given the state of the current literature base, there is opportunity to strengthen recommendations for sound practice and to explore unexpected dynamics that may occur when score reports are sent into the real world. Indeed the field has called for more empirical work and the need for feedback loops (Zenisky, 2015).
In this study, as a step toward closing this important gap in the literature, we introduce and examine a rating-scale tool to assess the quality of score reports from traditional large-scale testing systems with typically more summative aims, and to facilitate understanding of how score report quality functions within a larger network of inputs and outcomes. We envision the primary application of this tool to be in research settings, where variables related to report design, population characteristics, interpretations, uses, and other outcomes are of interest. The purpose of the instrument is in congruence with recent work by O'Leary et al. (2017b).
To complement our introduction of the rating-scale tool, we present an initial analysis in what will need to be a larger validation effort. In the intended research applications, reliability of ratings obtained from the tool would be important to drawing sound conclusions. Therefore, we present an examination of inter-rater reliability through a generalizability theory framework. We situate this work within a validity argument (Kane, 2013), providing necessary but not sufficient support of a generalization claim that ratings obtained from a single assessment align with a universe of hypothetical ratings obtained in the research setting. That is, we examine the extent to which report ratings can be interpreted as being reproducible across raters (Cook and Hatala, 2016). In grounding the tool in a thoroughly documented and widely acknowledged set of design guidelines, we also support a domain description claim that the rating-scale tool reflects salient report design considerations suitable for research on score report functioning. The overall goal of the proposal and examination of the rating scale tool is to provide a means for strengthening the robustness of empirical research in score reporting, an important component of testing programs.
A Logic Model for Score Reporting
To provide a roadmap for score report research, we present a basic logic model that represents the connection between score report development and outcomes of interest (Figure 1). This logic model is not intended to replace the report development models already proposed (Zapata-Rivera et al., 2012; Zenisky and Hambleton, 2012). Rather, it takes on a different perspective, one oriented toward empirical research. The model first considers factors related to score report development. Considerations around content, language, and design reflect the criteria set forth by Hambleton and Zenisky (2013), and influence the generation of a product—the score reporting document or interface (in the case of a computer- or web-based reporting environment). From this report, proximal outcomes include stakeholder interpretations and uses. Stemming from proximal outcomes or directly from the presentation of the reports, themselves, are the distal outcomes. These include test-taker outcomes, stakeholder capacity, and consequences of the testing program. For example, did the test-taker reach improved levels of achievement based on actions taken in response to the score report? Did the test-taker or test-taker's parents use the score report to engage in partnership with the local school district officials to influence the educational system? What, if any, are the unintended effects of receiving the score report as part of the assessment experience? Such questions characterize a focus on the distal outcomes of score reporting.
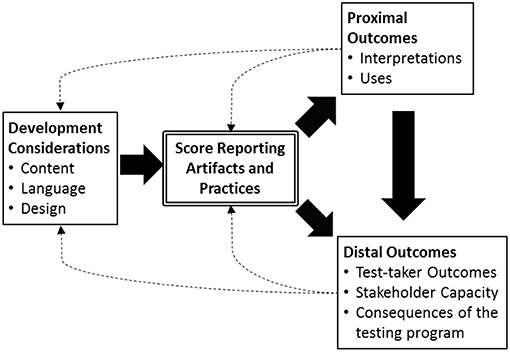
Figure 1. A logic model representing the production of score reports and associated outcomes of interest.
This logic model can serve to characterize or plan empirical score reporting research. For example, a study of the content of reports of English language proficiency assessments (Faulkner-Bond et al., 2013) focuses on just one element of the logic model, specifically the centerpiece of score reporting artifacts and practices. In contrast, (van der Kleij et al., 2014) examined the interpretations formed from alternative reports developed within a single framework (i.e., design research approach). Thus, their study addressed a relationship between elements in the logic model, specifically score reporting artifacts and the proximal outcome of user interpretations. Characterizing empirical score report research using the logic model can also benefit the field by facilitating identification of unexplored research questions. The rating scale introduced in this paper further benefits the field by providing a means to gather quantitative data for the central element. Essentially, the rating scale allows the treatment of score report quality to move from categorical (e.g., alternative forms of a report) to a finer-grained level of measurement (e.g., assigned scores). Leveraging the use of domains derived from the Hambleton-Zenisky framework, scores from the rating scale allow the field to address whether different ways of considering content, language, and design differ in the quality of the report they generate. Such an inquiry could be extended to examine relationships to proximal and distal outcomes. Thus the empirical studies by Faulkner-Bond et al. (2013) and van der Kleij et al. (2014) may also contribute toward the development of score reporting theory. Ideally, such a theory of score reporting would not only describe principles for score report development and evaluation but also facilitate explanation for how design considerations may impact broader educational aims. The combination of the logic model and rating scale instrument, therefore, empowers educational researchers to answer the basic question of whether better score reports do indeed lead to better outcomes for key stakeholders.
Model of Communication
Any consideration of score report quality must be acknowledged as rooted in a particular perspective. The score report rating scale presented in this paper calls upon published guidelines that come from a test development perspective and follow a tradition embodied in the Standards for Educational and Psychological Testing. Further, we have situated the rating scale in the specified logic model, which posits causal connections between report content, and outcomes such as interpretation. Therefore, we suggest the rating scale best represents the cybernetics tradition within communications (Craig, 1999; Craig and Muller, 2007; Gotch and Roduta Roberts, 2018). The cybernetics communication lens, or information processing layer as described by Behrens et al. (2013), can be described as focused on the transmission of technical information with the goal of minimal distortion upon reaching the receiver. Applied to score reporting, quality of the score reports is judged by the extent to which the content and design of the reports facilitates translation and understanding.
Methods
Sample
For the investigation of the reliability of ratings obtained from the rating scale instrument, a sample of 40 English-language individual student score reports for K-12 accountability tests representing 42 states and five provinces in the United States and Canada was examined. Reports were in electronic form, obtained from state and province department of education websites during the 2013–2014 school year. The score reports of interest for this study were those associated with tests administered to children in grades 3 through 8, covering at a minimum the topics of mathematics, reading, and writing. In the United States, such tests served No Child Left Behind (United States Congress., 2002) accountability mandates. If multiple sample reports were available across this grade span, the report closest to grade five was obtained as the report of record, as this grade level represented a midpoint in the testing years and was heavily represented in the sample reports. Though not a census of current reports disseminated in the two countries, we found the sample to provide sufficient variability to allow for examination of reliability in the K-12 accountability testing genre of score reporting.
Instrument
We developed an instrument to assess score report quality based on the review framework set forth by Hambleton and Zenisky (2013). This framework, which marks the most comprehensive attempt to-date to develop a set of guidelines for score report review, captures the quality of reports within eight areas: (1) needs assessment, (2) content—report introduction and description, (3) content—scores and performance levels, (4) content—other performance indicators, (5) content—other, (6) language, (7) design, and (8) interpretive guides and ancillary materials. Within each dimension of the guidelines, specific review questions are asked, such as “Are concrete examples provided for the use of the test score information?” and “Is a highlight or summary section included to communicate the key score information?” By grounding in this framework, the instrument we advance in this study reflects best practices in test development, experiences in score report design, and knowledge of the score reporting literature (Hambleton and Zenisky, 2013, p. 485).
We intended for the instrument to be used by score report researchers across a wide range of development (i.e., graduate students to veteran researchers) who might want to assess score report quality or engage stakeholders who may not possess specialized knowledge in educational measurement. The adaptation of the guidelines for the instrument contains little jargon, and thus lends itself well to wide accessibility. Further, such accessibility allows for more democratic investigations of score report quality without necessarily privileging the perspective of one group (e.g., testing professionals) over another (e.g., parents).
Given this orientation, we chose to focus on five core domains: (1) Report Introduction and Description, (2) Scores and Performance Levels, (3) Supporting Material, (4) Language, (5) Design, and a supplemental sixth domain, Interpretive Guides and Ancillary Materials (see Appendix A). We did not include a domain for the needs assessment area because users of the rating scale, particularly those not directly involved with the test and score report development process, may not have access to such evidence. Areas 4 and 5 in the Hambleton-Zenisky framework were collapsed into a single domain, as both were concerned with support of the communication of scores and performance levels. Finally the Interpretative Guides and Ancillary Materials domain was designated as supplemental. We found such supplemental material to vary greatly across testing program. Sometimes interpretive information was provided in a concise (i.e., fewer than four pages), stand-alone document that presumably accompanied the score report on its delivery to students and parents. In other cases, interpretive guidance was contained within a lengthy document (i.e., >80 pages) that included detailed information on such matters as the schedule of test administration across grade levels, performance level descriptors, and revisions to the testing system. Interpretive guides may have also covered multiple types of score reports (e.g., individual student, school, district) and multiple testing programs (e.g., standard and modified). In the case of the longer, more thorough supplemental guides in practice, a parent or student would need to actively search a department of education website for such guidance or type in a URL provided on the score report document. Further, it is possible brief interpretive guides may accompany delivery of the score reports to students and parents, but not be accessible on the department of education website.
The assignment of ratings in the instrument is given at the domain level. We reasoned this was an appropriate grain size given the purpose of the instrument. The intent of the rating scale is not to diagnose discrete shortcomings in need of remedy, but rather to enable efficient quantification of score report quality. We also note that research in rater cognition has documented that raters may apply both holistic and analytic processes regardless of the grain size of the intended rating (Crisp, 2012; Suto, 2012).
We decided to develop the instrument in a rating scale form. While a true rubric form (Brookhart, 2013) might provide more robust descriptions of what quality looks like within each domain, these descriptions could vary greatly across testing contexts (e.g., accountability, progress monitoring, certification). Indeed, the guidelines themselves contain much conditional language about score report content (e.g., “If present, are reports from recent and relevant tests explained”). Therefore, we opted for a rating scale design where the rater assigns a score to reflect the extent to which a set of criteria were met by the report. In the scoring process, a report may earn 0 points for failing to meet any criterion sufficiently and up to three points for exemplifying excellent quality in the domain. Therefore, a report may be assigned a total score between 0 and 15 for the five core domains. To develop the criteria within each domain, we re-worded the Hambleton-Zenisky framework elements to function as statements rather than questions, and eliminated some redundancy to ease rater burden. We also eliminated reference to procedures for translating the report into another language. Similar to our rationale for not including a needs assessment domain, language translation/adaptation procedures are not necessarily documented in the report or publicly available through ancillary materials. This issue has been reported in another application of the Hambleton-Zenisky framework (Gándara and Rick, 2017).
Procedure
Four advanced graduate students in educational measurement were recruited to provide ratings in the core domains. These raters were briefed in a group setting on score report literature and the purpose of the present study by one of the authors. The rating scale was presented to them, and they were given an opportunity to ask questions about rating scale content to clarify their understandings and interpretations. Then, raters were assigned three sample score reports to score. These reports were not a part of the study sample, and represented a previous version of one state's Grade 3 accountability test, a diagnostic algebra test, and a high school end-of-course examination. The author then reconvened the group to share ratings and further discuss rating scale content. The aim of this discussion was not to obtain consensus on ratings, but rather to assure rating scale content remained well understood in application and to address new questions about how elements observed in the score reports corresponded to rating scale criteria. For example, one point of conversation concerned what counted as concrete examples for test score use. The group also discussed how to provide a domain-level rating when the criteria the domain comprises were met to varying extents, which led to a review of the descriptors for each score point. Once the group of raters felt comfortable with their understanding, the study sample of score reports was provided, and raters were given 3 weeks to complete their reviews. All ratings were completed independently, and submitted to one of the authors, who compiled the data for analysis.
Data Analysis
Report Ratings
We summarized ratings through a series of descriptive statistic calculations. First, we summarized ratings within each rater-domain combination. Then we summarized ratings for each domain, collapsed across rater. Acknowledging that, in practice, users may wish to have a total score produced by the rating scale, we summed domain scores by rater, and calculated descriptive statistics, and then again repeated the process with ratings collapsed across rater. To gain an additional perspective on the ratings assigned, we calculated Spearman rank-order correlations between each of the domains for each rater.
Reliability
The rating responsibilities of the instrument employed in this study require judgments about the quality of score report elements across various domains. In the present study, score report quality was assessed by multiple individuals. As a first step toward documenting the consistency of ratings obtained by the rating scale, within an argument-based approach to validation, we undertook a study of score reliability. Generalizability Theory provided a valuable analytical framework, as it allowed for the decomposition of independent sources of error variance (Brennan, 1992). A two-facet generalizability study (G-study) was conducted with score reports fully crossed with rating scale domains and raters (i.e., sr x d x r) to assess reliability of rater scores. A peer-reviewed, publicly available SAS macro (Mushquash and O'Connor, 2006) was used to estimate variance components. The R packages gtheory and boot were then used to replicate the obtained variance components and obtain standard errors for these components, using a bootstrap technique (Tong and Brennan, 2007). The variance component estimates were subsequently used in a decision study (D-study) using the aforementioned SAS macro to estimate the effects of the number of raters employed on reliability. Outcomes from the D-study could be used by future researchers to plan for sufficient personnel resources. In this study, we adopted a criterion of 0.80 for acceptable reliability, which is consistent with the intended research-oriented application of the instrument (Nunnally and Bernstein, 1994).
Results
Distribution of Ratings
Average ratings within domain and rater ranged from 1.13 to 2.53, indicating a moderate to fairly high level of adherence to the criteria specified by Hambleton and Zenisky (Table 1). The standard deviations around these averages were generally in the range of about 0.75 to 1.00, suggesting the rating scale was sensitive to variability in the quality of the score reports. The Language domain saw the highest ratings given with a combined average of 2.45 (sd = 0.76), and Supporting Material was lowest at 1.28 (sd = 0.98). The ranking of each domain was consistent across all raters, and the average ratings provided were all within half a point, except for Introduction and Description and Support Material, where the ranges of average scores were 0.55 and 0.57, respectively. Figure 2 shows the shapes of distributions of ratings varied across domains when collapsed across raters. The distribution of total scores signals a potential ceiling effect and negative skew. Correlations between domain ratings for each rater were generally moderate (i.e., 0.35–0.65; Table 2). In some cases the correlations were consistent across raters (e.g., Scores and Performance Levels with Supporting Material), while in other cases (e.g., Introduction and Description with Design) the coefficients were more spread out. Rater 1 had the lowest correlations between the Introduction and Description domain and other domains. Rater 4 also demonstrated some of the lowest correlations, but these patterns did not hold across all combinations of domains.
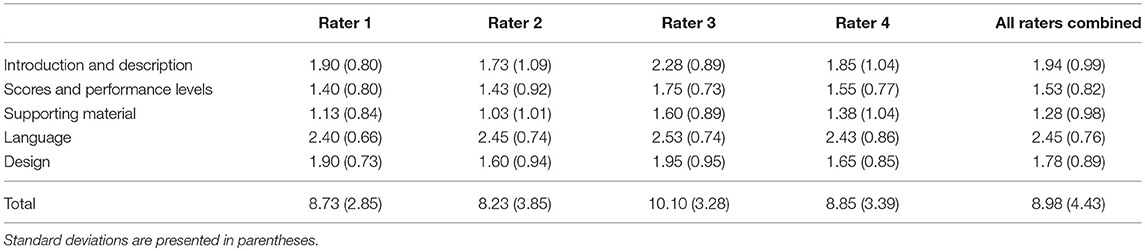
Table 1. Mean ratings by domain and rater.
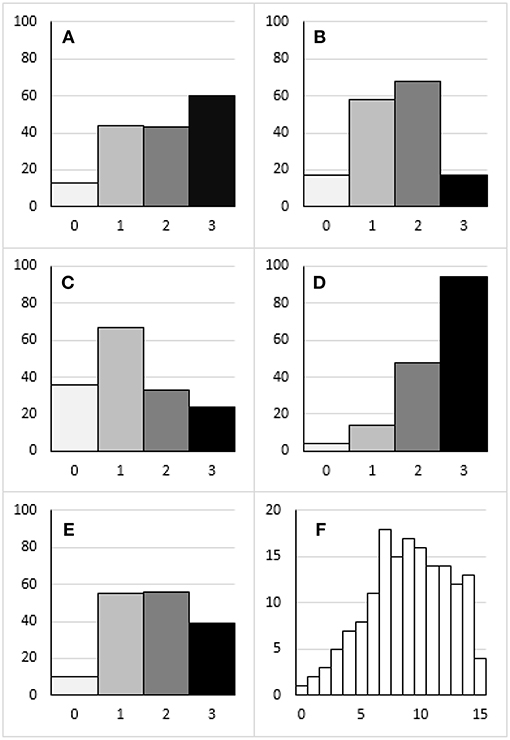
Figure 2. Distributions of ratings for (A) Introduction and Description, (B) Scores and Performance Levels, (C) Supporting Material, (D) Language, (E) Design, and (F) Total scores.
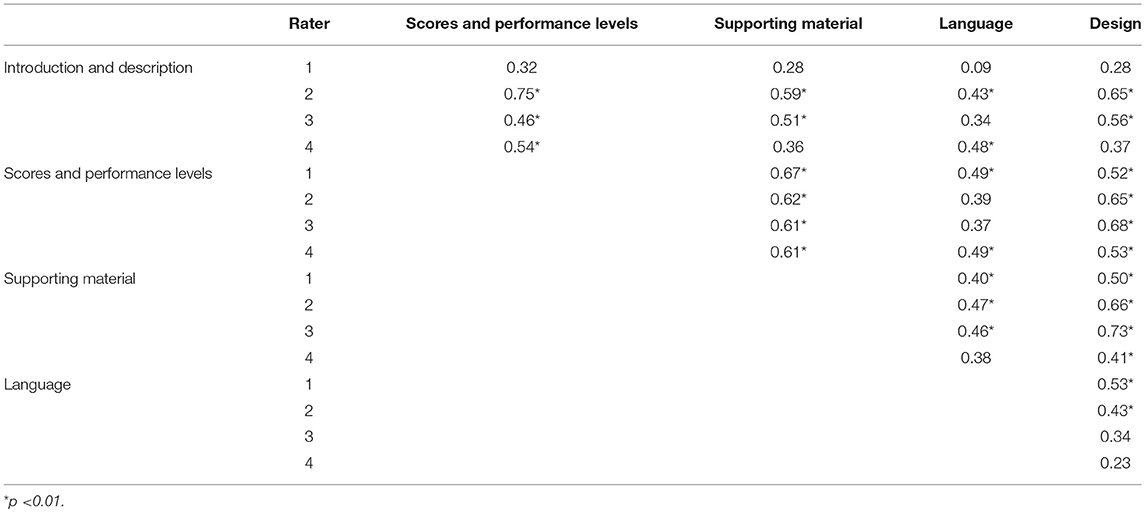
Table 2. Spearman rank-order correlations between domains by rater.
Reliability
The variance components and the proportions of variance from the G-study analysis are presented in Table 3. The proportions of variance associated with score reports, domain, and raters were 0.25, 0.19, and 0.02, respectively. For optimal measurement, the proportion of variance associated with the object of measurement (i.e., score reports) should be high relative to the proportion of variance attributable to the other facets. The variance component for raters was relatively small indicating that the ratings did not vary substantially between raters (i.e., no rater was particularly harsh or lenient in their application of the criteria, relative to other raters). Interpretation of the variance component for rating scale domain indicates that there was variability in capturing these aspects of the score reports; the score reports performed differently across the five domains with regards to their assessment. A relatively large proportion of variance associated with the rating scale domains can be interpreted as a positive finding to the extent that different aspects of the score reports can be meaningfully assessed and differences in quality can be captured. Caution should be exercised where interpretations of score report quality rest on an assumption of unidimensionality.
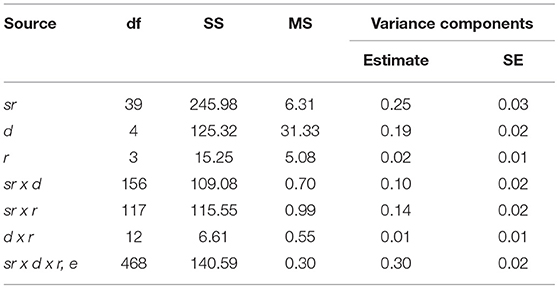
Table 3. Variance decomposition for score report ratings.
The proportions of variance attributable to the two-way interactions ranged from 0.01 (d x r) to 0.10 (sr x d) to 0.14 (sr x r). The low proportion of variance associated with the two-way interaction between rating scale domain and rater suggests there was little inconsistency in the average ratings between raters from one rating scale dimension to the next. The two-way interactions involving the object of measurement (i.e., score report) account for 0.24 of the total variance. This finding can be interpreted as the rankings of score reports varying to some extent by rating scale domain and rater. Finally, a large proportion of variance (0.30) was associated with the 3-way interaction, error term. This finding suggests potential rater idiosyncrasies and other systematic influences (e.g., unidentified facets, confounded effects) on the assessment of score report quality that have not yet been accounted for. As a measure of score reliability, a generalizability coefficient of G = 0.78 was obtained, just shy of the 0.80 standard.
The results of the D-study investigating the effect of varying the number of raters on the generalizability coefficient are presented in Table 4. As expected, score reliability improves with an increase in the number of raters with the largest improvement seen from employing one rater to employing two raters. The gains in reliability diminish after employing more than three raters; five raters are suggested to achieve a reliability >0.80.
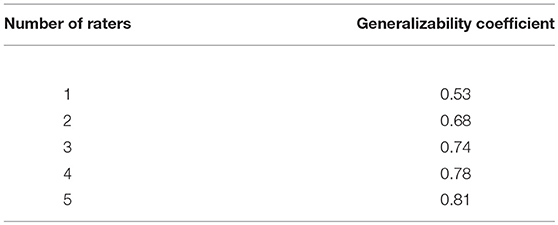
Table 4. D-study generalizability coefficients.
Discussion
The purpose of this study was to introduce and begin to examine a tool for assessing score report quality to advance scholarly work on score reporting. A rating scale was developed based on quality criteria derived from best-practices published within the literature. Although quality is not explicitly defined in the original guidelines (Hambleton and Zenisky, 2013; Zenisky and Hambleton, 2015), an implicit definition is provided through the idea that high quality score reports meet more of the stated guidelines than lesser quality score reports. This paper described an application of the rating scale to a sample of 40 score reports from Canada and the United States within large-scale accountability-oriented assessment. A two-facet generalizability analysis (i.e., sr x d x r) was completed to examine sources of variance related to the rating task and to investigate the extent to which ratings obtained on the rating scale were reliable.
A descriptive summary of the domain ratings captured variability in quality across reports, with raters displaying some similarities in patterns of ratings. Across the raters, higher ratings were given for Language and lower ratings were given for Supporting Material. Correlational analysis of ratings for each domain demonstrated a moderate relationship, indicating shared variability between the domains. Generally, the highest correlations were observed between Scores and Performance Levels and Supporting Material. This result is not surprising given the criteria in both domains reference the bulk of the content within a report, namely scores and descriptions of student performance and adjunct material to assist the user with score interpretation and potential next steps.
Results of the generalizability study were consistent with the reported descriptives and correlations. Of the total variance, the rater facet accounted for 2%, domain accounted for 19%, and score reports as the object of measurement accounted for 25%. The higher proportion of variance attributable to a main effect for domain is supported by the moderate correlations observed between domains indicating a degree of multidimensionality to the ratings. The two-way interactions of d x r, and sr x r, accounted for 1 and 14% of the total variance, respectively. These results suggest that raters interpreted the domains under consideration in the same way, but saw quality differently depending on the score report. This finding supports the likelihood of an inherent element of subjective experience that is present when assessing quality across varied reports. The two-way interaction of sr x d accounted for 10% of the total variance, indicating that similar total scores may arise from different profiles of domain-level quality. This finding suggests the use of a total score may mask important differences in report quality. The three-way interaction of sr x d x r confounded with error accounts for 30% of the total variance. This finding indicates there may be other elements of score report quality that are not captured within the domains of the rating scale or an idiosyncratic weighting of domain indicators across score reports in arriving at ratings of quality.
In this study, raters were required to assess aspects of a score report and determine the degree to which criteria were met for each domain. The presence of a non-negligible sr x r interaction term and relatively large sr x d x r, e interaction/error term could potentially be explained by the complexity of the rating task when assessing quality. Intuitively, the rating process entails multiple steps, such as: (1) understanding the quality criteria, (2) identifying the relevant elements in the score report to which the criteria refer, (3) interpreting the score report elements with reference to the criteria by making comparisons to a hypothetical ideal report and perhaps to other score reports that have been examined and rated, and (4) rendering a judgment of quality. When considering these steps, it is not surprising interactions are detected between score reports, domains, and raters. Steps 1 and 3 could elicit recall of the rater's past experiences with test score reports specifically, or assessment more generally, where these existing schema could influence understanding and interpretation of quality criteria as exemplified in the score report. The judgment rendered on score report quality reflects, in part, the rater's unique perspective and experience and is represented in the sr x r interaction terms. Recognizing that these judgment processes are dynamic and may influence ratings in some domains more than others, an (sr x r) x d interaction, or sr x d x r, could be, understandably, relatively large.
One may propose to enhance rater consistency through rater training. Aspects of the instrument administration can be structured to minimize the effect of subjective influences and to promote a common interpretation, understanding, and application of quality criteria. Rater training could enhance consistency with Steps 1 and 2, and to some degree Step 3 during the rating process. However, despite efforts to improve rater consistency through rater training, the subjective influence will likely remain to some degree embedded in rater interaction terms. Studies examining rater training in assessment of performance using direct observations point to mixed results with regards to its effectiveness (Woehr and Huffcutt, 1994; Williams et al., 2003). Thus, it may be more effective to seek to improve the reliability of ratings through other avenues, such as modeling an additional facet or increasing the number of levels within a facet (i.e., increasing the number of raters). Due to the nature of the score report rating task and the construct of quality, it may be difficult to achieve a very high level of reliability (e.g., >0.95). However, the D study results indicate applications of this tool in a research context with five raters may achieve reliability above 0.80. Given the 0.80 threshold is sufficient for the intended research purposes of the rating scale and past score report research has consistently gathered samples for focus groups and individuals in the range of 5–20 participants (Ryan, 2006; Gotch and Roduta Roberts, 2018), this study suggests potential viability of the rating scale.
Implications
The results of this study have implications for an emerging theory of score reporting and, in turn, the broader endeavor of test validation. Here, we adopt a view of theory as a logically connected system of general propositions that establishes relationships between multiple variables (Abend, 2008). Our study provides initial evidence that the rating scale may support the investigation of predictive and causal relationships between design process, product, and proximal and distal outcomes, as illustrated by the logic model proposed in Figure 1. Generalizability theory analyses suggest such a tool, with content grounded in the most robust set of available design guidelines, may produce dependable results within a research context that relies on correlational statistics. Application of this tool for assessing score report quality can also provide us with a critical check on our use of current frameworks for conceptualizing and approaching the activity of score reporting. Do better designed reports lead to better or more valid interpretations? If not, what else should be considered when reporting assessment results? Situating such investigation within consideration of how score reports function as artifacts within educational systems (Roduta Roberts et al., 2018) could advance a deeper understanding of the role and function of score reporting.
Extending that notion further, we may consider how these understandings contribute to test validation, particularly in consideration of consequences of a testing system. Score reports, as the vehicle by which assessment results are communicated, may positively influence outcomes such as students' achievement of personal goals and increased stakeholder capacity to understand and use assessment results in their contexts. The distal outcomes as represented in Figure 1, could be considered intended or unintended effects of the testing system. In this way, the development of score reporting theory also supports test validation, particularly investigations of the consequences of a testing program.
Future Directions
With this orientation in mind, there is work to be done to further investigate functioning of the rating scale to support research uses. Continuing with support of a generalization inference that was at focus in this study, results of the D-study showed an expected improvement in reliability with the greatest increase between one and two raters, and reliability exceeding 0.80 when employing five raters. Future research could empirically verify these projections. Future studies could also examine the reliability of ratings when employing raters from different perspectives, such as state education agency representatives, score report developers, more advanced educational measurement professionals, or intended users. Additionally, the rating scale could be applied to reports from other score reporting genres (e.g., certification and licensure).
We also recommend submitting the instrument to a protocol analysis by way of think-aloud interviews. Such work would gather validity evidence in the form of response processes to support both the stated generalization inference and a scoring inference that ratings accurately represent differential endorsement of the criteria relevant to the domain being assessed. It is possible that two raters could give a score report the same score within a domain while attending to different criteria within that domain. This phenomenon mirrors how a score on a portion of a math achievement exam could reflect different interpretations and responses to items within that domain. Think-aloud interviews could therefore gather support for interpretations drawn from the instrument or call for a need to refine the instrument. Think-aloud interviews could also contribute to enhancing the clarity of guidelines for score reports. Conducting think-aloud interviews during the rating process would allow score report scholars to begin to further explain what is meant by particular criteria and where criteria need to be specified or revised. Last, think-aloud interviews can contribute to theory development within score reporting, by providing insight into both the construct of quality and the nature of the rating task. It is necessary to understand the likely contextual influences in the perception of score report quality, determine what can be addressed during score report development and how to address it, and shape our expectations of the outcomes of such efforts.
Future work can also explore other applications of the rating scale tool. One of those applications could be in an operational context. The tool could be examined in the context of quality assurance whereby stakeholder groups, through focus groups for example, assess quality after development, and dissemination. In this way, the rating scale would function as a stimulus to generate discussions. Previous reports on the use of focus groups in score report development and quality assurance have depicted a process where stakeholders are asked to interpret and comment on various aspects of a report (e.g., Trout and Hyde, 2006; Clark et al., 2015). The rating scale tool could add a different structure to these input-collection efforts by focusing discussion on set standards of quality. Empirical work stemming from application in this operational context could then focus on whether report developers and stakeholders share the same perceptions of report quality. Differences in perception could signal a need to revise published guidelines and report development practices. Another potential application of this tool is to build on existing work examining interpretations of score reports by diverse subgroups of parents using cognitive labs (Kannan et al., 2018). Application of the rating scale tool could provide a complementary quantitatively-oriented examination of comprehension as a function of score report quality in each of the domains.
Use of the rating scale tool could also be explored in the context of empowering score report users. Gándara and Rick (2017) proposed that a tool to appraise score report quality be provided to educational stakeholders as a form of empowerment. When viewed through a situated perspective, the provision of this tool to educational stakeholders enables the distribution of responsibility in the appraisal and maintenance of quality score reports that serve an intended audience. Empowerment of users aligns with a socio-cultural perspective where the provision of score reports, and by extension, the tools to appraise their quality, can facilitate stakeholders' achievement of particular educational goals within their context (Roduta Roberts et al., 2018). The framing of score reporting through a socio-cultural perspective represents a recent dimension to understanding how score reports function within the larger educational system and society as a whole.
Conclusion
Score reports are uniquely positioned within the larger educational system, as an output of test development in the communication of student performance, and as an input in facilitating student learning and instruction. To further understand the important function of score reports, further exploration of the relationships between score report quality, stakeholder interpretations, and more importantly, uses, is needed. To this end, we introduced a promising instrument to assess domains of score report quality. Research applications of this tool may assist in the development of an empirically grounded theory of score reporting. A theory of score reporting has the potential to inform future investigations of the impact of effective score reporting practices. Perhaps, more importantly, the great potential of score reports as a tool to enable achievement of educational outcomes across multiple system levels can be realized.
Data Availability
The score report documents and data supporting the conclusions of this manuscript will be made available by the authors, without undue reservation, to any qualified researcher.
Ethics Statement
Ethics approval was not required for this study per applicable institutional and national guidelines and regulations, as it relied exclusively on publicly available information. No data collection from human participants was required.
Author Contributions
MR co-conceptualized the research study, participated in data analysis, and led the manuscript writing process. CG co-conceptualized the research study, participated in data analysis, and contributed substantially to the writing process.
Conflict of Interest Statement
The authors declare that the research was conducted in the absence of any commercial or financial relationships that could be construed as a potential conflict of interest.
Supplementary Material
The Supplementary Material for this article can be found online at: https://www.frontiersin.org/articles/10.3389/feduc.2019.00020/full#supplementary-material
References
Abend, G. (2008). The meaning of “theory.” Sociol. Theory 26, 173–199. doi: 10.1111/j.1467-9558.2008.00324.x
American Educational Research Association American Psychological Association and National Council on Measurement in Education (2014). Standards for Educational and Psychological Testing. Washington, DC: American Educational Research Association.
Behrens, J. T., DiCerbo, K., Murphy, D., and Robinson, D. (2013). “Conceptual frameworks for reporting results of assessment activities.” in Presented at the Annual Meeting of the National Council on Measurement in Education (San Francisco, CA).
Brennan, R. L. (1992). Generalizability theory. Educ. Measure. 11, 27–34. doi: 10.1111/j.1745-3992.1992.tb00260.x
Brookhart, S. M. (2013). How to Create and Use Rubrics for Formative Assessment and Grading. Alexandria, VA: ASCD.
Clark, A., Karvonen, M., Kingston, N., Anderson, G., and Wells-Moreaux, S. (2015). “Designing alternate assessment score reports that maximize instructional impact,” in Presented at the Annual meeting of the National Council on Measurement in Education (Chicago, IL).
Cook, D. A., and Hatala, R. (2016). Validation of education assessments: a primer for simulation and beyond. Adv. Simulat. 1, 1–12. doi: 10.1186/s41077-016-0033-y
Craig, R. T. (1999). Communication theory as a field. Commun. Theory 9, 119–161. doi: 10.1111/j.1468-2885.1999.tb00355.x
Craig, R. T., and Muller, H. L (Eds.). (2007). Theorizing Communication: Readings Across Traditions. Thousand Oaks, CA: Sage.
Crisp, V. (2012). An investigation of rater cognition in the assessment of projects. Educ. Measure. 31, 10–20. doi: 10.1111/j.1745-3992.2012.00239.x
Faulkner-Bond, M., Shin, M. J., Wang, X., Zenisky, A. L., and Moyer, E. (2013). “Score reports for english proficiency assessments: current practices and future directions,” in Presented at the Annual Meeting of the National Council on Measurement in Education (San Francisco, CA).
Feinberg, R. A., and Wainer, H. (2014a). A simple equation to predict a subscore's value. Educ. Measure. 33, 55–56. doi: 10.1111/emip.12035
Feinberg, R. A., and Wainer, H. (2014b). When can we improve subscores by making then shorter? the case against subscores with overlapping items. Educ. Measure. 33, 47–54. doi: 10.1111/emip.12037
Gándara, F., and Rick, F. (2017). Alentando los distintos actors a evaluar informes de resultados de pruebas estandarizadas: desafíos y propuestas/Empowering end users to evaluate score reports: current challenges and proposed solution. Pensamiento Educ. 54, 1–24. doi: 10.7764/PEL.54.2.2017.11
Goodman, D. P., and Hambleton, R. K. (2004). Student test score reports and interpretive guides: review of current practices and suggestions for future research. Appli. Measure. Educ. 17, 145–220. doi: 10.1207/s15324818ame1702_3
Gotch, C. M., and Roduta Roberts, M. (2018). A review of recent research on individual-level score reports. Educ. Measur. 37, 46–54. doi: 10.1111/emip.12198
Hambleton, R. K., and Zenisky, A. L. (2013). “Reporting test scores in more meaningful ways: a research-based approach to score report design,” in APA Handbook of Testing and Assessment in Psychology: Vol. 3 Testing and Assessment in School Psychology and Education, ed K. F. Geisinger (Washington, DC: American Psychological Association), 479–494.
Kane, M. T. (2013). Validating the interpretations and uses of test scores. J. Educ. Measure. 50, 1–73. doi: 10.1111/jedm.12000
Kannan, P., Zapata-Rivera, D., and Liebowitz, E. A. (2018). Interpretation of score reports by diverse subgroups of parents. Educ. Assess. 23, 173–194. doi: 10.1080/10627197.2018.1477584
Lyren, P.-E. (2012). “The value of reporting subscores from the New SweSAT,” in Presented at the Annual Meeting of the National Council on Measurement in Education (Vancouver, BC).
Mushquash, C., and O'Connor, B. P. (2006). SPSS, SAS, and MATLAB programs for generalizability theory analyses. Behav. Res. Methods 38, 542–547. doi: 10.3758/BF03192810
O'Leary, T. M., Hattie, J. A. C., and Griffin, P. (2017a). Actual interpretations and use of scores as aspects of validity. Educ. Measure. 36, 16–23. doi: 10.1111/emip.12141
O'Leary, T. M., Hattie, J. A. C., and Griffin, P. (2017b). “Evaluating score report effectiveness: do better designed reports result in better interpretation?” in Presented at the Annual Meeting of the National Council on Measurement in Education (San Antonio, TX).
Roduta Roberts, M., and Gierl, M. J. (2010). Developing score reports for cognitive diagnostic assessments. Educ. Measur. 29, 25–38. doi: 10.1111/j.1745-3992.2010.00181.x
Roduta Roberts, M., Gotch, C. M., and Lester, J. N. (2018). Examining score report language in accountability testing. Front. Educ. 3:42. doi: 10.3389/feduc.2018.00042
Ryan, J. M. (2006). “Practices, issues, and trends in student test score reporting,” in Handbook of Test Development, eds S. M. Downing and T. M. Haladyna (New York, NY: Routledge), 677–710.
Sinharay, S. (2010). How often do subscores have added value? Results from operational and simulated data. J. Educ. Measure. 47, 150–174. doi: 10.1111/j.1745-3984.2010.00105.x
Suto, I. (2012). A critical review of some qualitative research methods used to explore rater cognition. Educ. Measure. 31, 21–30. doi: 10.1111/j.1745-3992.2012.00240.x
Tong, Y., and Brennan, R. L. (2007). Bootstrap estimates of standard errors in generalizability theory. Educ. Psychol. Measure. 67, 804–817. doi: 10.1177/0013164407301533
Trout, D. L., and Hyde, E. (2006). “Developing score reports for statewide assessments that are valued and used: feedback from K-12 stakeholders,” in Presented at the Annual Meeting of the American Educational Research Association (San Francisco, CA).
United States Congress. (2002). No child left behind act of 2001. Public Law 107-110. 107th Cong., Washington, DC. 1425–2095.
van der Kleij, F. M., Eggen, T. J. H. M., and Engelen, R. J. H. (2014). Towards valid score reports in the Computer Program LOVS: a redesign study. Stud. Educ. Evalu. 43, 24–39. doi: 10.1016/j.stueduc.2014.04.004
Williams, R. G., Klamen, D. A., and McGaghie, W. C. (2003). Cognitive, social and environmental sources of bias in clinical performance ratings. Teach. Learn. Med. 15, 270–292. doi: 10.1207/S15328015TLM1504_11
Woehr, D. J., and Huffcutt, A. I. (1994). Rater training for performance appraisal: a quantitative review. J. Occup. Organ. Psychol. 67, 189–205.
Zapata-Rivera, D., VanWinkle, W., and Zwick, R. (2012). Applying Score Design Principles in the Design of Score Reports for CBAL Teachers (No. ETS RM-12-20). Princeton, NJ: ETS.
Zenisky, A. L. (2015). “Reporting with purpose: current approaches to promoting test score meaning,” in Presented at the Annual Meeting of the National Council on Measurement in Education (Chicago, IL).
Zenisky, A. L., and Hambleton, R. K. (2012). Developing test score reports that work: the process and best practices for effective communication. Educ. Measure. 31, 21–26. doi: 10.1111/j.1745-3992.2012.00231.x
Keywords: score report, communication, generalizability theory, interrater reliability, accountability testing
Citation: Roduta Roberts M and Gotch CM (2019) Development and Examination of a Tool to Assess Score Report Quality. Front. Educ. 4:20. doi: 10.3389/feduc.2019.00020
Received: 11 October 2018; Accepted: 25 February 2019;
Published: 19 March 2019.
Edited by:
Christopher Charles Deneen, Royal Melbourne Institute of Technology (RMIT University), AustraliaReviewed by:
Peter Nyström, University of Gothenburg, SwedenCassim Munshi, Nanyang Technological University, Singapore
Copyright © 2019 Roduta Roberts and Gotch. This is an open-access article distributed under the terms of the Creative Commons Attribution License (CC BY). The use, distribution or reproduction in other forums is permitted, provided the original author(s) and the copyright owner(s) are credited and that the original publication in this journal is cited, in accordance with accepted academic practice. No use, distribution or reproduction is permitted which does not comply with these terms.
*Correspondence: Mary Roduta Roberts, bXJvYmVydHNAdWFsYmVydGEuY2E=