 Stéphanie Berger
 Angela J. Verschoor
 Theo J. H. M. Eggen
 Urs Moser
- 1Department of Research Methodology, Measurement and Data Analysis, University of Twente, Enschede, Netherlands
- 2Institute for Educational Evaluation, University of Zurich, Zurich, Switzerland
- 3Cito, Institute for Educational Measurement, Arnhem, Netherlands
A good match between item difficulty and student ability ensures efficient measurement and prevents students from becoming discouraged or bored by test items that are too easy or too difficult. Targeted test designs consider ability-related background variables to assign students to matching test forms. However, these designs do not consider that students might significantly differ in ability within the resulting groups. In contrast, multistage test designs consider students' performance during test taking to route them to the most informative modules. Yet, multistage test designs usually include one starting module of moderate difficulty in the first stage, which does not account for differences in ability. In this paper, we investigated whether measurement efficiency can be improved by targeted multistage test designs that consider ability-related background information for a targeted assignment at the beginning of the test and performance during test taking for selecting matching test modules. By means of simulations, we compared the efficiency of the traditional targeted test design, the multistage test (MST) design, and the targeted multistage test (TMST) design for estimating student ability. Furthermore, we analyzed the extent to which the efficiency of the different designs depends on the correlation between the ability-related background variable and the true ability, students' ability level and their categorization into an ability group, and the length of the starting module. The results indicated that TMST designs were generally more efficient for estimating student ability than targeted test designs and MST designs, especially if the ability-related background variable correlated high with and, thus, was a good indicator of, students' true ability. Furthermore, TMST designs were particularly efficient in estimating abilities for low- and high-ability students within a given population. Finally, very long starting modules resulted in less efficient estimation of low and high abilities than shorter starting modules. However, this finding was more prominent for MST than for TMST designs. In conclusion, TMST designs are recommended for assessing students from a wide ability distribution if a reliable ability-related background variable is available.
Introduction
Understanding the purpose of a test and its target population is essential for determining an appropriate test design. A test for classifying students or a test targeted to a very specific population needs to measure ability most accurately close to specific points along the ability scale. Therefore, an appropriate test design includes mainly items that provide a large amount of information at these specific points. In contrast, tests aiming to assess the ability level of each student of a diverse target population—such as formative assessments—require test designs that provide accurate results over a wide ability range. Often, a single linear test, including items of varying difficulties, is not appropriate in such a context because each student is confronted with a relatively high number of items that do not match his or her ability level. This in turn results in a low measurement efficiency, and it could also impair students' motivation during test taking (Lord, 1980).
In general, two different approaches are used to account for a broad variation in ability via targeted assignment of items of varying difficulty (e.g., Mislevy and Wu, 1996). On one hand, we can consider preliminary information about students' ability in order to assign students to matching test forms. In a school context, preliminary information about the ability level of a student is often available prior to testing. Students are assessed in various tests by their teachers and are marked accordingly. In addition, students are assigned to different grades in school and—especially in the secondary school level—even to different school types or performances groups. This information can be used to divide the target population into ability groups and to determine matching test forms for each group. However, the disadvantage of this approach is that ability-related background variables are only an approximation of the students' true ability. As a result, some students might differ greatly from the group mean and, hence, from the target ability level of the test.
On the other hand, we can assign students to targeted items or item sets step by step based on their performance during test taking. In other words, students with a good performance automatically receive more difficult items, which allows them to show their full potential, whereas students with a lower performance automatically receive easier items. This is the basic idea of computer adaptive tests (CATs; Wainer, 2000a; van der Linden and Glas, 2010) or multistage tests (MSTs; Yan et al., 2014b; see also Luecht and Nungester, 1998). Whereas CATs select each item based on the students' performance, MSTs select predefined sets of items (i.e., test modules). MSTs have become more and more popular in recent years because they combine the advantages of adaptivity with the advantages of traditional linear tests. Compared to CATs, MSTs are easier to develop and implement, and they allow test developers as well as test takers to review items within a given test module (Yan et al., 2014a). Therefore, in our paper, we focus on the MST design as representative of a performance-based item assignment. A disadvantage of the MST design is that performance-based assignment is only possible after students have answered an initial untargeted set of items. This routing or starting module usually consists of items of moderate difficulty, and the module is administered to all students independent of their true ability (Hendrickson, 2007; Yan et al., 2014a; Zenisky and Hambleton, 2014). Hence, the starting module is most likely too easy for some of the high-ability students or too difficult for some of the low-ability students within the target population, that is, for students whose ability largely differs from the population's mean ability.
Taken together, neither targeted assignments based on ability-related background variables nor assignments based on performance ensure that all students receive items that completely match their true ability. An inappropriate test form or module measures the ability of the concerned students less efficiently (Lord, 1980) and might even impair the students' performance owing to decreased motivation or excessive demand (e.g., Asseburg and Frey, 2013; Wise, 2014). Therefore, we extended previous research on efficient test designs by investigating whether measurement efficiency can be improved by combining targeted assignment based on ability-related background variables with performance-based assignments of test modules of varying difficulty. To this end, we introduced the targeted multistage test (TMST) design as a new design type that considers both preliminary ability-related background information for a targeted assignment at the beginning of the test and performance during test taking for selecting matching test modules. By means of simulations, we compared the efficiency of traditional targeted test designs, MST designs, and TMST designs for estimating student ability under the Rasch model (Rasch, 1960). In this way, we not only provided new insights on the measurement efficiency of the combination of targeted and performance-based testing (i.e., the TMST design) but also allowed for comparing the efficiency of targeted test designs with those of MST designs, and, thus, for contrasting test assignment based on ability-related background variables vs. test assignment based on performance. In addition, we explored how different groups of students—namely, students whose abilities differ from the mean ability of the total population or of their performance group—benefit from or are disadvantaged by the three different design types. Furthermore, we investigated the extent to which the efficiency of the different designs depends on the degree of ability distribution overlap of the groups and the starting module length.
Efficient Measurement Based on Item Response Theory
As stated by Lord (1980), “an examinee is measured most effectively when the test items are neither too difficult nor too easy for him” (p. 150), implying that, ideally, students differing in ability should be assessed with different test booklets or item sets of varying difficulty to efficiently measure each student's ability (Weiss, 1982). Nonetheless, the resulting test scores should be directly comparable, even though students worked on different items included in easy, moderate, or difficult test booklets. Item response theory (IRT) is a powerful measurement approach that fulfills this requirement (Kolen and Brennan, 2014). IRT refers to a family of models that express the probability of a student solving an item correctly as a function of student ability and item difficulty (Lord, 1980). For the Rasch model—the simplest unidimensional IRT model—the probability of a student solving a specific item correctly is given by
where θi represents the ability of student i, and βj represents the difficulty of item j (Rasch, 1960; Rost, 2004). Given this relationship, student ability and the related standard error can be estimated by various maximum likelihood procedures.
Generally, the standard error of the estimated ability of student i can be approximated as Rost (2004)
where pij corresponds to the probability that student i answers item j correctly, as defined in equation (1). On one hand, we can infer from equation (2) that k, which refers to the total number of items answered by a student, is a crucial factor for estimating ability accurately according to the Rasch model. On the other hand, we can deduce from equation (2) that the accuracy of the ability estimation depends on the relationship of the student's ability and the difficulty of the items in a given test, as discussed earlier. Student ability can be estimated most accurately under the Rasch model if the difficulty of the items in the test corresponds to the ability of the student (Lord, 1980; Rost, 2004).
In practical settings, test length (i.e., the number of items) is often predefined according to the available testing time. This leaves optimization of the relationship between student ability and item difficulty as the only option for improving the accuracy of ability estimation and thus for enhancing the efficiency of a test. As a consequence, the idea of targeted testing arose to enhance measurement efficiency within a given testing time (e.g., Lord, 1971a,b,c, 1980; for a historical overview, see, e.g., Wainer, 2000b; Bejar, 2014).
Designs for Targeted Testing
As discussed earlier, two different approaches are used for assigning targeted items to students of varying ability levels: (1) assign students by means of ability-related background variables to test booklets of varying mean difficulties as in traditional targeted test designs (Mislevy and Wu, 1996), or (2) adaptively assign students based on their performance in a first test part to easy, moderate, or difficult subsequent test parts as in MSTs (Yan et al., 2014b). In the following, we will describe both test designs in more detail. In addition, we will elaborate on how to combine these two approaches to further enhance the targeting and thus measurement efficiency.
Traditional Targeted Test Designs
Targeted test designs consist of several test booklets of varying mean difficulties, and students are assigned to the most informative booklet via ability-related background variables, such as school grade, exam grade, courses taken, or performance-related school type (Mislevy and Wu, 1996). Students can be classified based on such background variables before test administration. The resulting ability groups are more homogeneous in terms of abilities than the overall sample. Subsequently, low-ability groups are assigned to easy test booklets, whereas high-ability groups are assigned to difficult test booklets. In an IRT framework, common items (i.e., link items), or a joint underlying calibrated item bank, ensure that the outcomes from the different test booklets can be represented on a single reporting scale for direct comparison (Kolen and Brennan, 2014). Unfortunately, to our knowledge, there are no empirical studies investigating the efficiency of targeted test designs.
A disadvantage of targeted test designs is that ability-related background variables are only an approximation of the student's true ability. Depending on the reliability of the ability-related background variable, students might still substantially differ in ability within one ability group. For performance groups at the secondary school level as a potential ability-related background variable, several studies found a large overlap between the abilities of students assigned to different secondary school types (e.g., Baumert et al., 2006; Angelone et al., 2013). For average exam grades, Moser et al. (2011) reported correlations of r = 0.69 and r = 0.70 between exam grade averages at the end of primary school in language and mathematics and achievement tests measuring abilities within the same subjects. For high school, the technical report of the Scholastic Assessment Test (SAT) referred to correlations around r = 0.50 between SAT scores and high school grade point averages for both language and mathematics (College Board, 2017). These findings support the assumption that an overlap occurs between the ability distributions of different groups, such that some students from the lower ability group outperform the students with the lowest abilities of the higher ability group. Students who largely differ from the mean ability of the group get an inappropriate test form, which measures their abilities less efficiently and might impair their performance due to decreased motivation or excessive demand (e.g., Asseburg and Frey, 2013; Wise, 2014). Pohl (2013) raised similar concerns for longitudinal MSTs, where pretest results serve as a basis for routing to different test forms at later measurement occasions. In a simulation study, she showed that correlations below r = 0.70 between the pretest results and the ability at the later measurement occasion can result in a significant number of heavily misallocated test forms. Furthermore, the study showed that the efficiency gains of longitudinal MSTs increased as the correlations increased when compared to conventional tests, especially for low-ability and high-ability students.
MST Designs
MST designs route students based on their performance to the most informative modules. Usually, they rely on IRT as a methodological framework for routing as well as for reporting standardized scores for all possible paths within the MST design (Weissman, 2014; Yan et al., 2014a). MSTs consist of two or more test parts (i.e., stages), including multiple modules of varying difficulty (Hendrickson, 2007; Zenisky et al., 2010; Yan et al., 2014b). At the end of each stage, predefined routing rules determine—based on the student's preliminary performance (i.e., based on preliminary ability estimates)—whether a student is assigned to an easier or more difficult module in the subsequent stage. Hence, the module assignment is based on objective cutoff scores and, more importantly, on a preliminary estimate of the same latent construct as that measured by the test as a whole. Several studies have highlighted the improved measurement efficiency of MSTs compared to linear tests for measuring ability over a wide range (for a general overview, see Hendrickson, 2007; Yan et al., 2014a; Zenisky and Hambleton, 2014). However, studies that compare the efficiency of MSTs with the efficiency of traditional targeted tests are missing to our knowledge.
From their simulation study, (Kim and Plake, 1993) concluded that the statistical characteristics of the starting module are significant determinants of an accurate ability estimation in MSTs. This results from the fact that MST designs usually do not differ between ability groups in the first stage but start with a single general starting module for the entire population, which mostly includes items of moderate difficulty (Hendrickson, 2007; Yan et al., 2014a; Zenisky and Hambleton, 2014). The purpose of the starting module is twofold (Lord, 1971b; Verschoor and Eggen, 2014): (1) it collects information for assigning students to the most informative module in the subsequent stage, and (2) it is part of the test itself with the aim to measure student ability as accurately as possible. A general moderately difficult starting module well fulfills the first but not necessarily the second purpose because it measures low ability and high ability in students less efficiently than the subsequent targeted modules. As already elaborated on for traditional targeted designs, low-ability and high-ability students might also be intimidated, frustrated, or bored due to the overload or underload, respectively, through the suboptimal MST modules (e.g., Asseburg and Frey, 2013; Wise, 2014).
The degree of discrimination through a suboptimal starting module depends on the length of the starting module in relation to the total test length (Verschoor and Eggen, 2014). The shorter the starting module is, the fewer mismatched items are administered to low-ability and high-ability students in the first stage and the more items remain for targeted testing in subsequent stages. At the same time, a short starting module involves the risk of routing errors due to low measurement precision, which, in turn, results in higher estimation errors of the overall ability estimates (Kim and Plake, 1993). Thus, the length of the starting module is an important factor that needs to be considered when analyzing the efficiency of MST designs.
TMST Designs
TMST designs refer to MST designs with more than one starting module, meaning they are a hybrid of targeted and MST designs. As in traditional targeted tests, based on ability-related background variables, students are assigned in stage 1 to the most informative of multiple starting modules of varying difficulty. Due to the lack of performance-based ability estimates, ability-related background variables are the best approximation of student ability at this stage of the test. In stage 2 and all subsequent stages, students are routed based on preliminary ability estimates to the most informative module as in traditional MSTs. By combining ability-related background variables and preliminary ability estimates for module selection, the TMST design aims to improve the match between student ability and item or module difficulty in the first stage compared to the MST design for all students whose abilities are well represented by the ability-related background variable. The performance-based routing after stage 1 aims to homogenize the ability groups further and correct possible misallocations of students whose abilities are poorly represented by the ability-related background variable.
TMST designs or MST designs with more than one starting module are very rare in practice (Hendrickson, 2007; Zenisky and Hambleton, 2014). Practical examples include the Massachusetts Adult Proficiency Tests (MAPT) for reading and mathematics (Sireci et al., 2008; Zenisky et al., 2009). In both tests, students are assigned based on the teachers' judgement of their so-called “Educational Functioning Levels” or based on previous test outcomes to the most informative module in stage 1. The MAPT for reading has also been evaluated in a research paper by Crotts et al. (2013). However, neither the technical manuals nor the related research paper have explicitly discussed or empirically analyzed the added value of having more than one starting module. In addition, we are not aware of any previous research that investigated the efficiency of TMSTs based on simulations.
The Present Study
The purpose of this study is to investigate whether TMST designs achieve more accurate and, therefore, more efficient ability estimates than traditional targeted test designs or MST designs with one starting module. We hypothesize that TMST designs enhance the accuracy of ability estimates compared to targeted test designs—similar to MST designs—through performance-based routing after stage 1 and that TMST designs outperform MST designs due to the targeted assignment of modules to different ability groups in stage 1.
In addition to this general research question, we explore the efficiency of TMST designs in more detail from three different perspectives. First, we investigate the extent to which the efficiency gain through TMST designs depends on the correlation between the ability-related background variable and students' true ability. Following Pohl (2013), we hypothesize that the efficiency gain is more prominent if the correlation between the ability-related background variable and the true ability is high, or, in other words, if the distance in mean ability between the resulting groups is large, and the overlap between their ability distributions is small.
Second, we examine the extent to which different ability groups profit or are disadvantaged by TMST designs compared to targeted and MST designs. In comparison with targeted designs, we expect an efficiency gain through TMST designs for students whose abilities are poorly described by the ability-related background variable (i.e., students with abilities that are deviant from the target ability group mean) because the performance-based routing after stage 1 allows for correcting the misallocation of these students to suboptimal starting modules. In comparison with MST designs, we expect an efficiency gain through TMST designs for students whose abilities differ from the mean of the total population (i.e., low-ability and high-ability students) and whose abilities are well described by the ability-related background variable (i.e., students with abilities close to the target ability group mean). In contrast, we expect an efficiency loss through TMST designs compared to MST designs for students with medium abilities who are classified by mistake into a low-ability or high-ability group because their ability is poorly described by the background variable.
Third, we explore the extent to which the efficiency gain through TMST designs depends on the length of the starting module compared to the total test length. As elaborated by Verschoor and Eggen (2014), the length of the starting module is an important factor in optimizing MST designs. However, clear general recommendations for distributing items between the starting and follow-up modules are missing for MST designs. Furthermore, the relationship between efficiency gain and starting module length becomes even more complex in the TMST design due to module assignment based on a combination of ability-related background variables and performance. Therefore, we explore this relationship in our study without stating a priori hypotheses.
To address these research questions and hypotheses, we conducted a simulation study, in which we varied the test design, the correlation between ability and the ability-related background variable, and the length of the starting module in relation to the total test length.
Methods
Ability Distributions and Population Distribution Conditions
For each simulation run, we drew three samples of 10,000 simulees randomly from three normal distributions to simulate students from three overlapping ability groups, where each group represented one of three levels of the ability-related background variable. To vary the correlation between the ability-related background variable and students' true ability, we manipulated the degree of overlap between the three groups through three population distribution conditions, as described in Table 1. In particular, we varied the difference d between the mean abilities of the groups. For the narrow condition, which reflected a low correlation between the ability-related background variable and students' true ability, the difference between the mean abilities was set to d = 0.5; for the medium condition to d = 1.0; and for the wide condition, which reflected a high correlation between the ability-related background variable and students' true ability, to d = 1.5. For all three distribution conditions, we assumed a standard deviation (SD) of 1 for each group. Besides the distribution parameters of the ability groups, Table 1 also includes the distribution parameters μ and σ of the related mixture populations given by
where μi and σi refer to the mean and the SD of the n = 3 ability groups, respectively, and wi refers to the relative weight of the distributions with (e.g., Frühwirth-Schnatter, 2006, p. 11). Furthermore, Table 1 displays Spearman's rank correlation ρ between the students' group classification (i.e., the grouping based on the ability-related background variable) and their true ability θ for each distribution condition. Following Pohl (2013), the narrow condition represented a low correlation between the ability-related background variable and the true ability (ρ = 0.38) that is clearly below the recommended minimal correlation of r = 0.70, the medium condition represented a medium correlation (ρ = 0.65) similar to the recommended minimal correlation, and the wide condition represented a high correlation (ρ = 0.79).
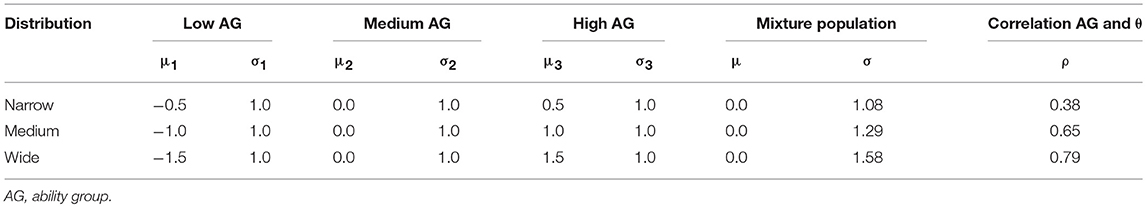
Table 1. Parameters of the normal distributions per ability distribution condition.
Test Designs
The simulation study included four different test designs: (1) a linear design, which served as the baseline condition; (2) a targeted design; (3) an MST design; and (4) a TMST design. For all four design conditions, test length was constrained to 30 items, which refers to the number of items that we expect students to answer within one school lesson (i.e., 45 min). We treated item difficulty parameters as known and did not specify any overlap between the different modules within a test design.
Linear Design
In the linear design condition, all simulees were assigned to the same 30 items. To accommodate for the different ability groups, we combined items targeted to the mean ability of all three groups in this test (i.e., 10 easy, 10 moderate, and 10 difficult items).
Targeted Design
In the targeted test design condition, we distinguished three different linear modules with 30 items each, which were targeted to the mean ability of the three ability groups. Thus, simulees from each group were assigned to their dedicated test module as indicated on the left in Figure 1.
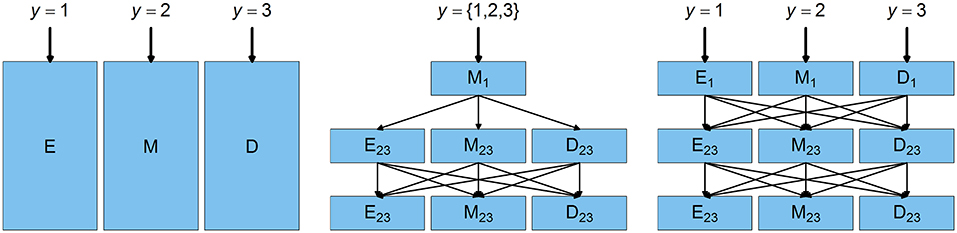
Figure 1. Illustration of the targeted, MST, and TMST designs. y, ability-related background variable (e.g., grades in school); E, easy module, M, moderate module, D, difficult module; E1, M1, and D1, starting modules in stage 1; E23, M23, and D23, modules of stages 2 and 3.
MST Design
The MST was a 1-3-3 design consisting of three stages and seven modules as indicated in the middle of Figure 1. Simulees from all three ability groups were assigned to a single starting module of moderate difficulty in stage 1. In stage 2 and stage 3, simulees were assigned to an easy, moderate, or difficult module depending on their performance in the preceding stage. The two routing cutoff scores, c1 and c2, as indicated in Table 2, were defined at the percentiles P33 and P66 of the mixture population to guide an equal number of simulees to each module of stages 2 and 3. The difficulties of the items within the different modules were varied depending on the target difficulty of the module (i.e., easy, moderate, difficult) and the ability distribution condition (i.e., narrow, medium, wide), as described in more detail in the next section of this paper.
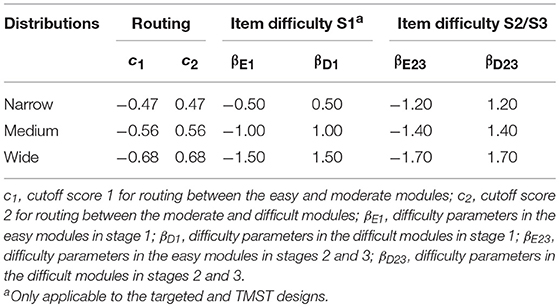
Table 2. Routing cutoff scores and item difficulty parameters of easy and difficult modules in stage 1 and in stage 2/3 per ability distribution condition.
TMST Design
The TMST was a 3-3-3 design consisting of three stages with three modules each. In the first stage, simulees from each ability group were assigned to their dedicated starting module, as shown on the right in Figure 1. Simulees from the low-ability group were assigned to the easy module, simulees from the medium-ability group were assigned to the moderate module, and simulees from the high-ability group were assigned to the difficult module. As in the MST design, the routing cutoff scores in the TMST design were defined based on the percentiles P33 and P66 of the mixture population (see Table 2), and simulees were guided to the easy, moderate, or difficult modules in stages 2 and 3 based on their performance in the preceding stage. The difficulties of the items within the different modules were varied depending on the target ability group (i.e., low-, medium-, high-ability) for modules in stage 1, the target difficulty of the module (i.e., easy, moderate, difficult) for modules in stages 2 and 3, and the ability distribution condition (i.e., narrow, medium, wide).
Starting Module Length
For the MST and TMST conditions, we distinguished four different variations of starting module lengths corresponding to , , , and of the total test length. In all four conditions, the starting modules contained an even number of items to allow for dividing the remaining items equally over the two subsequent stages. The shortest starting modules consisted of 6 items with a remaining 12 items each for stages 2 and 3, the second condition consisted of 8 items in stage 1 with a remaining 11 items each for stages 2 and 3, the third condition consisted of 10 items in each of the three stages and represented the main condition regarding starting module length, and the fourth condition consisted of 16 items in stage 1 with a remaining 7 items each for stages 2 and 3. The length of the starting modules was only varied in combination with the medium ability distribution condition. The narrow and the wide ability distribution conditions were only combined with the main length condition, which included 10 items in each of the three stages (i.e., of the total test length).
Item Pools
For each simulation condition, we generated a dedicated set of dichotomous Rasch items targeted to the specific characteristics of the test design and the ability distributions. To simplify matters and to facilitate comparing different conditions, we specified homogeneous item difficulty parameters within each module according to the following rules: The difficulty parameters of the items of all modules of moderate difficulty were set to β = 0 for all stages and all conditions. For stage 1 and for the modules of the targeted design, we specified the item difficulty parameters of the easy and difficult modules based on the mean of the target population. For the easy and difficult modules in stages 2 and 3, we specified the item difficulty parameters based on the expected mean ability of the assigned subgroup created by the routing under the assumption of no routing errors, that is, based on the rounded mean of the three truncated normal distributions resulting from the two cutoff scores (Barr and Sherrill, 1999). Table 2 provides an overview of the resulting item difficulties for the three stages combined with the three ability distribution conditions.
Item Response Generation and Ability Estimation
Altogether, the simulation study included 18 different conditions, which are summarized in Table 3. Of these conditions, 12 resulted from the combination of the three population distributions (i.e., narrow, medium, and wide) with the four test designs (i.e., linear, targeted, MST, and TMST). Furthermore, for the MST and TMST designs under the medium distribution condition, we investigated three additional variations of module length (i.e., starting module length equal to , , and of the total test length), which resulted in six additional conditions. For each condition, we generated 1,000 data sets with data related to 30,000 simulees1. For each simulee i, each data set included the true ability θi, the assigned items, the estimated ability , and its standard error SE. To estimate student ability, we used the weighted maximum likelihood (WML) method proposed by Warm (1989).
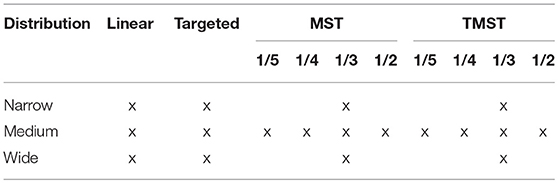
Table 3. Overview of the 18 simulation conditions.
Evaluation Criteria
Root Mean Square Error
To determine the accuracy of ability estimation based on the different test designs, the root mean square error (RMSE) of the ability estimates was computed for each simulation run l as
where i represents the simulees within one run l; m represents the total number of aggregated simulees within this run; and denotes the estimate of the student ability θ. For each simulation condition, RMSE() was calculated on three different levels: (1) over the total mixture population for each simulation run (m = 30,000), (2) for each ability group within each simulation run (m = 10,000), and (3) for intervals of 0.1 on the theta scale to investigate measurement accuracy in relation to student ability. On this level, the number of aggregated simulees m depended on the frequency distribution of the simulees over the theta scale as defined for the three distribution conditions. In addition, the overall mean RMSE() over the 1,000 simulation runs was calculated for each simulation condition for the mixture population as well as for each ability group as
Efficiency Gain Over the Targeted and the MST Designs
To facilitate comparing the efficiency of the different designs with the efficiency of the targeted and the MST designs, we translated the differences in mean RMSE() between each design D and the related targeted or MST designs into numbers of items required to compensate for these differences. Under the constraint that the properties of the sample and of the item pool remain constant, we can conclude from equation (2) that the standard error SE() is inversely proportional to the square root of the number of items k:
Based on this relationship and following the definition of relative efficiency by Lord (1980), we calculated the efficiency gain of design D over the targeted design, GainT, and over the MST design, GainMST, as
GainT and GainMST refer to the relative efficiency of the designs compared to the targeted and the MST designs expressed in numbers of items, and, therefore, serve as indicators of the practical meaning of the differences in mean RMSE() between the designs (i.e., “how many extra items do we need?”).
Analysis of Variance and Effect Sizes
Variation of RMSE() over the simulation runs between the different simulation conditions was further analyzed by two-way analyses of variance (ANOVAs). In the first set of ANOVAs, we compared RMSE() over the four design conditions combined with the three ability distribution conditions within the mixture population as well as within the three ability groups. In the second set of ANOVAs, we compared RMSE() over the MST and the TMST design conditions combined with the four starting module length conditions within the mixture population as well as within each ability group. To facilitate comparing the effects and interactions among the manipulated factors (i.e., population distribution, test design, and starting module length), effect size η2 was calculated as
where SSbetween is the sum of squares between effects, and SStotal is the total sum of squares of the model (Richardson, 2011).
Match Between True Ability and Module Difficulty
We investigated the match between students' true ability θ and module difficulty as a potential source for differences in the efficiency of the different designs, the different distribution conditions, and the different student abilities. To this end, we calculated the percentage of correctly allocated, slightly misallocated, and heavily misallocated simulees per ability group and stage under the three distribution conditions by following Pohl (2013). In stage 1, simulees were classified as correctly allocated to the easy, moderate, and difficult modules if their ability θ was below the mean of μ1 and μ2, between the mean of μ1 and μ2 and the mean of μ2 and μ3, and above the mean of μ2 and μ3, respectively (see Table 1 for the mean ability of each group under the three distribution conditions). In stages 2 and 3, simulees were classified as correctly allocated to the easy, moderate, and difficult modules, if their ability θ was below the routing cutoff score c1, between the two cutoff scores c1 and c2, and above the cutoff score c2, respectively (see Table 2 for the routing cutoff scores under each distribution condition). Independent of the stage, simulees were classified as slightly misallocated if they were assigned to a module that was either one level too high or one level too low; they were classified as heavily misallocated if they were assigned to a difficult instead of an easy module or vice versa.
Results
RMSE() of the Mixture Population Per Design and Distribution Condition
Mean RMSE() and Efficiency Gain Over the Targeted and MST Designs
As an indicator of overall efficiency, Table 4 provides an overview of the mean RMSE() over the 1,000 simulation runs under each of the different distribution-by-design combinations for the mixture population and the three ability groups. Results for the low-ability and high-ability groups are displayed together because they were identical given the symmetrical distributions of student ability and module difficulty. To indicate the relative overall efficiency of the different designs, Table 4 reports on the relative efficiency gain (or loss) compared to the targeted design and the MST design within the corresponding distribution condition. Furthermore, Table 5 provides information about the relative effects of the different factors of the simulations on RMSE().
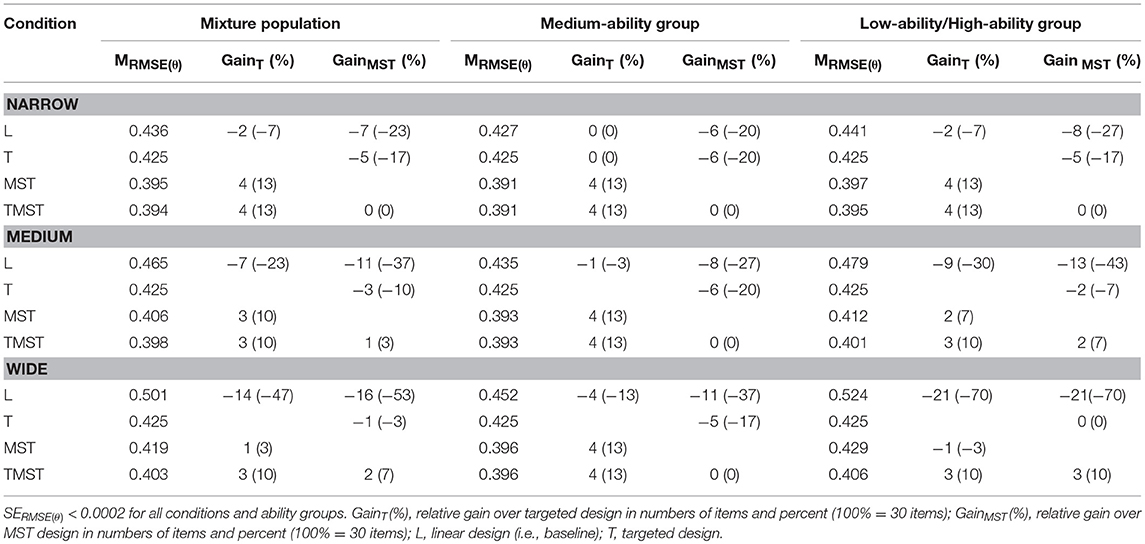
Table 4. Mean RMSE() and relative gain over targeted and MST designs per distribution condition and ability group.
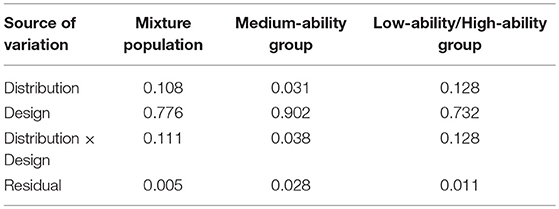
Table 5. Effect sizes (η2) for main effects and interactions of the factors distribution and design on RMSE().
With regard to the total (i.e., mixture) population, the TMST design reached—as hypothesized—the lowest mean RMSE() of all four design conditions within all three distribution conditions. Furthermore, the MST design outperformed the targeted design, which, in turn, outperformed the linear design. The overall efficiency gain of the TMST design over the targeted design was larger within the narrow design condition (i.e., when the correlation between the ability-related background variable and the ability was low) than within the medium and wide distribution conditions. While the mean RMSE() of the targeted design was equal for all distribution conditions [MRMSE(θ) = 0.425], the mean RMSE() of the TMST design was lowest in the narrow distribution condition and highest in the wide distribution condition [MRMSE(θ) Narrow = 0.394; MRMSE(θ) Medium = 0.398; MRMSE(θ) Wide = 0.403]. In terms of numbers of items, the efficiency gain within the narrow condition corresponded to GainT = 4 additional items, or an increase of the total test length by 13%, to achieve the same accuracy with the targeted design as with the TMST design. Within the medium and the wide conditions, the efficiency gain corresponded to GainT = 3 additional items (i.e., 10% of the total test length).
The results of the overall efficiency gain of the TMST design compared to the MST design were also in line with our hypothesis: the highest efficiency gain was achieved in the wide condition, whereas no observable efficiency gain occurred in the narrow condition. As for the TMST design, the mean RMSE() of the MST design was lowest in the narrow and highest in the wide distribution condition [MRMSE(θ) Narrow = 0.395; MRMSE(θ) Medium = 0.406; MRMSE(θ) Wide = 0.419]. However, differences between the distribution conditions were larger for the MST than for the TMST design. In the narrow condition, the MST and TMST designs resulted in similar mean RMSE() such that no efficiency gain in terms of number of items was found. In the medium condition, the difference in mean RMSE() between the MST and TMST designs corresponded to an efficiency gain of GainMST = 1 additional item (i.e., 3% of the total test length), and the difference in the wide condition corresponded to an efficiency gain of GainMST = 2 additional items (i.e., 7% of the total test length).
These results were also reflected by effect sizes calculated based on the two-way ANOVA for the mixture population for the two factors distribution and design (see the second column of Table 5). The design showed by far the largest effect on RMSE() with η2 = 0.776, meaning that the design explained 77.6% of the variance in RMSE() between the different simulation conditions. The main effect of the distribution was η2 = 0.108, and the interaction of the distribution and the design was η2 = 0.111. All effects were statistically significant.
RMSE() in Relation to Ability
Figure 2 shows the distribution of RMSE() in relation to the true ability θ over a range from −2.6 to 2.6 (i.e., ±two SDs of the mixture population under the medium condition) for the different designs and the different distribution conditions. Furthermore, Figure 2 illustrates the number of students in relation to θ for each ability group and for the mixture population for all three distribution conditions. In general, RMSE() was similar for all four designs close to the mean of the mixture population (i.e., θ = 0), and differences in RMSE() increased as expected toward more extreme abilities. Independent of the design condition, RMSE() was generally higher for more extreme abilities because all designs included items targeted to the mixture population mean, the ability groups, or the routing groups.
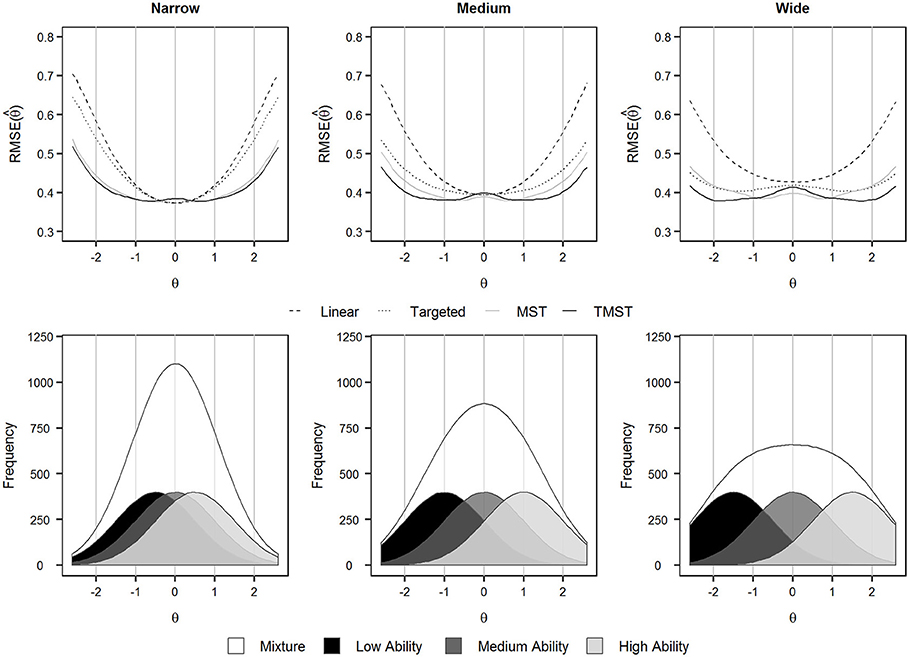
Figure 2. RMSE() in relation to ability for the different designs under the three distribution conditions and related frequency distributions of the ability groups.
As hypothesized, we found the smallest differences in RMSE() between the different designs under the narrow condition, where the correlation between the group categorization (i.e., the ability-related background variable) and the true ability was small (see the top-left graph in Figure 2). Close to θ = 0, RMSE() was slightly lower for the linear and targeted designs than for the MST and TMST designs. The minimum of the RMSE() distribution was at θ = 0 for the linear and targeted designs, whereas RMSE() increased toward θ = 0 for the MST and TMST designs. However, RMSE() was clearly lower for the MST and TMST designs than for the other two designs for low and high abilities. In line with the mean RMSE() reported in Table 4, differences in RMSE() between the MST and TMST designs were very small, whereas the TMST design reached slightly lower RMSE() for low and high abilities.
Under the medium distribution condition displayed in the center graph of Figure 2, differences in RMSE() between the designs were again small for average abilities close to θ = 0. RMSE() decreased from θ = 0 toward low and high abilities for the MST and TMST designs before it increased toward the extremes. For the linear and the targeted designs, RMSE() directly increased from average abilities toward the extremes. The TMST design provided the most accurate ability estimates for low and high abilities. The MST design, in turn, provided more accurate estimates than the targeted design, and the linear design provided the least accurate estimates for low and high abilities.
Under the wide distribution conditions, where the correlation between the group categorization and the true ability was large, the MST design achieved lower RMSE() for abilities close to θ = 0 than the other three designs (see the top-right graph in Figure 2). From θ = 0 toward low and high abilities, RMSE() decreased for the targeted, the MST, and TMST designs before it increased toward the extremes. Only the linear design reached its lowest RMSE() at θ = 0. The decrease in RMSE() was more prominent for the TMST design than for the targeted and MST designs, and the MST design reached its lowest RMSE() closer to θ = 0 than the two targeted designs. Consequently, the TMST design achieved lower RMSE() values for low and high abilities than the other three designs. Similarly, the targeted design resulted in low RMSE() for low and high abilities, and it even slightly outperformed the MST design at the extremes.
In sum, the results were consistent with our hypotheses. The combination of targeted and performance-based module assignment in the TMST design resulted in low RMSE() values, especially for low and high abilities. By far, the variation of the design showed a larger effect on RMSE() than the variation of the population distribution. Nevertheless, the efficiency gain of the TMST design over the other designs was larger under the wide condition than under the narrow condition. Under the narrow condition, differences were small not only between the mean abilities of the groups but also between the mean difficulties of the starting modules targeted to the different group means. Thus, all starting modules provided a similar amount of information close to θ = 0 under the narrow condition but provided limited information for more extreme abilities. In contrast, differences were large between the groups' mean abilities and the modules' mean difficulties under the wide condition. As a consequence, targeted module assignment in stage 1 was much more crucial and effective under the wide condition than under the narrow condition, especially for low and high abilities. For medium abilities, however, the MST design was the safest option because it prevented misallocation to a too-easy or too-difficult starting module. The increase of RMSE() of the MST and TMST designs close to θ = 0, which was also observed for the targeted design under the wide condition, indicates that some simulees were either assigned or routed to suboptimal modules, which resulted in less efficient ability estimates. As the distributions widen, the modules differ more, and the consequences of possible misallocations increase.
RMSE() of the Ability Groups Per Design and Distribution Condition
Mean RMSE() and Efficiency Gain Over the Targeted and MST Designs
Results for the overall efficiency of the different designs per ability group are displayed in Table 4. In addition, Table 5 includes the η2-values for the main effects and interactions of the factors population distribution and design on RMSE() for the different ability groups. For the medium-ability group, the MST, and TMST designs resulted in identical mean RMSE() values independent of the distribution condition. This result is given by the fact that the medium starting module of the TMST design corresponded to the general starting module of the MST design. The MST and TMST designs (i.e., the two designs with performance-based module assignments) clearly outperformed the targeted and the linear design under all three distribution conditions. Four additional items, or an increase of the total test length by 13%, would be required to achieve the same accuracy with the targeted design as with the MST and TMST designs. According to the ANOVA for the medium-ability group, the factor design showed the largest effect on RMSE() with η2 = 0.902. Thus, even though the MST and the TMST designs did not differ, the design explained 90.2% of the variance in RMSE() between the different simulation conditions in the medium-ability group [distribution: η2 = 0.031; interaction: η2 = 0.038], which underlines the advantage of performance-based routing for the medium-ability group.
For the low-ability and high-ability groups, the TMST design provided—as expected—the lowest mean RMSE() values. As reported for the mixture population, differences in mean RMSE() between the different designs increased from the narrow to the wide distribution condition. Under the narrow condition, the MST and TMST designs achieved comparable mean RMSE() values for the low-ability and high-ability groups [MRMSE(θ) MST = 0.397; MRMSE(θ) TMST = 0.395]. These values were clearly lower than the mean RMSE() of the targeted [MRMSE(θ) = 0.425] and the linear designs [MRMSE(θ) = 0.441]. In contrast, the targeted design slightly outperformed the MST design for the low-ability and high-ability groups under the wide condition [MRMSE(θ) Targeted = 0.425; MRMSE(θ) MST = 0.429], whereas the TMST design reached the lowest mean [MRMSE(θ) = 0.406] again. The efficiency gain of the TMST design over the MST and targeted designs corresponded to GainT = GainMST = 3 additional items or an increase of the total test length by 10%. In line with these results, the main effect of the population distribution on RMSE() was η2 = 0.128 and, therefore, was higher for the low-ability and high-ability groups than the effect reported above for the medium-ability group. The main effect of the design and the effect of the interaction were η2 = 0.732 and η2 = 0.128, respectively. Thus, the design also explained the largest percentage of the variance in RMSE() between the different simulation conditions for the low-ability and high-ability groups.
In sum, the overall results for the different ability groups demonstrate that the reported difference in mean RMSE() between the MST and TMST designs for the mixture population originates from the differing efficiency of these two designs with regard to the low-ability and high-ability groups. In line with our hypothesis, simulees of the low-ability, and high-ability groups profited from the targeted module assignment in the first stage of the TMST, especially under the wide distribution condition. For all simulees of the medium-ability group, it made no difference whether their ability was estimated based on an MST design or a TMST design. In both designs, the medium-ability group clearly profited from the performance-based routing.
RMSE() in Relation to Ability
Figure 3 shows the distribution of RMSE() in relation to the true ability θ per ability group for the targeted and TMST designs, as well as for the different distribution conditions. In addition, it includes the number of students in relation to θ for each ability group and for the mixture population for each distribution condition. For the MST design, RMSE() did not differ for the three ability groups within a distribution condition because the ability-related background variable had no influence on the module selection in this design condition. The results for the MST design corresponded again to the results for the medium-ability group of the TMST design because both conditions included identical starting modules.
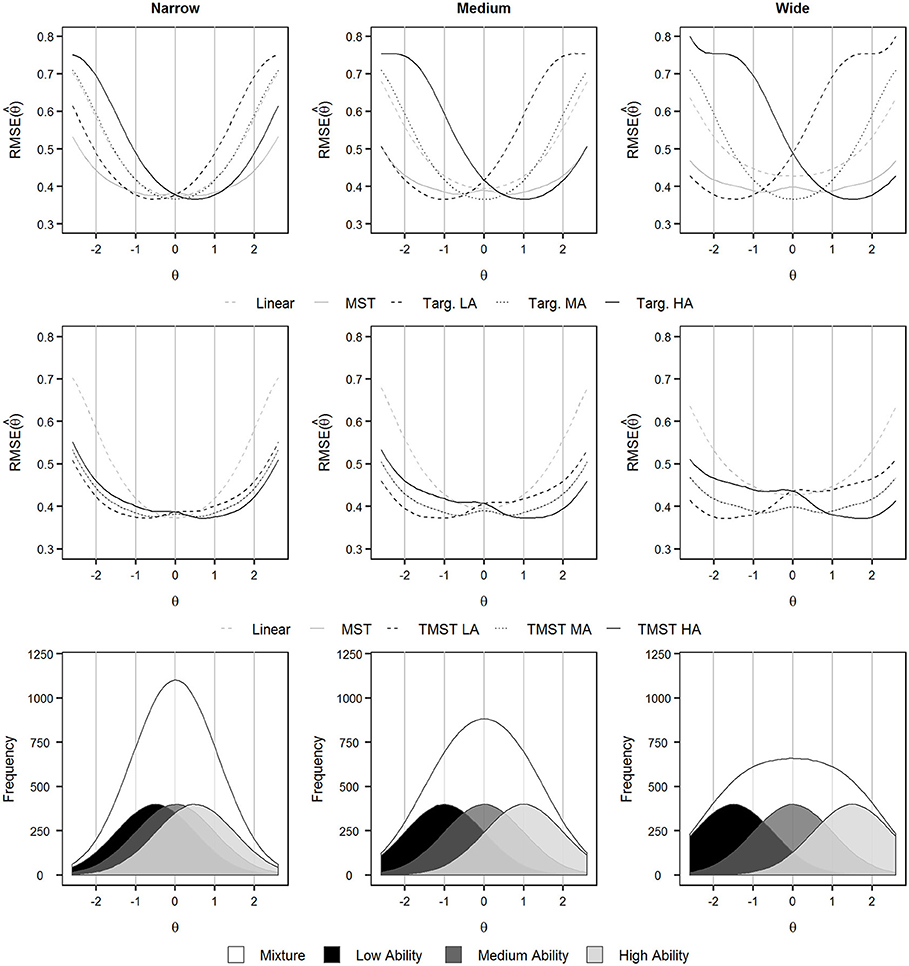
Figure 3. RMSE() in relation to ability per ability group for the different designs under the three distribution conditions, and related frequency distributions of the ability groups. Targ., targeted test design; LA, low-ability group; MA, medium-ability group; HA, high-ability group.
In general, Figure 3 displays similar results patterns for all three distribution conditions. Differences between the designs and the ability groups were again more prominent for the wide than for the narrow distribution condition. As hypothesized, the targeted and TMST designs resulted in the lowest RMSE() values for abilities close to the mean ability of the low-ability and high-ability groups. Both targeted designs outperformed the MST design for these ability ranges. The TMST design outperformed the targeted design for abilities that differed from the mean ability of their group and thus were poorly represented by the ability-related background variable (i.e., high-ability simulees in the low-ability group and vice versa). Hence, the TMST design allowed for compensating for possible suboptimal module assignment in the first stage through performance-based routing to the modules of the second and third stages. However, the MST design again provided lower RMSE() values than the TMST design for abilities that clearly differed from the group mean, such as high-ability simulees in the low-ability group and low-ability simulees in the high-ability group. Nevertheless, it is important to contrast these results with the frequency distributions of the different ability groups and the mixture population displayed at the bottom of Figure 3. The number of simulees with abilities close to the group mean was high by design, meaning that, overall, the number of simulees who benefited from the targeted assignment in the first stage of the TMST was larger than the number of simulees who were disadvantaged because the ability-related background variable did not correspond to their abilities. As a consequence, mean RMSE() was generally lower for the TMST design than for the MST design (see Table 4).
For the medium-ability group, results of the TMST design differed from our expectations. As shown by the central row of graphs in Figure 3, the minimum RMSE() distribution did not coincide with the mean ability of the medium-ability group. Instead, RMSE() was lowest between the mean of the low-ability group and the mean of the medium-ability group or between the mean of the medium-ability group and the mean of the high-ability group, and it slightly increased toward θ = 0. This result corresponds to the RMSE() distributions of the MST and TMST designs for the mixture population as displayed in Figure 2. Given that the starting module was targeted to the mean ability of the medium-ability group, the increase of RMSE() within the group cannot be explained by assignment errors but must be a result of routing errors based on inaccurate preliminary ability estimates after stage 1. The risk of routing errors increases the closer the abilities are to the two routing cutoff scores (Weissman, 2014). The medium-ability group was located in between the two routing cutoff scores, such that the abilities of a vast majority of simulees within this group were relatively close to one of the two cutoff scores. Hence, they were more likely to be misallocated to a too-easy or too-difficult module than simulees from the low-ability or high-ability groups. Furthermore, routing errors had a larger impact on intermediate abilities, which clearly differed from the target difficulty of the easy and difficult modules. As a consequence, the abilities of average simulees within the medium group were estimated most efficiently with the traditional targeted design, which does not include any performance-based routing, making it resistant to routing errors.
Match Between True Ability and Module Difficulty Per Ability Group
Figure 4 displays the percentage of correctly allocated, slightly misallocated, and heavily misallocated simulees for the MST and TMST designs2 for the medium-ability and low-ability or high-ability groups and for each stage under the different distribution conditions. In general, the percentage of correctly allocated simulees was higher under the wide distribution condition than under the narrow condition. This result confirmed our hypothesis that TMST designs are more efficient if the correlation between the ability-related background variable and the true ability is high. A clearer distinction between the three ability groups as under the wide condition not only resulted in better targeting in stage 1 of the TMST design but also seemed to result in fewer routing errors. Furthermore, the percentage of correctly allocated simulees strongly increased from stage 1 to stage 2 and slightly increased from stage 2 to stage 3. Thus, the performance-based routing after stage 1 considerably increased the match between ability and module difficulty independent of the design and the ability group. In stages 2 and 3, the percentage of correctly allocated simulees was slightly higher in the low-ability and high-ability groups than in the medium-ability group. This finding strengthens our argument that simulees from the medium-ability group are more likely to be misrouted to a too-easy or too-difficult module than simulees from the low-ability or high-ability groups because a large proportion of simulees in the medium-ability group have abilities close to one of the two routing cutoff scores.
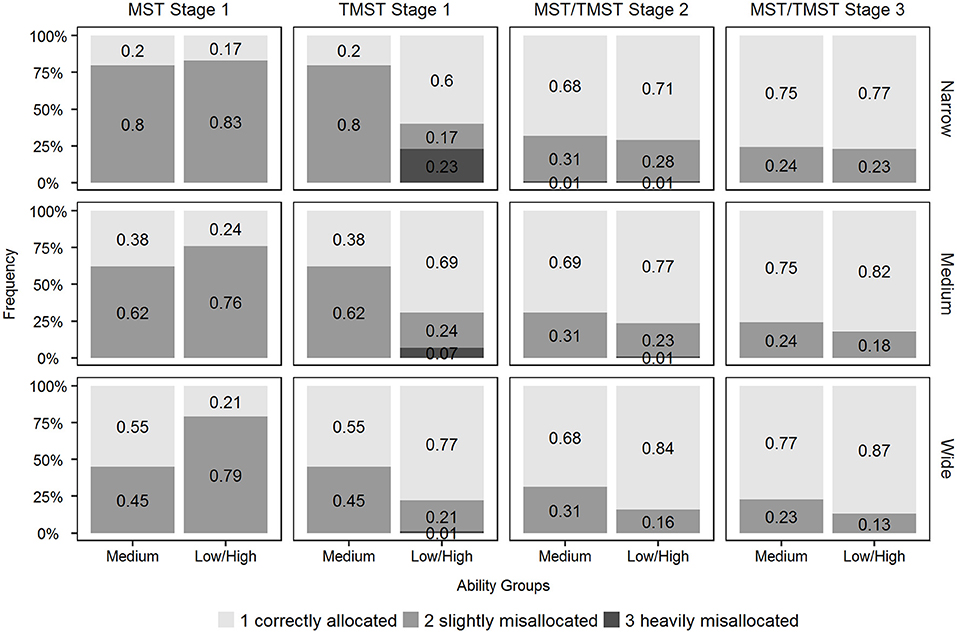
Figure 4. Match between θ and module assignment per ability group and stage for the MST and TMST designs under the three distribution conditions.
Results for the MST and TMST designs were comparable for the medium-ability group in stage 1 as well as for all comparisons within stages 2 and 3. However, the targeted module assignment in stage 1 of the TMST design allowed for increasing the percentage of correctly allocated simulees within the low-ability and high-ability groups from ~20% to over 60% compared to the MST design. This finding is consistent with our hypothesis that the TMST design is especially efficient for students whose abilities differ from the mean ability of the total population. On the downside, the TMST design resulted in 22% of heavily misallocated simulees under the narrow distribution condition, whereas heavy misallocation was not possible in the MST design given one single starting module of moderate difficulty. Nevertheless, the percentage of heavily misallocated simulees in stage 1 of the TMST design considerably decreased as the distance between the ability groups increased, such that only 1% of the simulees of the low-ability or high-ability groups were heavily misallocated under the wide condition. Because the MST and TMST designs showed very similar patterns for the match of ability and module difficulty for stages 2 and 3, we combined the results of both designs for these stages in Figure 4. The corresponding percentages of correctly and incorrectly allocated simulees suggest that the accuracy of the routing to stages 2 and 3 was not impaired by either differences in the number and difficulty of starting modules or by differences in the match between ability and module difficulty between the MST design and the TMST design.
RMSE() in Relation to the Starting Module Length
Mean RMSE() and Efficiency Gain Over the MST Design
The length of the starting modules of the MST and TMST designs (i.e., the number of items in stage 1 compared to stages 2 and 3) was varied under the medium distribution condition. Table 6 displays the mean RMSE() of the MST and TMST designs as well as the efficiency gain of the TMST design over the MST design (GainMST) for starting modules with a length that corresponded to , , , and of the total test length. In addition, Table 7 displays the effect sizes for the main effects and the interaction of the factors design and starting module length on RMSE() for the mixture population as well as for the ability groups.
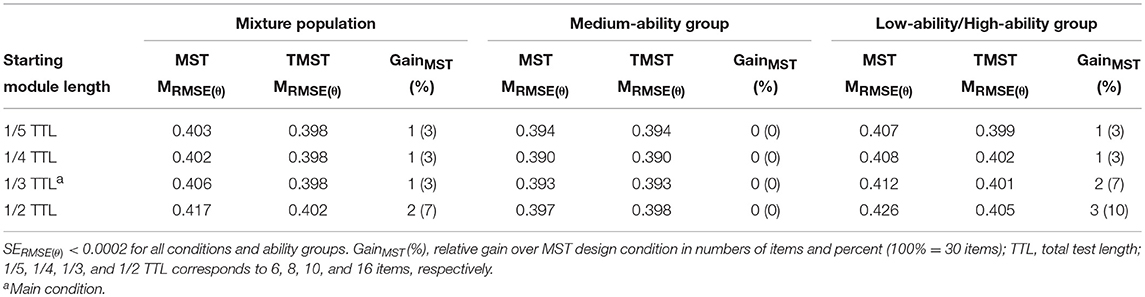
Table 6. Mean RMSE() and gain of TMST over MST design for MST and TMST designs with different starting module lengths per ability group.
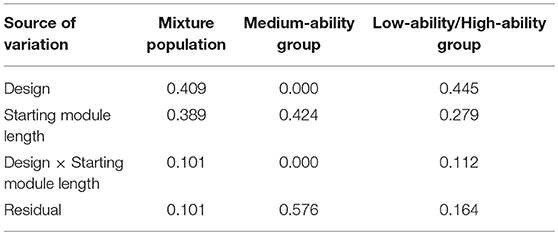
Table 7. Effect sizes (η2) for main effects and interactions of the factors design (MST vs. TMST) and starting module length on RMSE().
For the mixture population, we found that longer starting modules resulted in higher mean RMSE() values for both designs. If the starting module length corresponded to , , or of the total test length, the TMST design was slightly more efficient than the MST design. In all three conditions, we would need to extend the MST design by one item, or 3% of the total test length, to achieve the same accuracy as with the TMST design. When starting modules of of the total test length were used, differences in mean RMSE() between the two designs increased. For this condition, the mean RMSE() of the MST design was MRMSE(θ) = 0.417, and the RMSE() of the TMST design was MRMSE(θ) = 0.402. The difference in RMSE() between the two designs, or, rather, the efficiency gain of the TMST design over the MST design, corresponded to GainMST = 2 items or an increase of the total test length by 7%. The effect of the starting module length on RMSE() was η2 = 0.389; thus, it was almost as large as the effect of the design on RMSE() with η2 = 0.409 (see Table 7). The interaction of the design and the starting module length explained the additional 10.1% of the total variance of RMSE() between the different simulation conditions.
For the medium-ability group, the MST and TMST designs resulted again in identical mean RMSE() values. Accordingly, we found no main effect of the design and no interaction effect for the medium-ability group [i.e., η2 = 0.000]. Mean RMSE() was lowest for this group if the starting module length corresponded to of the total test length [MRMSE(θ) = 0.390], whereas it increased for shorter as well as for longer starting modules. The starting module length accounted for 40.4% of the total variance in RMSE() between the different simulation conditions for the medium-ability group.
For the low-ability and high-ability groups, mean RMSE() was lowest for the TMST design with starting modules of of the total test length [MRMSE(θ) = 0.399] and highest for the MST design with a starting module of of the total test length [MRMSE(θ) = 0.426]. The main effect of the design [η2 = 0.445] was larger than that of the starting module length [η2 = 0.279]. Differences in mean RMSE() between the two designs were larger for longer starting modules than for shorter ones. The related interaction effect was η2 = 0.112. If the starting module length corresponded to of the total test length, we would need to extend the MST design by two items, or 7%, to achieve the same accuracy as with the TMST design. If the starting module length corresponded to of the total test length, we would even need to extend the MST design by three items, or 10%, to achieve the same accuracy as with the TMST design.
In summary, the starting module length was much more relevant for the MST design than for the TMST design, and it was especially relevant for the medium-ability group. The longer the starting module of the MST design, the more disadvantaged were simulees of the high-ability and low-ability groups by the general starting module of moderate difficulty. In contrast, the starting modules of the TMST design were generally more efficient thanks to their targeting to each ability group, causing the length of the starting module to be less relevant under this design condition.
RMSE() in Relation to Ability
Figure 5 shows the distribution of RMSE() in relation to the true ability θ for the MST and TMST designs and the different starting module length conditions. As a reference, the two graphs include the distribution of RMSE() for the linear and traditional targeted designs. In line with the reported differences in mean RMSE(), we found larger differences between the length conditions for the MST design than for the TMST design. Especially noteworthy were the results related to the longest starting modules (i.e., of the total test length). The graph on the right in Figure 5 indicates that the distribution of RMSE() of the TMST design with such long starting modules was similar to those of the shorter conditions, and it achieved clearly lower RMSE() values for high and low abilities than the traditional targeted design. However, as displayed on the left in Figure 5, the distribution of RMSE() of the MST design with the longest starting module showed a stronger increase of RMSE() toward low and high abilities than the other three length conditions and, thereby, reached RMSE() values comparable to that of the targeted design. Thus, the performance-based routing of the MST design was comparably efficient as the sole a priori assignment of modules based on an ability-related background variable in the targeted design if the first stage included half of the total test.
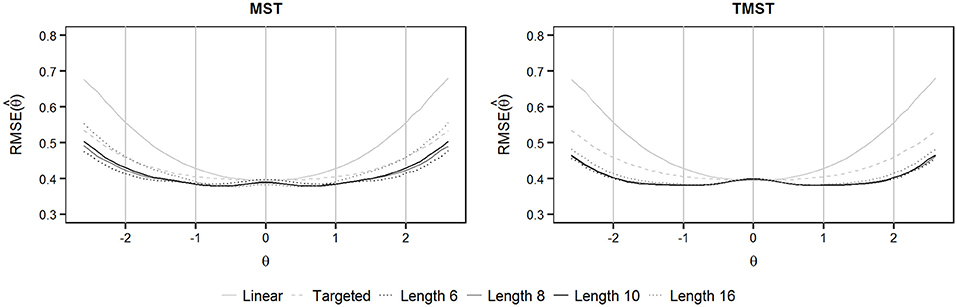
Figure 5. RMSE() in relation to ability for the MST and TMST designs with different lengths of starting modules.
Finally, Figure 6 shows RMSE() in relation to ability for the different designs by ability group for each length condition. The general curve for the MST design was again overlapping with the curve of the TMST design for the medium-ability group. For the TMST design, Figure 6 indicates that as the starting module length increased, so did the differences between the ability groups at a given ability. Nevertheless, RMSE() was low for simulees close to the mean of the target ability group and, thus, for the broad majority of simulees under all four length conditions (cf. the distributions displayed in Figures 2, 3). Only a limited number of simulees with abilities deviant from the mean ability of their ability group were disadvantaged by long, misallocated starting modules.
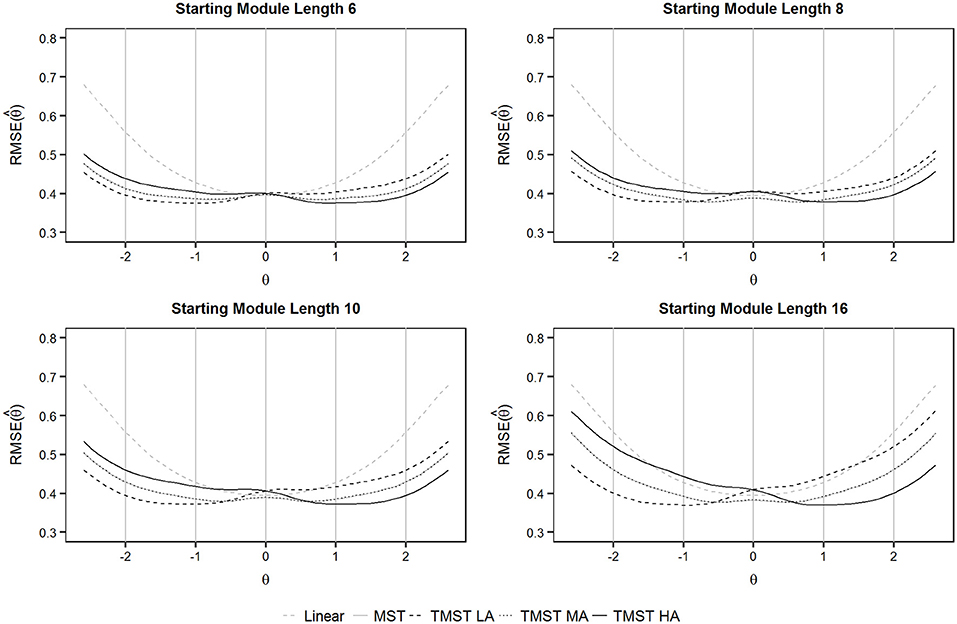
Figure 6. RMSE() in relation to ability for the MST and TMST designs with different lengths of starting modules per ability group. LA, low-ability group; MA, medium-ability group; HA, high-ability group.
Discussion
A good match between item difficulty and student ability is crucial from both measurement and motivational perspectives (Lord, 1980). In this paper, we investigated whether a combination of targeted and performance-based module assignments could increase the efficiency for estimating student ability under the Rasch model over a wide ability range. By means of simulations, we compared the efficiency of TMST designs—an extension of MST designs by targeted starting modules—with that of linear, traditional targeted, and MST designs. As hypothesized, the TMST design achieved the highest overall efficiency of all four designs, independent of the strength of the correlation between ability and the ability-related background variable. The TMST design also achieved higher overall efficiency than the MST design under all four starting module length conditions. The efficiency gain of the TMST design over the targeted design corresponded to up to 13% of the total test length, and the efficiency gain of the TMST design over the MST design corresponded to up to 7% of the total test length. Furthermore, our study allowed for comparing the efficiency of the MST and traditional targeted designs. Results showed that the MST design outperformed the targeted design in overall efficiency. These findings indicate that step-by-step module assignment based on performance is generally more efficient than one-time module assignment based on ability-related background variables. Finally, our results were in line with previous research by showing that the MST design and, therefore, performance-based module assignment, considerably increased measurement efficiency compared to a simple linear test (e.g., Lord, 1971b; Patsula, 1999; Reese et al., 1999; Pohl, 2013).
To get further insights into the efficiency of TMST designs, we varied the correlation between ability and background variable by manipulating the distance in mean ability between three ability groups. In line with our expectations and with previous results from Pohl (2013), the TMST design achieved the highest efficiency gain over the MST design when the background variable was a strong indicator of students' true ability. Under this condition, the TMST design achieved a considerably better match between ability and module difficulty within the starting modules than the MST design with its general, untargeted starting module. At the same time, the MST and TMST designs were comparably efficient under the condition of strongly overlapping ability distributions of the groups.
The overall efficiency gain of the TMST design over the targeted design was smaller under the wide distribution than under the medium and narrow distribution conditions. Furthermore, the efficiency gain of the MST design over the targeted design increased with decreasing distance between the ability groups. Analyses of the match between ability and module difficulty illustrated that as the strength of the overlap between the ability groups increased, so did the percentage of misallocated simulees in stage 1 of the TMST and, thus, also in the targeted design as a whole. This finding was in line with results reported by Pohl (2013) for the second wave of a longitudinal MST. However, the TMST design allowed for considerably decreasing the percentage of misallocations through performance-based routing to stages 2 and 3 under all three distribution conditions. Such a compensation was not available in the targeted design. In contrast, a good indicator of ability could partly compensate for the lack of performance-based routing in the targeted design compared to the MST design.
The difference in efficiency between the designs varied considerably along the ability scale. As hypothesized and in line with previous research (Pohl, 2013), the TMST design achieved a higher efficiency than the other designs for low-ability and high-ability students, particularly if the ability-related variable was a strong indicator of ability. For medium abilities, the MST design was the most efficient because the single starting module was targeted to this ability range and prevented misallocations to easy or difficult starting modules. The analysis of measurement efficiency by ability group showed comparable results. The TMST design was generally more efficient than the other designs for the low-ability and high-ability groups. For the medium-ability group, the TMST design corresponded to the MST design, and they both outperformed the targeted design, which does not compensate for possible misallocations, in overall efficiency. Furthermore, results confirmed our hypothesis that the TMST design outperformed the targeted design for students whose abilities are poorly described by the background variable (i.e., high-ability students in the low-ability group and vice versa). In turn, the MST design outperformed the TMST design for these students because the module assignment in the MST design solely depended on performance and, therefore, was independent of the background variable. Nonetheless, the TMST design achieved the highest overall efficiency for the mixture population as well as within each ability group because the number of students who profited from the targeted assignment in the first stage was larger than the number of disadvantaged students. Interestingly, the targeted design achieved the highest efficiency of all designs for medium abilities within the medium group, which were partly affected by routing errors in the MST and TMST designs. However, this strength of the targeted design was clearly overshadowed by its low efficiency for students with abilities deviant from the group mean.
Finally, we explored the extent to which the efficiency of the MST and TMST designs depended on the length of the starting module. Based on their simulations, (Kim and Plake, 1993) suggested that longer starting modules should be preferred to shorter ones. However, the length of the starting module was confounded with the total test length in their study. We found that the MST design was most efficient if the starting module length corresponded from up to of the total test length. These results corresponded to those of previous simulations by Verschoor and Eggen (2014). Longer starting modules resulted in an efficiency loss (see also Lord, 1971b). A decrease in efficiency for longer starting modules was also found for the TMST design. However, the efficiency loss was much stronger for the MST design, which included only one general starting module, than for the TMST design, which included three targeted starting modules. The two TMST designs with long starting modules were disadvantageous particularly for students with abilities that strongly deviated from the mean of their ability group. Nevertheless, the vast majority of students, especially those in the low-ability and high-ability groups, profited from the targeted modules in stage 1, independent of the length of the starting module. Hence, the length of the starting modules seems to be a negligible factor when developing TMST designs.
Limitations and Future Research
As in any simulation study, our study included a restricted set of conditions that constrains the generalizability of the results to some extent (Davey et al., 1997; Feinberg and Rubright, 2016). First, we included only a limited item pool with Rasch items targeted to the mean abilities of the ability groups or the subpopulations resulting from the routing. A strong variation of item difficulty within a module as well as the use of more complex IRT models could result in different module or test information. This in turn would affect both the accuracy and efficiency of ability estimation (e.g., Lord, 1980; Luecht, 2014). For example, we expect that more peaked module information would further increase the efficiency for abilities close to the target ability, whereas it would decrease the efficiency for abilities deviant from the target ability. At the same time, peaked module information could increase the number of routing errors due to lower information close to the routing cutoff scores (Weissman, 2014). Hence, differences in module information could enlarge or reduce the differences in efficiency between the different designs. It would be interesting to investigate the relationship between module information and efficiency of TMST designs compared to MST designs in more detail to identify the optimal TMST design for a given target population (cf. Verschoor and Eggen, 2014).
Second, we used a fixed test length as well as a fixed number of stages and modules in our simulation study. For longer tests, we hypothesize that the efficiency gain of the TMST design compared to the MST design would be reduced due to the increase in overall measurement accuracy given by the higher number of items, as stated in equation (2) (Rost, 2004; see also Stark and Chernyshenko, 2006). In addition, we expect that the efficiency gain of the TMST design compared to the MST design would decrease with increasing adaptivity within the two designs (i.e., more stages or more modules per stage for a given test length). However, increasing the adaptivity of the designs would also increase the test complexity and the effort required to assemble the modules. Previous studies indicated that the limited increase of measurement accuracy does not necessarily justify the increase in complexity for assembling more complex MST designs (e.g., Jodoin et al., 2006; for an overview, see Luecht, 2014; Yan et al., 2014b). Based on these findings and our simulations, we expect a similar relationship for TMST designs. However, the hypothesized relationship between the efficiency of the TMST design and test length, as well as between efficiency and design complexity, should be verified in further studies (cf. Dallas, 2014).
Conclusion and Practical Implications
In conclusion, TMST designs refer to an innovative and efficient design type that combines traditional targeted testing with modern computer-based adaptive testing in the form of an MST. With our simulation study, we extended previous research on the efficiency of different test designs in various ways. We not only introduced the TMST design as a new design type and analyzed its efficiency, but we also provided insights on the relative efficiency of targeted and MST designs. In particular, the efficiency of targeted test designs was not systematically studied in the past. As a consequence, our study allows for comparing the efficiency of module assignment based on ability-related background variables to those of performance-based module assignment. Our results indicated that the performance-based module assignment in the MST and TMST designs could substantially increase measurement efficiency compared to pure targeted module assignment based on ability-related background variables. When the target population spanned a narrow ability range, and the ability-related background variable was a poor indicator of students' true ability, the MST and TMST designs achieved comparable measurement efficiency. Hence, MST designs might be the better choice under this condition because they require fewer items in the starting modules than TMST designs, making them easier and cheaper to implement. However, TMST designs are a good option if the target population spans a wide ability range and a reliable ability-related background variable is available. Thanks to the targeted starting modules, TMST designs allow for taking low and high abilities into account from the first stage onward. As a result, TMST designs not only ensured efficient measurement of high-ability and low-ability students but also prevented underload and overload due to too-easy or too-difficult items.
In practice, the development and application of a TMST design brings about similar challenges and requirements as the development of an MST design. Given the limited research on TMST, we suggest practitioners follow the literature on MST (Hendrickson, 2007; Zenisky et al., 2010; Yan et al., 2014b) to clarify questions on the structure of the design (e.g., number of stages, number of segments per stage, routing rules, etc.). A crucial additional complexity of TMST compared to MST is the selection of a suitable ability-related background variable for the targeted assignment in the first stage. This variable must both provide reliable information about the students' true ability and be perceived as a fair criterion by the test takers, especially in the context of high-stakes testing. Objective criteria, such as school grade, exam grade, or performance-related school type, might be more acceptable to determine the starting module than, for example, teacher ratings. School grade as an indicator of number of years of education might be an especially well-accepted criterion for low-stakes as well as for high-stakes TMSTs. Exam grades or performance-related school types might be more difficult to justify in a high-stakes context and, thus, are rather recommended for low-stakes formative assessments. Consequently, TMST designs are a valuable extension of traditional MST designs to increase measurement efficiency in assessments for populations with a wide ability range, and they are particularly suitable for formative assessments.
Data Availability Statement
The raw data supporting the conclusions of this manuscript will be made available by the authors, without undue reservation, to any qualified researcher.
Author Contributions
SB, AV, and TE contributed to the conception and design of the study. AV developed the tool for data simulation, and SB ran the simulations together with AV. SB analyzed and interpreted the data. AV supported and critically revised the analyses. SB drafted the manuscript. All authors contributed to manuscript revision, and read and approved the submitted version.
Conflict of Interest Statement
The authors declare that the research was conducted in the absence of any commercial or financial relationships that could be construed as a potential conflict of interest.
Footnotes
1. ^For producing smooth graphs at the extremes, we generated additional data sets, such that each data point within the graphs was based on 1,000,000 observations.
2. ^Results for the targeted design correspond to results of the TMST design of stage 1.
References
Angelone, D., Keller, F., and Moser, U. (2013). Entwicklung schulischer Leistungen während der obligatorischen Schulzeit: Bericht zur Vierten Zürcher Lernstandserhebung zuhanden der Bildungsdirektion des Kantons Zürich [Development of School Performance During Compulsory School: Report on the Fourth Assessment for the Attention of the Zurich Department of Education]. Zürich: Institut für Bildungsevaluation. Available online at: http://www.ibe.uzh.ch/projekte/lezh/Lernstandserhebung_9KlasseZH_Bericht.pdf
Asseburg, R., and Frey, A. (2013). Too hard, too easy, or just right? The relationship between effort or boredom and ability-difficulty fit. Psychol. Test Assess. Model. 55, 92–104.
Barr, D. R., and Sherrill, E. T. (1999). Mean and variance of truncated normal distributions. Am. Stat. 53, 357–361. doi: 10.1080/00031305.1999.10474490
Baumert, J., Stanat, P., and Watermann, R. (2006). “Schulstruktur und die Entstehung differenzieller Lern- und Entwicklungsmilieus [School structure and development of differential learning and development environments],” in Herkunftsbedingte Disparitäten im Bildungswesen: differenzielle Bildungsprozesse und Probleme der Verteilungsgerechtigkeit. Vertiefende Analysen im Rahmen von PISA 2000,1st ed., eds J. Baumert, P. Stanat, and R. Watermann (Wiesbaden: VS Verlag für Sozialwissenschaften), 95–188.
Bejar, I. I. (2014). “Past and future of multistage testing in educational reform,” in Computerized Multistage Testing. Theory and Applications, eds D. Yan, A. A. von Davier, and C. Lewis (Boca Raton, FL: CRC Press), 423–438.
College Board (2017). SAT Suite of Assessments Technical Manual: Characteristics of the SAT. New York, NY. Available online at: https://collegereadiness.collegeboard.org/pdf/sat-suite-assessments-technical-manual.pdf
Crotts, K. M., Zenisky, A. L., Sireci, S. G., and Li, X. (2013). Estimating measurement precision in reduced-length multistage-adaptive testing. J. Comput. Adapt. Test. 1, 67–87. doi: 10.7333/1309-0104067
Dallas, A. (2014). The Effects of Routing and Scoring Within a Computeradaptive Multi-Stage Framework (Dissertation). University of North Carolina, Greensboro, NC. Available online at: https://libres.uncg.edu/ir/uncg/f/Dallas_uncg_0154D_11394.pdf
Davey, T., Nering, M. L., and Thompson, T. (1997). Realistic Simulation of Item Response Data (ACT Research Report Series No. 97-4). Iowa City, IA: American College Testing Program. Available online at: http://www.act.org/content/dam/act/unsecured/documents/ACT_RR97-04.pdf
Feinberg, R. A., and Rubright, J. D. (2016). Conducting simulation studies in psychometrics. Educ. Meas. Issues Pract. 35, 36–49. doi: 10.1111/emip.12111
Frühwirth-Schnatter, S. (2006). Finite Mixture and Markov Switching Models. Springer Series in Statistics. New York, NY: Springer.
Hendrickson, A. (2007). An NCME instructional module on multistage testing. Educ. Meas. Issues Pract. 26, 44–52. doi: 10.1111/j.1745-3992.2007.00093.x
Jodoin, M. G., Zenisky, A., and Hambleton, R. K. (2006). Comparison of the psychometric properties of several computer-based test designs for credentialing exams with multiple purposes. Appl. Meas. Educ. 19, 203–220. doi: 10.1207/s15324818ame1903_3
Kim, H., and Plake, B. S. (1993). “Monte Carlo simulation comparison of two-stage testing and computerized adaptive testing,” in Paper Presented at the Annual Meeting of the National Council on Measurement in Education, Atlanta, GA.
Kolen, M. J., and Brennan, R. L. (2014). Test Equating, Scaling, and Linking: Methods and Practices (3rd ed.). New York, NY: Springer. doi: 10.1007/978-1-4939-0317-7
Lord, F. M. (1971a). A theoretical study of the measurement effectiveness of flexilevel tests. Educ. Psychol. Meas. 31, 805–813. doi: 10.1177/001316447103100401
Lord, F. M. (1971b). A theoretical study of two-stage testing. Psychometrika 36, 227–242. doi: 10.1007/BF02297844
Lord, F. M. (1971c). Tailored testing, an application of stochastic approximation. J. Am. Stat. Assoc. 66, 707–711. doi: 10.2307/2284216
Lord, F. M. (1980). Applications of Item Response Theory to Practical Testing Problems. New York, NY: Routledge.
Luecht, R. M. (2014). “Design and implementation of large-scale multistage testing systems,” in Computerized Multistage Testing. Theory and Applications, eds D. Yan, A. A. von Davier, and C. Lewis (Boca Raton, FL: CRC Press), 69–84.
Luecht, R. M., and Nungester, R. J. (1998). Some practical examples of computer-adaptive sequential testing. J. Educ. Meas. 35, 229–249. doi: 10.1111/j.1745-3984.1998.tb00537.x
Mislevy, R. J., and Wu, P. (1996). Missing Responses and IRT Ability Estimation: Omits, Choice, Time Limits, and Adaptive Testing (ETS Research Reports Series No. RR-96-30-ONR). Princeton, NJ: Educational Testing Service.
Moser, U., Buff, A., Angelone, D., and Hollenweger, J. (2011). Nach sechs Jahren Primarschule: Deutsch, Mathematik und motivational-emotionales Befinden am Ende der 6. Klasse [After Six Years of Primary School: German, Mathematics and Motivational-Emotional Well-Being at the End of Grade 6]. Zürich, Switzerland: Bildungsdirektion Kanton Zürich. Available online at: https://www.ibe.uzh.ch/de/projekte/lezh.html
Patsula, L. N. (1999). A Comparison of Computerized Adaptive Testing and Multi-Stage Testing (Doctoral Dissertation). University of Massachusets Amherst, Amherst, MA. Available online at: http://scholarworks.umass.edu/dissertations_1/3282
Pohl, S. (2013). Longitudinal multistage testing. J. Educ. Meas. 50, 447–468. doi: 10.1111/jedm.12028
Rasch, G. (1960). Probabilistic Models for Some Intelligence and Attainment Tests. Copenhagen: Danmarks Paedagogiske Institut.
Reese, L. M., Schnipke, D. L., and Luebke, S. W. (1999). Incorporating Content Constraints Into Multi-Stage Adaptive Testing (LSAC Research Report Series No. LSAC-R-97-02). Princeton, NJ: Law School Admission Council. Available online at: https://files.eric.ed.gov/fulltext/ED467816.pdf
Richardson, J. T. E. (2011). Eta squared and partial eta squared as measures of effect size in educational research. Educ. Res. Rev. 6, 135–147. doi: 10.1016/j.edurev.2010.12.001
Rost, J. (2004). Lehrbuch Testtheorie - Testkonstruktion [Textbook test theory, test construction] (2nd ed.). Psychologie Lehrbuch. Bern: Verlag Hans Huber.
Sireci, S. G., Baldwin, P., Martone, A., Zenisky, A. L., Kaira, L., Lam, W., et al. (2008). Massachusetts Adult Proficiency Tests Technical Manual Version 2 (Center for Educational Assessment Research Report No. 677). Amherst, MA: Center for Educational Assessment, University of Massachusetts Amherst.
Stark, S., and Chernyshenko, O. S. (2006). Multistage testing: widely or narrowly applicable? Appl. Meas. Educ. 19, 257–260. doi: 10.1207/s15324818ame1903_6
van der Linden, W. J., and Glas, C. A. W. (Eds.). (2010). Elements of Adaptive Testing. New York, NY: Springer. doi: 10.1007/978-0-387-85461-8
Verschoor, A. J., and Eggen, T. J. H. M. (2014). “Optimizing the test assembly and routing for multistage testing,” in Computerized Multistage Testing. Theory and Applications, eds D. Yan, A. A. von Davier, and C. Lewis Boca Raton, FL: CRC Press, 135–150.
Wainer, H. (Ed.). (2000a). Computerized Adaptive Testing: A Primer (2nd ed.). Mahwah, NJ: Lawrence Erlbaum Associates. doi: 10.4324/9781410605931
Wainer, H. (2000b). “Introduction and history,” in Computerized Adaptive Testing. A Primer 2nd ed., ed H. Wainer (Mahwah, NJ: Lawrence Erlbaum Associates), 1–21.
Warm, T. A. (1989). Weighted likelihood estimation of ability in item response theory. Psychometrika 54, 427–450. doi: 10.1007/BF02294627
Weiss, D. J. (1982). Improving measurement quality and efficiency with adaptive testing. Appl. Psychol. Meas. 6, 473–492. doi: 10.1177/014662168200600408
Weissman, A. (2014). “IRT-based multistage testing,” in Computerized Multistage Testing. Theory and Applications, eds D. Yan, A. A. von Davier, and C. Lewis (Boca Raton, FL: CRC Press), 153–168.
Wise, S. L. (2014). The utility of adaptive testing in addressing the problem of unmotivated examinees. J. Comput. Adapt. Test. 2, 1–17. doi: 10.7333/1401-0201001
Yan, D., Lewis, C., and von Davier, A. A. (2014a). “Overview of computerized multistage tests,” in Computerized Multistage Testing. Theory and Applications, eds D. Yan, A. A. von Davier, and C. Lewis (Boca Raton, FL: CRC Press), 3–20.
Yan, D., von Davier, A. A., and Lewis, C. (Eds.). (2014b). Computerized Multistage Testing: Theory and Applications. Boca Raton, FL: CRC Press.
Zenisky, A., Hambleton, R. K., and Luecht, R. M. (2010). “Multistage testing: issues, designs, and research,” in Elements of Adaptive Testing, eds W. J. van der Linden and C. A. W. Glas (New York, NY: Springer), 355–372.
Zenisky, A. L., and Hambleton, R. K. (2014). “Multistage test designs: moving research results into practice,” in Computerized Multistage Testing. Theory and Applications, eds D. Yan, A. A. von Davier, and C. Lewis (Boca Raton, FL: CRC Press), 21–37.
Keywords: ability estimation, efficiency, test designs, multistage testing, simulation
Citation: Berger S, Verschoor AJ, Eggen TJHM and Moser U (2019) Improvement of Measurement Efficiency in Multistage Tests by Targeted Assignment. Front. Educ. 4:1. doi: 10.3389/feduc.2019.00001
Received: 20 August 2018; Accepted: 04 January 2019;
Published: 22 January 2019.
Edited by:
Amery D. Wu, University of British Columbia, CanadaReviewed by:
Yan Liu, University of British Columbia, CanadaYi-Hsin Chen, University of South Florida, United States
Copyright © 2019 Berger, Verschoor, Eggen and Moser. This is an open-access article distributed under the terms of the Creative Commons Attribution License (CC BY). The use, distribution or reproduction in other forums is permitted, provided the original author(s) and the copyright owner(s) are credited and that the original publication in this journal is cited, in accordance with accepted academic practice. No use, distribution or reproduction is permitted which does not comply with these terms.
*Correspondence: Stéphanie Berger, U3RlcGhhbmllLkJlcmdlckBpYmUudXpoLmNo