- 1School of Biology and Ecology, University of Maine, Orono, ME, United States
- 2Maine Center for Research in STEM Education, University of Maine, Orono, ME, United States
- 3School of Biological Sciences, University of Nebraska, Lincoln, NE, United States
- 4Department of Chemistry, University of Nebraska, Lincoln, NE, United States
- 5Department of Physics and Astronomy, University of Maine, Orono, ME, United States
Despite the need for a strong Science, Technology, Engineering, and Math (STEM) workforce, there is a high attrition rate for students who intend to complete undergraduate majors in these disciplines. Students who leave STEM degree programs often cite uninspiring instruction in introductory courses, including traditional lecturing, as a reason. While undergraduate courses play a critical role in STEM retention, little is understood about the instructional transitions students encounter upon moving from secondary to post-secondary STEM courses. This study compares classroom observation data collected using the Classroom Observation Protocol for Undergraduate STEM from over 450 middle school, high school, introductory-level university, and advanced-level university classes across STEM disciplines. We find similarities between middle school and high school classroom instruction, which are characterized by a large proportion of time spent on active-learning instructional strategies, such as small-group activities and peer discussion. By contrast, introductory and advanced university instructors devote more time to instructor-centered teaching strategies, such as lecturing. These instructor-centered teaching strategies are present in classes regardless of class enrollment size, class period length, or whether or not the class includes a separate laboratory section. Middle school, high school, and university instructors were also surveyed about their views of what STEM instructional practices are most common at each educational level and asked to provide an explanation of those perceptions. Instructors from all levels struggled to predict the level of lecturing practices and often expressed uncertainty about what instruction looks like at levels other than their own. These findings suggest that more opportunities need to be created for instructors across multiple levels of the education system to share their active-learning teaching practices and discuss the transitions students are making between different educational levels.
Introduction
Science, Technology, Engineering, and Math (STEM) education plays an essential role in building the foundational knowledge needed to solve global problems. For decades, this importance has been highlighted by both researchers and policy, yet the United States continues to produce fewer STEM graduates than the economy demands (President’s Council of Advisors on Science and Technology, 2012). Despite an increased interest in STEM degrees from well-prepared students, there is a dramatic attrition rate once students begin college-level programs (Pryor and Eagan, 2013; Eagan et al., 2014). Half of intended STEM bachelor’s degree majors do not end up earning a STEM degree within 6 years of entering college (Eagan et al., 2014), and the majority of those leaving do so in the first 2 years of their degree (Watkins and Mazur, 2013). The attrition rates are even greater at the 2-year college level, where two-thirds of students intending to earn a STEM associates degree do not do so within 4 years (Van Noy and Zeidenberg, 2014). These attrition rates overwhelm any gains from increased interest in STEM degrees, leading to a shortfall in the number of students entering the STEM workforce.
One of the proposed solutions to meet the need for one million more STEM graduates by 2022 is to increase student retention rates in STEM majors by 33% (President’s Council of Advisors on Science and Technology, 2012). In order to work toward this goal, it is important to examine why students, who were previously interested in STEM in high school, are leaving STEM degree programs at such a high rate. One main source of student attrition in STEM fields is the types of experiences students have upon arriving in their college classes. A seminal study conducted in the late 1990s found that students switch from STEM degrees for a variety of reasons related to their experiences as students (Seymour and Hewitt, 1997). Both switching and non-switching students said that one of the most common concerns was uninspiring teaching in STEM courses, with over 90% of switchers mentioning it as a part of their interviews and almost three-quarters of non-switchers mentioning it. An example of uninspiring teaching is a class solely dedicated to lecturing about information in the textbook. While this type of instruction has been the predominant method at the undergraduate level for centuries (Brockliss, 1996), alternative methods, such as active-learning strategies, have been shown to promote greater learning and better outcomes for students (e.g., Prince, 2004; Freeman et al., 2014).
Recently, the efficacy of active-learning methods was quantified. In a meta-analysis of 225 studies that reported on exam scores and/or failure rates comparing undergraduate STEM courses using lecture-based instruction with ones using active-learning, researchers found two significant trends (Freeman et al., 2014). Students in active-learning classrooms earned exam scores half a letter grade higher than students in lecture-based classrooms for the same course. In addition, students in active-learning courses are one and a half times more likely to pass the course compared to students in sections that predominately use traditional lecturing. Additional studies found that requiring participation in a number of active-learning interventions improved achievement for all students, especially traditionally underrepresented students, without requiring any additional staffing or financial resources (Haak et al., 2011; Eddy and Hogan, 2014).
While active learning provides an effective means to engage students and improve student outcomes, it remains unclear how the amount and type of active learning used in classes changes as students progress through different instructional levels, from middle school to advanced undergraduate courses. Understanding the instructional transitions students experience has the potential to help explain why students choose to leave STEM majors. However, there are a number of challenges when trying to meaningfully describe the amount and types of active learning taking place in classrooms across different instructional environments. Studies that characterize instructional practices are typically performed in either high school or undergraduate classrooms, often as part of the evaluation of professional development programs (Rockoff et al., 2008; Smith et al., 2014; Garrett and Steinberg, 2015; Campbell et al., 2016). The observation tools and research methods used in studies that examine instructional practices often differ, further complicating comparisons between them.
One exception is the Reformed Teaching Observation Protocol (RTOP) (Sawada et al., 2002), which has been used in both high school and undergraduate settings. The RTOP includes Likert-scale items that observers score to measure the instructional practices implemented in the classroom on a scale from lecture based and teacher centered (0) to inquiry based and student centered (100). The RTOP was originally developed as part of an evaluation system for a program designed for preparing K-12 teachers. Since its development, it has also been used to track changes in undergraduate faculty practices due to participation in different types of professional development (Ebert-May et al., 2015; Manduca et al., 2017). A survey of studies on high school STEM teachers indicates that average RTOP scores range from 37.3 to 53.5 (Roehrig and Kruse, 2005; Yezierski and Herrington, 2011). Similar studies at the undergraduate-level are limited; however, one study found that 20 different first-year college science instructors had an average RTOP score of 35.9 (Lund et al., 2015), and a study of biology instructors who participated in extensive professional development programs reported an average score of 37.1 (Ebert-May et al., 2011). Thus, there are likely meaningful differences in the instructional practices employed in these educational environments; however, the RTOP protocol does not offer the resolution required to understand these differences in a meaningful manner.
Observation protocols that have been developed more recently, including the Teaching Dimensions Observation Protocol (TDOP; Hora et al., 2013) and the Classroom Observation Protocol for Undergraduate STEM (COPUS; Smith et al., 2013), record instructor and student instructional behaviors in 2-min time intervals and provide additional tools that can be used to examine practices at different educational levels. The TDOP was designed as a supplement to survey data when characterizing classroom practice and involves observers marking codes, such as Interactive Lecture or Student Comprehension Question, from a set of over 40 observable classroom behaviors and actions every 2 min (Hora et al., 2013). The COPUS has 25 total codes and was adapted from the TDOP as a more basic instrument that requires less training time and could be used by a variety of individuals to provide feedback to instructors and identify professional development needs (Smith et al., 2013).
Since its development, COPUS has been used in a variety of studies at the undergraduate level to describe general campus-wide instructional practices as well as to examine more specific active-learning strategies, such as the use of clickers and worksheet-based activities (Smith et al., 2014; Lund et al., 2015; Lewin et al., 2016; Cleveland et al., 2017). On a campus-wide scale, COPUS has been useful in describing the variation in instructional practices present across STEM disciplines and in creating profiles of commonly observed types of classrooms. One study using COPUS data from 55 different courses across 13 STEM departments found a diverse range of teaching practices (Smith et al., 2014). Specifically, the study found a wide range in the frequency at which instructors used Lecturing, with some using it as little as 2% of their total instructional behaviors and others using it as 98% of their total instructional behavior. This observed continuum showed that the binary categorization of instructional practice as either lecture-based or active learning represents an oversimplification. Another study used COPUS data from 269 class periods taught by 73 different instructors across 28 universities to create 10 classroom profiles ranging from teacher centered to student centered (Lund et al., 2015). The creation and application of these profiles provides a finer resolution for describing the instructional practices utilized at research universities. Taken together, this work demonstrates that COPUS can be a meaningful tool in characterizing classroom experiences in undergraduates STEM courses.
To explore why students who were interested in STEM in high school leave during their undergraduate years, we need to understand the instructional transitions students encounter as they progress through the educational system. Using COPUS and instructor survey data from middle school, high school, and undergraduate STEM classes, this study sought to characterize how STEM classroom experiences compare across the transition from secondary to post-secondary educational institutions. Specifically, we asked: (1) How do instructional experiences in middle school and high school STEM classes compare with first-year and advanced-level undergraduate classes? (2) Do the instructional experiences at the undergraduate level depend on variables, such as class size, class length, or whether the class also includes a laboratory section? and (3) What perceptions do middle school, high school, and university instructors hold about instructional practice across all educational levels and how do instructors’ perceptions compare with observed practices? The answers to these questions can help to clarify specific instructional transitions and explanations for the associated issues, which can serve as both areas for future research and targets for professional development aimed at increasing student retention in STEM fields.
Materials and Methods
Observation Data Collection
This study includes classroom observation data from middle school, high school, and university level classrooms. To observe university classrooms, we emailed University of Maine STEM instructors asking them if they would allow secondary school (i.e., middle and high school) teachers to visit their classrooms and collect observation data; 74% of those emailed agreed. Middle and high school teachers performed the observations as part of their participation in the University Classroom Observation Program, which was designed to give faculty formative feedback on their teaching from external observers without conflating that feedback with review procedures for tenure and promotion (Smith et al., 2014). The program occurred over four semesters and each semester we had more applicants than slots available for middle and high school teacher observers (average acceptance rate = 34%), so we were able to select teachers with a range of experiences (e.g., numbers of years teaching, socioeconomic needs of the community) from a variety of school districts.
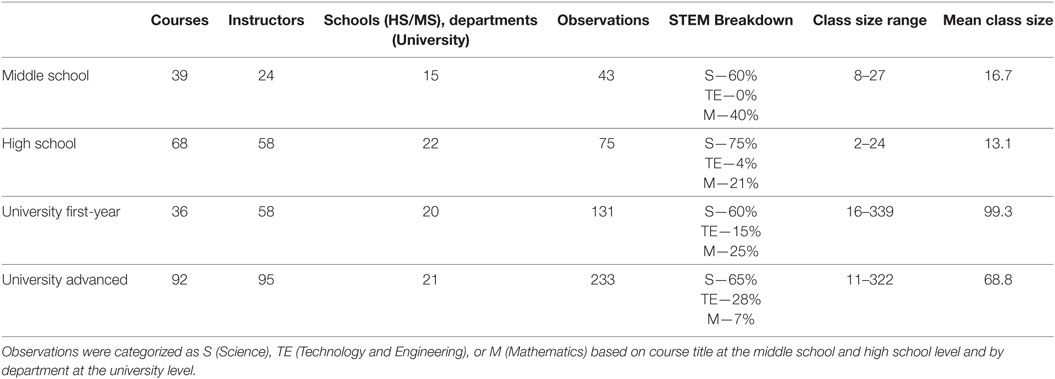
Altogether, the teachers conducted 364 class observations. These observations included 153 instructors who taught 128 courses in 21 different departments (anthropology; biology, and ecology; chemical and biological engineering; chemistry; civil and environmental engineering; computer sciences; earth sciences; ecology and environmental sciences; economics; electrical and computer engineering; electrical engineering technology; food and agriculture; forest resources; marine science; mathematics and statistics; mechanical engineering; molecular and biomedical science; nursing; physics and astronomy; plant, soil, and environmental science; psychology; and wildlife, fisheries, and conservation biology) as shown in Table 1. Observations from 270 classes taught in Spring 2014, Fall 2014, and Spring 2015 have been reported in earlier studies (Smith et al., 2014; Lewin et al., 2016).
We conducted middle (grades 6–8) and high school (grades 9–12) class observations in public secondary schools located within a 140-mile radius of the University of Maine (Orono, ME, USA). We asked secondary teachers who had participated as observers of university classes if they would allow their classes to also be observed. In addition, many of the secondary teachers identified other STEM teachers in their districts who were willing to have their classes observed. In total, investigators observed 118 secondary school class periods. These observations included 82 teachers from 37 schools (Table 1).
Observer Training
Secondary teachers who observed university classes received COPUS training and carried out observations in pairs as described in Smith et al. (2013). Briefly, the 2-h training introduced the teachers to the 25 COPUS codes shown in Figure 1 and gave them a chance to practice coding using short video clips from real university classrooms. Sample observation sheets can be found in Smith et al. (2013) and at http://www.cwsei.ubc.ca/resources/COPUS.htm. After watching the videos, the middle and high school teachers listed the codes they selected and discussed any disagreements. When the training was complete, the teachers observed in pairs, but were instructed to record their COPUS results independently. Inter-rater reliability (IRR) was calculated using Cohen’s kappa scores as described in Lewin et al. (2016). The mean Cohen’s kappa score for all of the university observations was 0.91 (SE ± 0.01), indicating strong IRR (Landis and Koch, 1977). Only codes marked by both observers in a given time interval were included in the data set for this study.
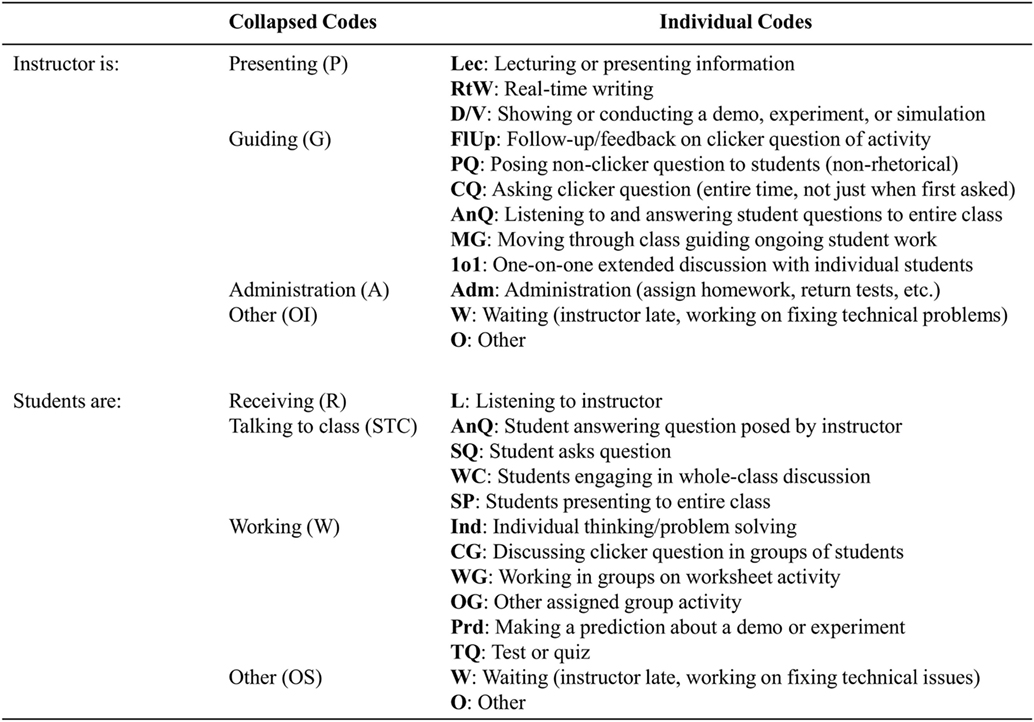
Figure 1. Classroom Observation Protocol for Undergraduate STEM instrument codes and abbreviated descriptions used to describe instructor and student behavior during in-class observations. The individual codes are further grouped into collapsed codes.
Three observers conducted observations in secondary school classes and included two Master of Science Teaching students who are now high school teachers (co-authors Kenneth Akiha and Justin Lewin) and one University of Maine professional development coordinator who is a former high school teacher (co-author Erin L. Vinson). These observers received similar training on conducting classroom observations using the COPUS protocol (e.g., discussion of codes and practice coding common videos). IRR was determined by observing a video of the same class period and observing at least three different live classes in pairs. Each of these comparisons yielded a Cohen’s kappa score of greater than 0.9, demonstrating strong IRR (Landis and Koch, 1977). Given the dependable IRR and that traveling to observe in pairs would have greatly limited the number of observations, subsequent secondary classes were observed by only one individual.
Observation Data Sorting
We sorted secondary class observation data based on the level of the class: either middle school or high school. For the university classroom observation data, we sorted the data based on three categories of STEM courses: general education, first-year, and advanced (Figure 2). If data came from a course not required for a STEM major, we categorized the course as “general education” and subsequently excluded the associated data from our analysis because our focus is on how instructional practices can affect student retention in STEM majors. Of the courses required for STEM majors, we classified courses with greater than 33% first-year student enrollment and less than two pre-requisites in any given department as “First-Year” courses. Required courses with less than 33% first-year enrollment or more than two pre-requisites in a given department were sorted as “Advanced” courses.
Data Analysis
For this study, we analyzed the COPUS data using two different strategies described in Lewin et al. (2016): relative abundance, as described by percentage of collapsed codes, and relative frequency, as described by percentage of 2-min time intervals containing specific codes (Figure 1). For relative abundance, collapsed codes refer to categories that describe more general instructor and student behaviors, usually consisting of multiple individual codes. For example, the Instructor Presenting collapsed code category consists of three individual codes: Lecturing (Lec), Real-time Writing, and Demo/Video (Figure 1 shows all collapsed code categories). To visualize and compare relative abundance of each COPUS code, we calculated the percentage of each collapsed code by totaling the number of codes in that category during a class and dividing by the total number of codes marked during the class. For example, if there were 20 codes marked under the Instructor Presenting collapsed code category and 50 codes marked in total, then 20/50 or 40% of the codes correspond to the Instructor Presenting collapsed code.
However, when trying to compare the frequency of a single code, such as Instructor Lec or Student Listening (L), percent code calculations can be misleading because multiple COPUS codes can be marked at the same time, which can impact the denominator of the calculation. Therefore, we also quantified relative frequency by calculating the percentage of 2-min time intervals in which a given code was marked. To do this, the number of 2-min time intervals marked for each code was divided by the total number of time intervals that were coded in that class session. For example, if instructor Lec was marked in 18 time intervals out of a possible 30 time intervals, then 18/30 or 60% of the possible 2-min time intervals contained lecture.
We were also interested in comparing the amount of time students worked in groups because it is one way to generally compare teacher-centered versus student-centered teaching practices. COPUS has multiple student codes involving group work: Clicker Group Work (CG), Worksheet Group Work (WG), and Other Group Work (OG). These three codes measure finer distinctions of what can be broadly classified as students working in groups (Lund et al., 2015), so if any of those codes were marked then we counted them in the general Group Work (GW) code.
COPUS Use in Middle and High School Classrooms
Because the COPUS instrument was developed and validated at the undergraduate level, we needed to determine if it adequately captures the classroom experiences in middle and high school in addition to those in undergraduate STEM classes. In particular, we were concerned that there might be certain activities or teaching modes that would go undetected. To address this possibility, we looked at the relative frequency and relative abundance of the Instructor Other (OI) and Student Other (OS) codes (Figure 1) documented in middle school and high school observations combined and all undergraduate observations (Table 2). We chose to compare Other codes to examine whether certain behaviors that were not observed in undergraduate classes, and therefore unable to be captured by the COPUS instrument, were present in middle school and high school classrooms. On average, Other codes made up less than 5% of the total codes marked in middle school and high school classes, while the same codes made up less than 3% of the total codes marked in undergraduate classes. Also, on average, Other codes were marked in less than 9% of the total number of 2-min time intervals in a middle school and high school class period, while the same codes were marked in less than 4% of the total number of 2-min time intervals in a university class period (Table 2). Based on observer comments, the most common OI code behaviors across all levels were listening to student presentations; setting up technology, materials, or equipment; and facilitating and guiding class discussions. The most common OS code behaviors across all levels were students writing on the board, forming groups, and students getting or putting away materials. At the middle school and high school levels, observers noted more time for students getting or putting away materials. Overall, the overlap in Other code behaviors for both instructors and students, combined with the relatively low and similar abundances and frequencies at both levels, provided evidence that the COPUS instrument was not systematically missing important activities that may be present in middle school and high school STEM classrooms.

Table 2. Relative abundance and relative frequency of Instructor Other (OI) and Student Other (OS) codes in middle and high school classes and university level classes.
Survey Responses
Because the results from our study may be used to design professional development for instructors at multiple education levels, we wanted to determine how our data matched the perceptions and expectations instructors have of the type of instruction their students are either coming from or heading to in the future. To learn more about instructors’ perspectives on instructional behaviors at different educational levels, university faculty who were observed by middle and high school teachers and/or attended a variety of professional development opportunities at the University of Maine (e.g., workshops, speakers) were sent an email asking them to take a short survey. Similarly, middle and high school teachers who participated in University Classroom Observation Program or other professional development events at the University of Maine (e.g., workshops, summer teaching institutes) were sent the same email and asked to share it with their colleagues. The survey included a multiple-choice question in which respondents were asked to select one of four graphs that showed different result patterns describing average percent Instructor Lec code in classes at the middle school, high school, first-year college, and advanced college levels. The survey respondents also answered a follow-up open-response question in which they were asked to explain why they selected a specific multiple-choice answer.
To examine the range of answers chosen, the percent of each choice was calculated for the middle school, high school, and university educator groups. To analyze the open-response question answers, we used a content analysis process (Miles et al., 2013). Specifically, one co-author (Emilie Brigham) read the answers, created categories based on large themes, and scored the short-answer responses based on the presence or absence of each category in an individual’s response. A second co-author (Michelle K. Smith) used the categories, independently scored the responses, and suggested new categories for the scheme. The coding between the two authors was compared and any coding differences were resolved through discussion.
IRB Information
All faculty members and secondary teachers who agreed to be observed were given a human subjects consent form. The Institutional Review Board at the University of Maine granted approval to evaluate observation data of classrooms and survey instructors about the observation results (exempt status, protocol no. 2010-04-3 and 2013-02-06). Because of the delicate nature of sharing observation data with other instructors and administrators, the consent form explained that the data would only be presented in aggregate and would not be subdivided according to variables such as department or school. We provided instructors access to observation data from their own course(s) upon request after we collected observation data for this study.
Results
Instructional Practices across Education Levels
We used the COPUS to obtain a comprehensive view of classrooms at each educational level and started by comparing the relative abundance of all the instructor collapsed COPUS codes (Figure 3). In the middle school and high school classes, the Instructor Presenting collapsed code, which is more frequently seen in traditional lecture classes, comprised between 0 and 66% of instructor collapsed codes. In first-year and advanced university-level courses, the Instructor Presenting collapsed code represented between 0 and 100% of instructor collapsed codes at both levels.
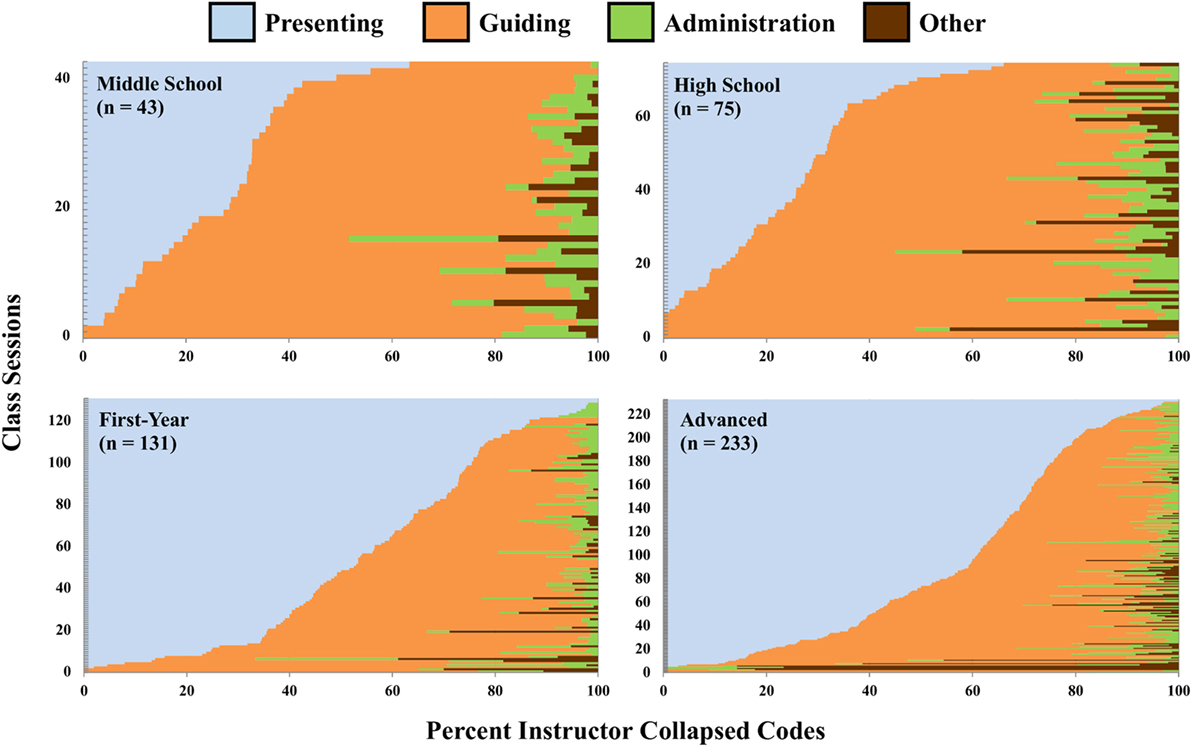
Figure 3. Percentage of instructor collapsed Classroom Observation Protocol for Undergraduate STEM codes for middle school, high school, first-year, and advanced university classes. Each horizontal bar represents a different class session. The classes are ordered by the collapsed code Instructor Presenting. Figure 1 describes the Instructor Collapsed Codes.
Another way to compare data across multiple educational levels is to examine the frequency of particular COPUS codes across the 2-min time intervals. When examining the 2-min relative frequency of the Instructor Lec code, the interquartile ranges were lower for middle school and high school classrooms when compared to first-year and advanced university courses (Figure 4). Furthermore, a Kruskal–Wallis Test showed very strong evidence of a difference (p < 0.001) between the mean ranks of at least one pair of groups. A Dunn’s pairwise test of all six pairs of levels showed instructors in first-year and advanced university classes spent significantly more time using the Instructor Lec code than instructors in middle school and high school classes (p < 0.001 adjusted using the Bonferroni correction). In particular, the difference between the median percentage of 2-min time intervals marked with the Instructor Lec code in high school and first-year university classes was 48% (32% in high school to 80% in first-year university classes), more than 10-fold greater than any other difference between chronologically adjacent levels. There was no significant difference in the median percentage of 2-min time intervals, including Instructor Lec between first-year and advanced university courses.
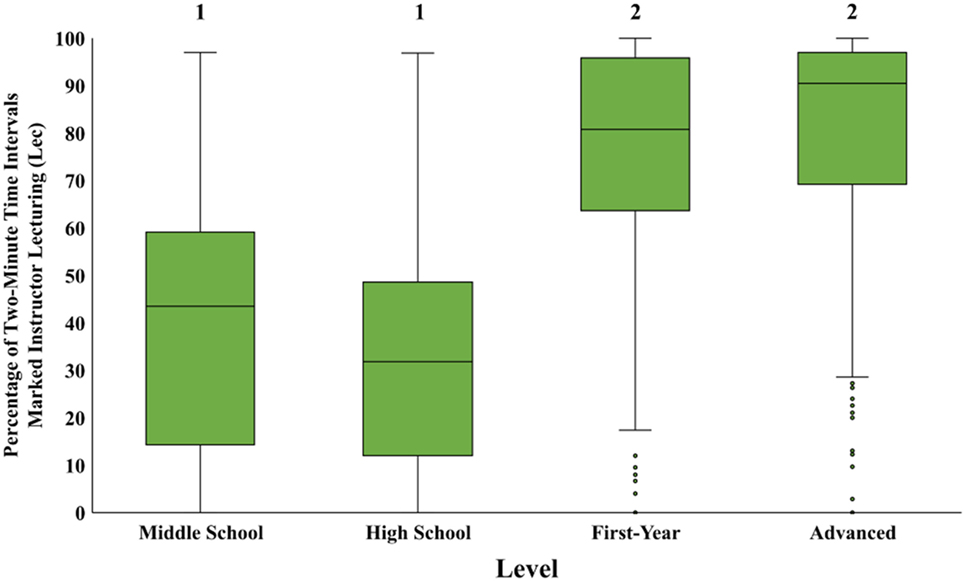
Figure 4. Comparison of the relative frequency of the Classroom Observation Protocol for Undergraduate STEM code Instructor Lecturing (Lec) for middle school, high school, first-year university, and advanced university classes. Box-and-whisker plots showing the median and variation between the four instructional levels. The line in the middle of the box represents the median percentage of 2-min time intervals for the class sessions in each level. Boxes represent the interquartile range, whiskers represent 1.5 times the interquartile range, and data points not included in 1.5 times the interquartile range are shown with dots. Levels labeled with different numbers indicate a significant difference between mean ranks by a post hoc Dunn’s pairwise comparison (Kruskal–Wallis Test, χ2 = 153.03, df = 3, N = 482, p < 0.001; Dunn’s pairwise comparisons, p < 0.001 for levels labeled with different numbers).
In addition to comparing traditional instructional codes, we compared relative frequency using instructional codes often associated with student-centered classrooms, such as Instructor Moving and Guiding (MG) throughout the classroom. Middle school and high school classes showed a greater range of percent 2-min time intervals containing the Instructor MG code (Figure 5). For both university levels, more than half of the observations captured no Instructor MG during the entire class. When comparing mean ranks, a Kruskal–Wallis Test showed very strong evidence of a difference (p < 0.001) between at least one pair of groups. A Dunn’s pairwise test of all six pairs of levels showed instructors in middle school and high school classes spent significantly more time MG than university instructors (p < 0.001 adjusted using the Bonferroni correction).
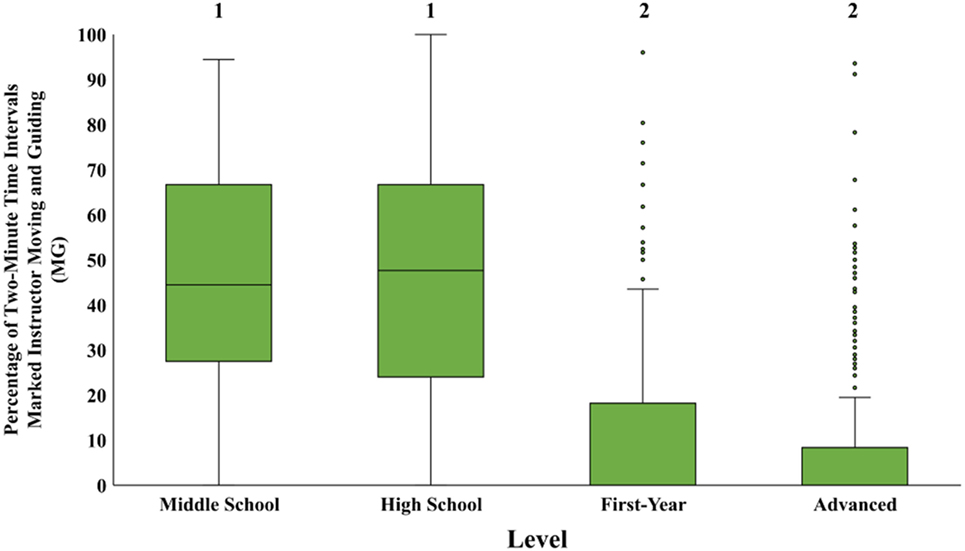
Figure 5. Comparison of the relative frequency of the Classroom Observation Protocol for Undergraduate STEM code Instructor Moving and Guiding (MG) for middle school, high school, first-year university, and advanced university class sessions. Box-and-whisker plots showing the median and variation between the four instructional levels. The line in the middle of the box represents the median percentage of 2-min time intervals for the class sessions in each level. Boxes represent the interquartile range, whiskers represent 1.5 times the interquartile range, and data points not included in 1.5 times the interquartile range are shown with dots. Levels labeled with different numbers indicate a significant difference between mean ranks by a post hoc Dunn’s pairwise comparison (Kruskal–Wallis Test, χ2 = 169.56, df = 3, N = 482, p < 0.001; Dunn’s pairwise comparisons, p < 0.001 for levels labeled with different numbers).
Student Classroom Experiences across Educational Levels
To view the instructional experience from the student perspective, we analyzed the student collapsed COPUS codes and saw a difference in the ranges of classroom behaviors at different educational levels (Figure 6). Because students sitting quietly and taking notes is often associated with lecture-based classrooms, we also compared the Student Receiving collapsed code. Student Receiving made up a range of 0–60% of the student collapsed codes in middle school and high school classes compared to 0–100% of student collapsed codes in both levels of university classes.
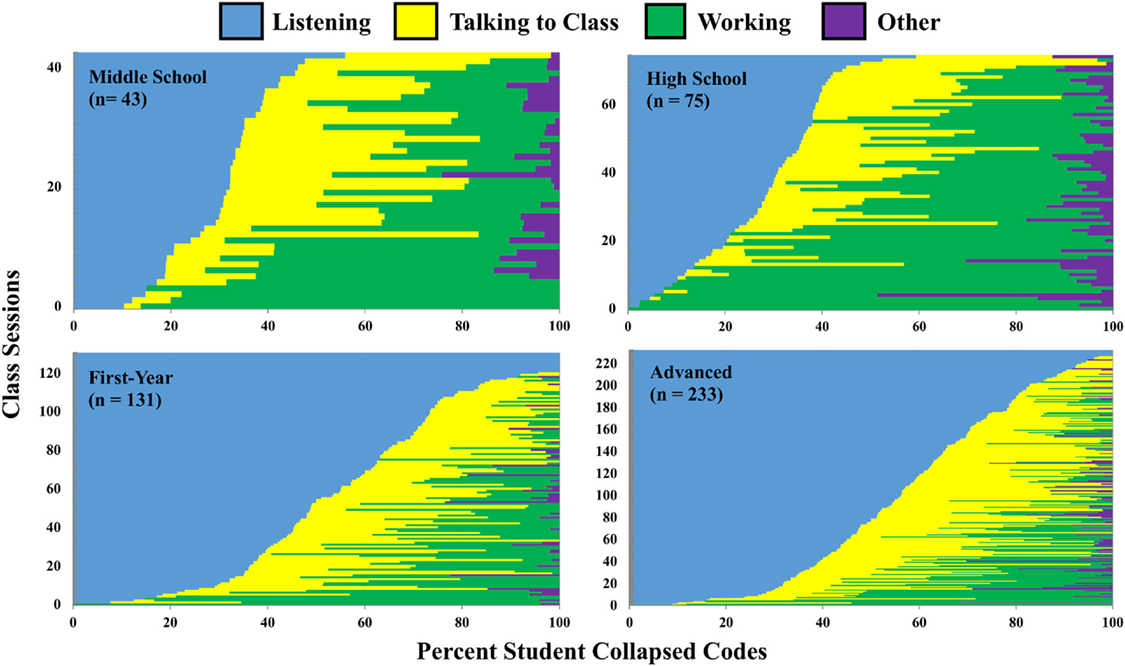
Figure 6. Percentage of student collapsed Classroom Observation Protocol for Undergraduate STEM codes for middle school, high school, first-year, and advanced university classes. Each horizontal bar represents a different class session. The classes are ordered by the collapsed code Student Receiving. Figure 1 describes the Student Collapsed Codes.
We also looked at the relative frequency of individual student codes, beginning with codes for traditional instruction student behaviors such as Listening (L). Our data showed that middle school and high school classes exhibited a greater interquartile range of percent 2-min time interval values, while first-year and advanced university classes had higher median values (Figure 7). Moreover, a Kruskal–Wallis Test showed very strong evidence of a difference (p < 0.001) between the mean ranks of at least one pair of groups. A Dunn’s pairwise test of all six pairs of levels showed students in middle school and high school classes spent significantly less time listening and taking notes than students in first-year and advanced university classes (p < 0.001 adjusted using the Bonferroni correction).
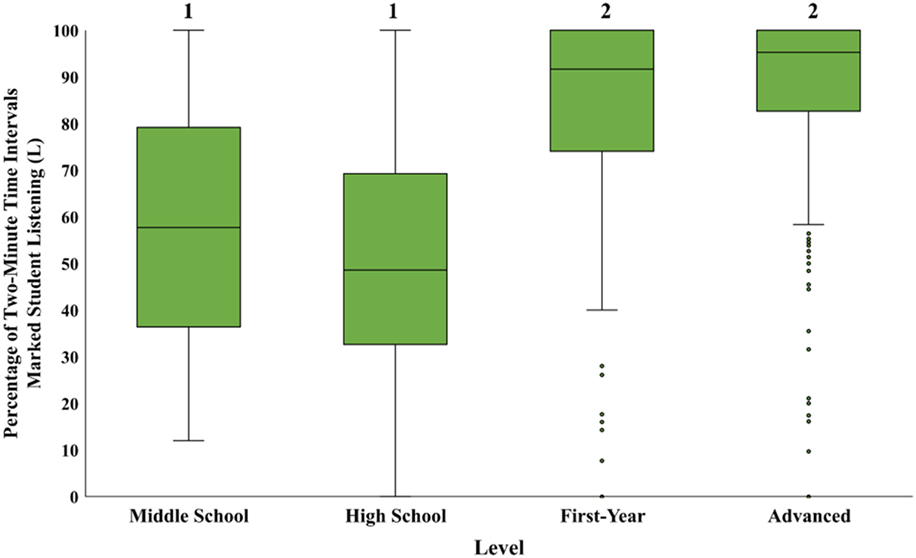
Figure 7. Comparison of the relative frequency of Classroom Observation Protocol for Undergraduate STEM code Student Listening (L) for middle school, high school, first-year university, and advanced university classes. Box-and-whisker plots showing the median and variation between the four instructional levels. The line in the middle of the box represents the median percentage of 2-min time intervals for the class sessions in each level. Boxes represent the interquartile range, whiskers represent 1.5 times the interquartile range, and data points not included in 1.5 times the interquartile range are shown with dots. Levels labeled with different numbers indicate a significant difference between mean ranks by a post hoc Dunn’s pairwise comparison (Kruskal–Wallis Test, χ2 = 137.37, df = 3, N = 482, p < 0.001; Dunn’s pairwise comparisons, p < 0.001 for levels labeled with different numbers).
In addition, we examined the relative frequency of codes for student behaviors typical of student-centered classrooms, such as GW, a combination of three individual codes: CG, WG, and OG. Middle school and high school classes had a larger interquartile range of percent 2-min time intervals containing a student GW code (Figure 8). For both university levels, half of the observations documented no student GW during the entire class. In addition, a Kruskal–Wallis Test showed very strong evidence of a difference (p < 0.001) between mean ranks of at least one pair of levels. A Dunn’s pairwise test of all six pairs of levels showed students in middle school and high school classes spent significantly more time working in groups than students in first-year and advanced university classes (p < 0.001 adjusted using the Bonferroni correction).
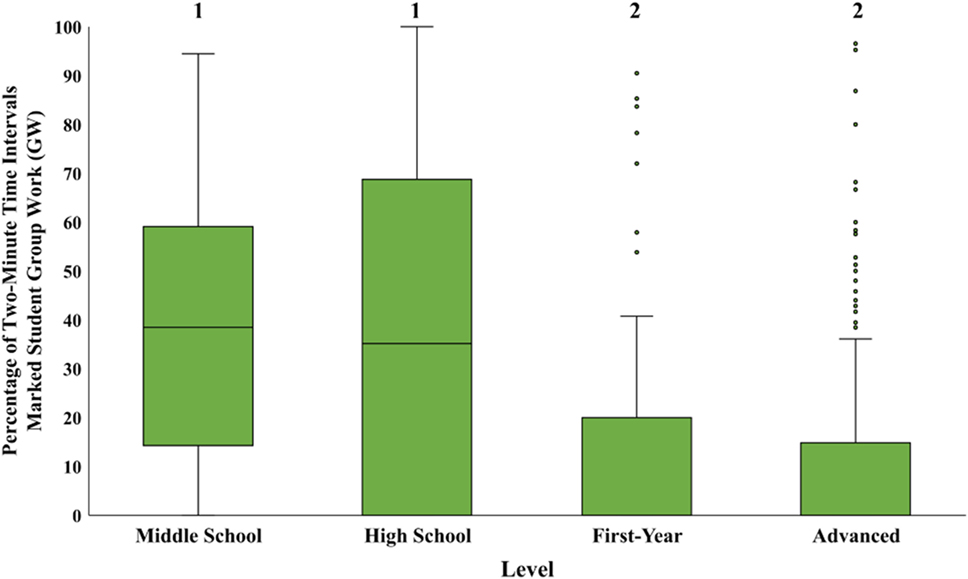
Figure 8. Comparison of the relative frequency of Classroom Observation Protocol for Undergraduate STEM code Student Group Work (GW) for middle school, high school, first-year university, and advanced university classes. Box-and-whisker plots showing the median and variation between the four instructional levels. The line in the middle of the box represents the median percentage of 2-min time intervals for the class sessions in each level. Boxes represent the interquartile range, whiskers represent 1.5 times the interquartile range, and data points not included in 1.5 times the interquartile range are shown with dots. Levels labeled with different numbers indicate a significant difference in mean ranks by a post hoc Dunn’s pairwise comparison (Kruskal–Wallis Test, χ2 = 81.60, df = 3, N = 482, p < 0.001; Dunn’s pairwise comparisons, p < 0.001 for levels labeled with different numbers).
Class Size Effect
One common difference between middle school, high school, and university courses is class size. To investigate whether the instructional differences we observed between these educational levels were due to class size, we compared data from all classrooms with fewer than 30 students enrolled. We chose 30 students as the benchmark for small university classes because all of the middle school and high school classrooms we observed contained 30 or fewer students. In total, we had observation data for 74 small university class periods (8 First-Year and 66 Advanced). Even when focusing exclusively on small university classes, we observed that Instructor Presenting and Student Receiving collapsed codes were more common when compared to middle school and high school classrooms (Figure 9).
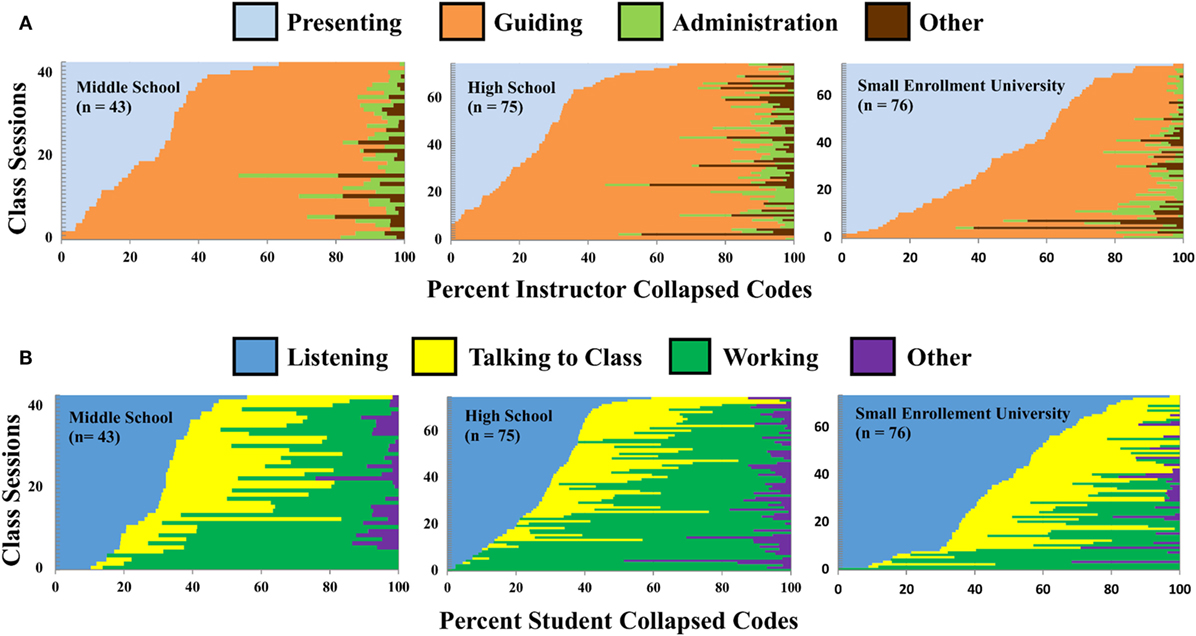
Figure 9. A comparison of middle and high school classrooms with small enrollment university classes. (A) Percentage of instructor collapsed Classroom Observation Protocol for Undergraduate STEM (COPUS) codes for middle school, high school, and university classes with fewer than 30 students ordered by percent Instructor Presenting. (B) Percentage student collapsed COPUS codes for middle school, high school, and university classes with fewer than 30 students ordered by percent Student Receiving. Each horizontal bar represents a different class session.
In addition, we compared the median percentages of 2-min time intervals for the same four codes as above: Instructor Lec, Instructor MG, Student Listening, and Student GW in classes with fewer than 30 students enrolled. A Kruskal–Wallis Test with a post hoc Dunn’s pairwise comparison of all three pairs for all four codes showed instructors in middle school and high school classes spent significantly less time Lec (Figure 10A) and significantly more time MG (Figure 10B) compared with instructors in small enrollment university classes (p < 0.001). In addition, students in middle school and high school classes spent significantly less time Listening (Figure 10C) and more time Working in Groups (Figure 10D) compared with students in small enrollment university classes (p < 0.001).
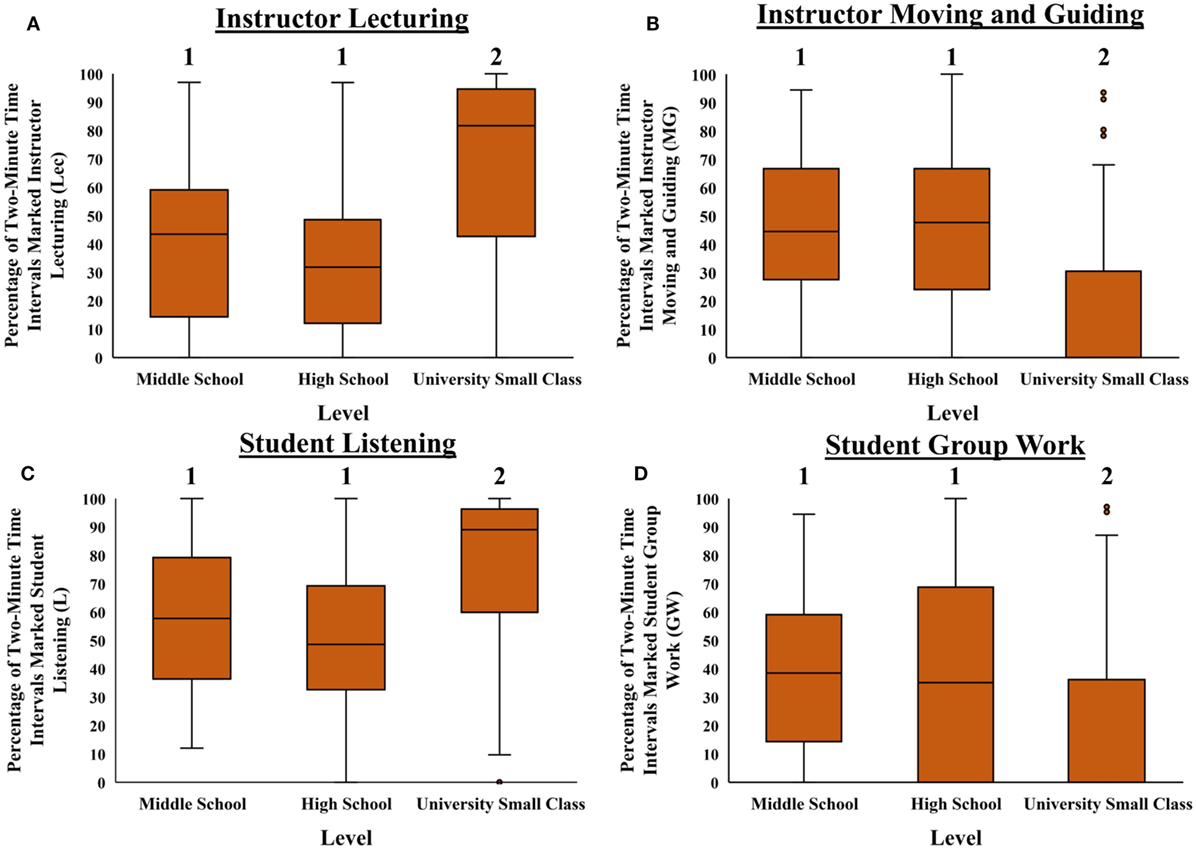
Figure 10. Comparison of the relative frequency of four Classroom Observation Protocol for Undergraduate STEM codes (A) Instructor Lecturing (Lec), (B) Instructor Moving and Guiding (MG), (C) Student Listening (L), and (D) Student Group Work (GW) for middle school, high school, and university classes with fewer than 30 students. Box-and-whisker plots showing the median and variation between the four instructional levels. The line in the middle of the box represents the median percentage of 2-min time intervals for the class sessions in each level. Boxes represent the interquartile range, whiskers represent 1.5 times the interquartile range, and data points not included in 1.5 times the interquartile range are shown with dots. Levels labeled with different numbers indicate a significant difference in mean ranks by a post hoc Dunn’s pairwise comparison (Kruskal–Wallis Test, Instructor Lec χ2 = 43.28, Instructor MG χ2 = 52.35, Student Listening χ2 = 40.23, Student GW χ2 = 18.59, df = 2, N = 192, p < 0.001 in all cases; Dunn’s pairwise comparisons, p < 0.001 for levels labeled with different numbers).
Length of Class Effect
Another explanation for differences in instructional practices is length of class time. For example, longer class periods may provide more opportunities for active learning. To investigate, we examined the correlation between the total number of 2-min time intervals and percentage of 2-min time intervals with the Instructor Lec code for middle school, high school, first-year university, and advanced university classes. For middle school, high school, and first-year university classes, there is a non-significant correlation between length of time and percent time lecturing (middle school and high school: r = 0.007, R2 < 0.01, p > 0.05, first-year university: r = −0.09, R2 < 0.01, p > 0.05). For advanced university classes, there is a significant negative correlation (r = −0.18, R2 = 0.03, p < 0.05), which is considered a small to medium effect size (Cohen, 1988), suggesting that longer class periods had fewer 2-min time intervals that included lecturing.
Laboratory Effect
Another difference between middle school, high school, and university classes is the placement of laboratory activities within the course structure. In middle and high school, laboratory activities are incorporated into the same class periods as other class activities. At the university level, laboratories are often scheduled at separate times and in different locations. Because COPUS is designed to capture observation data in the lecture portion of a course, our data set does not include observations of the laboratory sections. Therefore, an explanation for the instructional differences we observed between educational levels could be that at the university-level we were only focusing on the lecture portion of the classes and, therefore, missing other active-learning activities that are part of the course but taught in the laboratory. To investigate whether or not having a required laboratory influenced the amount of active learning that occurred in the lecture portion of the university classroom, we compared data from university courses that did and did not have a required laboratory section associated with the lecture portion of the course. We saw a similar range of the relative abundance of instructor and student COPUS codes in courses that require laboratory sections and those that do not, suggesting that the presence of the laboratory section of a course is not greatly decreasing the amount of active learning occurring in the lecture section (Figures 11A–D). Our data also showed that classes taught with and without required laboratory sections had similar interquartile ranges of percent 2-min time interval values for the Instructor Lec and Student Listening codes (Figures 11E,F). A comparison of Instructor Lec and Student Listening medians, using Mann–Whitney U Tests, shows that there were no statistically significant differences (p > 0.05) between classes taught with and without required laboratory sections for the Instructor Lec and Student Listening codes.
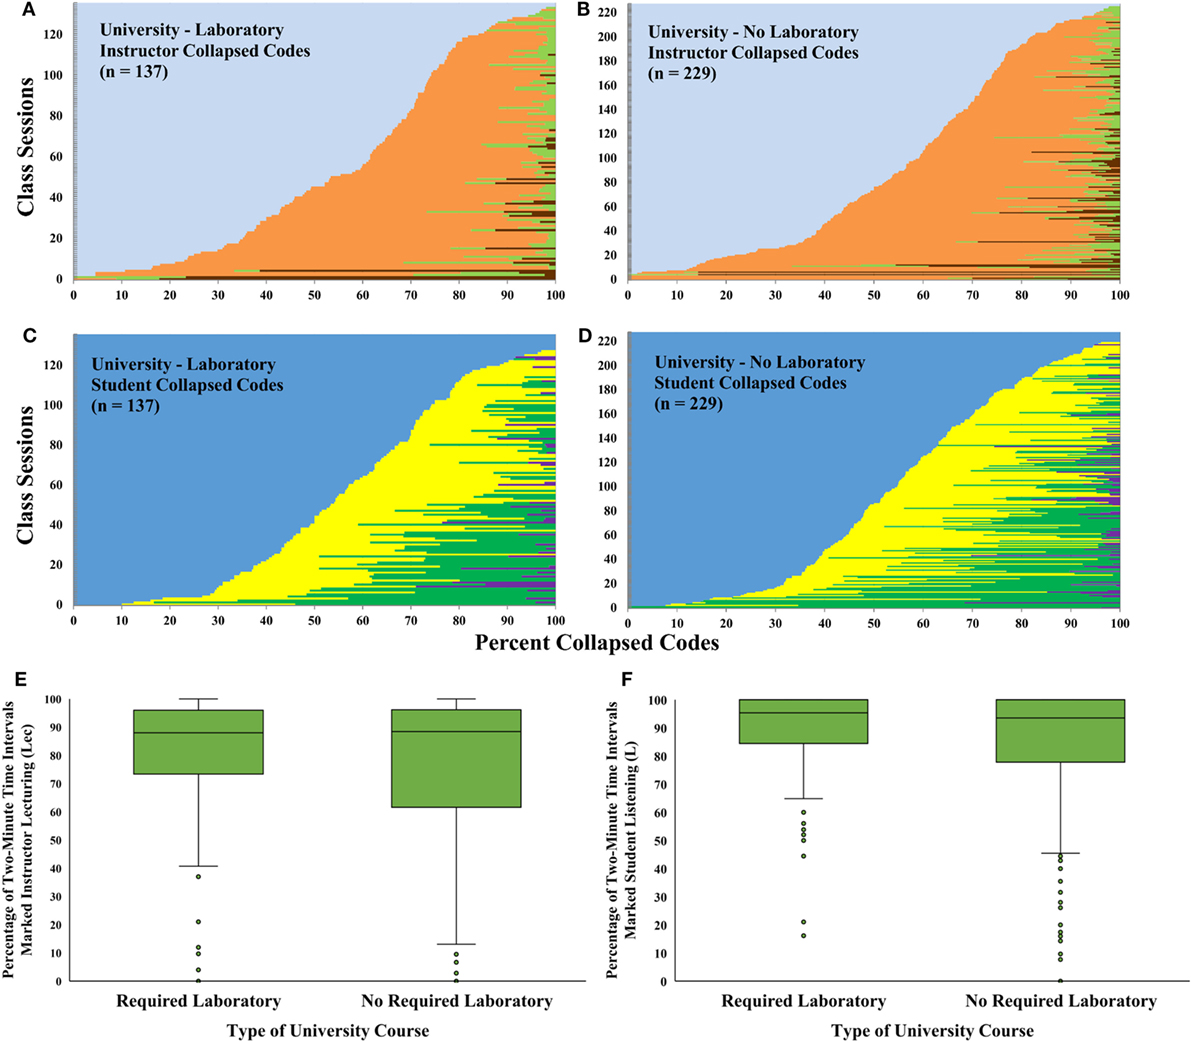
Figure 11. A comparison of university classes with and without a required laboratory section. Percentage of instructor collapsed Classroom Observation Protocol for Undergraduate STEM (COPUS) codes for all university class observations (A) with required laboratory sections and (B) with no required laboratory section ordered by percent Instructor Presenting. Percentage of student collapsed COPUS codes for all university class observations (C) with required laboratory sections and (D) with no required laboratory section ordered by percent Student Receiving. Each horizontal bar represents a different class session. (E) Box-and-whisker plots showing the median and variation of the COPUS code Instructor Lecturing (Lec) for the two types of university classes. (F) Box-and-whisker plots showing the median and variation of the COPUS code Student Listening for the two types of university classes. The line in the middle of the box represents the median percentage of 2-min time intervals. Boxes represent the interquartile range, whiskers represent 1.5 times the interquartile range, and data points not included in 1.5 times the interquartile range are shown with dots. There are no significant differences in Instructor Lec or Student Listening medians for university classes with and without a required laboratory section (Mann–Whitney U, Lec χ2 = 16,526.5, Listening χ2 = 16,733.0, N = 366, p > 0.05 in both cases).
Perceptions of Instruction across Educational Levels
To determine how educators perceive instructional differences across multiple education levels, middle school, high school, and university instructors were sent a survey that asked them to predict which of four graphs showed the correct depiction of how much time on average instructors spent lecturing at each educational level (Figure 12A). Graph B, less lecturing in middle school and high school classrooms compared with both first-year and advanced university classes, most closely matches the observation data.
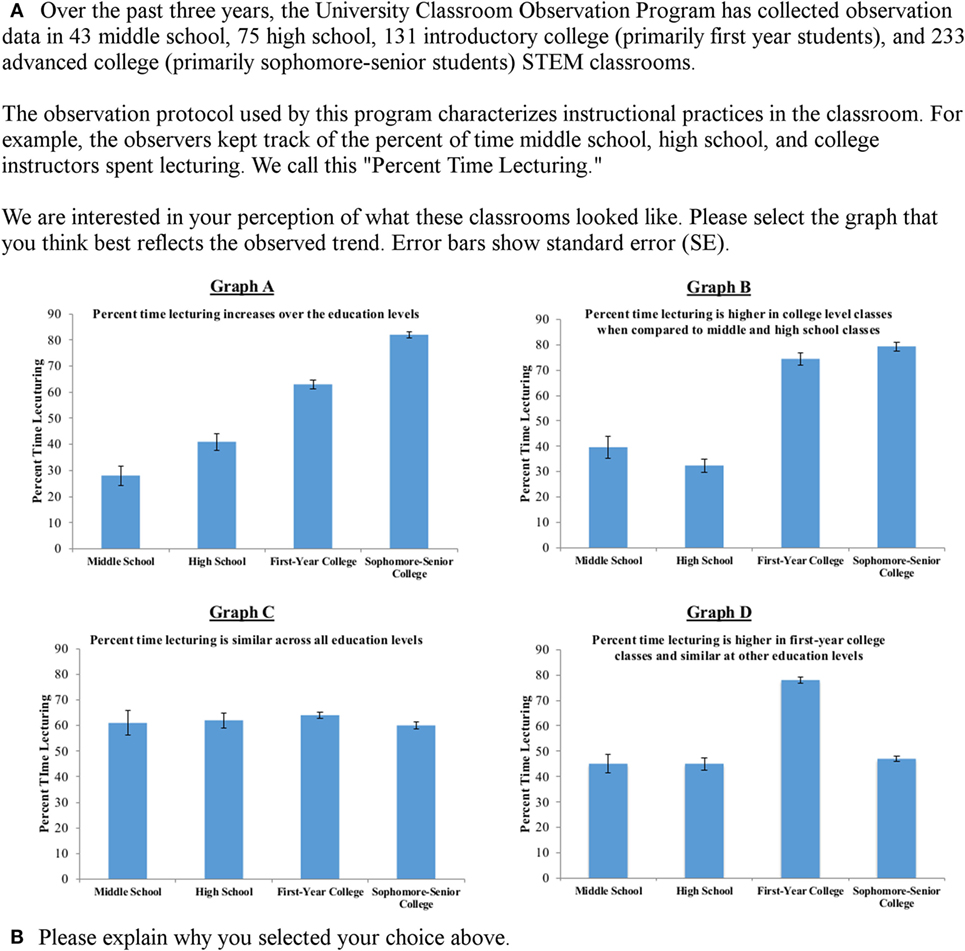
Figure 12. Middle school, high school, and university-level instructors were asked to respond to a survey that included (A) a multiple-choice question asking them to predict the Instructor Lecturing code trend we observed with the Classroom Observation Protocol for Undergraduate STEM data and (B) an open-response question where they explained their answer choice.
All three groups of instructors (middle school, high school, and university) most frequently selected graphs that showed a shift in the amount of lecturing across educational levels (Figure 13). Both middle school and high school instructors most commonly predicted graphs that were not aligned with the observed trend; namely, they tended to select graph A, a gradual increase in the amount of instructor lecturing between each level, and graph D, more instructor lecturing in first-year college classes compared with the other three levels. Because the trends in the data were similar for middle and high school teacher responses, these data were combined in subsequent analyses. University instructors most commonly predicted B, less lecturing in middle school and high school classrooms compared with both first-year and advanced university classes (which most closely matches observation data), and graph D.
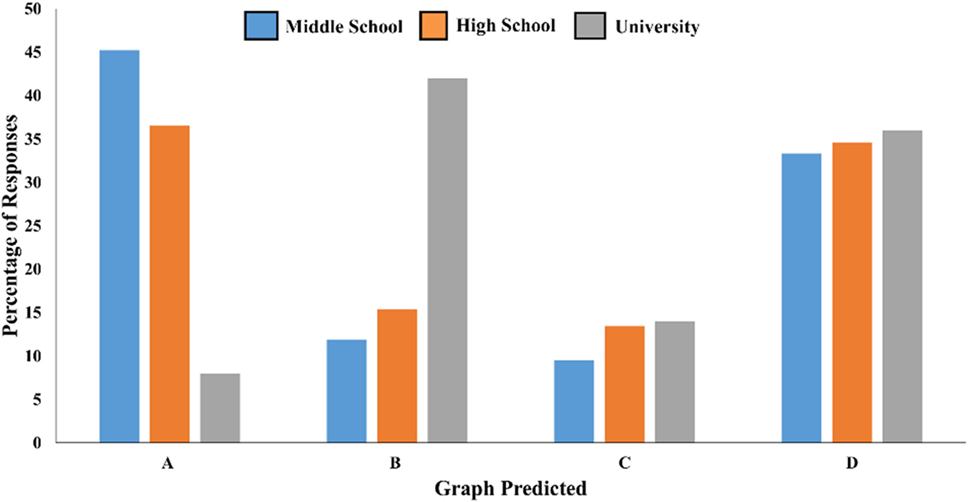
Figure 13. Frequency of responses by graph type for middle school (n = 42), high school (n = 52), and university instructors (n = 50).
The instructors were also asked to explain why they chose a particular graph (Figure 12B), and content analysis was used to categorize the responses. Middle and high school instructors who chose graph A, showing an increasing amount of lecturing over all educational levels, most commonly used “personal experience” (47%) as part of their explanation. The instructors drew on experiences both as students and teachers. As one middle school teacher wrote, “From my observations and memories there seems to be an increasing trend to more lecturing and note taking as students progress from middle school to high school to college.” Another high school teacher made a clearer distinction by writing, “When I was in class at UMaine in 2002–2004 lecturing was the main teaching method. As a high school teacher now, student exploration is much more prevalent.”
Many middle school and high school instructors who chose graph D, showing first-year college classes as having more lecture than the other three levels, pointed to the common difference in class size for these first-year courses (56%). One high school teacher wrote, “First year university classes tend to be very large and held in an area that would be difficult to do anything but lecture.” Some viewed the differences in instruction as a result of alternative standards regarding the use of active learning (53%), such as a middle school teacher who wrote, “Active learning is actively encouraged in the middle and high school level as part of our understanding of best practices in pedagogy. University, on the other hand, doesn’t require the same level of pedagogical understanding.”
Many university instructors who chose graph D pointed to class size (61%) as the effect that the large enrollments of first-year classes have on the instruction, such as one instructor who wrote, “The largest classes are first year university classes and the most traditional way to teach a large class is with lectures.” Instructors in this group also stated they had no knowledge of instructional practices at other educational levels (50%): “I have no idea what it would be like in high school, but I would think that first year college classes spend more time lecturing than more senior classes because class size decreases at higher levels.”
University instructors who predicted graph B, showing middle school and high school with much less lecturing than both first-year and advanced university classes, most commonly used “active learning” (57%) as an explanation for their choice. Some of these instructors based their reasoning on the perceived needs of students at different levels, such as one instructor who wrote, “I imagine middle and high school students need more hands-on, interactive learning than college-level students.” Others invoked the observations they have made in the classroom. A different university instructor explained, “In general, I see more interactive activity happening at the K12 level than the college level.”
Discussion
This study is one of the first to compare instructional practices in STEM classrooms across multiple education levels, from middle school through university, using a single observation instrument. Previous studies have used the same instrument to measure instruction in either high school or university classrooms (Roehrig and Kruse, 2005; Ebert-May et al., 2011; Yezierski and Herrington, 2011; Lund et al., 2015), but we used the same observation instrument to make direct comparisons across a continuum of educational levels within the same study. Observations conducted with the COPUS instrument show that in middle school and high school classrooms, there is significantly less time dedicated to teacher-centered practices (Instructor Lecturing and Student Listening) and significantly more time dedicated to active-learning practices (Instructor Guiding and Students Working in Groups) compared with university classrooms (Figures 3–8). In addition, there are no significant differences in instructional practices or student experiences between first-year and advanced-level university classes. These results show that the largest transition in classroom experiences occurs between high school and first-year undergraduate courses.
Potential explanations for our results include the following: (1) class size effects since university classes are typically much larger than middle school and high school classes, (2) class period length effects, and (3) the fact that laboratory work can be included in middle school and high school class meetings but takes place in dedicated laboratory sections at the university level. We discuss each of these potential explanations below:
Large class size has been reported by faculty as a barrier to implementing active-learning strategies (Henderson et al., 2011; Shadle et al., 2017). Furthermore, the survey data collected as part of this study, which contain explanations of instructor predictions for lecture frequency across multiple educational levels, show that class size was a common explanation for predicted differences in instructional practices across educational levels (Figures 12 and 13). However, our observation data reveal that even in small university classes with 30 or fewer students, there is significantly more time dedicated to teacher-centered practices (Instructor Lec and Student Listening) and significantly less time dedicated to active-learning practices (Instructor Guiding and Students Working in Groups) than in middle school and high school classrooms (Figures 9 and 10), thereby ruling out this explanation.
Longer classes could provide more opportunities to incorporate active learning into the class period. Our data show that there is a non-significant correlation between class period length and the percentage of time dedicated to lecturing at the middle school, high school, and first-year university levels. At the advanced university level, our data reveal a modest negative correlation between the same two variables, which suggests that having longer time blocks for advanced university classes may enable instructors to use instructional techniques beyond lecture.
Laboratory sections, which are often separate classes at the university level, typically provide opportunities for students to actively engage in doing experiments. Because COPUS is designed for non-laboratory observations, the results here only pertain to the lecture sections of courses, and we are not capturing all the educational opportunities university students engage in during a course. Therefore, it might be predicted that classes with a separate laboratory sections have less active learning in the lecture section because any active components occur in the laboratory. However, we do not find significant differences between the amount of Instructor Lec and Student Listening in university classes that require and do not require a laboratory section (Figure 11), which rules out this explanation.
Taken together, these results suggest that the observed differences in instruction between educational levels are not solely a function of class size, class length, or a course structure including a required laboratory section.
One limitation of our study is that the middle school and high school instructors came from a variety of schools and the university faculty came from one institution that is the primary public university in the state of Maine. Future studies should be performed across additional secondary schools and universities to better understand how classroom pedagogies and student transitions are influenced by different school cultures at multiple education levels.
When we surveyed middle school, high school, and university instructors, most were unaware of the instructional differences shown by our findings (Figure 13). Other than using class size to explain their predictions, instructors also commonly cited personal experience and/or the perceived amount of active learning at each level as rationale. Our data show that many instructors are unfamiliar with the classroom environments their students are either coming from or heading to in the future. This disconnect represents a barrier to instructional reform aimed at best supporting students as they transition from high school to college. Addressing this issue and developing solutions that target the instructional gap represents an important part of working toward improving retention for undergraduates interested in STEM careers.
How Can We Address the Instructional Gap?
One way to address the instructional gap between high school and first-year undergraduate classes is to promote active learning at the undergraduate level. Due in part to national calls for reform of introductory undergraduate STEM courses (Mervis, 2009; American Association for the Advacement in Science, 2011; President’s Council of Advisors on Science and Technology, 2012), many institutions have already begun to implement more active-learning instruction into these courses (Armbruster et al., 2009; Haak et al., 2011; Jensen and Lawson, 2011; Freeman et al., 2014). These changes have led to increases in learning and retention for all students (Freeman et al., 2014), with even greater improvements for traditionally underrepresented minority and first-generation students (Haak et al., 2011; Eddy and Hogan, 2014). Our results show that institutions and instructors could look to high school and middle school classrooms for inspiration on how to begin or continue transforming their introductory courses. In addition, by examining high school and middle school classrooms, university instructors can gain a better understanding of the instructional environment their students most recently experienced.
Given that our results show students experience the greatest shift in classroom experiences between high school and university, institutions and instructors on both sides of the high school to university transition can help students succeed and ultimately persist in STEM degree programs. Due to a number of logistical barriers, connections between instructors at these two levels are rare, but shifting this paradigm could lead to increased instructor awareness and better alignment of instructional practices. One straightforward way to grow connections is through events at which instructors from different levels can meet to discuss common topics, ask questions of one another, and promote a clearer understanding of the types of classrooms students are coming from or heading to in the future. These discussions could be framed around the evidence supporting the use of active learning at the undergraduate level and how it can be effectively used regardless of class size (Resources: http://www.cwsei.ubc.ca/resources/instructor_guidance.htm). Also, because COPUS measures the type of active learning but not necessarily the quality of the teacher–student interactions or educational materials, observation data could be used as a way to start additional conversations about deeper teaching and learning issues.
Classroom observations can provide the basis for another type of productive interaction between teachers at different levels. Specifically, college faculty can observe middle and high school classes and vice versa. Previous work has shown that observations can promote change in both the observed instructors and the observers themselves (Cosh, 1998). At the most fundamental level, the feedback received by the instructor based on the observation can lead to an increased awareness of best practices being utilized and areas for future growth. In addition, observing and giving feedback on lessons is helpful for the observer, who can use the opportunity to reflect on their own practices. As a part of the University of Maine’s University Classroom Observation Program, middle school and high school teachers observe university faculty and give feedback on specific areas indicated by faculty (Smith et al., 2014). As a result, a subset of the faculty who teach first-year courses have made connections with these teachers and visited high school classrooms. With careful consideration, these types of interactions can be facilitated at multiple levels from individuals to departments to entire institutions. Our group is also beginning to explore long-term professional development activities where groups of university faculty and high school teachers meet regularly to discuss instructional transitions and work toward developing specific approaches that would support student transitions from high school to college STEM instruction.
How Can We Learn More About the Student Experience?
Our results are limited to observation data and instructor perspectives, but additional student surveys could provide useful insight into the perceptions and challenges faced by students as they transition from high school to college. Previous work has used student surveys to document the way groups of students perceive and think about their education. For example, one study investigating what types of expectations students had about pedagogy in college STEM classes found that first-year students expected more active-learning techniques to be used than non-first-year students (Brown et al., 2017). Furthermore, using surveys has been an effective way of measuring student buy-in and engagement with STEM classes (Brazeal et al., 2016; Cavanagh et al., 2016). These studies revealed that students think that active-learning teaching strategies support their learning in class and lead them to engage in more self-regulated learning habits out of class, such as meeting with other students to complete assignments.
To build upon our own findings, student surveys could provide useful information about how students view the transition between high school and university in terms of classroom instruction. For example, these types of student perceptions could inform researchers and instructors alike about which students would be predicted to struggle with the transition to university STEM classrooms. In addition, these surveys would give college students the opportunity to ask questions about the transition, and faculty could be aware of and address these questions in class. Longitudinal studies of how student instructional experiences affect attrition rates and student achievement are also needed to determine the efficacy of increased active learning at the undergraduate level.
Conclusion
Our observation-based study of STEM classrooms across multiple educational levels shows that a notable instructional transition occurs between high school and first-year college courses, which cannot solely be attributed to differences in class size, class length, or the presence of dedicated laboratory sections. The shift from more active learning in middle school and high school to classes with more time dedicated to lecture-based instruction at the university level could be contributing to STEM student retention issues. Building on our findings, we propose that future advances in improving retention rates in college STEM majors could be achieved by (1) increasing the amount of interactions between middle school, high school, and university instructors through programs that include classroom observations, (2) developing long-term professional development programs that will work to narrow the instructional gap between high school and university by promoting more active learning in college STEM classrooms, and (3) measuring the efficacy of these programs by tracking the persistence and graduation rates of students who enter universities interested in earning a STEM degree.
Ethics Statement
This study was carried out in accordance with the recommendations of the Policies and Procedures for the Protection of Human Subjects of Research, The Institutional Review Board at the University of Maine with informed consent from all subjects. All subjects gave written informed consent in accordance with the Declaration of Helsinki. The protocol were approved by the The Institutional Review Board at the University of Maine.
Author Contributions
KA: conceived of study, collected and analyzed data, and drafted manuscript. EB: collected and analyzed data. BC and MS: conceived of study and edited manuscript. JL and EV: collected and analyzed data, and edited manuscript. MRS: conceived of study, discussed data analysis, and edited manuscript. MKS: conceived of study, analyzed data, and drafted manuscript.
Conflict of Interest Statement
The authors declare that the research was conducted in the absence of any commercial or financial relationships that could be construed as a potential conflict of interest.
Acknowledgments
This material is based on work supported by the National Science Foundation under grants DRL 0962805 and DUE 1347577, 1712060, and 1712074. Any opinions, findings, and conclusions or recommendations expressed in this material are those of the authors and do not necessarily reflect the views of the National Science Foundation. This work was also supported by a grant from the University of Maine Graduate Student Government. We would like to thank the middle and high school teachers who conducted the university-level observations and Jeremy Smith for his help with the data analysis.
References
American Association for the Advacement in Science. (2011). Vision and Change in Undergraduate Biology Education: A Call to Action. Washington, DC: American Association for the Advancement in Science.
Armbruster, P., Patel, M., Johnson, E., and Weiss, M. (2009). Active learning and student-centered pedagogy improve student attitudes and performance in introductory biology. CBE Life Sci. Educ. 8, 203–213. doi: 10.1187/cbe.09
Brazeal, K. R., Brown, T. L., and Couch, B. A. (2016). Characterizing student perceptions of and buy-in toward common formative assessment techniques. CBE Life Sci. Educ. 15, 4. doi:10.1187/cbe.16-03-0133
Brockliss, L. (1996). “Curricula,” in A History of the University in Europe: Vol. II, Universities in Early Modern Europe, ed. H. De Ridder-Symoens (Cambridge: Cambridge University Press), 565–620.
Brown, T. L., Brazeal, K. R., and Couch, B. A. (2017). First-year and non-first-year student expectations regarding in-class and out-of-class learning activities in introductory biology. J. Microbiol. Biol. Educ. 18, 1. doi:10.1128/jmbe.v18i1.1241
Campbell, C. M., Cabrera, A. F., Ostrow, M. J., and Patel, S. (2016). From comprehensive to singular: a latent class analysis of college teaching practices. Res. Higher Educ. 58, 581–604. doi:10.1007/s11162-016-9440-0
Cavanagh, A. J., Aragón, O. R., Chen, X., Couch, B., Durham, M., Bobrownicki, A., et al. (2016). Student buy-in to active learning in a college science course. CBE Life Sci. Educ. 15, 4. doi:10.1187/cbe.16-07-0212
Cleveland, L. M., Olimpo, J. T., and DeChenne-Peters, S. E. (2017). Investigating the relationship between instructors’ use of active-learning strategies and students’ conceptual understanding and affective changes in introductory biology: a comparison of two active-learning environments. CBE Life Sci. Educ. 16, 2. doi:10.1187/cbe.16-06-0181
Cohen, J. (1988). Statistical Power Analysis for the Behavioral Sciences. Hillsdale, NJ: Lawrence Earlbaum Associates.
Cosh, J. (1998). Peer observation in higher education – a reflective approach. Innov. Educ. Train. Int. 35, 171–176. doi:10.1080/1355800980350211
Eagan, K., Hurtado, S., Figueroa, T., and Hughes, B. (2014). Examining STEM Pathways among Students Who Begin College at Four-Year Institutions. 1–27. Available at: http://sites.nationalacademies.org/cs/groups/dbassesite/documents/webpage/dbasse_088834.pdf
Ebert-May, D., Derting, T., Hodder, J., Momsen, J., Long, T., and Jardeleza, S. (2011). What we say is not what we do: effective evaluation of faculty professional development programs. Bioscience 61, 550–558. doi:10.1525/bio.2011.61.7.9
Ebert-May, D., Derting, T. L., Henkel, T. P., Maher, J. M., Momsen, J. L., Arnold, B., et al. (2015). Breaking the cycle: future faculty begin teaching with learner-centered strategies after professional development. CBE Life Sci. Educ. 14, 2. doi:10.1187/cbe.14-12-0222
Eddy, S. L., and Hogan, K. A. (2014). Getting under the hood: how and for whom does increasing course structure work? CBE Life Sci. Educ. 13, 453–468. doi:10.1187/cbe.14-03-0050
Freeman, S., Eddy, S. L., McDonough, M., Smith, M. K., Okoroafor, N., Jordt, H., et al. (2014). Active learning increases student performance in science, engineering, and mathematics. Proc. Natl. Acad. Sci. U.S.A. 111, 8410–8415. doi:10.1073/pnas.1319030111
Garrett, R., and Steinberg, M. P. (2015). Examining teacher effectiveness using classroom observation scores: evidence from the randomization of teachers to students. Educ. Eval. Policy Anal. 37, 224–242. doi:10.3102/0162373714537551
Haak, D., HilleRisLambers, J., Pitre, E., and Freeman, S. (2011). Increased structure and active learning reduce the achievement gap in introductory biology. Science 332, 1213–1216. doi:10.1126/science.1204820
Henderson, C., Beach, A., and Finkelstein, N. (2011). Facilitating change in undergraduate STEM instructional practices: an analytic review of the literature. J. Res. Sci. Teach. 48, 952–984. doi:10.1002/tea.20439
Hora, M. T., Oleson, A., and Ferrare, J. J. (2013). Teaching Dimensions Observation Protocol (TDOP) User’s Manual. University of Wisconsin-Madison. Available at: http://tdop.wceruw.org/Document/TDOP-Users-Guide.pdf
Jensen, J. L., and Lawson, A. (2011). Effects of collaborative group composition and inquiry instruction on reasoning gains and achievement in undergraduate biology. CBE Life Sci. Educ. 10, 64–73. doi:10.1187/cbe.10-07-0089
Landis, J. R., and Koch, G. G. (1977). The measurement of observer agreement for categorical data. Biometrics 33, 159–174. doi:10.2307/2529310
Lewin, J. D., Vinson, E. L., Stetzer, M. R., and Smith, M. K. (2016). A campus-wide investigation of clicker implementation: the status of peer discussion in STEM classes. CBE Life Sci. Educ. 15, 1. doi:10.1187/cbe.15-10-0224
Lund, T. J., Pilarz, M., Velasco, J. B., Chakraverty, D., Rosploch, K., Undersander, M., et al. (2015). The best of both worlds: building on the COPUS and RTOP observation protocols to easily and reliably measure various levels of reformed instructional practice. CBE Life Sci. Educ. 14, 2. doi:10.1187/cbe.14-10-0168
Manduca, C. A., Iverson, E. R., Luxenberg, M., Macdonald, R. H., McConnell, D. A., Mogk, D. W., et al. (2017). Improving undergraduate STEM education: the efficacy of discipline-based professional development. Sci. Adv. 3, 2. doi:10.1126/sciadv.1600193
Mervis, J. (2009). Universities begin to rethink first-year biology courses. Science 325, 5940. doi:10.1126/science.325
Miles, M. B., Huberman, A. M., and Saldana, J. (2013). Qualitative Data Analysis: A Methods Source Book. Thousand Oaks, CA: SAGE.
President’s Council of Advisors on Science and Technology. (2012). Engage to Excel: Producing One Million Additional College Graduates with Degrees in Science, Technology, Engineering, and Mathematics. President’s Council of Advisors on Science and Technology.
Prince, M. (2004). Does active learning work? A review of the research. J. Eng. Educ. 93, 223–231. doi:10.1002/j.2168-9830.2004.tb00809.x
Pryor, J. H., and Eagan, K. (2013). The American Freshman: National Norms Fall 2012. Available at: https://www.heri.ucla.edu/monographs/TheAmericanFreshman2012-Expanded.pdf
Rockoff, J. E., Jacob, B. A., Kane, T. J., and Staiger, D. O. (2008). Can you recognize an effective teacher when you recruit one? Natl. Bur. Econ. Res. 6, 43–74. doi:10.1017/CBO9781107415324.004
Roehrig, G. H., and Kruse, R. A. (2005). The role of teachers’ beliefs and knowledge in the adoption of a reform-based. School Sci. Math. 105, 412–422. doi:10.1111/j.1949-8594.2005.tb18061.x
Sawada, D., Piburn, M. D., Judson, E., Turley, J., Falconer, K., Benford, R., et al. (2002). Measuring reform practices in science and mathematics classrooms: the reformed teaching observation protocol. School Sci. Math. 102, 245–253. doi:10.1111/j.1949-8594.2002.tb17883.x
Shadle, S. E., Marker, A., and Earl, B. (2017). Faculty drivers and barriers: laying the groundwork for undergraduate STEM education reform in academic departments. Int. J. STEM Educ. 4, 1. doi:10.1186/s40594-017-0062-7
Smith, M. K., Jones, F. H. M., Gilbert, S. L., and Wieman, C. E. (2013). The classroom observation protocol for undergraduate stem (COPUS): a new instrument to characterize university STEM classroom practices. CBE Life Sci. Educ. 12, 618–627. doi:10.1187/cbe.13-08-0154
Smith, M. K., Vinson, E. L., Smith, J. A., Lewin, J. D., and Stetzer, M. R. (2014). A campus-wide study of STEM courses: new perspectives on teaching practices and perceptions. CBE Life Sci. Educ. 13, 624–635. doi:10.1187/cbe.14-06-0108
Van Noy, M., and Zeidenberg, M. (2014). Hidden STEM Producers: Community Colleges’ Multiple Contributions to STEM Education and Workforce Development. Available at: http://nationalacademies.org/
Watkins, B. J., and Mazur, E. (2013). Retaining students in science, technology, engineering, and mathematics (STEM) majors. J. Coll. Sci. Teach. 42, 36–41.
Keywords: active-learning, classroom observation, secondary education, undergraduate education, educational transitions
Citation: Akiha K, Brigham E, Couch BA, Lewin J, Stains M, Stetzer MR, Vinson EL and Smith MK (2018) What Types of Instructional Shifts Do Students Experience? Investigating Active Learning in Science, Technology, Engineering, and Math Classes across Key Transition Points from Middle School to the University Level. Front. Educ. 2:68. doi: 10.3389/feduc.2017.00068
Received: 27 October 2017; Accepted: 14 December 2017;
Published: 22 January 2018
Edited by:
Rob Cassidy, Concordia University, CanadaReviewed by:
Sue Wick, University of Minnesota Twin Cities, United StatesDeborah Donovan, Western Washington University, United States
Copyright: © 2018 Akiha, Brigham, Couch, Lewin, Stains, Stetzer, Vinson and Smith. This is an open-access article distributed under the terms of the Creative Commons Attribution License (CC BY). The use, distribution or reproduction in other forums is permitted, provided the original author(s) or licensor are credited and that the original publication in this journal is cited, in accordance with accepted academic practice. No use, distribution or reproduction is permitted which does not comply with these terms.
*Correspondence: Kenneth Akiha, a2VubmV0aC5ha2loYUBtYWluZS5lZHU=
 Kenneth Akiha
 Emilie Brigham
 Brian A. Couch
 Justin Lewin1,2
 Marilyne Stains
 MacKenzie R. Stetzer
 Erin L. Vinson
 Michelle K. Smith