 Jiaer Yang1,2
 Pinglang Kou1,2*
 Xu Dong1,2Ying Xia2Qinchuan Gu2Yuxiang Tao1Jiangfan Feng2
 Qin Ji3Weizao Wang4
 Ram Avtar5
- 1Chongqing Engineering Research Center of Spatial Big Data Intelligent Technology, Chongqing University of Posts and Telecommunications, Chongqing, China
- 2Key Laboratory of Tourism Multisource Data Perception and Decision, Ministry of Culture and Tourism (TMDPD, MCT), Chongqing University of Posts and Telecommunications, Chongqing, China
- 3Chongqing Key Laboratory of GIS Application, School of Geography and Tourism, Chongqing Normal University, Chongqing, China
- 4College of Urban Geology and Engineering, Hebei GEO University, Shijiazhuang, China
- 5Institute of Satellite Remote Sensing and Geographic Information Systems, Hokkaido University, Hokkaido, Japan
Introduction: Surface deformation in the Three Gorges Reservoir area poses significant threats to infrastructure and safety due to complex geological and hydrological factors. Despite existing studies, systematic exploration of long-term deformation characteristics and their driving mechanisms remains limited. This study combines SBAS-InSAR technology and machine learning to analyze and predict surface deformation in Fengjie County, Chongqing, China, between 2020 and 2022, focusing on riverside urban ground, riverside road slopes, and ancient landslides in the reservoir area.
Methods: SBAS-InSAR technology was applied to 36 Sentinel-1A images to monitor surface deformation, complemented by hydrological and meteorological data. Machine learning models—Random Forest (RF), Extremely Randomized Trees (ERT), Gradient Boosting Decision Tree (GBDT), Support Vector Regression (SVR), and Long Short-Term Memory (LSTM)—were evaluated using six metrics, including RMSE, R2, and SMAPE, to assess their predictive performance across diverse geological settings.
Results: Deformation rates for riverside urban ground, road slopes, and ancient landslides were −3.48 ± 2.91 mm/yr, −5.19 ± 3.62 mm/yr, and −6.02 ± 4.55 mm/yr, respectively, with ancient landslides exhibiting the most pronounced deformation. A negative correlation was observed between reservoir water level decline and subsidence, highlighting the influence of seasonal hydrological adjustments. Urbanization and infrastructure development further exacerbated deformation processes. Among the models, LSTM demonstrated superior predictive accuracy but showed overestimation trends in ancient landslide areas.
Discussion: Reservoir water level adjustments emerged as a critical driver of subsidence, with rapid water level declines leading to increased pore pressure and soil compression. Seasonal effects were particularly evident, with higher subsidence rates during and after the rainy season. Human activities, including urbanization and road construction, significantly intensified deformation, disrupting natural geological conditions. Progressive slope failure linked to road expansion underscored the long-term impacts of engineering activities. For ancient landslides, accelerated deformation patterns were linked to prolonged drought and reservoir-induced hydrological changes. While LSTM models showed high accuracy, their limitations in complex geological settings highlight the need for hybrid approaches combining machine learning with physical models. Future research should emphasize developing integrated frameworks for long-term risk assessment and mitigation strategies in reservoir environments.
Conclusions: This study provides new insights into the complex surface dynamics in the Three Gorges Reservoir area, emphasizing the interplay of hydrological, geological, and anthropogenic factors. The findings highlight the need for adaptive management strategies and improved predictive models to mitigate subsidence risks.
1 Introduction
Ground subsidence is a widespread geological phenomenon that poses a serious threat to infrastructure safety, environmental stability, and socio-economic development in many regions worldwide. This phenomenon not only affects the integrity of buildings and infrastructure but can also lead to increased flood risk, groundwater contamination, and ecosystem degradation (Herrera-García et al., 2021). In the past few decades, with the acceleration of urbanization and the construction of large-scale water conservancy projects, ground subsidence issues have become increasingly prominent, attracting widespread attention from the scientific community and policymakers. Particularly in areas affected by large-scale water conservancy projects such as the Three Gorges Reservoir area, ground subsidence exhibits more complex characteristics and potential risks due to its unique geological conditions, complex hydrological environment, and frequent human activities (Wang et al., 2020; Li et al., 2024).
The Three Gorges Reservoir, as one of the world’s largest and most far-reaching water conservancy projects, has sparked extensive scientific discussion and research since its operation began. The operation of the reservoir has significantly changed the hydrological situation in the area, implementing a “winter storage, summer release” water level scheduling mode, resulting in annual water level fluctuations of up to 30 m (Bao et al., 2015). This large-scale, periodic water level change has had a profound impact on surface stability. The periodic changes in water level not only alter groundwater dynamics but may also affect the mechanical properties of rock and soil masses, thereby triggering or exacerbating geological hazards such as ground subsidence and landslides (Tang et al., 2019). However, the specific mechanisms and long-term effects of reservoir water level changes on surface deformation are still not fully understood, especially under different geological conditions and human activity intensities, where this relationship may exhibit complex nonlinear characteristics (Zhang et al., 2015; Yang et al., 2022).
In addition to reservoir water level changes, rainfall is also an important factor affecting surface stability in the Three Gorges Reservoir area. The region has a subtropical humid monsoon climate with abundant and unevenly distributed rainfall. Numerous studies have shown that rainfall can affect surface stability by increasing soil weight, reducing soil strength, and changing pore water pressure (Li et al., 2019). However, against the background of periodic reservoir water level changes, the mechanism of rainfall’s impact on surface deformation may be more complex. For example, the temporal configuration of reservoir water levels and rainfall may produce additive or offsetting effects, and the impact of these complex hydrological coupling processes on surface deformation needs further study (Wang et al., 2021).
Human activity is another important factor that cannot be ignored. With the rapid economic development of the Three Gorges Reservoir area, accelerated urbanization, large-scale infrastructure construction, and land use changes have significantly altered the original surface conditions. These human activities may affect surface deformation by changing surface cover, increasing ground load, and altering groundwater systems (Wang et al., 2020). The impact of human activities may be particularly significant in riverside urban areas and road construction areas. However, how to quantify and distinguish the relative contributions of human activities and natural factors to surface deformation remains a challenging scientific question (Fan et al., 2020; Ye et al., 2024).
In recent years, the rapid development of remote sensing technology has provided a powerful tool for large-scale, high-precision monitoring of surface deformation. Among these, Synthetic Aperture Radar Interferometry (InSAR) technology has been widely used in surface deformation monitoring due to its high spatial resolution and all-weather working capability (Ferretti et al., 2011; Shi et al., 2019). In particular, the Small Baseline Subset (SBAS) InSAR technique, by utilizing multi-temporal SAR data, can provide millimeter-level precision surface deformation measurements, greatly enhancing the ability to detect small surface deformations (Lanari et al., 2004). This technology not only provides information on the spatial distribution of surface deformation over large areas but can also capture the temporal evolution process of deformation, offering unprecedented opportunities for studying ground subsidence in complex geological environments (Zhao et al., 2019; Wang et al., 2020). However, how to effectively utilize this high-resolution spatiotemporal data to understand and predict ground deformation in complex geological environments remains an important scientific challenge (Osmanoğlu et al., 2016; Wang et al., 2020). Traditional data analysis methods often struggle to handle the high dimensionality and nonlinear characteristics of InSAR data, limiting our in-depth understanding and accurate prediction of surface deformation mechanisms.
Machine learning and deep learning technologies provide new approaches to addressing this challenge. These methods can extract valuable information from complex multi-source data, offering new possibilities for predicting ground deformation and assessing risks (Reichstein et al., 2019). For example, ensemble learning methods such as Random Forest (RF), Extremely Randomized Trees (ERT), and Gradient Boosting Decision Tree (GBDT) have shown excellent performance in handling nonlinear relationships and high-dimensional data (Chen and Guestrin, 2016). These methods can effectively capture complex relationships between surface deformation and various influencing factors by constructing multiple decision trees and combining their prediction results. Support Vector Regression (SVR) has attracted attention due to its advantages in small-sample learning (Cortes and Vapnik, 1995). By mapping the input space to a high-dimensional feature space, SVR can handle nonlinear problems, which is particularly useful for analyzing complex relationships in geological environments. In recent years, deep learning models such as Long Short-Term Memory (LSTM) networks have shown outstanding performance in time series prediction tasks, providing new possibilities for long-term prediction of surface deformation (Hochreiter and Schmidhuber, 1997). The design of LSTM allows it to capture long-term dependencies, which is particularly important for analyzing long-term trends and periodic changes in surface deformation. Although these machine-learning methods have achieved significant results in their respective fields, their performance differences and applicability in handling geological data, especially in the complex Three Gorges Reservoir environment, have not been fully studied (Ma and Mei, 2021). Each method has its advantages and limitations, and how to choose the most suitable model for specific geological environments and data characteristics, how to integrate the advantages of multiple models, and how to interpret model results and combine them with physical mechanisms are all issues that need in-depth discussion. Furthermore, the application of machine learning methods in surface deformation prediction still faces challenges such as data quality, model generalization ability, and uncertainty quantification. For example, how to handle noise and missing values in InSAR data, how to ensure the prediction stability of models at different spatiotemporal scales, and how to evaluate and communicate the uncertainty of prediction results are all important issues that need further research (Tiwari et al., 2020).
In this context, this study aims to combine SBAS-InSAR technology with various machine learning models to analyze in depth the deformation characteristics of different surface types in the Three Gorges Reservoir area and their driving factors. We selected Fengjie County, Chongqing, China, as the study area, which is located in the core area of the Three Gorges Reservoir and has typical geological features and climatic conditions. Specific objectives include (1) Quantifying and comparing deformation rates and patterns of different surface types (including riverside urban ground, riverside road slopes, and ancient landslides in the reservoir area); (2) Investigating the impacts of reservoir water level changes, rainfall, and human activities on surface deformation; (3) Evaluating and comparing the performance of different machine learning models in predicting surface deformation. Through this study, we expect not only to provide the scientific basis for geological disaster risk assessment and management in the Three Gorges Reservoir area but also to offer methodological references and experiential lessons for surface deformation research in similar areas affected by large-scale water conservancy projects.
2 Methodology
2.1 Study area
This study selected Fengjie County in Chongqing, China as the research area. The county is located in the core area of the Three Gorges Reservoir Region, in the northeast of Chongqing City. The coordinates of Fengjie County town were 31°1′6.78″N, 109°24′3.35″E (Figure 1). It was an area particularly prone to various geological disasters due to its geological characteristics and climatic conditions. As an important part of the Three Gorges Reservoir, this area was significantly affected by water level changes. After the completion of the Three Gorges Project, the hydrological situation in this area changed significantly (Zhang et al., 2016). The Three Gorges Reservoir implemented a water level scheduling mode of “winter storage and summer discharge”. From October to June of the following year was the water storage period, during which the water level gradually rose to about 175 m. From June to October was the flood discharge period, during which the water level gradually dropped to about 145 m (Bao et al., 2015). This periodic water level change had a significant impact on the stability of the local surface.
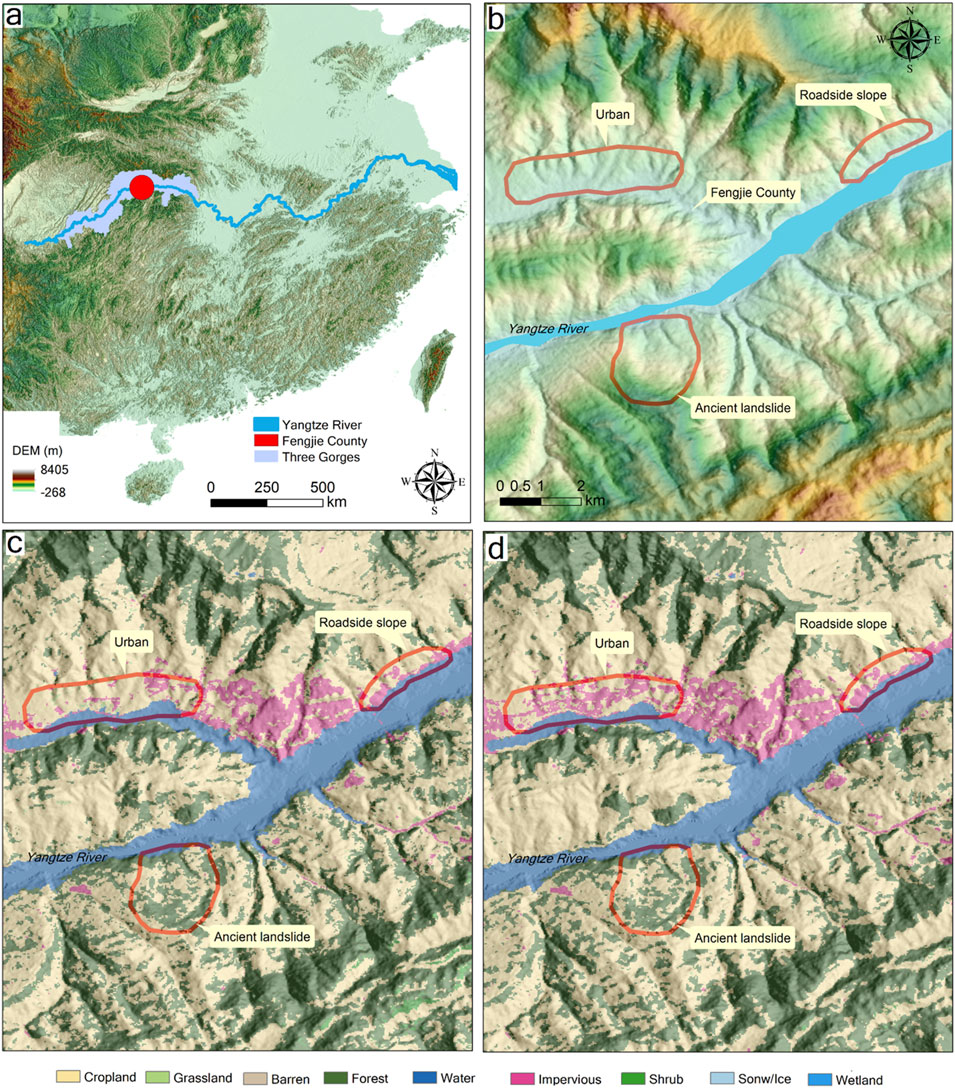
Figure 1. Location of the study area. (A) Location of the study area. (B) Three key areas of significant subsidence are under investigation. (C) Landuse in 2013. (D) Landuse in 2023. Fengjie County town is located at 31°01′03″N, 109°27′54″E.
The topography of Fengjie County was mainly mountainous and hilly, with large differences in altitude ranging from 70 m to 2,100 m. The geological structure was complex, mainly composed of limestone and sandstone, with most strata belonging to the Middle Triassic Badong Formation, characterized by fragmentation and looseness. The county had a subtropical humid monsoon climate with an average annual precipitation of about 1,145 mm, with 42% of the total annual rainfall occurring from July to September. This rainfall pattern interacted with reservoir water level regulation, producing complex effects on surface deformation and easily triggering geological disasters such as landslides.
The study area contained various land use types such as urban built-up areas, farmland, forests, and water bodies, with rich natural resources and complex geological structures. In recent years, with the acceleration of urbanization, the area had undergone rapid land use changes, especially in the riverside areas where many original wetlands and farmlands were converted to urban land. The urban areas along the river have been expanding significantly over the years (Figures 1C, D). The study focused on three typical areas: riverside urban ground, riverside road slopes, and ancient landslides in the reservoir area. The riverside urban ground had undergone significant urbanization, with original river wetlands being filled and large-scale infrastructure construction. The riverside road slope area had undergone road expansion projects, changing the original topography and geological structure. The ancient landslide area in the reservoir represented a typical geological disaster-prone area within the Three Gorges Reservoir, affected by both water level changes and human activities. Human activities in the study area were frequent, including urban construction, road engineering, and agricultural activities, which, together with natural factors, affected the stability of the surface. Especially in the ancient landslide area, increased human activities might have exacerbated surface instability. The operation of the Three Gorges Reservoir changed the natural flow process of downstream rivers, resulting in seasonal and daily regulation characteristics of river flow (Zhang et al., 2016). The unique geographical location, complex geological conditions, significant hydrological characteristics, and intensive human activities of Fengjie County made it an ideal place for studying surface subsidence and deformation in the Three Gorges Reservoir area, providing an excellent research platform for in-depth understanding of surface dynamic processes in reservoir areas.
2.2 Data sources
In this study, we utilized multiple data sources to comprehensively analyze surface subsidence and deformation in the Three Gorges Reservoir area of Fengjie County. The primary data consisted of 36 Single Look Complex (SLC) images acquired from the Sentinel-1A satellite’s ascending orbit, provided by NASA’s Synthetic Aperture Radar Data Center. These images covered the period from 1 January 2020, to 31 December 2022, offering monthly surface coverage data that provided valuable time series information for our research.
To enhance the accuracy of our analysis, we incorporated a 30-m resolution Shuttle Radar Topography Mission (SRTM) Digital Elevation Model (DEM) obtained from https://search.asf.alaska.edu/#/. This dataset played a crucial role in InSAR data processing, enabling us to perform differential InSAR processing and synthetic aperture radar offset tracking processing, thereby eliminating the influence of the topographic phase. This step was particularly important for accurate surface deformation analysis, especially when studying the impact of water level changes and rainfall.
To facilitate a comprehensive understanding of the driving factors behind surface deformation, we also collected relevant environmental data. Daily water level data of the Yangtze River was obtained from the Hubei Provincial Hydrological and Water Resources Center (http://113.57.190.228:8001/web/Report/RiverReport). Additionally, we acquired daily rainfall data from the National Centers for Environmental Information (NCEI) of the National Oceanic and Atmospheric Administration (NOAA) (https://www.ncei.noaa.gov/maps/daily/). These environmental datasets enabled us to analyze the relationship between hydrological factors and surface deformation patterns.
2.3 SBAS-InSAR technology
The Small Baseline Subset InSAR (SBAS-InSAR) technique has demonstrated significant advantages in monitoring ground subsidence over large areas and extended time series (Zhao et al., 2019). Based on the algorithm proposed by Berardino et al. (2002), this technique processes multiple SAR images covering the same area and arranged in chronological order. The theoretical framework of this technique was based on the processing of N+1 SAR images covering the same area and arranged in chronological order. The number of differential interferograms (M) that can be generated follows the relationship:
Equation 1 indicated that by differentially processing N+1 SAR images covering the same area and arranged in chronological order t0,…,ti,…,tN, M differential interferograms were generated. For any pixel in the differential interferogram k (1,…, M), the following equation applied:
Equation 2 represented the composition of the interferometric phase in pixel (x,r) of the kth interferogram generated by images at
Based on the above equation, a system of equations could be defined with the number of SAR images N and the number of differential interferograms M. Its matrix form could be expressed as Equation 3:
Where matrix A was an M×N dimensional approximate correlation matrix. The phase-solving problem was converted to solving the following Equation 4:
By performing singular value decomposition on matrix B, the average phase rate v in the LOS direction within the acquisition time of adjacent images was obtained it could be expressed as the Equation 5:
Finally, by further solving the minimum norm least squares solution of the obtained average phase rate, the cumulative surface deformation within a specific time range could be obtained (Li et al., 2022).
In our implementation process (Figure 2), we began with comprehensive data preprocessing using ENVI software, where we converted SAR images and precise orbit files into SLC format. Following the processing framework established by Chang et al. (2023), we cropped the SAR ascending orbit images using vector files (shp) of the study area. To optimize computational efficiency, we cropped the SAR ascending orbit images using vector files (shp) of the study area. We then proceeded with interferogram generation, creating 143 interferometric pairs based on a 90-day time baseline threshold. These pairs underwent the removal of flat ground and topographic phase errors, followed by adaptive filtering of the differential interferograms.
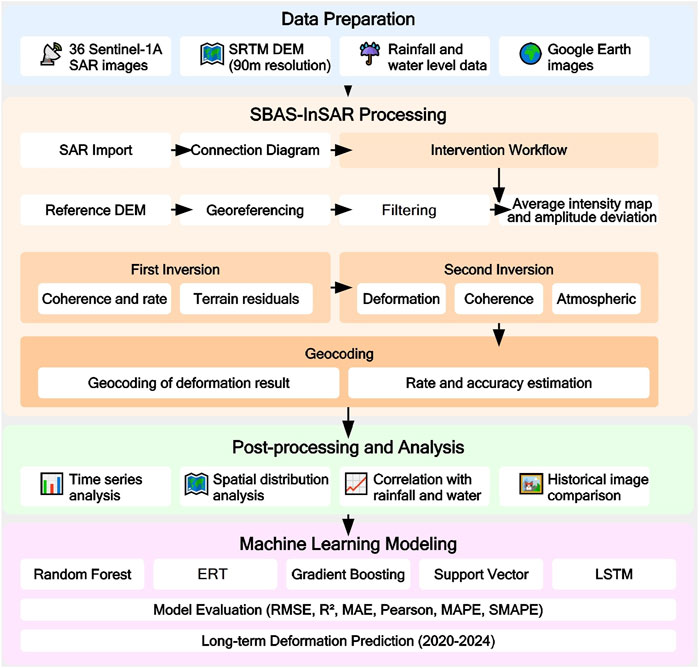
Figure 2. Data processing flow using the SBAS-InSAR method.
Given the extensive vegetation coverage in Fengjie County, we employed a specific phase unwrapping threshold of 0.2, carefully selected based on coherence analysis of vegetation-covered areas to balance data quality and usability, similar to the approach adopted by Ye et al. (2024) in their study of reservoir landslides during weather extremes. After phase unwrapping, we performed offset tracking to estimate the displacement between image pairs, which helped to ensure the accuracy of our deformation measurements. The final stage of our analysis involved overlaying the processed results with Google images for visual interpretation and combining the deformation time series with water level and rainfall data. This comprehensive analytical approach enabled us to examine the relationships between environmental factors and surface deformation patterns, providing valuable insights for geological hazard assessment and prevention strategies. In this study, surface deformation was expressed using negative values to indicate downward ground movement (subsidence) and positive values to indicate upward movement (uplift). This convention was standard practice in InSAR deformation monitoring, where larger negative values indicated more severe subsidence. This representation effectively illustrated the spatial distribution characteristics and temporal evolution patterns of ground subsidence in the study area.
2.4 Analysis of typical surface deformation areas
In this study, we selected three representative deformation areas to deeply explore the ground subsidence situation in the Three Gorges Reservoir area of Fengjie County. These three areas included: ground subsidence in areas along the Yangtze River, subsidence phenomena on road slopes along the river, and deformation characteristics of ancient landslides in the reservoir area. Through this approach, we aimed to comprehensively understand ground subsidence behavior under different geological and anthropogenic conditions and explore potential factors influencing these deformations. For ground subsidence in areas along the Yangtze River, we conducted a detailed quantitative analysis of cumulative deformation data from 2020 to 2022. Through this analysis, we were not only able to assess the magnitude of subsidence rates but also identify the spatial distribution characteristics of subsidence. To enhance the accuracy of the analysis, we compared Google historical satellite images with subsidence data, paying particular attention to subsidence in river wetland areas. This comparison revealed the potential contribution of large-scale infrastructure construction, such as road and bridge construction, as well as river-filling activities to ground subsidence. Additionally, we analyzed rainfall data and reservoir water level data to explore how these hydrological factors interacted with ground deformation. We found a significant temporal correspondence between the rapid decline in reservoir water levels before the rainy season and accelerated ground subsidence, suggesting that changes in reservoir water levels might be an important factor affecting ground subsidence. For subsidence on road slopes along the river, we conducted a similar analysis. By comparing deformation data from different time periods, we were able to track changes in subsidence rates and identify potential subsidence hotspots. Furthermore, we conducted a comparative analysis of historical images to verify our observations and further understand the impact of road construction and other human activities on slope stability. Finally, we conducted in-depth research on the cumulative deformation of ancient landslides in the Three Gorges Reservoir area. Through detailed analysis of deformation data in landslide areas, we were able to assess the stability of landslide bodies and identify potential risks of landslide recurrence. This analysis was crucial for understanding landslide mechanisms and formulating effective disaster prevention and mitigation measures.
2.5 Application and evaluation of machine learning and deep learning models
To evaluate and compare the performance of different machine learning models in predicting surface deformation, we selected five widely used algorithms: Random Forest (RF), Extremely Randomized Trees (ERT), Gradient Boosting Decision Tree (GBDT), Support Vector Regression (SVR), and Long Short-Term Memory (LSTM). These models were applied to three areas with different geological characteristics: urban ground deformation along the river (Area1), road slope subsidence along the river (Area2), and ancient landslide deformation in the reservoir area (Area3). For model training and testing, we divided our SBAS-InSAR-derived time series data (2020–2022) using a temporal split strategy with a 7:3 ratio. Specifically, the first 70% of the time series data (approximately from January 2020 to March 2021) was used as the training set, while the remaining 30% (approximately from April 2021 to December 2022) served as the test set. This temporal splitting approach was chosen to evaluate the models’ ability to predict future deformation based on historical patterns. We adopted six evaluation metrics to comprehensively measure model performance: Root Mean Square Error (RMSE), Coefficient of Determination (R2), Mean Absolute Error (MAE), Pearson Correlation Coefficient, Mean Absolute Percentage Error (MAPE), and Symmetric Mean Absolute Percentage Error (SMAPE). These metrics were chosen because they could reflect the prediction accuracy and fitting degree of the models from different angles. For each area, we trained all five models using the same input features and target variables. Input features for the prediction models included: (1) temporal sequence data consisting of historical deformation measurements at 24-day intervals from Sentinel-1 InSAR observations; (2) standardized differential deformation rates calculated using sequential measurements to capture the rate of change; and (3) contextual spatial information preserved through maintaining the pixel-wise relationship in the InSAR data matrices. The target variable was the pixel-wise surface deformation rate measured in mm/year, derived from SBAS-InSAR processing of 36 Sentinel-1 images. For model training, we used a temporal sliding window of five timesteps to predict the next timestep’s deformation. The dataset was split with a 7:3 ratio, where the first 70% of the chronological sequence (approximately from January 2020 to March 2021) was used for training, and the remaining 30% (approximately from April 2021 to December 2022) for testing. To handle data imbalance and ensure computational efficiency, we applied systematic sampling when the training samples exceeded 20,050 points. The hyperparameters for each model were optimized using grid search with the following ranges: for SVR (gamma = [0.1,0.5,1], C = [1,10,100], epsilon = [0.01,0.05,0.1]); for tree-based models (n_estimators = [50,100,150], max_depth = [5,10,15]); and LSTM (hidden_units = [32,64,128], dropout_rate = [0.1,0.2,0.3]). This comprehensive approach allowed us to capture both the temporal dynamics and spatial characteristics of the deformation process while maintaining model generalization. After training was completed, we applied these models to the test set and calculated the above six evaluation metrics. Additionally, based on time series InSAR technology, long-term predictions of ground deformation were made for the study area, using the best prediction model for each area, with a period from January 2020 to August 2024. To assess the accuracy and uncertainty of the model predictions, we conducted a detailed comparative analysis of observed data and predicted data. By comparing the deformations in the three areas, we could see the prediction performance of the models in different areas and the changes in prediction uncertainty over time.
3 Results
We used the SBAS-InSAR time series method to detect active slopes in the area and identified numerous subsidence areas. Our monitoring results revealed widespread significant ground subsidence in the study area (Figure 3). For comparison and analysis, we selected three significant deformation areas as shown in the figure, namely, ground subsidence in areas along the Yangtze River, subsidence on road slopes along the river, and deformation of ancient landslides in the reservoir area.
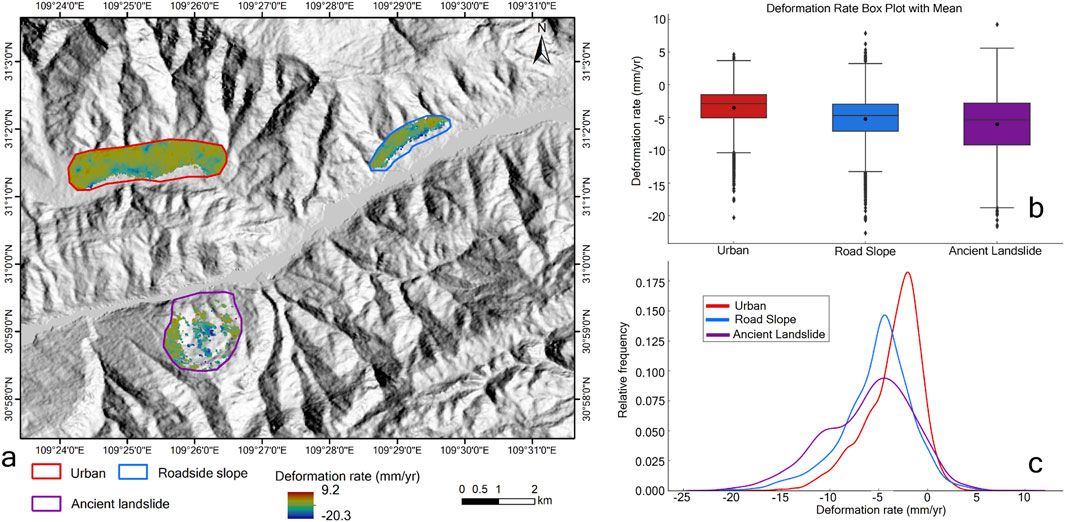
Figure 3. Deformation in three different locations of the study area. (A) Spatial distribution of deformation in riverside urban ground, riverside road slopes, and ancient landslides in the reservoir area. (B) Comparison of deformation in the three locations, where the horizontal line and dot in the box plot represent the median and mean values, respectively. (C) Frequency distribution of deformation in the three locations.
In this study, we analyzed deformation rates at different locations, including urban areas, road slopes, and ancient landslide areas. After statistical analysis, the average deformation rate in urban areas was −3.48 ± 2.91 mm/yr (mean ± standard deviation); the average deformation rate on road slopes was −5.19 ± 3.62 mm/yr; while the average deformation rate in ancient landslide areas was −6.02 ± 4.55 mm/yr. These data reflected that the deformation rate in ancient landslide areas was more significant compared to urban areas and road slopes, suggesting that ancient landslide areas might have higher geological activity frequency or more sensitive environmental response characteristics. Moreover, the difference in standard deviations indicated the variability of deformation rates at different locations, with the ancient landslide areas showing the greatest variability, which might be related to the complexity of geological structures and the variability of environmental factors.
3.1 Urban ground deformation along the river
The cumulative deformation of urban ground along the river over time could be seen in the figure (Figure 4). We could see that before the rainy season each year, such as 1 March 2020, 8 March 2021, and 15 March 2022, the cumulative deformation values in most areas along the river were >1mm, with no significant subsidence; after entering the rainy season, such as 5 June 2020, and 12 June 2021, the cumulative deformation values in some areas of this region decreased to −22 ∼ -17mm, with the rest also showing obvious subsidence compared to March; after the rainy season, such as 21 September 2020, 16 September 2021, and 11 September 2022, the ground showed even more obvious subsidence, with cumulative deformation in some areas along the river dropping below −42 mm. The cumulative ground deformation would rise in the following year.
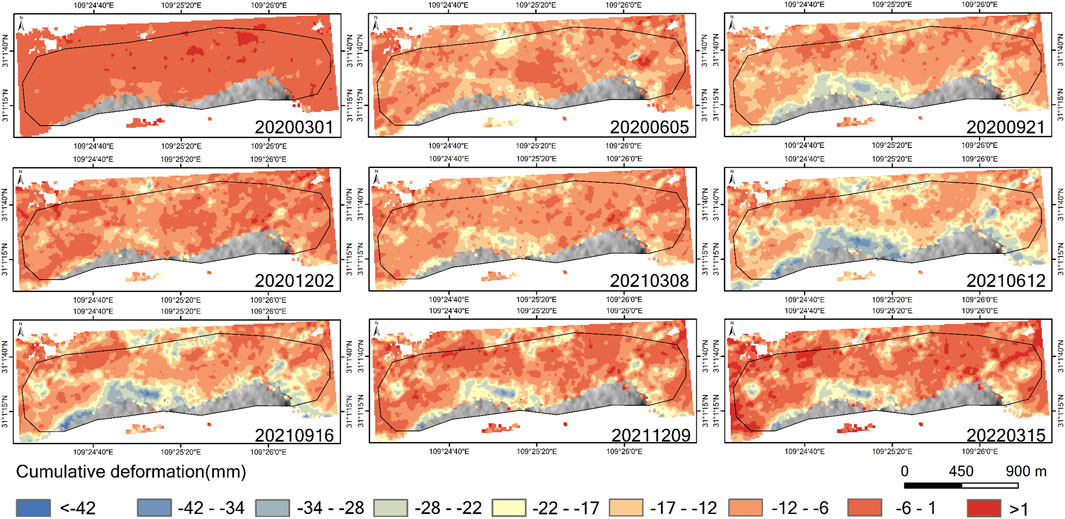
Figure 4. Cumulative deformation at equal time intervals in Deformation Area 1 (urban area).
We found that the average subsidence rate in urban areas along the river reached −3.484 ± 2.914 mm/yr, which had already exceeded the average subsidence rate in this area in recent years (Figures 5A, B). By comparing Google historical satellite images obtained in 2013 (Figure 5C) and 2020 (Figure 5D), we could see that significant subsidence areas were mainly distributed in the previous river wetland areas, indicating that this intensified subsidence was likely related to large-scale infrastructure construction and associated river filling in recent years. In addition, we also compared and analyzed the relationship between cumulative deformation data in this area and rainfall data obtained from meteorological stations, as well as reservoir water level data (Figure 5E). From February to June 2020, the reservoir water level in this area showed a rapidly declining trend, dropping from 175 m to 145m, with its subsidence rate ranging from 0 to 10 mm/yr. However, a significant turning point occurred in July 2020, with the reservoir water level rising to about 160 m. Around September 2020, the reservoir water level experienced some fluctuations, ranging between 152.5 m and 167.5m, with the subsidence rate stabilizing at around −11 mm/yr. Until October, the water level began to rise rapidly again, and from the end of the year to February of the following year, the water level remained stable at around 175 m. Subsequently, the reservoir water levels in 2021 and 2022 also maintained similar patterns of change as in 2020.
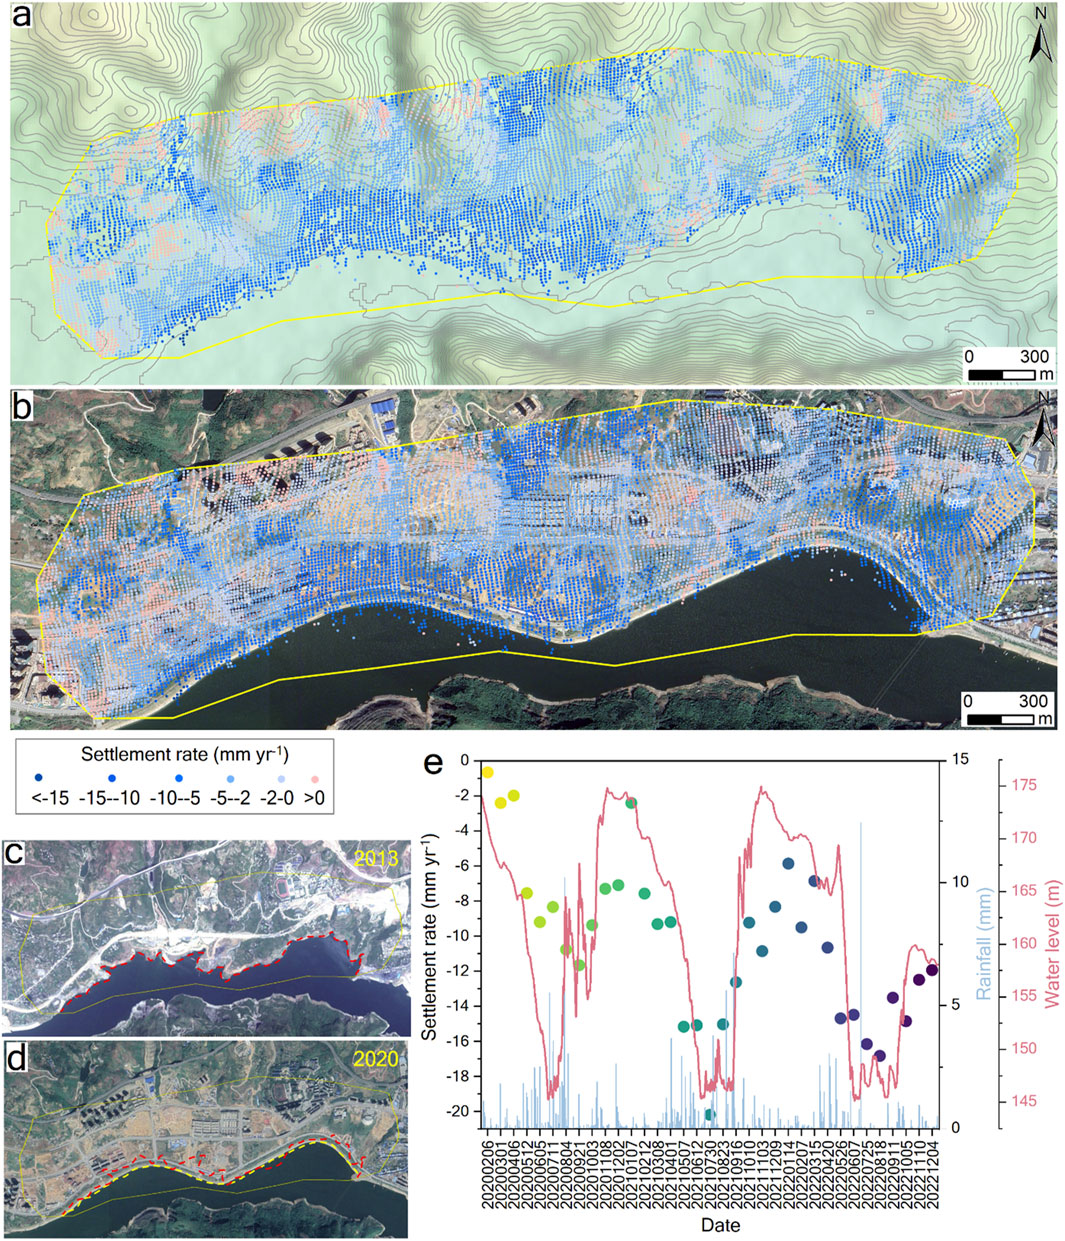
Figure 5. Deformation Area 1 (urban ground subsidence along the river). (A) Deformation rate map overlaid on topographic contours. (B) Deformation rate map overlaid on Google imagery. (C) Image of the area in 2013. (D) Image of the area in 2020. (E) Relationship between subsidence rate, rainfall, and water level changes in this area from 2020 to 2022, and the gradually darkening color represents the average deformation rate of the region, where darker colors indicate later periods.
We found in our research that before entering the rainy season, there would be a relatively rapid decline in reservoir water levels, such as from February to June 2020, January to June 2021, and January to May 2022. During these periods, the reservoir water levels all showed a declining trend, mainly due to flood discharge for flood prevention. Interestingly, we observed that during the same periods of rapid water level decline, ground deformation monitoring data also reflected a significantly accelerated subsidence process in this area. Taking these same periods, we found that most subsidence increased with time and rising water levels, with subsidence rates dropping from around -7 mm/yr to around −16 mm/yr. This finding suggested that the lower the reservoir water level, the faster the ground subsidence rate. To explain this, we proposed that when reservoir water levels decreased, groundwater levels also decreased, leading to significant compaction and subsidence of certain strata above the decompression zone. However, since subsidence rates were also affected by other factors such as local geological conditions and rainfall infiltration, the correlation between water level changes and ground subsidence was not very high. In comparison, we found that the correlation between rainfall and ground subsidence rates was not obvious, with almost no significant ground deformation observed before and after entering and leaving the rainy season.
3.2 Road slope deformation along the river
Our study found that another significant subsidence area was located on the slopes after road construction along the river (Figures 7A, B). The cumulative deformation of road slopes along the river over time could be seen from the figure (Figure 6). Taking 2020 as an example, in March, the cumulative deformation in this area was >1mm, with no significant overall subsidence. After entering the rainy season, the deformation became more apparent in June and September, with cumulative deformation dropping to −22 ∼ -17mm, only recovering slightly in December. The years 2021 and 2022 maintained the same pattern of change but with varying degrees of change.
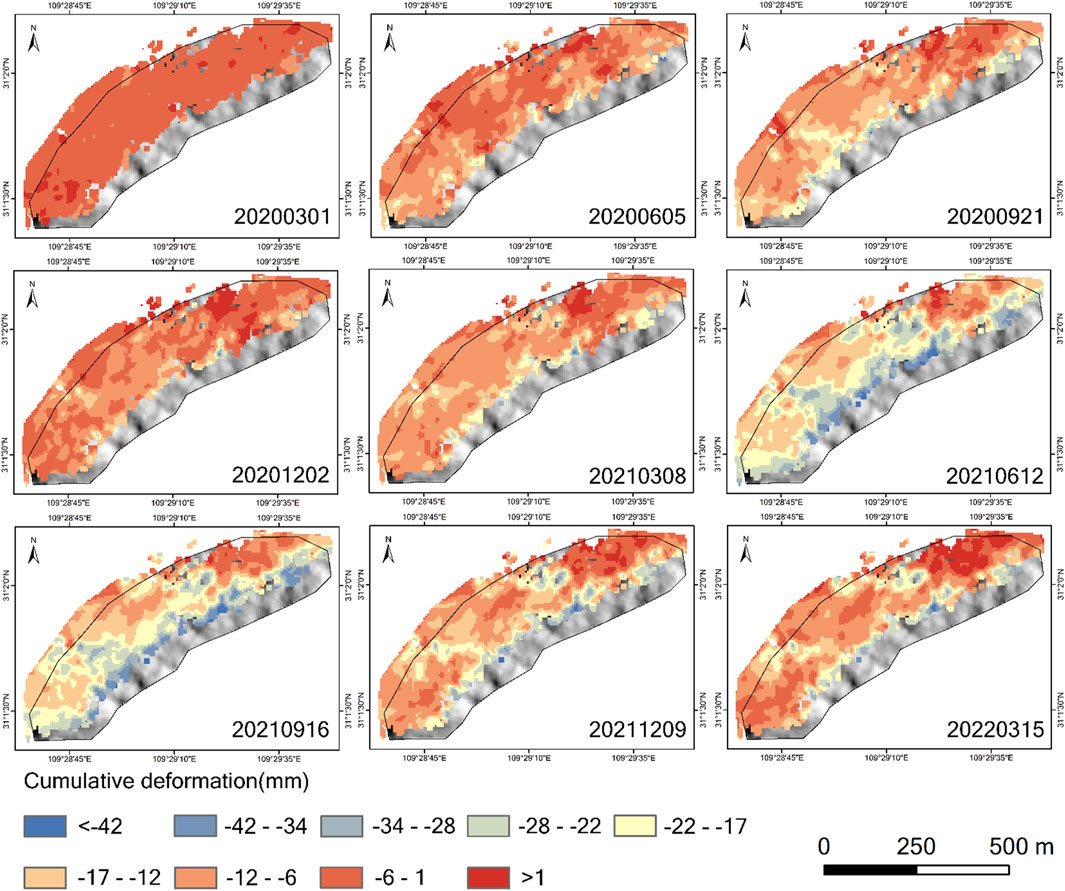
Figure 6. Periodic cumulative deformation in Deformation Area 2 (slope subsidence after road construction along the river).
During the investigation period, the average subsidence rate in this area reached −5.19 ± 3.62 mm/yr (Figures 7A, B). It was worth noting that, from the overall trend, this area showed continuous ground subsidence during the study period (Figure 7E). Specifically, in early 2020, the deformation rate in this area fluctuated in the range of −1.5 to −2.0 mm/yr. However, a significant subsidence event occurred in May-August 2020, with the deformation rate plummeting to about -9 mm/yr. After September 2020, the deformation rate rebounded somewhat but still maintained at a relatively high level of −7 to -9 mm/yr. From January to April 2021, the deformation rate further rebounded to around -2 mm/yr. But in May 2021, a larger-scale subsidence event occurred, with the deformation rate again plunging sharply to a low of −18 mm/yr. Although it rebounded afterward, it still maintained at a relatively high level of −10 to −15 mm/yr. Entering 2022, the deformation rate improved somewhat, but still maintained in the range of −5 to −10 mm/yr most of the time.
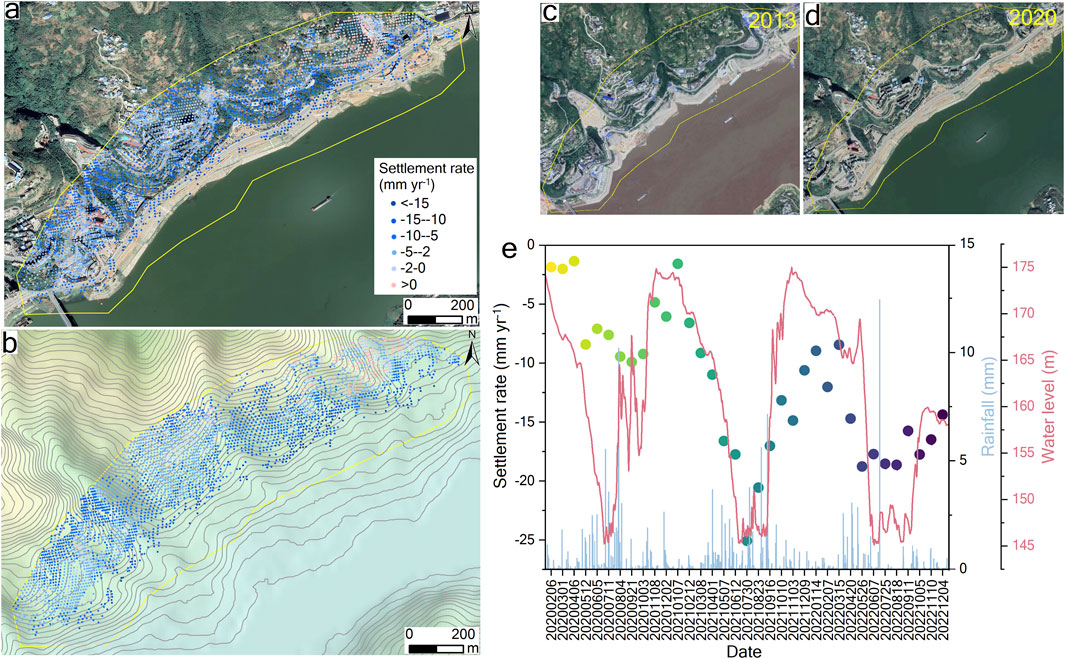
Figure 7. Deformation Area 2 (slope subsidence after road construction along the river). (A) Significant subsidence area combined with Google imagery. (B) Subsidence area combined with elevation contours. (C) Image of the area in 2013. (D) Image of the area in 2020. (E) Relationship between subsidence rate, rainfall, and temperature changes in this area from 2020 to 2022, the gradually darkening color represents the average deformation rate of the region, whereas darker colors indicate later periods.
Comparative analysis of historical images revealed that in 2013, the road in this area had not yet been expanded, while in 2020, the road was significantly widened (Figures 7C, D). We speculated that the road construction at the foot of the slope changed the original foundation soil structure and groundwater flow state, which was the main reason for significant subsidence in this area. Moreover, from the rainfall data, the overall rainfall situation in 2020 and 2021 was not abnormal and did not show an obvious corresponding relationship with changes in subsidence rates. Especially before the two significant subsidence events in May 2020 and May 2021, there was no particularly heavy rainfall, with rainfall mostly below 5 mm. Therefore, these two subsidence events were not much related to short-term rainfall changes. Instead, during these two events, the reservoir was in the process of rapid water level decline, dropping rapidly from 175 m to 145m, and water level change should be the main factor inducing subsidence. In fact, in 2022, the Yangtze River experienced prolonged severe drought, with water levels at low levels. After the rainy season, the water level remained in the range of 145m–160 m for a long time, which could also explain why this area had been in a state of high subsidence during this period. Once the water level rose, the subsidence condition in this area would improve accordingly. This finding differed from previous understandings, where past studies generally found that the rise in reservoir water levels would increase groundwater pressure, thereby leading to more severe soil subsidence.
3.3 Ancient landslide deformation in the Reservoir area
The cumulative deformation of ancient landslides in the Three Gorges Reservoir area showed the same periodic pattern as the previous two study areas. Before each year’s rainy season, the deformation was mostly >1mm, not very significant; after entering the rainy season, the cumulative deformation suddenly decreased, with most areas showing negative values; until the end of the year and the beginning of the next year, it increased somewhat. However, overall, the cumulative deformation in this ancient landslide area increased year by year over these 3 years (Figure 8), with more and more areas falling into the range of −22 ∼ -17 mm.
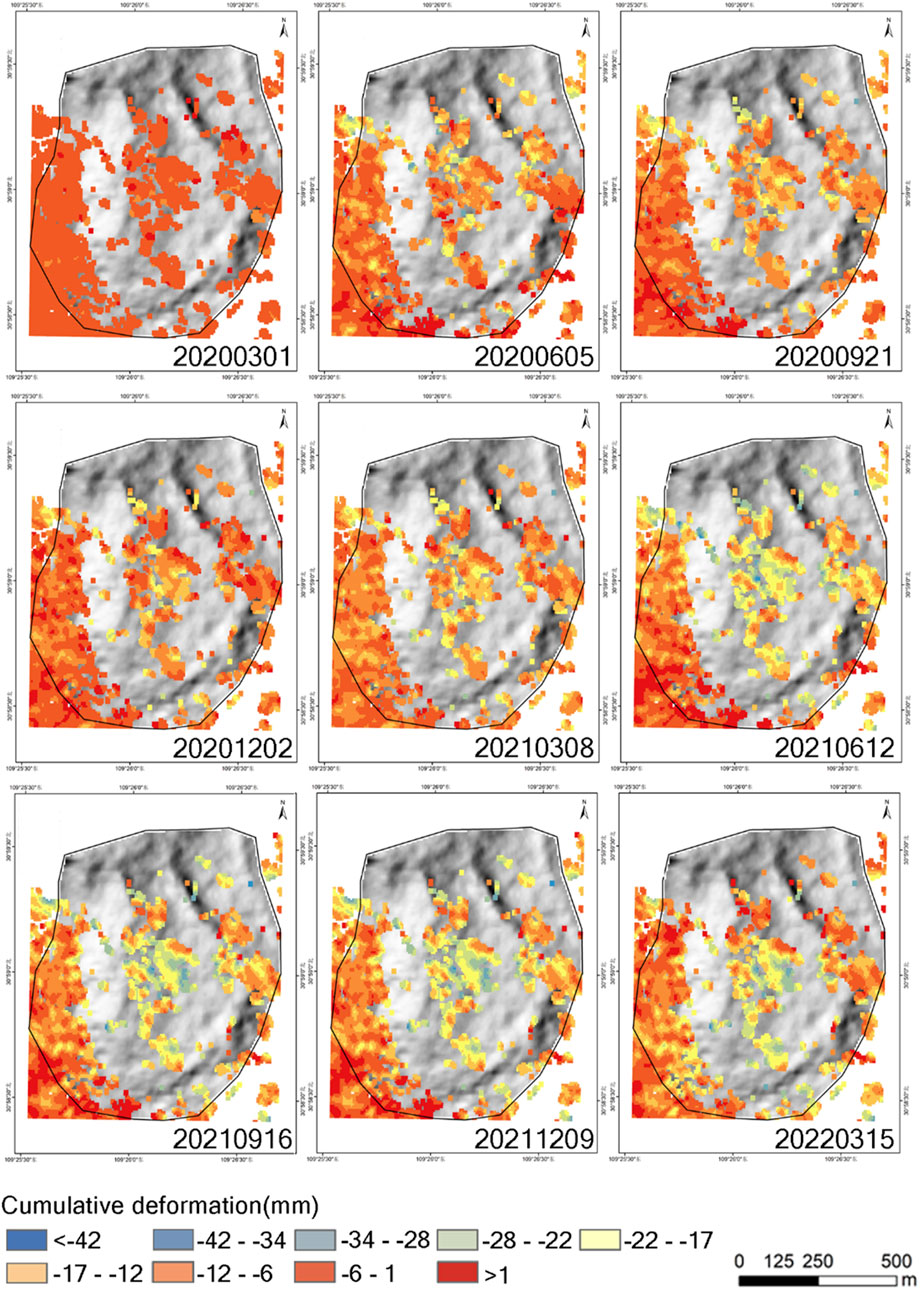
Figure 8. Periodic cumulative deformation in Deformation Area 3 (ancient landslide deformation) at equal time intervals.
The average deformation rate of ancient landslides in the Three Gorges Reservoir area was significantly faster than the previous two locations, reaching −6.02 ± 4.55 mm/yr, showing a trend of continuous accelerated subsidence. The annual average deformation rate had significantly increased from −5 mm/yr before 2020 to over −15 mm/yr in 2022 (Figure 9D). The subsidence was most significant in the middle part of the landslide body (Figures 9A, B), which might be related to the gradually increasing frequency of human activities (Figure 9C). The rainfall distribution was consistent with the seasonal changes in deformation rates. During periods of higher rainfall, the absolute values of deformation rates were also larger, such as around July in 2020, 2021, and 2022, when rainfall reached as high as 5mm, with 2022 even reaching 12.5 mm. The corresponding subsidence rates for these periods were -5 mm/yr ∼ -10 mm/yr, −10 mm/yr ∼ -20 mm/yr, and −17.5 mm/yr ∼ -22.5 mm/yr respectively, all being the maximum subsidence rates for the entire year, indicating that rainfall was one of the important factors affecting ground deformation in this area. The changes in reservoir water levels were generally consistent with rainfall and deformation rates, also influencing ground deformation.
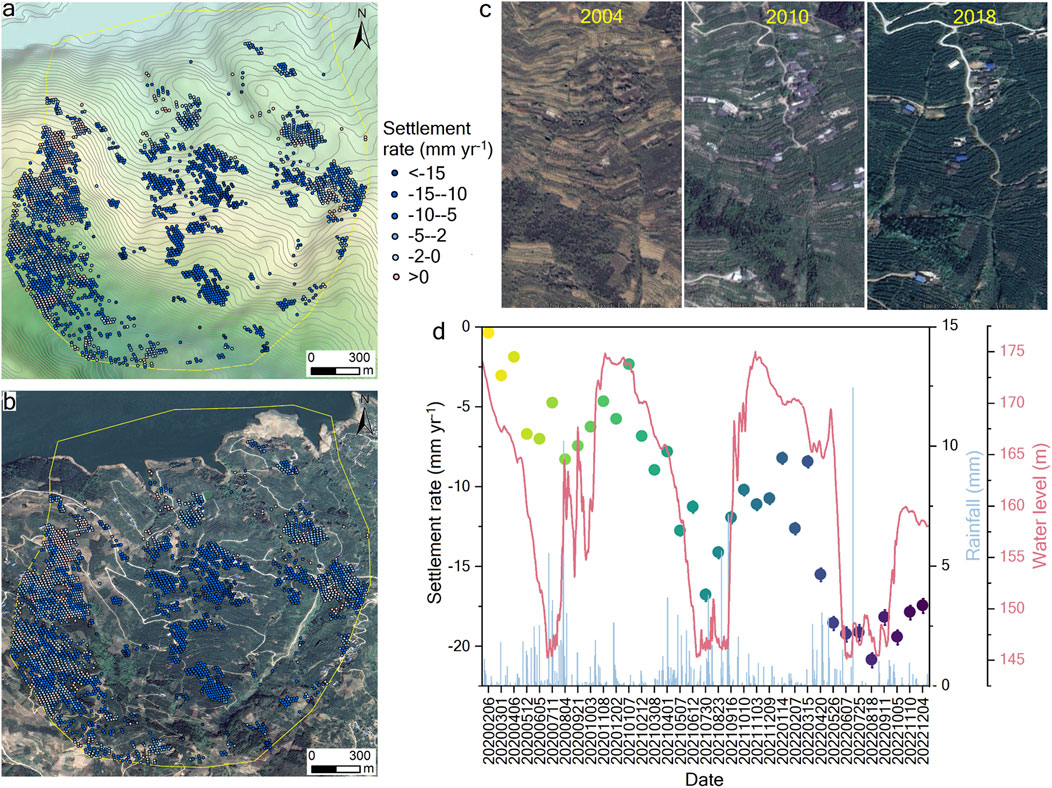
Figure 9. Deformation Area 3 (ancient landslide deformation). (A) Contour map of the ancient landslide body. (B) Orthophoto of the ancient landslide body. (C) Images of the area in 2004, 2010, and 2018, show frequent human activities in the central part. (D) Relationship between subsidence rate, rainfall, and water level changes in this area from 2020 to 2022, and the gradually darkening color represents the average deformation rate of the region, where darker colors indicate later periods.
3.4 Performance evaluation of machine learning models in predicting ground deformation in the Three Gorges Reservoir area: multi-model multi-metric comparative analysis
The performance of five machine learning models (RF, ERT, GBDT, SVR, and LSTM) in three different ground deformation areas was evaluated through six indicators. The RMSE values ranged from 4.68 to 10.11, with LSTM consistently showing the lowest RMSE across all areas, especially in Area 1 (7.52) and Area 2 (4.68) (Figure 10A). The coefficient of determination (R2) varied between 0.45 and 0.75, with LSTM performing best in Area 2 (0.75) but poorly in Area 1 (0.45) (Figure 10B). The MAE ranged from 1.88 to 5.58, with GBDT performing best in Area 2 (1.88), while LSTM performed best in Area 1 (4.58) (Figure 10C). The Pearson correlation coefficient ranged from 0.67 to 0.87, with LSTM achieving the highest correlation in Area 2 (0.87) but the lowest in Area 1 (0.67) (Figure 10D). The MAPEshowed significant differences between models and areas, with values between 85.29% and 250.88%. Notably, GBDT performed best in Area 2 (85.29%), while LSTM excelled in Area 1 (126.86%) (Figure 10E). The Symmetric Mean Absolute Percentage Error (SMAPE) ranged from 58.8% to 91.1%, with LSTM consistently achieving the lowest SMAPE across all areas, especially in Area 1 (58.8%) and Area 3 (79.27%) (Figure 10F). Overall, these results indicated that model performance varied significantly across different areas and metrics, with LSTM and GBDT generally outperforming other models, especially in Areas 1 and 2, while performance in Area three was relatively more consistent across models.
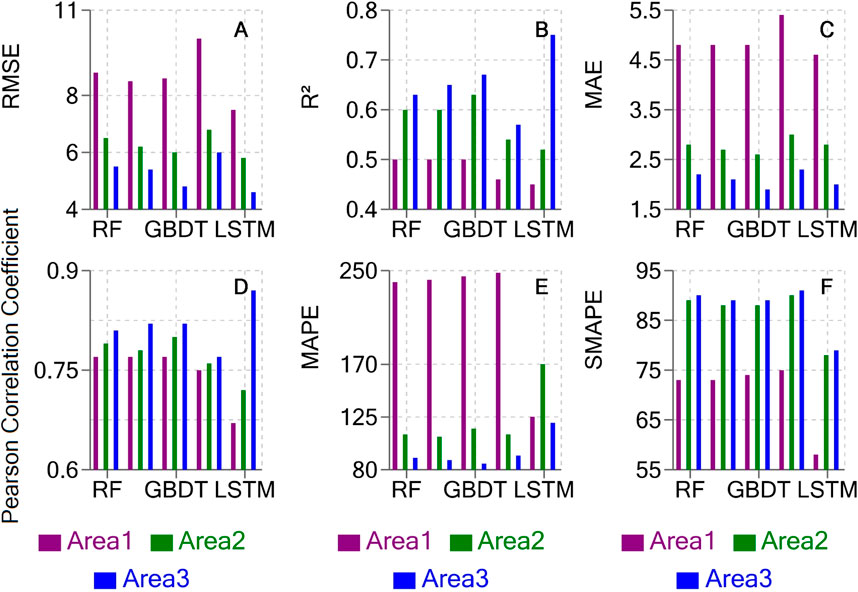
Figure 10. Performance evaluation of five machine learning models (RF, ERT, GBDT, SVR, and LSTM) in three surface deformation areas. (A) Root Mean Square Error (RMSE). (B) Coefficient of Determination (R2). (C) Mean Absolute Error (MAE). (D) Pearson Correlation Coefficient. (E) Mean Absolute Percentage Error (MAPE). (F) Symmetric Mean Absolute Percentage Error (SMAPE). Area one represents riverside urban ground deformation, Area two represents riverside road slope subsidence, and Area three represents ancient landslide deformation in the reservoir area.
Figure 11 showed the error band plots of observed and predicted deformations for urban ground deformation along the river (Area 1), road slope deformation along the river (Area 2), and ancient landslide deformation in the reservoir area (Area 3). These areas used the best-performing GBDT, LSTM, and LSTM models for prediction, respectively. In urban ground deformation along the river, observed deformation gradually decreased from 0 mm to about −10 mm, while predicted deformation decreased to −15 mm, showing a slight overestimation trend in the prediction data. The standard deviation increased in the later stages of the study, indicating greater uncertainty in the predictions. For road slope deformation along the river, observed deformation decreased from 0 mm to −15 mm during the study period, while predicted data decreased to nearly −20 mm, and the standard deviation of predictions increased significantly in the later stages, reaching about 15 mm, indicating greater uncertainty in the model’s predictions for this area. In ancient landslide deformation in the reservoir area, observed data remained relatively stable around −10 mm, while predicted deformation decreased to below −30 mm, with the standard deviation of predictions reaching 25 mm in the later stages, far higher than the observed data, reflecting the most significant overestimation trend of subsidence in the model for ancient landslide deformation in the reservoir area (see Figure 11).
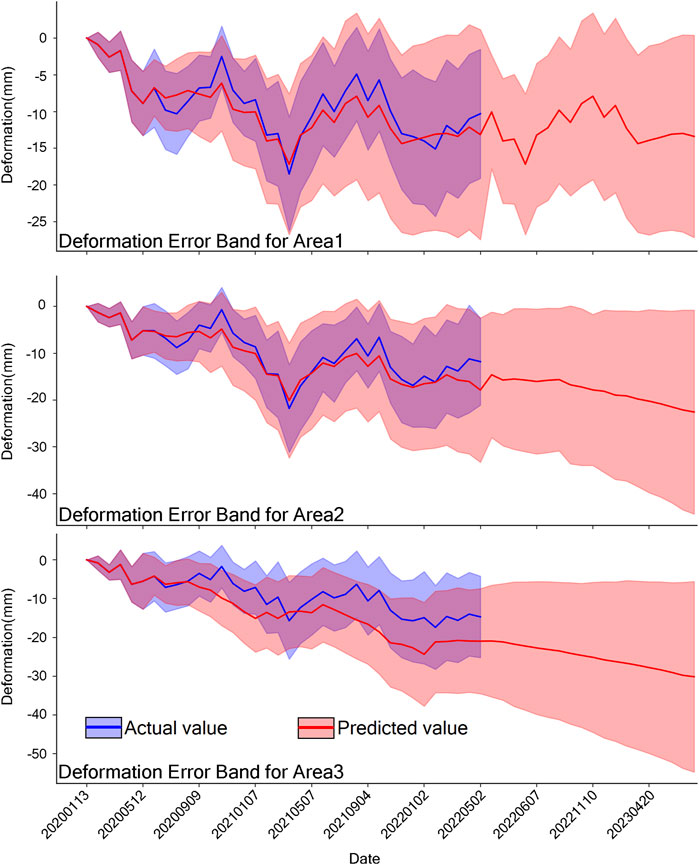
Figure 11. Surface deformation prediction results for three typical areas. Blue lines represent observed values, red lines represent predicted values, and colored bands indicate prediction error ranges. Note: Negative values indicate ground subsidence in millimeters (mm).
Figure 12 showed a comparison of the median observed and predicted deformations for the three areas. In urban ground deformation along the river, the observed median was −8.93 mm, while the predicted median was −10.58 mm, with a small difference between the two. For road slope deformation along the river, the observed median was −9.49 mm, while the predicted median was −13.19 mm, with a difference of 3.7 mm, showing a trend of continued subsidence in the model. For ancient landslide deformation in the reservoir area, the observed median was −8.84 mm, while the predicted median was −13.79 mm, with a difference of 4.95 mm, indicating significant overestimation in the model’s predictions. The standard deviation of predictions for the reservoir area was 5.79 mm, higher than the observed 4.81 mm, indicating greater variability and uncertainty in the model predictions for this area.
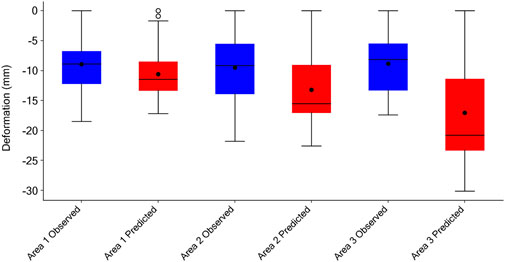
Figure 12. Box plot comparison of observed and predicted deformation results for three surface deformation areas (riverside urban ground deformation, riverside road slope deformation, and ancient landslide deformation in the reservoir area). The blue and red solid lines represent observed and predicted results, respectively, while the horizontal lines and dots in the box plots represent the median and mean values of deformation, respectively.
4 Discussion
4.1 Reservoir water level decline accelerates ground subsidence
In this study, we investigated the impact of reservoir water level adjustments on the subsidence behavior of riverside cities, slope areas along riverside roads, and ancient landslides. We found a significant negative correlation between the two, revealing the critical role of reservoir water level adjustments in triggering and accelerating ground subsidence - the lower the reservoir water level, the faster the ground subsidence rate (Figures 5E, 7E). We observed that artificially lowering the reservoir water level before the rainy season for flood control exacerbated ground subsidence in riverside areas. For riverside urban areas, this phenomenon was particularly evident on slopes after the construction of riverside roads. During two periods of rapid water level decline in May 2020 and May 2021 (Figure 5E), severe subsidence events occurred in this area. The decline in water level led to a lowering of groundwater levels around the reservoir, reducing pore water pressure in the strata, increasing effective stress between soil particles, and resulting in soil compression and subsidence. This mechanism explains why reservoir water level adjustments have a significant impact on subsidence in riverside areas, not only verifying Song et al., 2018 findings on increased landslide activity due to reservoir water level decline, but also extending it to broader riverside areas including urban ground and road slopes. Furthermore, our study deepened Guzzetti et al., 2022 view on the impact of hydrological changes on ground stability by revealing how human-controlled reservoir water level changes can become a key factor affecting ground subsidence, while also considering changes to geological structures due to human activities (such as road construction), thus providing a more comprehensive framework for understanding subsidence phenomena in riverside areas.
However, this mechanism differs from previous understandings. Past research generally believed that rising reservoir water levels increase groundwater pressure, leading to more severe soil subsidence, and that water level fluctuations soften the rock and soil on the shore, inducing groundwater fluctuations and reducing the shear strength of shore rock and soil, affecting landslide stability. Our findings may be related to the special geological conditions of the area (Sun et al., 2019), such as the presence of different types and thicknesses of soil layers, and different degrees and directions of cracks. These conditions may affect the process and speed of groundwater flow and soil consolidation. Taib et al. (2017) study also showed that soil compactness affects pore water pressure and thus the speed of water dissipation. Therefore, we suggest that the potential impact on ground subsidence should be fully considered when conducting reservoir scheduling management.
Through in-depth analysis of the subsidence phenomenon on the slopes of riverside roads, we speculate that this difference may be related to the following aspects: First, the area is located on slopes after the construction of riverside roads, and its soil structure and permeability may be different from other areas, leading to different response modes to water level changes (Taib et al., 2017; Luo et al., 2022); Second, there may be a certain degree of landslide or collapse phenomenon in the area, making it more susceptible to the effects of gravity and shear forces. When the reservoir water level drops, these forces increase, thus accelerating ground subsidence (Stark et al., 2005; Sun et al., 2019); In addition, there may be some degree of non-linear or lag effect in the area, making its reaction to water level changes not immediate or synchronous. For example, before the two significant subsidence events in May 2020 and May 2021 (Figure 7E), there was no particularly large rainfall or water level change. However, there may be some cumulative or delayed influencing factors before or after, leading to these two sudden subsidence events, which is similar to some previous research results (Chen et al., 2018).
In addition to the direct impact of rainfall, the seasonal adjustment of reservoir water levels also had a significant impact on subsidence in this area. The lowering of water levels not only affected groundwater levels but may also have altered slope stability, especially in cases where human activities such as road construction or modification had already changed the original topography and geological conditions (Zhang et al., 2020).
Analysis of ancient landslides in the Three Gorges reservoir area revealed a trend of continuous accelerating subsidence, contrasting sharply with conclusions drawn from short-term data previously. The mechanism of this continuous subsidence may involve long-term changes in groundwater flow patterns due to reservoir water level adjustments. Additionally, subsidence in ancient landslide areas also interacts complexly with factors such as rainfall, geological conditions, and human activities (Xia et al., 2013).
Future research should focus on developing more complex models to explain the complex interactions between water level fluctuations, geological conditions, and human activities; conducting long-term monitoring studies to better understand the cumulative impact of water level adjustments on ground stability; exploring potential mitigation strategies to reduce the negative impact of necessary water level adjustments on ground subsidence; and studying the broader environmental and ecological impacts of these ground deformation processes in reservoir areas. By addressing these issues, we can further improve our understanding of the complex dynamics in areas adjacent to reservoirs and develop more effective management strategies for these critical areas.
4.2 Human activities exacerbate natural subsidence processes in riverside cities
Our results indicate that complex interactions between natural and anthropogenic factors drive subsidence, presenting significant seasonal variations and spatial heterogeneity. The average subsidence rate observed in our study area was −3.484 ± 2.914 mm/yr, which aligns with the trend of increasing subsidence rates in many urban deltas and coastal areas globally (Edmonds et al., 2020). The spatial distribution of subsidence is concentrated in former wetland areas that are currently undergoing rapid urbanization, suggesting that human activities play a crucial role in exacerbating natural subsidence processes. Similar patterns have been observed in other rapidly developing delta regions, where infrastructure development and wetland reclamation have led to accelerated subsidence (Paszkowski et al., 2021).
Our analysis revealed a distinct seasonal pattern in subsidence rates, with the most significant subsidence occurring during and after the rainy season. This temporal variation appears to be closely related to reservoir water level changes, with lower water levels corresponding to higher subsidence rates (Figure 5E). This relationship can be explained by the compression of the aquifer system due to reduced pore pressure caused by lowering groundwater levels (Sharifi et al., 2024). In our study, the impact of rainfall on subsidence rates was less pronounced, contrasting with findings from some other regions. This difference may be attributed to local geological conditions or the dominant role of the managed water system (i.e., the reservoir) in controlling groundwater levels. However, it is worth noting that rainfall patterns can indirectly influence subsidence by affecting reservoir management strategies (Chan et al., 2024).
Spatial analysis of subsidence patterns, particularly the concentration of high subsidence rates in recently developed urban areas, highlights the key role of land-use changes in driving subsidence. This observation is consistent with findings from other studies that have documented increased subsidence rates following the conversion of natural wetlands or agricultural lands to urban areas (Machowski et al., 2016). The replacement of permeable surfaces with impervious urban infrastructure may alter local hydrology and sediment dynamics, potentially exacerbating subsidence.
Our findings on the relationship between river flow and subsidence rates are particularly noteworthy. The observation of reduced subsidence rates during periods of higher river flow suggests that maintaining stable river flow may be a potential strategy for mitigating subsidence in riverside urban areas. This aligns with the findings of Sharifi et al. (2024), who found that river flow can help prevent ground subsidence in urban areas by maintaining groundwater levels and potentially promoting sediment deposition.
A comparison of satellite images from 2013 to 2020 revealed significant land-use changes in subsidence-prone areas, highlighting the rapid pace of urban development and its potential consequences. This rapid transformation of the landscape not only directly contributes to subsidence through increased loading and groundwater extraction but also reduces the area’s natural resilience to withstand and adapt to subsidence processes (van Bijsterveldt et al., 2023).
In conclusion, our study highlights the multifaceted nature of ground subsidence in riverside cities, emphasizing the need for an integrated approach to managing subsidence that considers both natural and anthropogenic factors. Future research should focus on developing predictive models that incorporate these complex interactions to better inform urban planning and water resource management strategies for subsidence-prone areas.
4.3 Progressive slope subsidence triggered by road expansion
The subsidence phenomenon we observed was closely related to road expansion projects. By comparing images from 2013 to 2020, we found that the road was significantly widened (Figures 7C, D), and this engineering activity altered the original foundation soil structure and groundwater flow patterns, becoming the main cause of significant subsidence. During the investigation period, the average subsidence rate in this area reached −5.19 ± 3.62 mm/yr (Figures 7A, B). This finding is highly consistent with the results of Huang et al. (2022). They pointed out that engineering excavation is the main trigger for the reactivation of ancient landslides, while rainfall is a contributing factor. Our study further confirms this view, while also highlighting the need to consider the potential impact on slope stability when conducting infrastructure construction.
The subsidence patterns we observed also showed significant spatial heterogeneity and temporal variation characteristics (Figure 7E). This is consistent with the findings of Gao et al. (2022). They found that during the excavation and support process of double-structured slopes when local displacements and plastic strain concentration zones appear on the slope surface, the reference significance of extreme values and safety factors decreases. This point was confirmed in our study, especially in the two significant subsidence events observed in 2020 and 2021. These events were concentrated in specific areas, indicating that slope excavation may lead to stress redistribution and local instability.
Notably, our study also suggests that the subsidence process after slope excavation may present progressive characteristics. As Jiang et al. (2015) found in their study of the Jinping I Hydropower Station, slope excavation may lead to progressive failure. The pattern of subsidence rate changes over time that we observed (Figure 6) supports this view, especially the sustained high subsidence state during the prolonged drought in 2022. From an engineering practice perspective, our findings have important implications for high-slope excavation and reinforcement. Chen et al. (2016) emphasized the importance of developing new engineering techniques and processes in large-scale slope reinforcement projects. Our research results provide an important scientific basis for the development and application of these techniques, especially in considering the long-term stability impact of slope excavation.
Overall, our study deepens the understanding of the mechanism by which slope excavation affects slope subsidence, providing valuable insights for the planning, design, and risk management of water conservancy projects. Future research can further explore the interaction between slope excavation, water level fluctuations, and geological conditions, and how these factors jointly affect the long-term stability of slopes.
4.4 Accelerated deformation of ancient landslides in the reservoir area: combined effects of water level changes, drought, and human activities
The cumulative deformation of ancient landslides we observed showed a clear periodic pattern, with a significant correlation between landslide activity and the reservoir impoundment process (Tang et al., 2019). Our study further confirmed this, especially during the rainy season and from the end of the year to the beginning of the next year, when cumulative deformation showed significant changes (Figure 8). This periodic change may be related to reservoir water level fluctuations and the seasonal distribution of rainfall, which is consistent with the findings of Li et al. (2019), who emphasized that water level fluctuations and rainfall are the two main factors affecting landslide occurrence.
We also found that the average deformation rate of ancient landslides showed an accelerating trend, significantly increasing from −5 mm/yr in 2020 to over −15 mm/yr in 2022 (Figure 9D). This accelerating trend is consistent with the drive-resistance model proposed by Zou et al. (2021). They pointed out that periodic water level fluctuations affect slope stability, and annual displacement “jumps” are related to the outward seepage forces generated during water level decline periods.
Notably, the extreme drought event that occurred in 2022 may have exacerbated this trend (Figure 9D). Long-term low water level conditions may lead to significant changes in pore water pressure within the landslide body, further increasing landslide instability. This observation highlights the potential impact of extreme climate events on landslide dynamics, while also emphasizing the importance of considering climate change factors when assessing landslide risks. Furthermore, we noticed that subsidence was most significant in the middle part of the landslide body (Figures 9A, B), which may be related to the increasing frequency of human activities (Figure 9C). This finding emphasizes the important role of human activities in landslide deformation, which echoes the research results of Hill et al. (2024). They pointed out that human modifications to the environment, such as vegetation removal, agricultural activities, and increased slope gradients, may amplify earthquake-induced landslide hazards.
Our study also revealed the important influence of rainfall on ancient landslide deformation. During periods of high rainfall, the absolute values of deformation rates were also high, such as the high subsidence rates of −17.5 mm/yr to −22.5 mm/yr corresponding to high rainfall around July 2022. This is consistent with the research results of Yao et al. (2019), who found that most of the displacement of the Baijia Bao landslide occurred during the rainy season and the annual drawdown period of the reservoir. However, our study further suggests that the impact of rainfall may change over time, which is consistent with the findings of Song et al. (2018), who pointed out that the increase in landslide activity is mainly dominated by reservoir water level decline rather than rainfall.
It is worth noting that the deformation characteristics we observed may be influenced by complex interactions of multiple factors. Reservoir water level is the main driving factor for deformation, while rainfall may promote deformation during periods of high water levels (Huang et al., 2020). From the perspective of long-term stability, our research results have important implications for assessing and managing landslide risks in the Three Gorges reservoir area. Slow-moving landslides, although rarely causing direct loss of life (Lacroix et al., 2020), may lead to significant damage to infrastructure and sometimes suddenly transform into rapidly moving landslides. Therefore, our findings provide an important basis for assessing the long-term behavior and potential risks of landslides. Notably, there is an important limitation in our monitoring approach that should be addressed. Since we only used ascending Sentinel-1 data, our measurements might underestimate the horizontal displacement component (Chang et al., 2022), particularly in ancient landslide areas where slope-parallel movements could be more significant than vertical subsidence. This limitation suggests that future studies should combine descending orbit data or other monitoring methods to obtain a more complete characterization of landslide movement patterns, as demonstrated by Chang et al. (2024) in their study of slow-moving landslides in vegetated terrain.
4.5 LSTM model demonstrates superior performance in predicting surface deformation in the three gorges reservoir area
This study applied four machine learning models (RF, ERT, GBDT, and SVR) and one deep learning model (LSTM) to predict and evaluate the performance of deformation in different surface deformation areas of the Three Gorges reservoir area. The results showed significant differences in model performance across different regions and evaluation metrics, with LSTM and GBDT performing excellently in most cases. In terms of prediction accuracy, the LSTM model performed best on metrics such as RMSE and SMAPE, especially in the areas of riverside urban ground deformation and riverside road slope deformation. However, we also noted that LSTM’s performance was not as good as other models in some metrics and regions. For example, in terms of R2, LSTM performed relatively poorly in the riverside urban ground deformation area. This difference may reflect the complexity of underlying mechanisms and influencing factors in different deformation areas. Reservoir landslides often exhibit stepped deformation characteristics, which pose challenges for prediction models (Jiang et al., 2024). Therefore, future research could consider combining physical mechanisms and deep learning methods to better capture this complex deformation behavior.
The GBDT model performed excellently on some metrics, especially in terms of MAE and MAPE. This suggests that GBDT may have advantages in handling outliers and non-linear relationships. When predicting the development degree of natural fractures in coal seam reservoirs, tree-based ensemble learning methods (such as random forest and XGBoost) were also found to have high prediction accuracy (Wang et al., 2024). This inspires us to consider combining the advantages of multiple models in future research, such as the method combining multi-temporal InSAR (MT-InSAR) and gated recurrent units (GRU) (Zhou et al., 2024).
In the time series analysis of prediction results, we found differences in prediction trends among different deformation areas. Particularly in the reservoir ancient landslide deformation area, the model significantly overestimated the subsidence trend. This overestimation may be related to the complex geological conditions and hydrological factors in the area. Hill et al.'s study pointed out that for non-periodic signals or predictions of single measurement points, simple extrapolation methods may sometimes be superior to complex time series prediction methods (Hill et al., 2021). Therefore, when dealing with complex geological environments, it may be necessary to incorporate more geological and hydrological information to improve the model’s predictive ability.
To improve the reliability of long-term predictions, future research could consider introducing more auxiliary data, such as combining environmental factors like rainfall, groundwater, and lake area changes as proposed by Radman et al. (2021). The methods and results of this study provide new ideas for large-scale, long-term surface deformation monitoring and prediction. The semi-supervised learning method proposed by Tiwari and Shirzaei provides the possibility for automatic detection of deformation hotspots in InSAR data (Tiwari and Shirzaei, 2024). Combined with this method, our model may achieve a larger-scale and more efficient surface deformation early warning system in the future. Meanwhile, the deep autoencoder architecture developed by Rouet-Leduc et al. provides new approaches for autonomously extracting millimeter-level deformation signals from InSAR time series (Rouet-Leduc et al., 2021), which may help improve the sensitivity of our model in handling minute deformations.
5 Conclusion
This study conducted a comprehensive analysis and prediction of surface deformation in Fengjie County of the Three Gorges reservoir area by applying SBAS-InSAR technology and various machine learning models. The research results revealed complex surface dynamic processes in the region, especially in key areas such as riverside urban ground, riverside road slopes, and ancient reservoir landslides. Among these, the ancient reservoir landslide area showed the most significant subsidence, with an average deformation rate of −6.02 ± 4.55 mm/yr, far higher than other areas. We found that factors such as reservoir water level adjustments, rainfall, geological conditions, and human activities jointly influence surface deformation. Particularly noteworthy is the significant negative correlation between reservoir water level decline and accelerated ground subsidence, which differs from previous understandings and highlights the unique geological and hydrological conditions of the area. At the same time, human activities, especially urbanization processes and road expansion projects, significantly exacerbated natural subsidence processes. These findings not only deepen our understanding of surface dynamics in the Three Gorges reservoir area but also provide an important scientific basis for reservoir management and urban planning.
In terms of applying prediction models, this study compared the performance of various machine learning and deep learning models, finding that the LSTM model performed best in most cases, especially in handling complex time series data. However, the study also found differences in the performance of different models across various regions and evaluation metrics, reflecting the complexity of surface deformation prediction. Notably, models tended to overestimate when predicting deformation in the reservoir’s ancient landslide area, highlighting the challenges of long-term prediction in complex geological environments while also reflecting the complexity and severity of deformation in landslide areas. Future research should focus on integrating more geological, hydrological, and environmental data, and developing hybrid models that combine physical mechanisms and machine learning, to improve the accuracy and reliability of predictions, especially for high-risk areas such as landslides.
Data availability statement
The original contributions presented in the study are included in the article/supplementary material, further inquiries can be directed to the corresponding author.
Author contributions
JY: Writing–original draft, Conceptualization, Data curation, Resources. PK: Writing–original draft, Writing–review and editing, Conceptualization, Formal Analysis, Funding acquisition, Methodology, Project administration, Software, Supervision, Visualization. XD: Writing–original draft, Formal Analysis, Investigation, Methodology, Software. YX: Writing–review and editing, Conceptualization, Project administration, Supervision. QG: Writing–review and editing, Methodology, Validation. YT: Writing–review and editing, Resources, Supervision, Validation. JF: Writing–original draft, Formal Analysis, Methodology, Visualization. QJ: Writing–review and editing, Data curation, Software. WW: Writing–review and editing, Methodology, Software. RA: Writing–review and editing, Investigation, Methodology, Supervision, Visualization.
Funding
The author(s) declare that financial support was received for the research, authorship, and/or publication of this article. This work was supported by the National Key Research and Development Program of China (2022YFC3003205), the Opening fund of State Key Laboratory of Geohazard Prevention and Geoenvironment Protection (Chengdu University of Technology) (SKLGP2023K008), Natural Science Foundation of Chongqing Municipal Science and Technology Commission (CSTB2023NSCQ-MSX0990) and the Hebei Natural Science Foundation (D2023403055).
Conflict of interest
The authors declare that the research was conducted in the absence of any commercial or financial relationships that could be construed as a potential conflict of interest.
Generative AI statement
The author(s) declare that no Generative AI was used in the creation of this manuscript.
Publisher’s note
All claims expressed in this article are solely those of the authors and do not necessarily represent those of their affiliated organizations, or those of the publisher, the editors and the reviewers. Any product that may be evaluated in this article, or claim that may be made by its manufacturer, is not guaranteed or endorsed by the publisher.
References
Bao, Y., Gao, P., and He, X. (2015). The water-level fluctuation zone of Three Gorges Reservoir—a unique geomorphological unit. Earth-Sci Rev. 150, 14–24. doi:10.1016/j.earscirev.2015.07.005
Berardino, P., Fornaro, G., Lanari, R., and Sansosti, E. (2002). A new algorithm for surface deformation monitoring based on small baseline differential SAR interferograms. IEEE Trans. Geosci. Electron. 40, 2375–2383.
Chan, F. K. S., Paszkowski, A., Wang, Z., Lu, X., Mitchell, G., Tran, D. D., et al. (2024). Building resilience in Asian mega-deltas. Nat. Rev. Earth and Environ. 5 (8), 522–537. doi:10.1038/s43017-024-00561-x
Chang, F., Dong, S., Yin, H., and Wu, Z. (2022). Using the SBAS InSAR technique to monitor surface deformation in the Kuqa fold-thrust belt, Tarim Basin, NW China. J. Asian Earth Sci. 231, 105212. doi:10.1016/j.jseaes.2022.105212
Chang, J., Lu, W., Kong, X., Ren, J., Li, X., Yin, L., et al. (2023). A novel method of correlation analysis between ground subsidence and tunnelling parameters based on model fusion. Rock. Mech. 56, 3037–3054.
Chang, F., Dong, S., Yin, H., Ye, X., Zhang, W., and Zhu, H. (2024). Temporal stacking of sub-pixel offset tracking for monitoring slow-moving landslides in vegetated terrain. Landslides 21 (6), 1255–1271. doi:10.1007/s10346-024-02227-7
Chen, M. L., Lv, P. F., Zhang, S. L., Chen, X. Z., and Zhou, J. W. (2018). Time evolution and spatial accumulation of progressive failure for Xinhua slope in the Dagangshan reservoir, Southwest China. Landslides 15, 565–580. doi:10.1007/s10346-018-0946-8
Chen, T., and Guestrin, C. (2016). “Xgboost: a scalable tree boosting system,” in Proceedings of the 22nd ACM SIGKDD international conference on knowledge discovery and data mining.
Chen, Z., Wang, Z., Xi, H., Yang, Z., Zou, L., Zhou, Z., et al. (2016). Recent advances in high slope reinforcement in China: case studies. J. Rock Mech. Geotech. Eng. 8, 775–788. doi:10.1016/j.jrmge.2016.11.001
Cortes, C., and Vapnik, V. (1995). Support-vector networks. Mach. Learn. 20, 273–297. doi:10.1007/bf00994018
Edmonds, D. A., Caldwell, R. L., Brondizio, E. S., and Siani, S. M. (2020). Coastal flooding will disproportionately impact people on river deltas. Nat. Commun. 11 (1), 4741. doi:10.1038/s41467-020-18531-4
Fan, X., Yang, F., Siva Subramanian, S., Xu, Q., Feng, Z., Mavrouli, O., et al. (2020). Prediction of a multi-hazard chain by an integrated numerical simulation approach: the Baige landslide, Jinsha River, China. J. Landslide 17, 147–164. doi:10.1007/s10346-019-01313-5
Ferretti, A., Tamburini, A., Novali, F., Fumagalli, A., Falorni, G., and Rucci, A. (2011). Impact of high resolution radar imagery on reservoir monitoring. J. Environ. Plan. 4, 3465–3471. doi:10.1016/j.egypro.2011.02.272
Gao, X., Tian, W. P., Li, J., Qi, H., Zhang, Z., and Li, S. (2022). Force and deformation response analysis of dual structure slope excavation and support. Geomatics, Nat. Hazards Risk 13, 501–537. doi:10.1080/19475705.2022.2037738
Guzzetti, F., Gariano, S. L., Peruccacci, S., Brunetti, M. T., and Melillo, M. (2022). “Rainfall and landslide initiation,” in Rainfall (Elsevier), 427–450.
Herrera-García, G., Ezquerro, P., Tomás, R., Béjar-Pizarro, M., López-Vinielles, J., Rossi, M., et al. (2021). Mapping the global threat of land subsidence. Nature 371, 34–36. doi:10.1126/science.abb8549
Hill, E. M., McCaughey, J. W., Switzer, A. D., Massey, C. I., Taig, T., Yates, K., et al. (2024). Human amplification of secondary earthquake hazards through environmental modifications. Nat. Rev. Earth Environ. 5, 463–476. doi:10.1038/s43017-024-00551-z
Hill, P., Biggs, J., Ponce-López, V., and Bull, D. (2021). Time-series prediction approaches to forecasting deformation in Sentinel-1 INSAR data. J. Geophys. Res. Solid Earth 126, e2020JB020176. doi:10.1029/2020jb020176
Hochreiter, S., and Schmidhuber, J. (1997). Long short-term memory. Neural Comput. 9 (8), 1735–1780. doi:10.1162/neco.1997.9.8.1735
Huang, D., Luo, S. L., Zhong, Z., Gu, D. M., Song, Y. X., and Tomás, R. (2020). Analysis and modeling of the combined effects of hydrological factors on a reservoir bank slope in the Three Gorges Reservoir area, China. Eng. Geol. 279, 105858. doi:10.1016/j.enggeo.2020.105858
Huang, X., Guo, F., Deng, M., Yi, W., and Huang, H. (2020). Understanding the deformation mechanism and threshold reservoir level of the floating weight-reducing landslide in the Three Gorges Reservoir Area, China. Landslides 17, 2879–2894. doi:10.1007/s10346-020-01435-1
Huang, X., Wang, L., Ye, R., Yi, W., Huang, H., Guo, F., et al. (2022). Study on deformation characteristics and mechanism of reactivated ancient landslides induced by engineering excavation and rainfall in Three Gorges Reservoir area. Nat. Hazards 110, 1621–1647. doi:10.1007/s11069-021-05005-z
Jiang, Q., Qi, Z., Wei, W., and Zhou, C. (2015). Stability assessment of a high rock slope by strength reduction finite element method. Bull. Eng. Geol. Environ. 74, 1153–1162. doi:10.1007/s10064-014-0698-1
Jiang, Y., Zheng, L., Xu, Q., and Lu, Z. (2024). Deformation mechanism-assisted deep learning architecture for predicting step-like displacement of reservoir landslide. Int. J. Appl. Earth Obs. Geoinf 133, 104121. doi:10.1016/j.jag.2024.104121
Lacroix, P., Handwerger, A. L., and Bièvre, G. (2020). Life and death of slow-moving landslides. Nat. Rev. Earth Environ. 1, 404–419. doi:10.1038/s43017-020-0072-8
Lanari, R., Mora, O., Manunta, M., Mallorquí, J. J., Berardino, P., and Sansosti, E. (2004). A small-baseline approach for investigating deformations on full-resolution differential SAR interferograms. J. Geodyn. 42, 1377–1386. doi:10.1109/tgrs.2004.828196
Li, S., Xu, Q., Tang, M., Iqbal, J., Liu, J., Zhu, X., et al. (2019). Characterizing the spatial distribution and fundamental controls of landslides in the three gorges reservoir area, China. Bull. Eng. Geol. Environ. 78, 4275–4290. doi:10.1007/s10064-018-1404-5
Li, S., Xu, W., and Li, Z. (2022). Review of the SBAS InSAR Time-series algorithms, applications, and challenges. Geodesy Geodyn. 13, 114–126. doi:10.1016/j.geog.2021.09.007
Li, X., Li, W., Wu, Z., Xu, Q., Zheng, D., Dong, X., et al. (2024). Identification and deformation characteristics of active landslides at large hydropower stations at the early impoundment stage: a case study of the lianghekou reservoir area in sichuan province, southwest China. Remote Sens. 16, 3175. doi:10.3390/rs16173175
Luo, S. L., Huang, D., Peng, J. B., and Tomás, R. (2022). Influence of permeability on the stability of dual-structure landslide with different deposit-bedding interface morphology: the case of the three Gorges Reservoir area, China. Eng. Geol. 296, 106480. doi:10.1016/j.enggeo.2021.106480
Ma, Z., and Mei, G. J. (2021). Deep learning for geological hazards analysis: data, models, applications, and opportunities. Earth-Sci Rev. 223, 103858. doi:10.1016/j.earscirev.2021.103858
Machowski, R., Rzetala, M. A., Rzetala, M., and Solarski, M. (2016). Geomorphological and hydrological effects of subsidence and land use change in industrial and urban areas. Land Degrad. and Dev. 27, 1740–1752. doi:10.1002/ldr.2475
Osmanoğlu, B., Sunar, F., Wdowinski, S., and Cabral-Cano, E. J. (2016). Time series analysis of InSAR data: methods and trends. Int. J. Appl. Earth Observation Geoinformation 115, 90–102. doi:10.1016/j.isprsjprs.2015.10.003
Paszkowski, A., Goodbred, Jr S., Borgomeo, E., Khan, M. S. A., and Hall, J. W. (2021). Geomorphic change in the ganges–brahmaputra–meghna delta. Nat. Rev. Earth and Environ. 2, 763–780. doi:10.1038/s43017-021-00213-4
Radman, A., Akhoondzadeh, M., and Hosseiny, B. (2021). Integrating InSAR and deep-learning for modeling and predicting subsidence over the adjacent area of Lake Urmia, Iran. GISci Remote Sens. 58, 1413–1433. doi:10.1080/15481603.2021.1991689
Reichstein, M., Camps-Valls, G., Stevens, B., Jung, M., Denzler, J., Carvalhais, N., et al. (2019). Deep learning and process understanding for data-driven Earth system science. Nature 566, 195–204. doi:10.1038/s41586-019-0912-1
Rouet-Leduc, B., Jolivet, R., Dalaison, M., Johnson, P. A., and Hulbert, C. (2021). Autonomous extraction of millimeter-scale deformation in InSAR time series using deep learning. Nat. Commun. 12, 6480. doi:10.1038/s41467-021-26254-3
Sharifi, A., Khodaei, B., Ahrari, A., Hashemi, H., and Haghighi, A. T. (2024). Can river flow prevent land subsidence in urban areas? Sci. Total Environ. 917, 170557. doi:10.1016/j.scitotenv.2024.170557
Shi, J., Yang, H., Peng, J., Wu, L., Xu, B., Liu, Y., et al. (2019). InSAR monitoring and analysis of ground deformation due to fluid or gas injection in Fengcheng oil field, Xinjiang, China. J. Int. Soc. Remote Sens. Environ. 47, 455–466. doi:10.1007/s12524-018-0903-y
Song, K., Wang, F., Yi, Q., and Lu, S. (2018). Landslide deformation behavior influenced by water level fluctuations of the Three Gorges Reservoir (China). Eng. Geol. 247, 58–68. doi:10.1016/j.enggeo.2018.10.020
Stark, T. D., Choi, H., and McCone, S. (2005). Drained shear strength parameters for analysis of landslides. J. Geotech. Geoenviron Eng. 131, 575–588. doi:10.1061/(asce)1090-0241(2005)131:5(575)
Sun, H. Y., Wu, X., Wang, D. F., Xu, H. D., Liang, X., and Shang, Y. Q. (2019). Analysis of deformation mechanism of landslide in complex geological conditions. Bull. Eng. Geol. Environ. 78, 4311–4323. doi:10.1007/s10064-018-1406-3
Taib, S., Selaman, O., Chen, C., Lim, R., and Awang Ismail, D. (2017). Landslide susceptibility in relation to correlation of groundwater development and ground condition. Adv. Civ. Eng. 2017, 1–7. doi:10.1155/2017/4320340
Tang, M., Xu, Q., Yang, H., Li, S., Iqbal, J., Fu, X., et al. (2019). Activity law and hydraulics mechanism of landslides with different sliding surface and permeability in the Three Gorges Reservoir Area, China. Eng. Geol. 260, 105212. doi:10.1016/j.enggeo.2019.105212
Tiwari, A., Narayan, A. B., and Dikshit, O. J. (2020). Deep learning networks for selection of measurement pixels in multi-temporal SAR interferometric processing. Int. J. Photogrammetry Remote Sens. 166, 169–182. doi:10.1016/j.isprsjprs.2020.06.005
Tiwari, A., and Shirzaei, M. (2024). A novel machine learning and deep learning semi-supervised approach for automatic detection of InSAR-based deformation hotspots. Int. J. Appl. Earth Obs. Geoinf 126, 103611. doi:10.1016/j.jag.2023.103611
van Bijsterveldt, C. E. J., Herman, P. M. J., van Wesenbeeck, B. K., Temmink, R. J. M., Gerkema, T., Bouma, T. J., et al. (2023). Subsidence reveals potential impacts of future sea level rise on inhabited mangrove coasts. Nat. Sustain 6, 1565–1577. doi:10.1038/s41893-023-01226-1
Wang, L., Yin, Y., Huang, B., and Dai, Z. (2020). Damage evolution and stability analysis of the Jianchuandong dangerous rock mass in the Three Gorges Reservoir Area. Eng. Geol. 265, 105439. doi:10.1016/j.enggeo.2019.105439
Wang, L., Zhang, Z., Huang, B., Hu, M., and Zhang, C. (2021). Triggering mechanism and possible evolution process of the ancient Qingshi landslide in the Three Gorges Reservoir. Geomatics, Nat. Hazards Risk 12, 3160–3174. doi:10.1080/19475705.2021.1998230
Wang, W., He, Y., Zhang, L., Chen, Y., Qiu, L., and Pu, H. (2020). Analysis of surface deformation and driving forces in Lanzhou. J. Geodyn. 12, 1127–1145. doi:10.1515/geo-2020-0128
Wang, Z., Cai, Y., Liu, D., Lu, J., Qiu, F., Sun, F., et al. (2024). Characterization of natural fracture development in coal reservoirs using logging machine learning inversion, well test data and simulated geostress analyses. Eng. Geol. 107696. doi:10.1016/j.enggeo.2024.107696
Xia, M., Ren, G. M., and Ma, X. L. (2013). Deformation and mechanism of landslide influenced by the effects of reservoir water and rainfall, Three Gorges, China. Nat. Hazards 68, 467–482. doi:10.1007/s11069-013-0634-x
Yang, C., Lv, S., Hou, Z., Zhang, Q., Li, T., and Zhao, C. (2022). Monitoring of land subsidence and ground fissure activity within the Su-Xi-Chang area based on time-series InSAR. J. Remote Sens. 14, 903. doi:10.3390/rs14040903
Yao, W., Li, C., Zuo, Q., Zhan, H., and Criss, R. E. (2019). Spatiotemporal deformation characteristics and triggering factors of Baijiabao landslide in Three Gorges Reservoir region, China. Geomorphology 343, 34–47. doi:10.1016/j.geomorph.2019.06.024
Ye, Y., Tan, X., Liu, Y., Bian, S., Zhou, C., Zeng, X., et al. (2024). Drainage reorganization and divide migration driven by basin subsidence: An example from the Micang Shan, outskirts of eastern Tibet and its implications for Cenozoic evolution of the Yangtze River. Basin Research 36, e12875.
Zhang, X., Dong, Z., Gupta, H., Wu, G., and Li, D. (2016). Impact of the three gorges dam on the hydrology and ecology of the Yangtze River. Water 8, 590. doi:10.3390/w8120590
Zhang, Y., Wu, J., Xue, Y., Wang, Z., Yao, Y., Yan, X., et al. (2015). Land subsidence and uplift due to long-term groundwater extraction and artificial recharge in Shanghai, China. Hydrogeol. J. 23, 1851–1866. doi:10.1007/s10040-015-1302-x
Zhang, Y., Zhang, Z., Xue, S., Wang, R., and Xiao, M. (2020). Stability analysis of a typical landslide mass in the Three Gorges Reservoir under varying reservoir water levels. Environ. Earth Sci. 79, 42–14. doi:10.1007/s12665-019-8779-x
Zhao, F., Meng, X., Zhang, Y., Chen, G., Su, X., and Yue, D. (2019). Landslide susceptibility mapping of karakorum highway combined with the application of SBAS-InSAR technology. Sensors 19, 2685. doi:10.3390/s19122685
Zhou, C., Cao, Y., Gan, L., Wang, Y., Motagh, M., Roessner, S., et al. (2024). A novel framework for landslide displacement prediction using MT-InSAR and machine learning techniques. Eng. Geol. 331, 107493. doi:10.1016/j.enggeo.2024.107497
Keywords: surface deformation, SBAS-InSAR, Three Gorges Reservoir area, machine learning prediction, reservoir water level impact
Citation: Yang J, Kou P, Dong X, Xia Y, Gu Q, Tao Y, Feng J, Ji Q, Wang W and Avtar R (2025) Reservoir water level decline accelerates ground subsidence: InSAR monitoring and machine learning prediction of surface deformation in the Three Gorges Reservoir area. Front. Earth Sci. 12:1503634. doi: 10.3389/feart.2024.1503634
Received: 29 September 2024; Accepted: 24 December 2024;
Published: 13 January 2025.
Edited by:
Hong-Hu Zhu, Nanjing University, ChinaReviewed by:
Shweta Vincent, Manipal Institute of Technology, IndiaFengnian Chang, Nanjing University, China
Copyright © 2025 Yang, Kou, Dong, Xia, Gu, Tao, Feng, Ji, Wang and Avtar. This is an open-access article distributed under the terms of the Creative Commons Attribution License (CC BY). The use, distribution or reproduction in other forums is permitted, provided the original author(s) and the copyright owner(s) are credited and that the original publication in this journal is cited, in accordance with accepted academic practice. No use, distribution or reproduction is permitted which does not comply with these terms.
*Correspondence: Pinglang Kou, cGluZ2xhbmdrb3VAMTYzLmNvbQ==