- Key Laboratory of Marine Hazards Forecasting, National Marine Environmental Forecasting Center, Ministry of Natural Resources, Beijing, China
The operational sea ice forecasts from the Arctic Ice Ocean Prediction System (ArcIOPS) during 2021–2023 are validated against satellite-retrieved sea ice concentration and drift data, in situ and reanalyzed sea ice thickness data. The results indicate that the ArcIOPS has a reliable capacity on the Arctic sea ice forecasts for the future 7 days. Over the validation period, the root mean square error (RMSE) of the ArcIOPS sea ice concentration forecasts at a lead time of up to 168 h ranges between 8% and 20%, and the integrated ice edge error (IIEE) is lower than 1.6 × 10⁶ km2 with respect to the Hai Yang 2B (HY-2B) sea ice concentration data. Compared to the Pan-Arctic Ice Ocean Modeling and Assimilation System (PIOMAS), sea ice volume evolution from the ArcIOPS forecasts is closer to that derived from the CS2SMOS sea ice thickness observations, which have been assimilated into the ArcIOPS. Sea ice thickness comparisons at three locations in the Beaufort Sea between the ArcIOPS forecasts and in situ mooring observations also prove that the sea ice thickness forecasts are credible, which sets a solid basis for supporting ice-breaker navigation in the Arctic thick ice zone. The sea ice drift deviations between the ArcIOPS forecasts and the National Snow and Ice Data Center (NSIDC) data are lower than 4 cm/s in most of the months. Future work will emphasize on developing multi-variable data assimilation scheme and fully coupled air‒ice‒ocean forecasting system for the Arctic sea ice forecasts.
1 Introduction
Along with the Arctic amplification (Serreze and Barry, 2011; Rantanen et al., 2022), the Arctic Ocean has experienced a transition from a multiyear ice-dominated Arctic toward a first-year ice-dominated Arctic (Lang et al., 2017). The general decline in sea ice concentration and thickness in the satellite era provides an advantage for human activities during summer in the Arctic Ocean (Comiso, 2012; Kwok, 2018). The Chinese National Arctic Research Expedition (CHINARE) has been carried out once per year between 2016 and 2024, except for 2022. The China COSCO Shipping Group has implemented commercial vessel navigation in the Arctic Northeast Passage since 2013, which has created a sizable economic benefit.
In the Arctic Ocean, sea ice is always a potential threat to safe navigation, especially to those vessels without ice-breaking capacity. Aiming to provide accurate sea ice forecasting information to commercial/scientific vessels in the Arctic Ocean, the National Marine Environmental Forecasting Center (NMEFC) of China has conducted an Arctic sea ice forecasting system at synoptic time scale in 2017, i.e., Arctic Ice Ocean Prediction System (ArcIOPS) Mu et al. (2019). The operational system forecasts changes in sea ice concentration, sea ice thickness, sea ice drift, and sea ice convergence rate for the future 7 days. The ArcIOPS sea ice forecasting products have been actively engaged in the sea ice forecasting and warning service for the CHINARE and COSCO Shipping since 2017.
Mu et al. (2019) introduced the ArcIOPS version 1.0 and validated the system’s performance on sea ice forecasts in summer 2017. Liang et al. (2020) presented the ArcIOPS version 1.1 and evaluated the system’s performance on sea ice forecasts in summer 2018. The key upgrade of the ArcIOPS from versions 1.0 to 1.1 is the utilization of the multi-variable data assimilation scheme, which can assimilate satellite-observed sea ice concentration, sea ice thickness, and sea surface temperature (SST) in the marginal ice zone synchronously (Liang et al., 2019). In this paper, we evaluate the whole-year performance of the ArcIOPS sea ice forecasts during 2021–2023 against satellite-retrieved maps, in situ observations, and reanalysis data, including the sea ice concentration derived from the measurements of the scanning microwave radiometer equipped on the Hai Yang 2B (HY-2B) Wu et al. (2023) satellite, sea ice thickness derived from the Pan-Arctic Ice Ocean Modeling and Assimilation System (PIOMAS) Zhang and Rothrock (2003) and from in situ sea ice draft measured by upward looking sonar (ULS) at three locations from the Beaufort Gyre Exploration Project (BGEP) Proshutinsky et al. (2005), and sea ice drift derived from a wide variety of observational sources provided by the National Snow and Ice Data Center (NSIDC) Tschudi et al. (2019).
The rest of the paper is organized as follows: a brief description of the ArcIOPS and data sets used for assimilation and validation is given in Section 2. The main results are presented in Section 3. The discussion and conclusion are given in Section 4.
2 Methods
2.1 Arctic Ice Ocean Prediction System
The ArcIOPS is based on an Arctic configuration of the Massachusetts Institute of Technology general circulation model (MITgcm) Marshall et al. (1997) and an ensemble-based Kalman filter data assimilation model (Nerger and Hiller, 2013). The ocean model of the Arctic configuration using curvilinear orthogonal coordinates covers the whole Arctic Ocean, with its open boundaries close to 55°N in both the Atlantic and Pacific sectors (Nguyen et al., 2011; Liang and Losch, 2018), which includes 420 × 384 horizontal grid points with an average horizontal resolution of 18 km. The ocean model has 50 uneven vertical layers, with intervals ranging from 10 m at the sea surface to 456 m at the bottom. Physical parameterizations used in the ocean model include the K-profile parameterization vertical mixing scheme (Large et al., 1994) and bulk formula (Doney et al., 1998) for surface heat flux calculation. The Arctic configuration contains a zero-layer thermodynamic–dynamic sea ice model (Semtner, 1976), which shares the same horizontal grid points with the ocean model. The sea ice model includes a prescribed sub-grid ice thickness distribution with seven thickness categories, which allows ice to form even when the mean ice thickness is large and thus reduces the low thickness bias. Due to the lack of thermal inertia, the zero-layer sea ice thermodynamics are known to overestimate the seasonal variations. Sea ice rheology in the Arctic configuration uses the traditional viscous–plastic scheme (Hibler III, 1979; Losch et al., 2010). The 12-monthly climatological oceanic open boundary conditions used to drive the ArcIOPS are derived from the Estimating the Circulation and Climate of the Ocean (ECCO), phase II: high-resolution global ocean and sea ice data synthesis (Menemenlis et al., 2008).
The data assimilation model of the ArcIOPS uses an ensemble-based Localized Error Subspace Transform Kalman Filter (LESTKF) Nerger et al. (2012) scheme which is enveloped in the Parallel Data Assimilation Framework (PDAF) Nerger and Hiller (2013). The LESTKF is a localized variant of the Error Subspace Transform Kalman Filter (ESTKF) using dynamic background error covariance, which allows the background error covariance to change along with the evolution of the system state. Previous studies have proven that the LESTKF is suitable for high-dimensional models with small-scale local features and large number of observations, which has advantages of high accuracy, low computational consumption, and outstanding efficiency (Chen et al., 2017; Mu et al., 2018; Liang et al., 2019).
The ArcIOPS is an ensemble forecasting system which includes 12 parallel members. The flowchart of the ArcIOPS is shown in Figure 1. The forecasts initialized on 1st January 2021 are used as an example to illustrate the flowchart of the ArcIOPS.
Step 1: The initial model state ensemble on 1st January 2021 was directly taken from the 24-h forecast fields from the operational result of the previous day. On 1st January 2021, the observation preprocessing module automatically downloaded near-real-time satellite observations from the internet, including the Advanced Microwave Scanning Radiometer 2 (AMSR2) sea ice concentration data (Spreen et al., 2008), the CS2SMOS sea ice thickness data (Ricker et al., 2017), and the Group for High-Resolution SST Multi-Product Ensemble (GMPE) SST data (Donlon et al., 2007).
Step 2: The data assimilation module assimilated the near-real-time satellite observations into the initial model state ensemble to improve the initial condition, thus generating an analyzed initial model state ensemble. Then, an adjusted initial model state ensemble was produced after applying basic physical constraints among model variables to the analyzed initial model state ensemble. The physical constraints include the following: setting sea ice thickness to 0 whenever the sea ice concentration is 0, sea ice concentration ranging between 0 and 1, and sea ice thickness ranging between 0 and 5. In addition, absolute increment in the ocean temperature in the ocean mixed layer introduced by each SST assimilation step is limited to 0.5°C to avoid numerical instability.
Step 3: Starting from the adjusted initial model state ensemble, each member was integrated for 168 h driven by the Global Forecast System (GFS; Han et al., 2021) operational atmospheric surface forcing variables, including 2 m air temperature, 2 m specific humidity, 10 m wind speed components (u and v), precipitation, and downward shortwave and longwave radiation at the sea surface. Ensemble mean forecasts of sea ice and ocean states of the future 168 h were recorded and visualized at a time interval of 24 h. The 24-h forecasts of sea ice and ocean states were saved as the initial model state ensemble for the operational forecast of the following day.
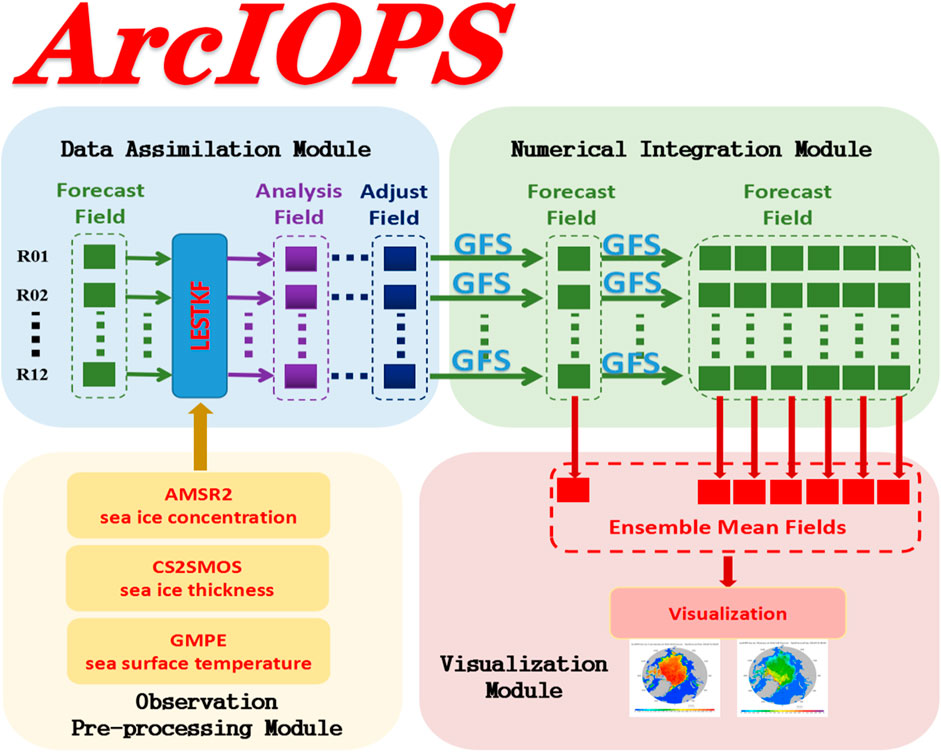
Figure 1. Flowchart of the ArcIOPS. The system includes four modules: observation preprocessing module, data assimilation module, numerical integration module, and visualization module. The LESTKF scheme is included in the data assimilation module. The Arctic configuration of the MITgcm is included in the numerical integration module.
2.2 Data sets
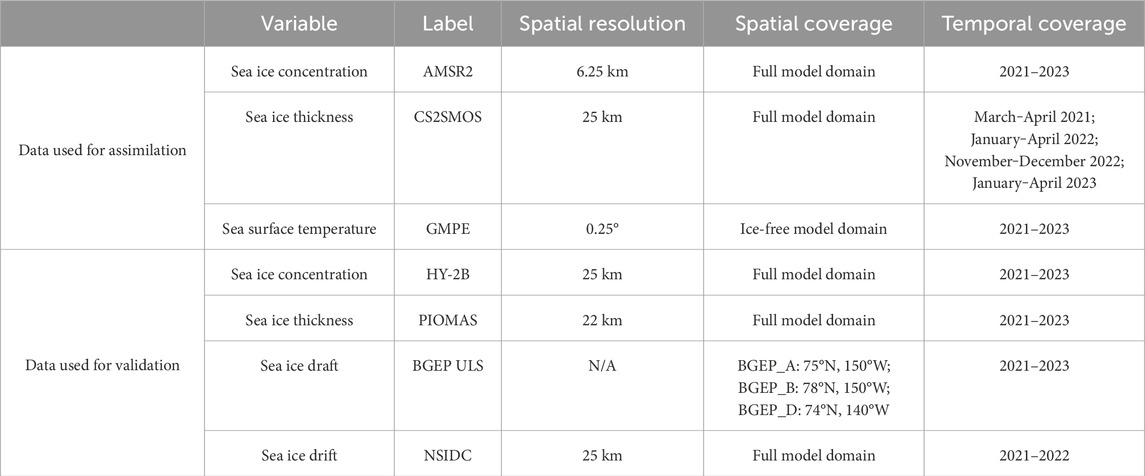
Daily AMSR2 sea ice concentration data, daily CS2SMOS sea ice thickness data, and daily GMPE SST data were used for assimilation (Table 1). Over the 3 years, the AMSR2 and GMPE data were available and assimilated each day, whereas the CS2SMOS data were assimilated discontinuously. The AMSR2 sea ice concentration data (Spreen et al., 2008), provided by the University of Bremen, are derived from Global Change Observation Mission–Water satellite brightness temperature data with a horizontal resolution of 6.25 km using the ARTIST Sea Ice algorithm. The daily CS2SMOS sea ice thickness data with a horizontal resolution of 25 km (Ricker et al., 2017), provided by the Alfred-Wegener-Institut, Helmholtz-Zentrum für Polar- und Meeresforschung, are a combined product interpolated from the daily Soil Moisture Ocean Salinity (SMOS) sea ice thickness data in the thin ice area (<1 m) and the weekly Cryosat-2 sea ice thickness data in the thick ice area (≥1 m). Sponsored by the European Space Agency, the SMOS sea ice thickness data are retrieved from satellite brightness temperature data combined with a sea ice thermodynamic model and a three-layer radiative-transfer model (Tian-Kunze et al., 2014). The Cryosat-2 sea ice thickness data are retrieved from radar altimetry measurements of sea ice freeboard, which are converted to sea ice thickness under the assumption of hydrostatic equilibrium (Laxon et al., 2013). Due to the limitation of the sea ice thickness retrieval algorithm in the melt season, the CS2SMOS sea ice thickness data are available during October‒April. The GMPE SST data (Donlon et al., 2007), provided by the United Kingdom Met Office, are a near-real-time Level 4 satellite-retrieved product which covers ice-free areas with a horizontal resolution of 0.25°. During the assimilation, the uncertainties of the AMSR2 data were defined as a constant of 0.25, following our previous work (Liang et al., 2019), whereas the uncertainties of the CS2SMOS and GMPE data were provided by the data sets.
Daily HY-2B sea ice concentration data, daily PIOMAS sea ice thickness data, daily in situ ULS-observed sea ice thickness data, and daily NSIDC sea ice drift data are used for validation (Table 1). The HY-2B satellite, launched on 25th October 2018 by the National Satellite Ocean Application Service (NSOAS) of China, collects brightness temperature data with a swath of 1,600 km, which are converted to sea ice concentration data on the standard EASE grid using the National Aeronautics and Space Administration (NASA) team algorithm (Cavalieri et al., 1984), with a horizontal resolution of 25 km (Wu et al., 2023). The PIOMAS system, developed at the Applied Physics Laboratory of the University of Washington, produces sea ice thickness maps covering the Arctic Ocean by assimilating the observed sea ice concentration and SST (Zhang and Rothrock, 2003). The three moored ULSs were deployed by the Woods Hole Oceanographic Institution at the locations of BGEP_A: 75°N, 150°W; BGEP_B: 78°N, 150°W; and BGEP_D: 74°N, 140°W in the Beaufort Sea (Proshutinsky et al., 2005). The sea ice draft was recorded since 2003 by the three ULSs in the ocean. The ULS samples the ice draft with a precision of 0.1 m, and the ice draft can be converted to sea ice thickness by multiplying a factor of 1.1 (Nguyen et al., 2011). The NSIDC sea ice drift data, with a horizontal resolution of 25 km, are computed from a wide variety of sources including multiple passive microwave radiometers, on-site buoy data, and reanalysis data from the National Centers for Environmental Prediction/National Center for Atmospheric Research (Tschudi et al., 2019). The HY-2B, PIOMAS, and ULS data used in this study cover 2021–2023, whereas the NSIDC data cover 2021–2022 owing to time delay in publishing the 2023 data by the data producer.
3 Results
3.1 Sea ice concentration
Since the ArcIOPS assimilated the AMSR2 sea ice concentration data, we validate sea ice concentration forecasts of the ArcIOPS at different lead times against the HY-2B sea ice concentration data. The HY-2B sea ice concentration data have a comparable resolution to that of the ArcIOPS forecasts. In addition, the sea ice edge, defined as the isoline of 15% sea ice concentration, is derived from the sea ice concentration forecasts. The performance of sea ice edge forecasts is represented by the integrated ice edge error (IIEE) Goessling et al. (2016).
Basically, along with the prolongation of the forecast lead time, the sea ice concentration root mean square error (RMSE) between the ArcIOPS forecasts and the HY-2B data increases, ranging between 8% and 20% at a lead time of up to 168 h during the validation period. The only exception is in the second half of the month of October 2021 when the sea ice concentration RMSE exceeds 20% (Figure 2A). The sea ice concentration RMSE is relatively small in summer and is maintained below 15% in summers of 2021 and 2022; however, in these 2 years, the periods of January‒March and May‒June have relatively large sea ice concentration RMSE, which is higher than 15%. The first half year of 2023 has relatively steady sea ice concentration RMSE, ranging between 12% and 16%, in comparison to the same periods of the other 2 years.
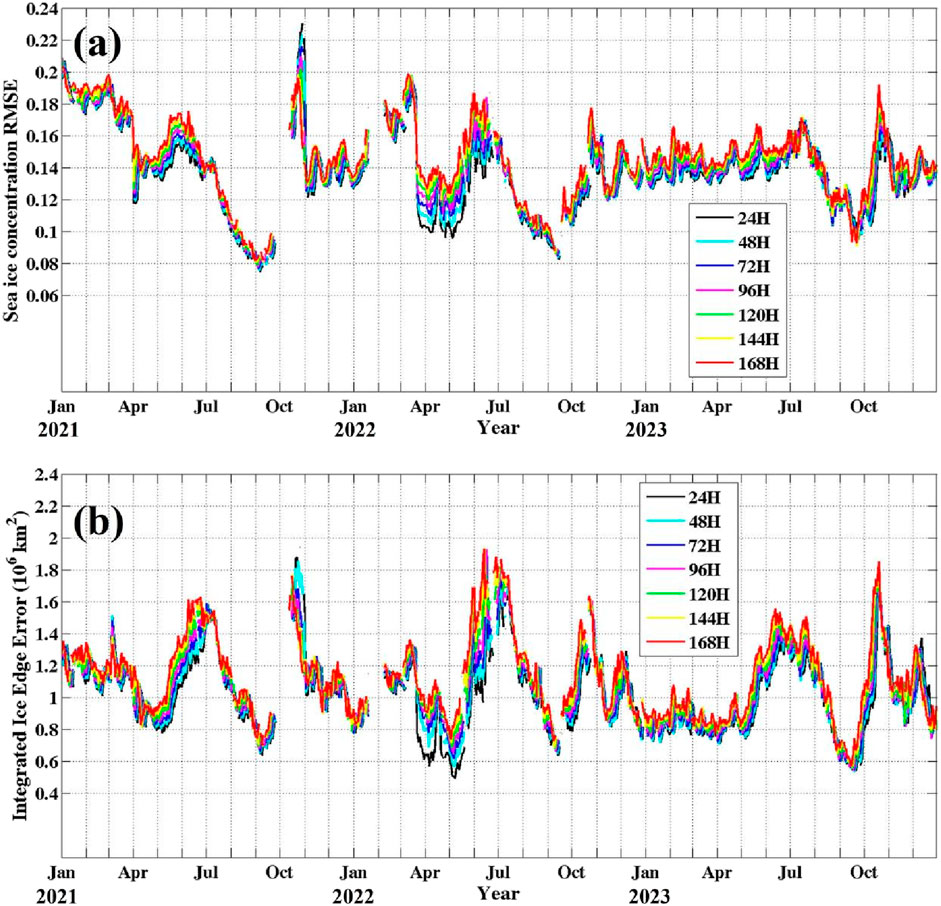
Figure 2. Time series of (A) the sea ice concentration RMSE and (B) integrated ice edge error of the ArcIOPS forecasts at different lead times with respect to the HY-2B data. The black, cyan, blue, magenta, green, yellow, and red lines denote the forecasts at lead times of 24 h, 48 h, 72 h, 96 h, 120 h, 144 h, and 168 h, respectively.
The IIEE between the ArcIOPS forecasts and the HY-2B data over the 3 years is lower than 1.6 × 10⁶ km2 for most of the time, with its maximum value being lower than 2 × 10⁶ km2 in June 2022 (Figure 2B). In general, the IIEE is relatively large in May‒July when the ice starts and continues to melt, suggesting that the ArcIOPS has a relatively moderate skill in forecasting sea ice evolution during the freeze-to-melt transition period. Similarly, the IIEE is also large in October when the ice starts to freeze, suggesting that the ArcIOPS also performs moderately in forecasting sea ice evolution during the melt-to-freeze transition period.
Spatially, in January‒March (Figures 3A–C), the ArcIOPS forecasts at a lead time of 24-h overestimate sea ice concentration in the Barents Sea and the Bering Sea, while underestimating the sea ice concentration in the Labrador Sea and the Greenland Sea. In April‒June (Figures 3D–F), the positive sea ice concentration biases for the Barents Sea and the Bering Sea are reduced, but positive sea ice concentration biases for the Beaufort Sea and the Laptev Sea are increased. In July‒September (Figures 3G–I), negative sea ice concentration biases occupy the marginal ice zone, while positive sea ice concentration biases occupy the Arctic ice zone inside. In October (Figure 3J), the ice zone with negative sea ice concentration biases is expanded, which means that the sea ice freeze onset is delayed in the ArcIOPS in comparison to the HY-2B observations. In November‒December (Figures 3K, L), along with the recovery of the Arctic sea ice zone, the sea ice concentration biases of the ArcIOPS forecast are reduced again to a low level.
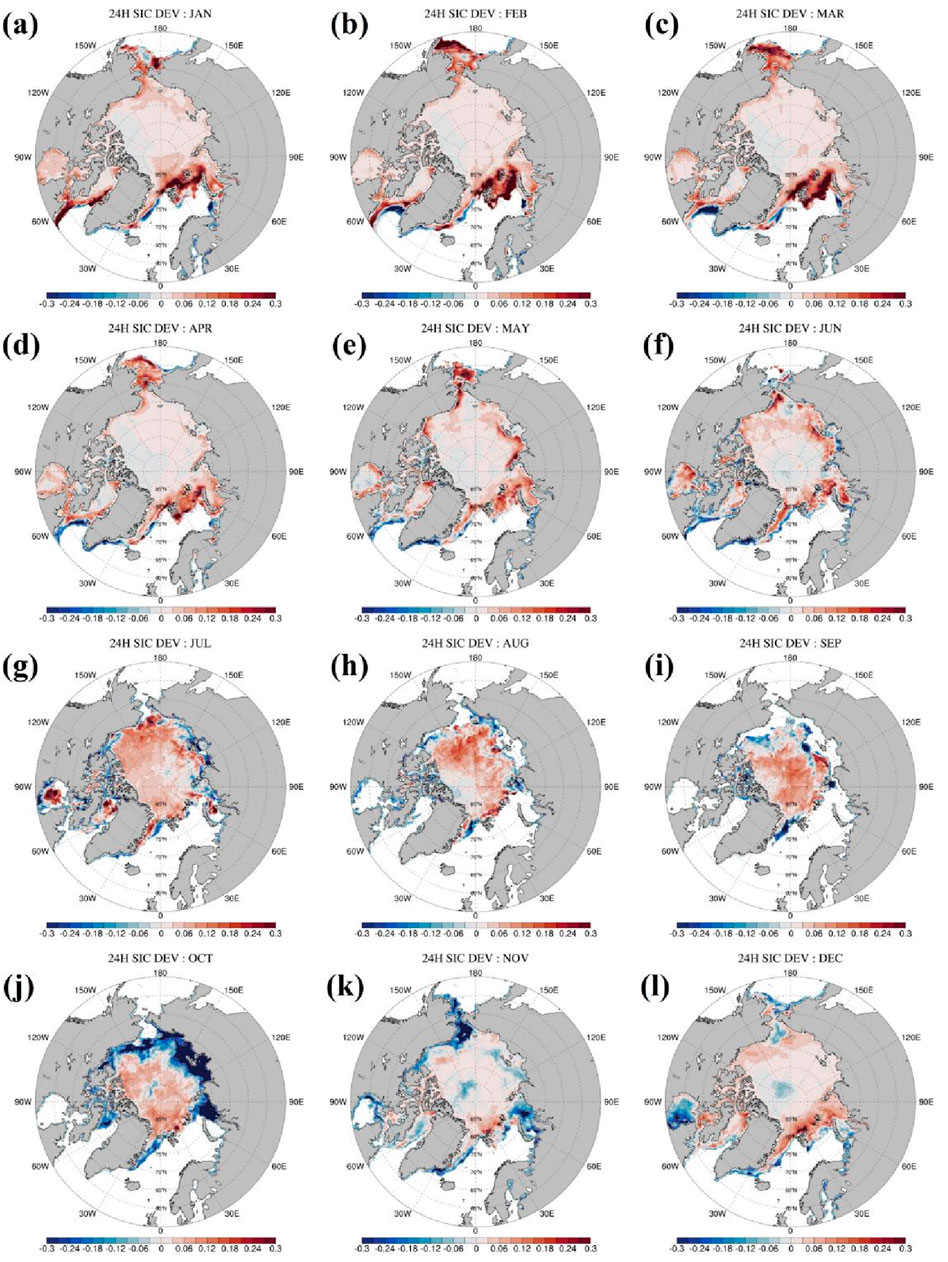
Figure 3. Monthly patterns of sea ice concentration deviation between the ArcIOPS forecasts at a lead time of 24 h and the HY-2B data. (A–L) denote January‒December, respectively. The patterns are averaged between 2021 and 2023.
3.2 Sea ice thickness
The sea ice volume derived from the ArcIOPS sea ice thickness forecasts at a lead time of 24 h is evaluated against that derived from the PIOMAS sea ice thickness reanalysis, as well as the assimilated CS2SMOS sea ice thickness data (Figure 4). Due to the availability of the near-real-time CS2SMOS sea ice thickness data, the CS2SMOS observations were assimilated into the ArcIOPS in March‒April of 2021, January‒April of 2022, November‒December of 2022, and January‒April of 2023. Although the CS2SMOS observations were assimilated discontinuously, the assimilation of sea ice thickness data significantly changed the model state evolution in the operational records of 2021–2023. Before the day in 2021 when the CS2SMOS sea ice thickness data were assimilated for the first time, the sea ice volume evolution of the ArcIOPS forecast was found to be generally in line with the PIOMAS sea ice volume. After the initial assimilation of the CS2SMOS sea ice thickness data in 2021, the sea ice volume of the ArcIOPS forecasts decreases drastically, with a decrement of 2 × 10³ km3. A similar effect of sea ice thickness assimilation on the modeled sea ice volume evolution was observed in 2022. Moreover, the PIOMAS data seem to overestimate the Arctic sea ice volume in winter and spring, as revealed by the comparison against the CS2SMOS observations.
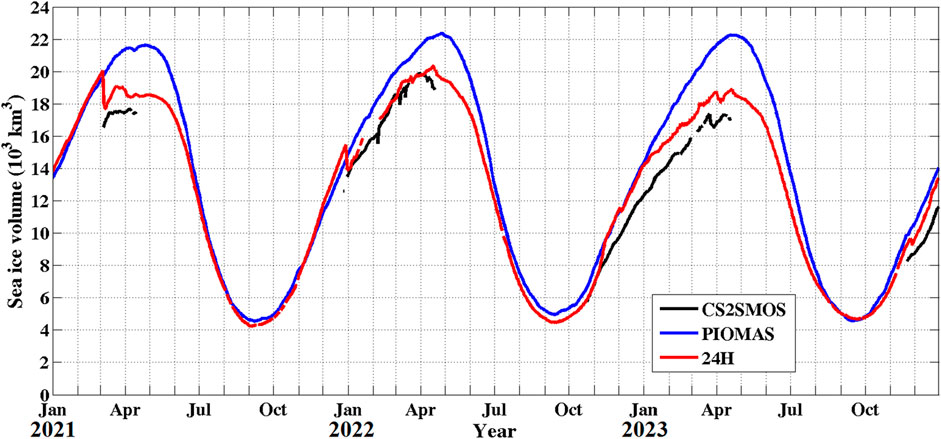
Figure 4. Time series of the sea ice volume derived from the CS2SMOS data (black), the PIOMAS data (blue), and the ArcIOPS forecasts at a lead time of 24 h (red).
Spatially, in January‒February (Figures 5A, B) and October‒November (Figures 5E, F), the ArcIOPS forecasts at a lead time of 24 h underestimate sea ice thickness in the Greenland Sea and the high-latitude Arctic Ocean with a mean negative bias of 0.5–1 m. In other areas of the Arctic sea ice zone, the ArcIOPS forecasts at a lead time of 24 h generate thicker ice in comparison to the CS2SMOS data. In March‒April (Figures 5C, D), both the positive and negative biases in the sea ice thickness forecasts are reduced. It is noteworthy that the CS2SMOS sea ice thickness data have relatively considerable uncertainties; thus, the sea ice thickness forecasts of the ArcIOPS may still be in a rational range (Figure 5G).
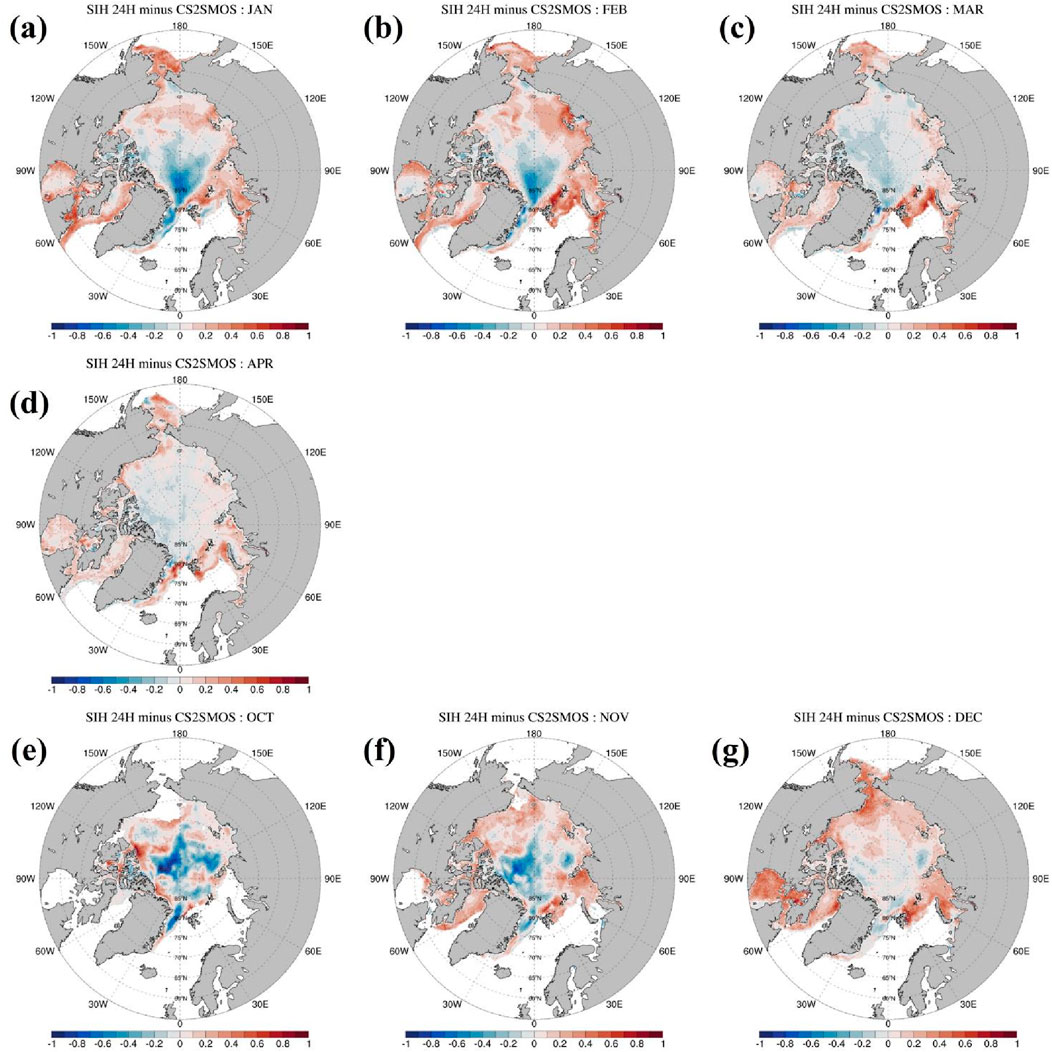
Figure 5. Monthly patterns of the sea ice thickness deviation between the ArcIOPS forecasts at a lead time of 24 h and the CS2SMOS data. (A‒G) denote January, February, March, April, October, November, and December, respectively. The patterns are averaged between 2021 and 2023. The unit is m.
The sea ice thickness comparison between the ArcIOPS forecasts and the PIOMAS data shows that the winter‒spring sea ice in the ArcIOPS forecasts is substantially thinner than that in the PIOMAS data in most areas of the Arctic Ocean, except the Bering Sea, the Greenland Sea, and the area north of the Fram Strait (Figures 6A–F). The maximum negative deviation exceeds −1.0 m in the East Siberian Sea and the thick multiyear ice zone north of the Canadian Arctic Archipelago. The maximum positive deviation exceeds 1.0 m in the Greenland Sea. In summer‒autumn (Figures 6G–L), the negative sea ice thickness deviations between the ArcIOPS forecasts and the PIOMAS data are still persistent in the multiyear ice zone north of the Canadian Arctic Archipelago, whereas in other areas of the Arctic sea ice zone, the deviations are reduced greatly.
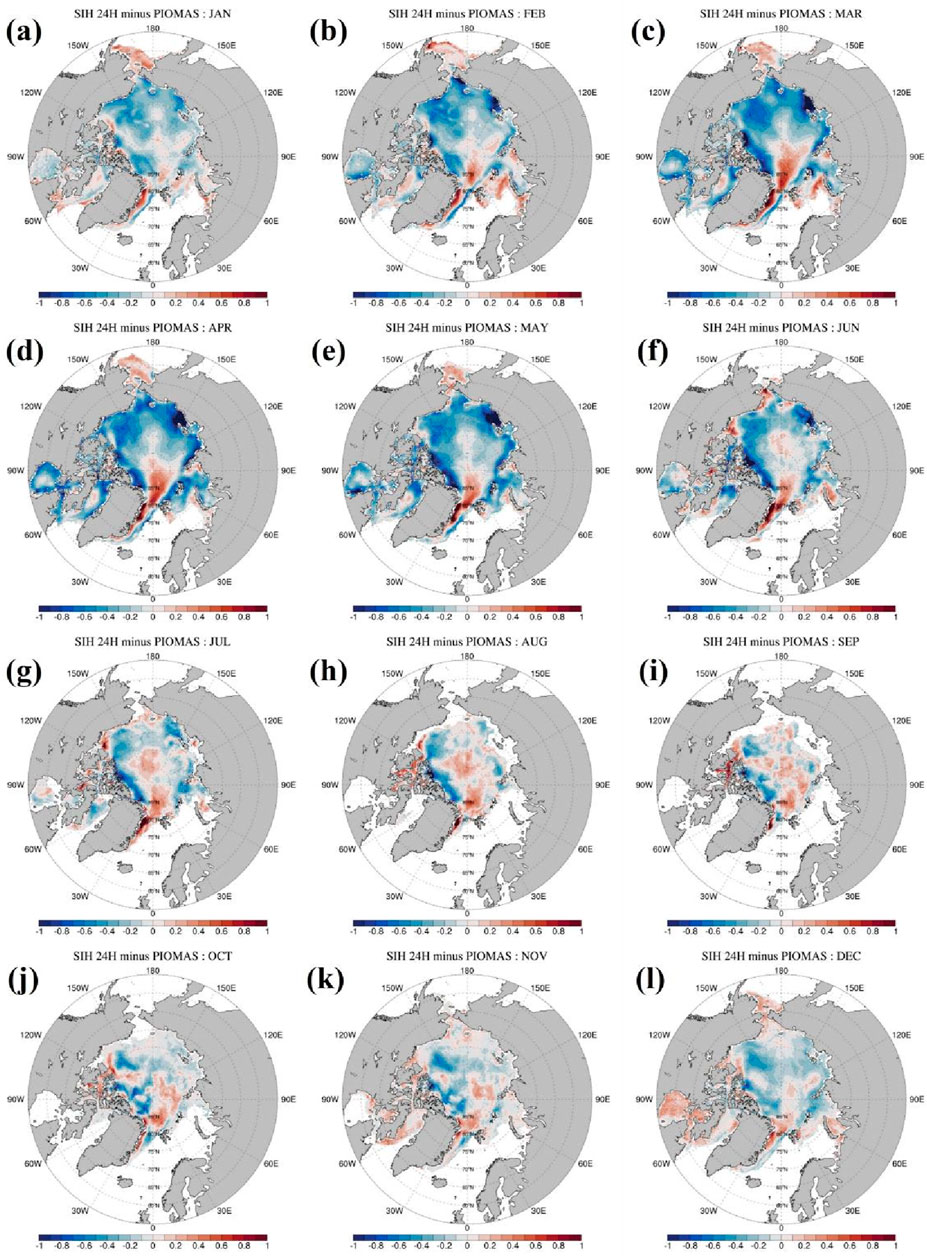
Figure 6. Monthly patterns of sea ice thickness deviation between the ArcIOPS forecasts at a lead time of 24 h and the PIOMAS data. (A–L) denote January‒December, respectively. The patterns are averaged between 2021 and 2023. The unit is m.
Comparison of sea ice thickness at the three locations between the ArcIOPS forecasts at a lead time of 24 h and the ULS data suggests that the ArcIOPS reasonably forecasts sea ice thickness evolution at the three locations in the Beaufort Sea, and small negative biases exist at the locations of BGEP_A and BGEP_D in 2021 and 2023, respectively (Figure 7).
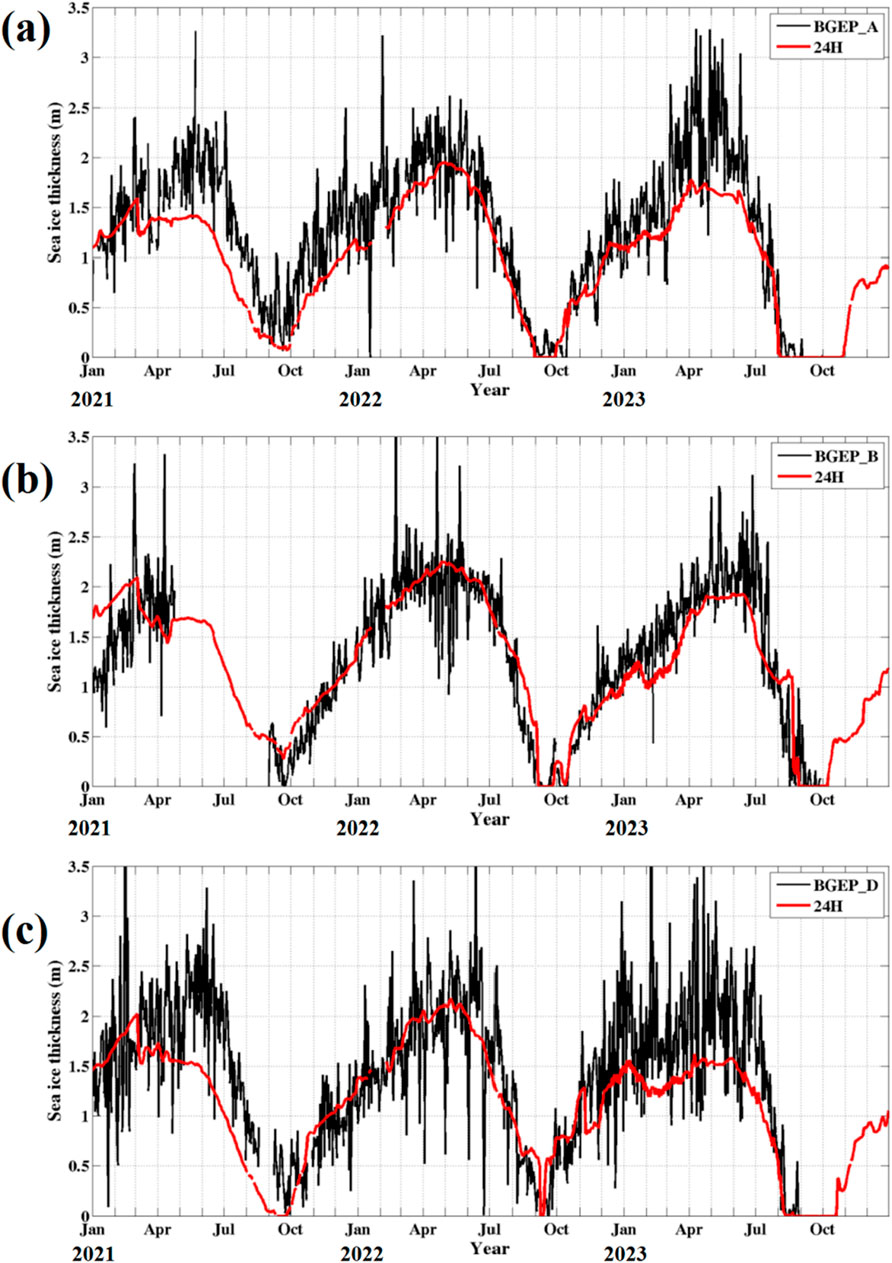
Figure 7. Time series of sea ice thickness at the mooring locations of (A) BGEP_A ULS, (B) BGEP_B ULS, and (C) BGEP_D ULS. The black and red lines denote the observations and the ArcIOPS forecasts at a lead time of 24 h, respectively.
3.3 Sea ice drift
We validate the sea ice drift speed of the ArcIOPS forecasts at different lead times against the NSIDC sea ice drift product, i.e., Polar Pathfinder Daily 25 km EASE-Grid Sea Ice Motion Vectors. Due to the strong variation in the daily evolution of the ice-zone-mean sea ice drift speed, we show the monthly evolution of the ice-zone-mean sea ice drift speed both from the ArcIOPS forecasts and the NSIDC data (Figures 8A, B).
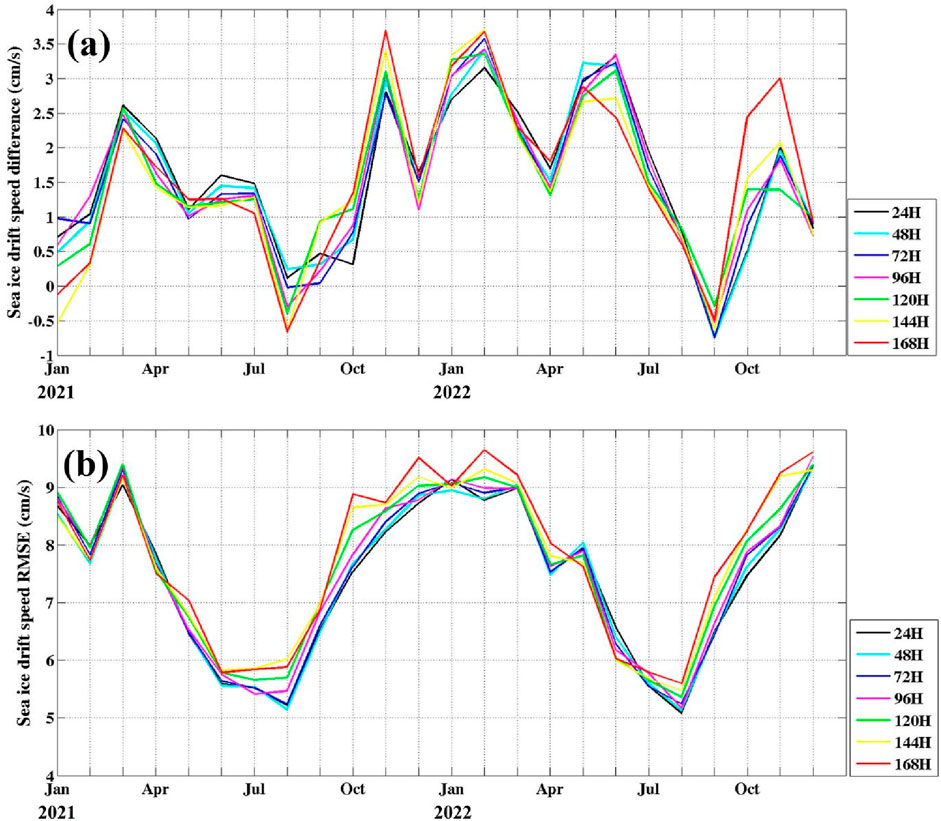
Figure 8. Time series of the (A) deviation and (B) RMSE of the ArcIOPS sea ice drift speed forecasts at different lead times with respect to the NSIDC data. The black, cyan, blue, magenta, green, yellow, and red lines denote the forecasts at lead times of 24 h, 48 h, 72 h, 96 h, 120 h, 144 h, and 168 h, respectively.
The ice-zone-mean sea ice drift deviations between the ArcIOPS forecasts and the NSIDC data suggest that the ArcIOPS forecasts produce higher sea ice drift speed than the NSIDC data, and the biases in 2022 are larger than those in 2021. The relation between the bias and forecast lead time is not straightforward. The sea ice drift deviations are lower than 4 cm/s in most of the months of 2021–2022. The sea ice drift RMSE between the ArcIOPS forecasts and the NSIDC data ranges between 5 cm/s and 10 cm/s. Furthermore, the sea ice drift RMSE shows obvious seasonality that the RMSE is larger in wintertime and smaller in summertime.
Spatially, in January‒March (Figures 9A–C), the ArcIOPS forecasts at a lead time of 24 h produce higher sea ice drift speed in the marginal ice zones of both the Pacific and Atlantic sides, such as the Bering Sea, Labrador Sea, Greenland Sea, and Barents Sea, while in other areas of the Arctic sea ice zone, the ArcIOPS forecasts generally produce lower sea ice drift speed. The maximum positive bias exceeds 10 cm/s, while the maximum negative bias reaches −5 cm/s. In April‒August (Figures 9D–H), the area with positive sea ice drift speed bias expands to the Arctic marginal seas of the Eurasian Continent, and the area with negative sea ice drift speed bias shrinks greatly. In September‒December (Figures 9I–L), negative sea ice drift bias reemerges and expands to most areas of the Arctic sea ice zone. The sea ice drift speed biases are relatively moderate in August and September.
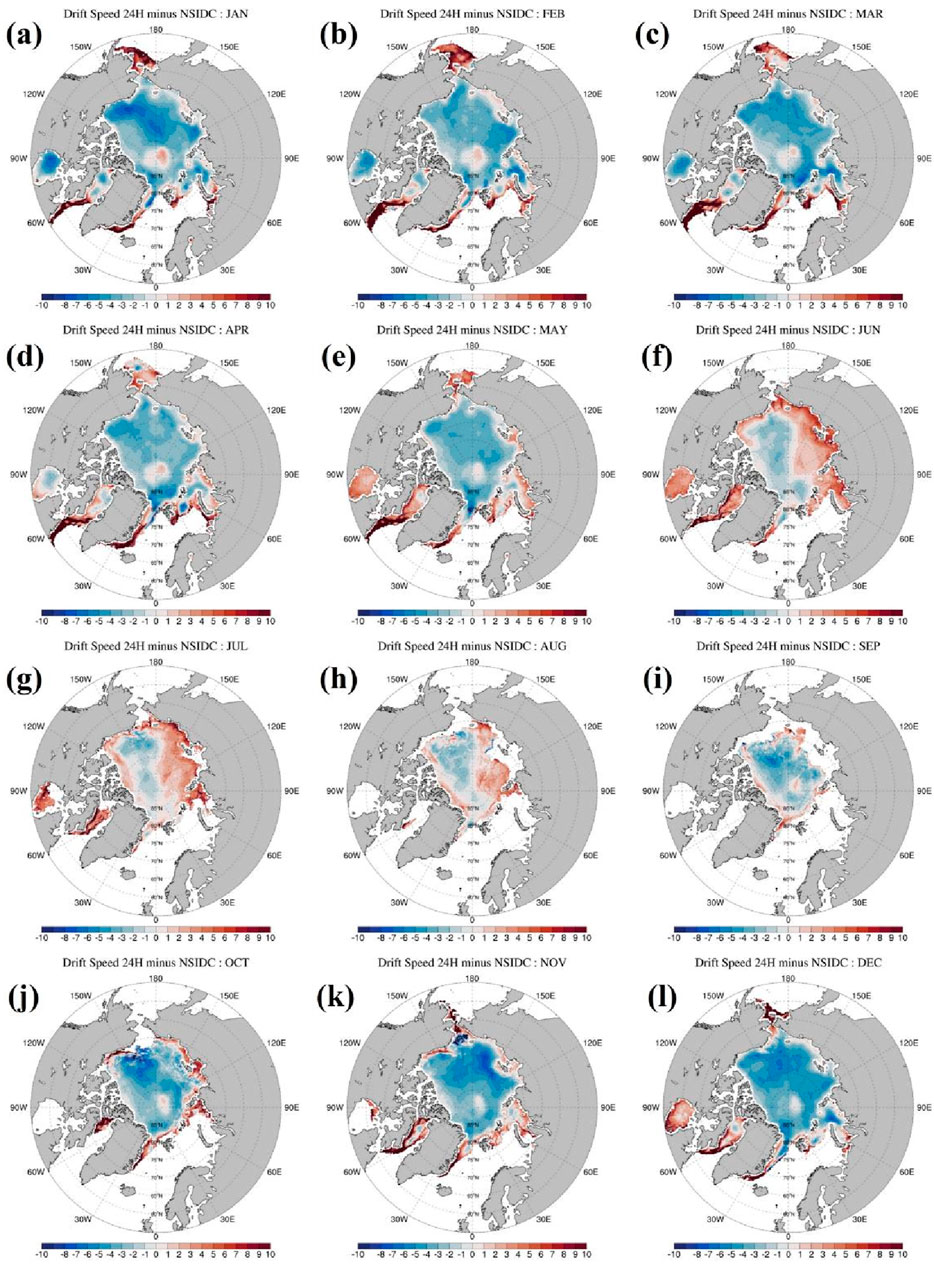
Figure 9. Monthly patterns of sea ice drift speed deviation between the ArcIOPS forecasts at a lead time of 24 h and the NSIDC data. (A–L) denote January‒December, respectively. The patterns are averaged between 2021 and 2022. The unit is cm/s.
4 Discussion and conclusion
In this paper, we evaluate the ArcIOPS sea ice forecasts during 2021–2023 against in situ sea ice thickness observations, satellite-retrieved sea ice concentration, and drift data, as well as the PIOMAS sea ice thickness reanalysis. The results show that the ArcIOPS has a reliable capacity on the Arctic sea ice forecasts for the future 7 days. Over most time of the 3 years, the sea ice concentration RMSE of the ArcIOPS forecasts ranges between 8% and 20%, and the derived IIEE is lower than 1.6 × 10⁶ km2 when validated against the HY-2B sea ice concentration data. The sea ice volume of the ArcIOPS forecasts is closer to that derived from the CS2SMOS sea ice thickness observations, and sea ice thickness comparison between the ArcIOPS forecasts and in situ ULS observations in the Beaufort Sea also proves that the sea ice thickness forecasts are credible, which sets a fundamental basis for supporting ice-breaker navigation in the Arctic thick ice zone. The sea ice drift deviations between the ArcIOPS forecasts and NSIDC data are lower than 4 cm/s in most months of 2021–2022.
The ArcIOPS sea ice concentration forecasts have some biases appearing in the marginal ice zone, especially during melt-to-freeze or freeze-to-melt transition periods. This probably originates from the fact that the ArcIOPS uses zero-layer ice/snow thermodynamics, which are known to overestimate the seasonal variations due to the lack of thermal inertia. Sea ice drift speed is jointly affected by wind force and sea ice thickness in an ice‒ocean-coupled model system (Liang et al., 2024). The positive biases in the sea ice thickness forecasts (Figure 5) likely cause the negative biases in sea ice drift speed forecasts in the high-latitude Arctic sea ice zone (Figure 9). Meanwhile, the relatively larger RMSE in the wintertime sea ice drift speed forecasts in comparison to summertime (Figure 8B) is a result of relatively larger sea ice drift speed biases in the marginal ice zone in wintertime (Figure 9). Satellite-retrieved observations, although with advantages of board spatial coverage and temporal continuity, have considerable uncertainties, especially in sea ice thickness and drift data. Admittedly, the evaluations against satellite-retrieved data presented in this study still have room to improve, both on validation metrics and data processing algorithms. Nevertheless, at the current stage, the validations against these available data sets suggest that the ArcIOPS sea ice thickness and drift forecasts are in a reasonable range.
Currently, the Arctic sea ice forecasts at the synoptic time scale operationally provided by the NMEFC of China is based on the ArcIOPS v1.1, while our operational Arctic sea ice forecasts at the seasonal time scale is implemented by a fully coupled Arctic ice‒ocean‒atmosphere modeling system (Ren et al., 2021) which has considered the complex air‒ice‒ocean interaction in the summertime marginal ice zone. In the coming decade, short-term sea ice forecasts may necessarily need to use a fully coupled Arctic ice‒ocean‒atmosphere modeling system, as the general sea ice decline and the Arctic amplification may exert a strong feedback among the air, the ice, and the ocean on the synoptic time scale. In addition, multi-variable data assimilation schemes are essential for sea ice forecasts at the synoptic time scale and sea ice predictions at the seasonal time scale as sea ice has complex features of solid and fluid, which behaves with a long memory. In future, more advanced data assimilation algorithms are also required for accurate sea ice forecasts in the Arctic Ocean.
Data availability statement
The datasets presented in this study can be found in online repositories. The names of the repository/repositories and accession number(s) can be found in the article/supplementary material.
Author contributions
XL: conceptualization, formal analysis, funding acquisition, methodology, validation, and writing–original draft. ZT: formal analysis and writing–review and editing. FZ: formal analysis and writing–review and editing. ML: formal analysis and writing–review and editing. NL: formal analysis and writing–review and editing. CL: formal analysis and writing–review and editing.
Funding
The author(s) declare that financial support was received for the research, authorship, and/or publication of this article. This work is supported by the National Natural Science Foundation of China (42276250) and the National Key R&D Program of China (2022YFF0802000).
Acknowledgments
The authors are grateful to all the reviewers for their precious comments and suggestions.
Conflict of interest
The authors declare that the research was conducted in the absence of any commercial or financial relationships that could be construed as a potential conflict of interest.
The author(s) declared that they were an editorial board member of Frontiers, at the time of submission. This had no impact on the peer review process and the final decision.
Publisher’s note
All claims expressed in this article are solely those of the authors and do not necessarily represent those of their affiliated organizations, or those of the publisher, the editors, and the reviewers. Any product that may be evaluated in this article, or claim that may be made by its manufacturer, is not guaranteed or endorsed by the publisher.
References
Cavalieri, D. J., Gloersen, P., and Campbell, W. J. (1984). Determination of sea ice parameters with the Nimbus 7 SMMR. J. Geophys. Res. 89, 5355–5369. doi:10.1029/jd089id04p05355
Chen, Z., Liu, J., Song, M., Yang, Q., and Xu, S. (2017). Impacts of assimilating satellite Sea Ice concentration and thickness on arctic Sea Ice prediction in the NCEP climate forecast system. J. Clim. 30, 8429–8446. doi:10.1175/jcli-d-17-0093.1
Comiso, J. C. (2012). Large decadal decline of the Arctic multiyear ice cover. J. Clim. 25, 1176–1193. doi:10.1175/jcli-d-11-00113.1
Doney, S. C., Large, W. G., and Bryan, F. O. (1998). Surface Ocean fluxes and water-mass transformation rates in the coupled NCAR climate system model. J. Clim. 11, 1420–1441. doi:10.1175/1520-0442(1998)011<1420:sofawm>2.0.co;2
Donlon, C. J., Robinson, I. S., Casey, K. S., Vazquez-Cuervo, J., Armstrong, E. M., Arino, O., et al. (2007). The global ocean data assimilation experiment high-resolution sea surface temperature pilot Project. B. Am. Meteorol. Soc. 88, 1197–1214. doi:10.1175/bams-88-8-1197
Goessling, H. F., Tietsche, S., Day, J. J., Hawkins, E., and Jung, T. (2016). Predictability of the Arctic sea ice edge. Geophys. Res. Lett. 43, 1642–1650. doi:10.1002/2015gl067232
Han, J., Li, W., Yang, F., Strobach, E., Zheng, W., and Sun, R. (2021). Updates in the NCEP GFS cumulus convection, vertical turbulent mixing, and surface layer physics. NCEP Tech. Off. Note 505, 18.
Hibler III, W. D. (1979). A dynamic thermodynamic sea ice model. J. Phys. Oceanogr. 9, 815–846. doi:10.1175/1520-0485(1979)009<0815:adtsim>2.0.co;2
Kwok, R. (2018). Arctic sea ice thickness, volume, and multiyear ice coverage: losses and coupled variability (1958–2018). Environ. Res. Lett. 13, 105005. doi:10.1088/1748-9326/aae3ec
Lang, A., Yang, S., and Kaas, E. (2017). Sea ice thickness and recent Arctic warming. Geophys. Res. Lett. 44, 409–418. doi:10.1002/2016gl071274
Large, W. G., Mcwilliams, J. C., and Doney, S. C. (1994). Oceanic vertical mixing: a review and a model with a nonlocal boundary layer parameterization. Rev. Geophys. 32, 363–403. doi:10.1029/94rg01872
Laxon, S. W., Giles, K. A., Ridout, A. L., Wingham, D. J., Willatt, R., Cullen, R., et al. (2013). Cryosat-2 estimates of Arctic sea ice thickness and volume. Geophys. Res. Lett. 40, 732–737. doi:10.1002/grl.50193
Liang, X., Bi, H., Liu, C., Li, X., Wang, D., Zhao, F., et al. (2024). The linkage between wintertime sea ice drift and atmospheric circulation in an Arctic ice-ocean coupled simulation. Ocean. Modell. 189, 102362. doi:10.1016/j.ocemod.2024.102362
Liang, X., and Losch, M. (2018). On the effects of increased vertical mixing on the Arctic Ocean and sea ice. J. Geophys. Res. Oceans 123, 9266–9282. doi:10.1029/2018jc014303
Liang, X., Losch, M., Nerger, L., Mu, L., Yang, Q., and Liu, C. (2019). Using sea surface temperature observations to constrain upper ocean properties in an Arctic sea ice‒ocean data assimilation system. J. Geophys. Res. Oceans 124, 4727–4743. doi:10.1029/2019jc015073
Liang, X., Zhao, F., Li, C., Zhang, L., and Li, B. (2020). Evaluation of ArcIOPS sea ice forecasting products during the ninth CHINARE-Arctic in summer 2018. Adv. Polar Sci. 31 (1), 14–25.
Losch, M., Menemenlis, D., Campin, J. M., Heimbach, P., and Hill, C. (2010). On the formulation of sea-ice models. Part 1: effects of different solver implementations and parameterizations. Ocean. Model. 33, 129–144. doi:10.1016/j.ocemod.2009.12.008
Marshall, J., Adcroft, A., Hill, C., Perelman, L., and Heisey, C. (1997). A finite-volume, incompressible Navier Stokes model for studies of the ocean on parallel computers. J. Geophys. Res. 102 (C3), 5753–5766. doi:10.1029/96jc02775
Menemenlis, D., Campin, J. M., Heimbach, P., Hill, C., Lee, T., Nguyen, A., et al. (2008). ECCO2: high resolution global ocean and sea ice data synthesis. Mercat. Ocean. Quart. Newsl. 31, 13–21.
Mu, L., Liang, X., Yang, Q., Liu, J., and Zheng, F. (2019). Arctic Ice Ocean Prediction System: evaluating sea-ice forecasts during Xuelong's first trans-Arctic Passage in summer 2017. J. Glaciol. 65 (253), 813–821. doi:10.1017/jog.2019.55
Mu, L., Yang, Q., Losch, M., Losa, S. N., Ricker, R., Nerger, L., et al. (2018). Improving sea ice thickness estimates by assimilating CryoSat-2 and SMOS sea ice thickness data simultaneously. Q. J. Roy. Meteor. Soc. 144 (711), 529–538. doi:10.1002/qj.3225
Nerger, L., and Hiller, W. (2013). Software for ensemble-based data assimilation systems-implementation strategies and scalability. Comput. Geosci. 55, 110–118. doi:10.1016/j.cageo.2012.03.026
Nerger, L., Janji, T., Schröter, J., and Hiller, W. (2012). A unification of ensemble square root Kalman filters. Mon. Weather. Rev. 140 (7), 2335–2345. doi:10.1175/mwr-d-11-00102.1
Nguyen, A. T., Menemenlis, D., and Kwok, R. (2011). Arctic ice-ocean simulation with optimized model parameters: approach and assessment. J. Geophys. Res. 116, C04025. doi:10.1029/2010jc006573
Proshutinsky, A., Yang, J., Krishfield, R., Gerdes, R., Karcher, M., Kauker, F., et al. (2005). Arctic Ocean study: synthesis of model results and observations. EOS 86 (40), 368–371. doi:10.1029/2005eo400003
Rantanen, M., Karpechko, A. Y., Lipponen, A., Nordling, K., Hyvärinen, O., Ruosteenoja, K., et al. (2022). The Arctic has warmed nearly four times faster than the globe since 1979. Nat. Commun. Earth. Environ. 3, 168. doi:10.1038/s43247-022-00498-3
Ren, S., Liang, X., Sun, Q., Yu, H., Tremblay, L. B., Lin, B., et al. (2021). A fully coupled Arctic sea-ice–ocean–atmosphere model (ArcIOAM v1.0) based on C-Coupler2: model description and preliminary results. Geosci. Model. Dev. 14, 1101–1124. doi:10.5194/gmd-14-1101-2021
Ricker, R., Hendricks, S., Kaleschke, L., Tian-Kunze, X., King, J., and Haas, C. (2017). A weekly Arctic sea-ice thickness data record from merged CryoSat-2 and SMOS satellite data. Cryosphere 11, 1607–1623. doi:10.5194/tc-11-1607-2017
Semtner, A. J. (1976). A model for the thermodynamic growth of sea ice in numerical investigations of climate. J. Phys. Oceanogr. 6, 379–389. doi:10.1175/1520-0485(1976)006<0379:amfttg>2.0.co;2
Serreze, M. C., and Barry, R. G. (2011). Processes and impacts of Arctic amplification: a research synthesis. Glob. Planet. Change 77, 85–96. doi:10.1016/j.gloplacha.2011.03.004
Spreen, G., Kaleschke, L., and Heygster, G. (2008). Sea ice remote sensing using AMSR-E 89 GHz channels. J. Geophys. Res. 113, C02S03. doi:10.1029/2005jc003384
Tian-Kunze, X., Kaleschke, L., Maaβ, N., Mäkynen, M., Serra, N., Drusch, M., et al. (2014). SMOS-derived thin sea ice thickness: algorithm baseline, product specifications and initial verification. Cryosphere 8 (3), 997–1018. doi:10.5194/tc-8-997-2014
Tschudi, M., Meier, W. N., Stewart, J. S., Fowler, C., and Maslanik, J. (2019). Polar pathfinder daily 25Km EASE-grid Sea Ice motion vectors. Boulder, Colorado USA: NASA National Snow and Ice Data Center Distributed Active Archive Center. Version 4 [Data Set] (Accessed December 13, 2019).
Wu, S., Shi, L., Zou, B., Zeng, T., Dong, Z., and Lu, D. (2023). Daily Sea ice concentration product over polar regions based on brightness temperature data from the HY-2B SMR sensor. Remote Sens. 15, 1692. doi:10.3390/rs15061692
Keywords: ArcIOPS, sea ice, forecasts, evaluation, assessment
Citation: Liang X, Tian Z, Zhao F, Li M, Liu N and Li C (2024) Evaluation of the ArcIOPS sea ice forecasts during 2021–2023. Front. Earth Sci. 12:1477626. doi: 10.3389/feart.2024.1477626
Received: 08 August 2024; Accepted: 30 September 2024;
Published: 16 October 2024.
Edited by:
Cheng Sun, Beijing Normal University, ChinaReviewed by:
Qun Li, Polar Research Institute of China, ChinaLi Zhang, Ocean University of China, China
Copyright © 2024 Liang, Tian, Zhao, Li, Liu and Li. This is an open-access article distributed under the terms of the Creative Commons Attribution License (CC BY). The use, distribution or reproduction in other forums is permitted, provided the original author(s) and the copyright owner(s) are credited and that the original publication in this journal is cited, in accordance with accepted academic practice. No use, distribution or reproduction is permitted which does not comply with these terms.
*Correspondence: Xi Liang, bGlhbmd4QG5tZWZjLmNu
 Xi Liang
 Zhongxiang Tian
 Na Liu