 Xianlin Liu1,2
 Xilin Lü
 Youdong Chen
- 1Department of Geotechnical Engineering, Tongji University, Shanghai, China
- 2Guangxi Communications Design Group Co., Ltd., Nanning, China
- 3College of Earth and Planetary Sciences, Chengdu University of Technology, Chengdu, China
High and steep sandstone slopes along highway line are at high risk of disasters such as landslides, cracking of support structures, and so on. The monitoring, early warning, and emergency response of such slope disaster face enormous challenges, especially during the rainy season. In this paper, intelligent monitoring, early warning and forecasting system were carried out for the high steep sandstone slope with a transmission line tower at the slope crest along the highway under construction in Guangxi, China. The automatic monitoring data, emergency rescue program and rescue effect were analyzed, and emergency rescue measures for high steep slope protection were taken. The research results show that timely access to disaster warning information can effectively support the analysis of disaster causes and the evaluation of disposal programs. Deep-hole monitoring of deformation characteristics can determine the stable state of slopes, and the tangent angle warning criterion can be used for early warning and prediction of high steep slope landslides. By analyzing the location of the sliding surface and taking timely emergency disposal measures such as layered counterpressure method and micropipes, the landslide activities can be effectively controlled to prevent further acceleration of slope collapse. This study can provide an important reference for the monitoring, early warning, forecasting and emergency rescue of sandstone slopes along highways under construction.
1 Introduction
With the increased traffic density and infrastructures constructed in mountainous areas of southwest China, slopes are gradually common along the expressway and high-speed railway (Li et al., 2020). In the meanwhile, Some rock masses such as siltstone shows obvious water sensitivity and disintegration due to disparity in material compositions and pore structures (Vivoda Prodan et al., 2017). Thus, it can increase the susceptibility of sliding and collapsing of slopes, resulting in cracking and failure of supporting structures (Taalab et al., 2018). The impact of rainfall on these processes has been critically analyzed, showing how different rainfall conditions exacerbate slope instability (Li et al., 2022; Li et al., 2023). In recent years, the engineering failures and disasters have a significant increase in quantitative terms and pose a serious threat to the safety of construction personnel and equipment (Wang et al., 2015; Yang et al., 2022). Research into the dynamic response characteristics of these slopes under seismic influences also highlights an increased risk in regions prone to earthquakes (Shi et al., 2024).
The effective monitoring and early warning of the slope-related disasters are important means to reduce the loss of life and property caused by landslides (Gariano and Guzzetti, 2016). Currently, traditional monitoring technology is relatively mature and has achieved good results in practical engineering applications. However, it did not get wide-spread popularity due to its intrinsic disadvantages, such as large field workload, poor monitoring timeliness and small monitoring area (Yang et al., 2020). With the rapid development of optoelectronics, big data and communication technology, the research and development about monitoring equipment and systems for geotechnical and geological disasters have been greatly promoted (Xu, 2020a; Zhu et al., 2024). In terms of the monitoring means, the advanced detection devices and means have been developed, such as 3S technology integrating Global Positioning System (GPS), Geographic Information System (GIS) and Remote Sensing (RS) (Yong et al., 2022). Besides, Time Domain Reflection (TDR) technology, 3D Laser Scanning technology (Xie et al., 2013), Interferometric Synthetic Aperture Radar (InSAR) technology (Xu, 2020b), Close Range Photogrammetry (Scaioni et al., 2015), Distributed Fiber Optic Strain Sensor (DFOSS) (Wang and Shi, 2010; Zhang et al., 2018), Interface Newtonian Force (INF) and Shape Acceleration Array (SAA) technology are also applied to monitor deformation popularly (Uhlemann et al., 2016). The innovative use of UAV nap-of-the-object photogrammetry has further enhanced our ability to identify potential rockfalls (Wang et al., 2022; Yan et al., 2023). Furthermore, sophisticated models for assessing the risk of unstable rock masses have been developed to improve safety measures on such slopes (Tao et al., 2021). The multi-level and multi-angle monitoring data can be achieved through these techniques from point to surface, from slope surface to interior of rock and soil body and from macrocosm to microcosmic based on different spatial dimensions of monitoring through “space-sky-earth-depth,” significantly promoting the intelligence and information about the potential disasters, and improving the efficiency and reliability of the potential disasters monitoring (Dai et al., 2020).
The monitoring and early warning means and systems are important tools for identifying and forecasting potential geological disasters (Xu, 2020a; Dai et al., 2020). Since the landslide forecasting model was established based on soil creep characteristics, the study on early warning models for landslide has gained significant attention from many researchers (Guzzetti et al., 2020). There are many early warning models and discrimination methods put forward for applications in forecasting landslide (Xu, 2020b; Liu, 2021; Qin et al., 2021). In addition, quite a few forecasting models are established based on the displacement or deformation data. For instance, Xu et al. (2008) optimized the “Saito model” and further divided the accelerated deformation stage into initial acceleration stage, middle acceleration stage and critical-sliding stage, pointing out that the time-space evolution of landslide in the model should be comprehensively considered in landslide early warning and forecasting (Xu et al., 2008; Xu, 2020a; Xu et al., 2024). Moreover, a series of early warning methods selected the tangent angle as the landslide criterion are also proposed. Chen et al. (2015) proposed a method for analyzing the evolution law and predicting the early warning time of landslide based on the kinetic energy-time and kinetic energy change rate-time relation curves. In-depth analysis of deformation characteristics in high-steep slopes provides crucial insights into the interaction between geotechnical structures and bridge substructures, which is fundamental in designing more resilient infrastructural elements (Zhang et al., 2022).
In this paper, automatic monitoring, early warning, and forecasting are carried out on typical high-steep slopes along the highways under construction. The engineering measures taken during the slope rescue process and their effects to the causes of instability, early warning and forecasting methods are analyzed and discussed. The engineering rescue measures for the high-steep sandstone slopes have important theoretical and practical significance for guiding the design and construction, and also for decision-making and implementing emergency disposal measures.
2 Engineering conditions and monitoring arrangement
2.1 Geological conditions
The Naliang slope along the Tian’e-Beihai expressway under construction from Bama town to Pingguo town were considered as the study area. The tunnel area is located within Dahua Yao Autonomous County, on the northern edge of the South Asian subtropical monsoon climate zone, characterized by mild climate and rain heat occurring in the same season. The average annual temperature is between 18.2°C and 21.7°C, with annual rainfall ranging from 1,249 to 1,673 mm, making it suitable for outdoor work most of the year. The tunnel area has an erosive low mountain landscape with significant topographical undulations. The proposed tunnel will traverse the same mountain body, with surface elevations ranging approximately from 219.33 to 276.50m, a relative height difference of about 57 m, and the maximum burial depth of the tunnel is about 57.9 m. The natural slope angles of the entrance and exit sections of the mountain range from 20° to 50°. The Quaternary cover layer in the tunnel area is locally thick, with well-developed surface vegetation mainly consisting of shrubs, eucalyptus, pine, etc.
Based on drilling and engineering geological surveys, the strata are primarily composed of Quaternary colluvial layers (Qel+dl) and Middle Triassic BaiFeng Group (T2b), detailed as follows.
(1) Silty Clay: Hard plastic; brownish-yellow, uniform soil quality, mainly silty particles, smooth cut surface, core shows columnar soil structure, with a large amount of plant roots between 0 and 0.4 m, representing the hillside topsoil, drilling reveals a thickness of 3.0 m.
(2) Gravel: Semi-dense to dense; reddish-brown, slightly moist, mainly composed of highly weathered sandstone and muddy sandstone, with particle sizes of 2–8 cm, angular to sub-angular, about 60% content, filled with sticky soil and gravel. Drilling reveals a thickness of 1.6–4.0 m.
(3) Highly Weathered Sandstone: Grayish-yellow, sandy structure, thin to moderately thick layering, developed joint fissures, iron-manganese staining visible on fracture surfaces, approximately 45°–50° orientation, interlayered with thin sandy shale layers, slightly soft and brittle rock, generally 10–40 cm thick, unevenly distributed with no regular pattern. Core integrity is poor, very fragmented, core pieces are blocky, fragmentary, and partially short-columnar, drilling reveals a thickness of 13.3–15.0 m.
(4) Moderately Weathered Sandstone: Dark gray, sand-mud structure, thin to moderately thick layering, interlayered with thin sandy shale layers, rock layer inclination about 65°–70°, with developed joint fissures in the 14.9–20.9 m segment, commonly filled with iron, steep inclination, core mainly columnar, node lengths 7–32 cm, secondary in block and pie shapes, harder rock quality, RQD = 48. Only revealed by drilling SS438-2, thickness is 15.1 m.
According to the regional geology and on-site geological survey, there is a regional fault near the river gorge about 800 m northwest of the tunnel site intersecting with the line, with a strike of about 300–340°. The fault has been stabilized at present, and the impact of the fault on the tunnel site area is relatively small. The tunnel site is mainly a monoclinic structure with extremely developed joints and fissures, which has a greater impact on tunnel excavation. The measured rock formation at the tunnel site is 332°/SW∠51°.
2.2 Supporting scheme of the slope
The engineering section changed from the original Naliang tunnel to an open-cut slope expansion scheme, with a high slope of about 75 m formed on the left side of the expressway. There were six-stage supporting schemes used for the slope. The first stage was a single row of anti-slide piles with a diameter of 2 m, the second stage was anchor-pile support with lattice beams at a slope rate of 1:0.75, and the third to sixth stages were anchor-pile support with lattice beams at a slope rate of 1:1 (Figure 1).
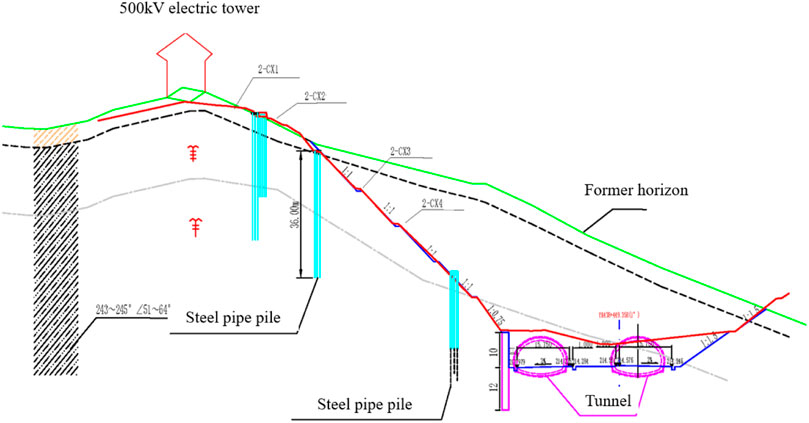
Figure 1. Deformation result before the Naliang landslide.
2.3 Monitoring arrangement
The displacement, deformation, stress, environmental impact, and other factors for the Naliang slope were monitored in real-time with various monitoring methods. The monitoring data can guide the on-site construction and provide an accurate basis for the treatment design, thus realizing information utilization and dynamic design. In terms of the development of the slope and the need for on-site monitoring, different monitoring arrangement and content are carried out into two stages. The first stage is the monitoring of Nanliang slope before instability. The monitoring type is displacement monitoring, including surface displacement, deep displacement, settlement of tower foundation, horizontal displacement of tower foundation and tower tilt. The monitoring methods used include GNSS displacement monitoring, micro-variation radar, in-place inclinometer, hydrostatic level and total station. The second stage is the monitoring of Nanliang slope after rescuing and applying counterpressure. The monitoring type is displacement monitoring and environmental monitoring, including surface displacement, deep displacement and rainfall. The monitoring methods used include total station and in-place inclinometer. The monitoring location layout of these two stages can be obtained in Figure 1.
During the construction stage (first stage), different targeted points were arranged for monitoring the artificial surface displacement, deep displacement and axial force of anchor cable respectively. One settlement observation point was arranged at the bottom of the tower. Based on the original monitoring points, including a deep displacement monitoring point, 16 artificial surface displacement monitoring points within a total station and two anchor pile stress measuring points, an environmental meteorological monitoring station was added.
3 Development of slope deformation and sliding
3.1 Initiation of sliding
The excavation and construction of Naliang slope started from March 2021. The monitoring for the slope was carried out simultaneously. On April 3, the deep displacement inclinometer borehole, namely, CX2-1 showed an obvious turning point at the depth of 18 m. From April 3 to 5, the differential settlement of the hydrostatic leveling measuring point on the top of the slope for the 620# tower base was 1.91 mm and 0.29 mm, respectively. The tower showed a tilting tendency towards the main subgrade line. On April 26, the deformation rate of the deep displacement inclinometer borehole, namely, CX2-1 reached 2.3 mm/d at the position of 15 m, with an accumulated displacement value of 5.5 mm. The peak speed was 6.5 mm/d at the depth of 5 m, with a peak accumulated displacement of 15.8 mm. The horizontal displacement rate and the vertical displacement rate were 3.14–8.84 mm/d and −0.89–6.11 mm/d, respectively. Besides, the horizontal and vertical accumulated displacements were 8.17–23.17 mm and −2.84–15.96 mm/d, respectively. Then, the slope entered the state of moderately accelerated deformation. Subsequently, the supporting scheme was adjusted, and the reinforcement measures of arranging three rows of steel piles on the third stage platform and three rows of anchor piles on the sixth stage platform were adopted (Figure 1).
3.2 Sliding development and rescue
On 14 June 2021, the deformation rates of the deep displacement inclinometer boreholes, namely, 2-CX1, 2-CX2, and 2-CX3 in the main monitoring section of the slope increased to 12.84 mm/d, 14.80 mm/d, and 19.60 mm/d respectively. After that, the slope entered the high-speed deformation stage, and the tangent angle of the deep accumulated displacement-time curve reached 83°, triggering the critical-sliding. The maximum accumulated deformation of the slope reached 51 mm from 21:00 on June 17 to 15:00 on June 18. As to the maximum deformation period, the converted daily rate was 144 mm/d. The slope continued deformation until 15:50 on June 19, and local failure occurred on the slope surface during the first to second grade. The damage and crest cracks are shown in Figure 2 and Figure 3.
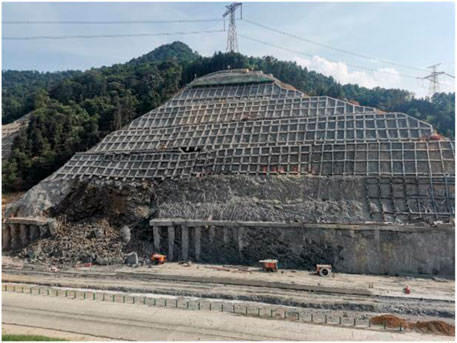
Figure 2. Local engineering failure in the field.
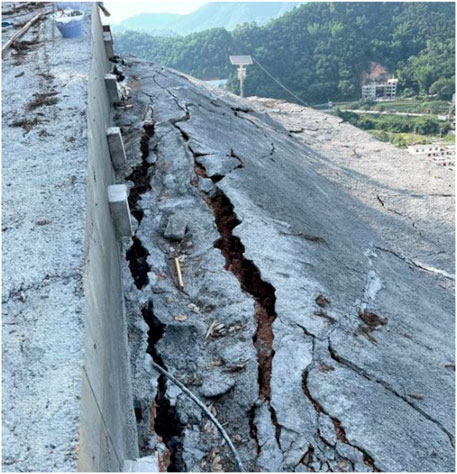
Figure 3. Crest cracks appearing in the slope failure process field.
After the critical-sliding triggered, counter pressure was applied to the toe of the slope. The counter pressure was applied on the first to third stage platforms with a height of 37 m. In addition, three rows of anchor piles were set on the slope crest for reinforcement and matched with the concrete anchorage and tensioned steel cables to confine the deformation of the pile top and power tower seen from Figure 4. As of June 26, after the first-stage rescue construction, the development trend of the horizontal displacement rate of surface monitoring points and that of deep horizontal displacement showed a downward convergence trend. The axial force of the slope anchor cable was maintained within the allowable range.
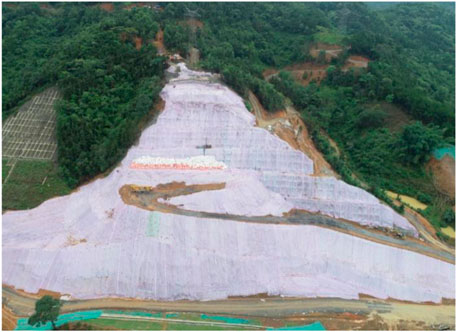
Figure 4. Rescue construction for the Naliang slope.
3.3 Tangent angle theory
In general, the relationship between the slope deformation curve and the tangent angle over time, as shown in Figure 5, can be divided into three stages. The first stage is the initial deformation stage, where the slope is in a decelerating deformation state, the deformation rate gradually decreases, and the displacement gradually increases. The displacement-time curve flattens, which is reflected in the geometry of the curve where the tangent angle increases from small to large. The second stage is the steady-state stage, where the deformation rate tends to a constant value. The displacement-time curve is approximately linear, with the tangent angle and rate being nearly constant, indicating a constant-rate deformation state. The third stage is the accelerated deformation stage, where the deformation rate gradually increases, and the displacement-time curve becomes steeper. Thus, the curve reflects an accelerated deformation state, and the tangent angle increases with the rate. It can be observed that the increase or decrease in the tangent angle of the displacement-time curve can reflect changes in the deformation rate. If the tangent angle continuously increases, it indicates that the deformation rate is also continuously increasing, meaning the deformation is in the accelerated stage. Conversely, if the tangent angle decreases, it indicates a decelerating deformation stage. If the tangent angle remains constant, it means the deformation rate remains unchanged, indicating a constant-rate deformation state. Based on this characteristic, the deformation state of the slope can be determined.
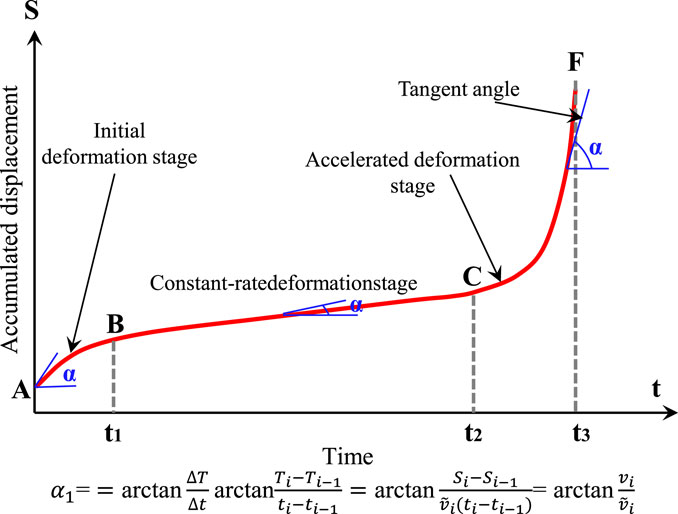
Figure 5. Different deformation stage in terms of tangent angle theory.
4 Early warning and rescue measure
4.1 Analysis of monitoring data
4.1.1 Analysis of the deep displacement monitoring data
From June 9 to 18, 2021, within 10 days before the rescue for the collapse, the cumulative displacement-rate curves of each deep inclinometer borehole generally developed at a certain slope with time. On June 14, the deformation rate of each borehole increased to 12.84–19.60 mm/d, and the slope was in a state of high-speed deformation, triggering the first red critical-sliding alarm. The average displacement rate at the peak depth during this period was 5.08–6.20 mm/d, with a cumulative displacement of 45.72–55.81 mm in this stage. The maximum rate reached 19.90–30.26 mm/d, with the deformation developing till June 18. On June 18, the peak displacement accounted for 37%–54% of the cumulative displacement in stages. The deep displacement of the slope was in the critical-sliding acceleration stage (Table 1). Sliding surface depths and peak depths mentioned in the text are relative to the surface after excavation as a reference.
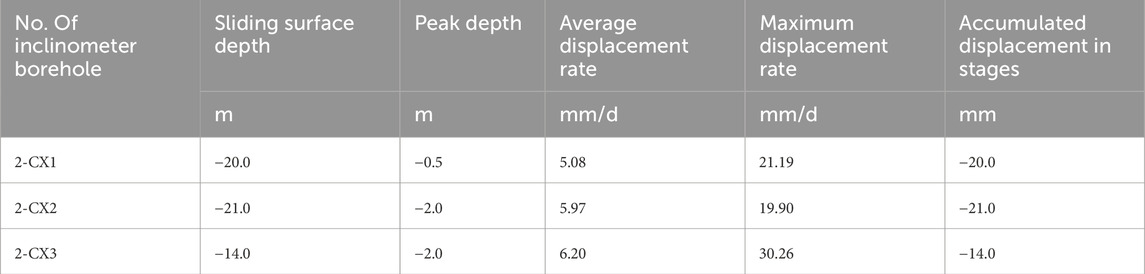
Table 1. Statistical table of deep displacement data from June 9–18, 2021.
The impact period of the failure was from June 19, 2021, on which local failure occurred during the first to second-grade slope surface at the small mileage end of the slope. On June 21, 2021, the rescue construction began. Within 3 days, the average displacement rate of the peak depth was 18.27–60.13 mm/d, and the cumulative displacement in different stages was 164.46–541.20 mm. The displacement rate reached the maximum value of 102.24–440.03 mm/d on June 19 on which the slope collapsed, and the displacement on that day accounted for 62.2%–81.3% of the cumulative displacement in this stage (Table 2). The cumulative displacement curve of each borehole for the slope increased sharply, the tangent angle corresponding to different points were more than 80°, and the slope was in the sliding-failure stage. The rule of “large front, small back” in the previous period was amplified by the displacement rate and cumulative displacement of each inclinometer borehole. The ratio of the displacement rate to cumulative displacement from 2-CX3 to 2-CX1 at the top of the slope was about 3.3:1.6:1. From 2-CX3 to 2-CX2 and then to 2-CX1, the slope showed an obvious staged pattern, confirming that the failure of the slope belongs to a traction landslide (Table 2).
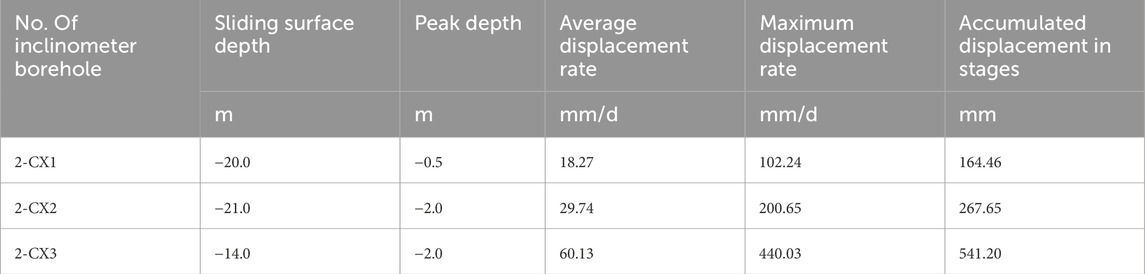
Table 2. Statistical table of deep displacement data from June 19–21, 2021.
From June 22 to 2 July 2021, it was the construction period for the failure rescue. The average displacement rate at the peak depth of each inclinometer borehole during this period was 4.84–15.00 mm/d, 25%–28% of that in the previous sliding destruction period. The maximum rate was 21.06–30.03 mm/d, which decreased to 7%–21% of that in the sliding destruction period. The cumulative displacement during the 10 days was 48.41–149.98 mm, which decreased to 28%–31% of the cumulative displacement during the previous 3-day sliding destruction period. All monitoring data showed that the rate of deep displacement during this period was significantly lower than that in the previous periods. After the rescue construction began on June 21, the cumulative displacement-time curve rapidly transformed from the approximate vertical development in the previous period to the small-angle development. The displacement rate-time curve suddenly dropped from the peak point of the previous stage to the level before the slope collapsed and decreased continuously with time. It was shown that the rescue construction measures with counter pressure at the slope bottom and anchor piles under the power tower (on the top of the slope) had significant prevention effects on the deep displacement of the slope. With the increase of the completion degree, the anchor pile structure gradually restrained the sliding destruction trend. With the increase of the counterpressure height, the counterpressure body resisted the extrusion failure of the slope mass at the shear outlet (Table 3).

Table 3. Statistical table of deep displacement data from June 22 to 2 July, 2021.
The observation period for the prevention of the slope was from July 3 to 13 August 2021. On July 2, the slope bottom was backfilled and counter-pressured to the third-stage platform at the height of 37 m. By August 13, the 620 # high-voltage transmission line tower on the top of the slope was successfully removed. The high-risk hidden dangers were eliminated, indicating that the rescue engineering for Naliang slope was completed successfully. The average displacement rate at the peak depth of each borehole during this period was 0.49–2.86 mm/d, which was 10%–33% of that in the previous construction period. The maximum rate was 6.33–11.65 mm/d, which was 29%–55% of that in the previous periods. After the completion of prevention construction, the deep displacement rate was further reduced. The accumulated displacement was 20.11–117.07 mm lasted about 40 days, with the low-speed deformation maintained. The cumulative displacement curve and displacement rate curve during this period presented approximately horizontal development tendency. At the end of July, a slight reaction occurred to the deep slope displacement caused by rainfall and the curve rose slightly. Combined with the rainfall monitoring data, the total rainfall did not reach 5 mm for more than half a month before heavy rainfall occurred at the end of July. A large loose deposit remained on the slope surface after the slope collapsed, and smaller displacement of the unstable soil layers occurred due to the infiltration of a large amount of rainfall. The emergency rescue measures with counter pressure on the bottom of the slope and anchor piles under the power tower on the top were treatment measures, which were not designed as permanent prevention means. Therefore, during this period, the deep displacement of the slope fell to the state of low-speed deformation, but it did not converge to zero completely (Table 4).
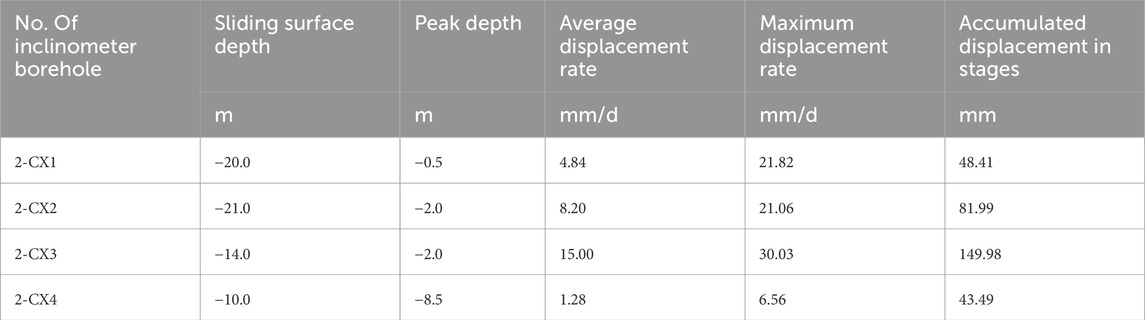
Table 4. Statistical table of deep displacement data from July 3 to August 13, 2021.
According to the monitoring data of each deep displacement inclinometer borehole, the cumulative displacement-depth curves (Figure 6; Figure 7) were drawn. Then, the analysis of the deep inclinometer displacement curve of the main monitoring section was obtained (Figure 8). It can effectively guide the rescue construction by accurately inferring the depth and change trend of the sliding surface.
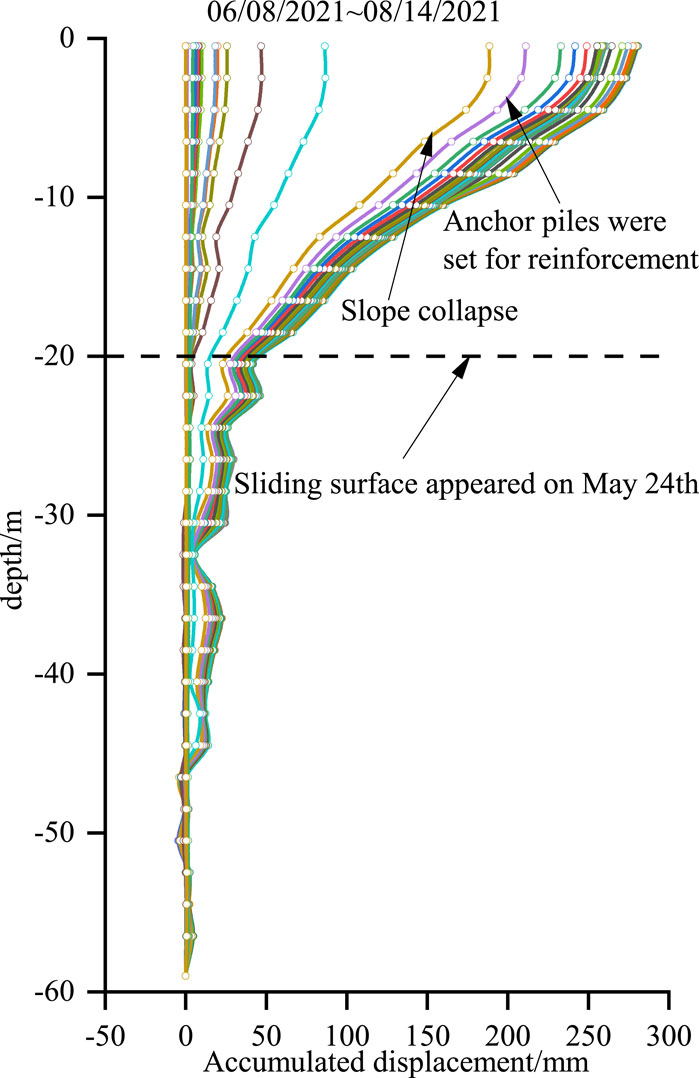
Figure 6. The variation law of deformation with depth at 2-CX1.
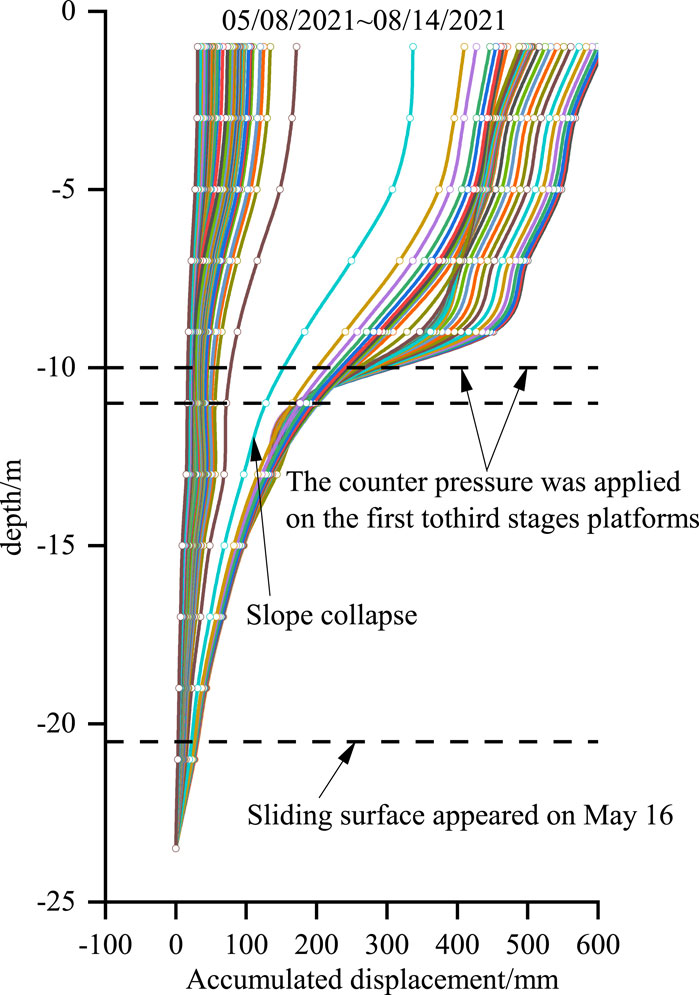
Figure 7. The variation law of deformation with depth at 2-CX2.
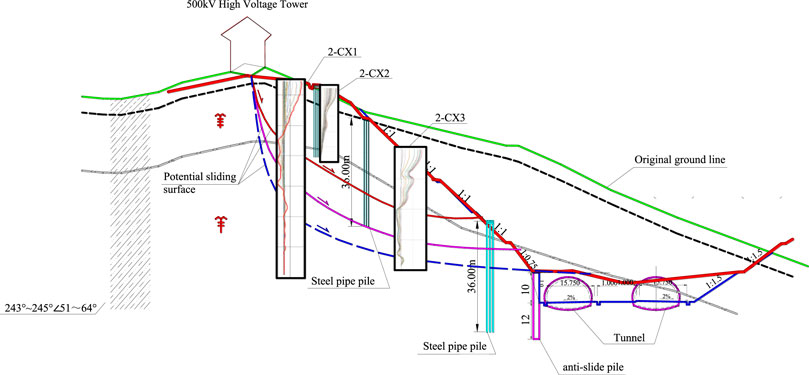
Figure 8. Analysis diagram of the inclinometer displacement curve for monitoring the deep layer of the main section.
4.1.2 Analyzing monitoring data of surface displacement
The surface displacement was mainly monitored by GNSS. Meanwhile, the surface displacement and displacement change rate distribution were obtained with microvariation monitoring. During the rescue period, artificial surface displacement monitoring points were added. A total of a datum point and six monitoring points were set up before and after the construction and rescue period, and 17 artificial surface displacement monitoring points were added from 28 June 2021. The surface displacement monitoring was carried out to measure horizontal and vertical displacement, respectively.
From June 9 to 18 June 2021 (during the period before the failure occurred), the horizontal displacement rate of the measuring points, namely, 4-GNSS1 was relatively small (1.85 mm/d), while that of other measuring points were relatively large (6.19–22.48 mm/d). The cumulative displacement in stages was 55.74–89.92 mm, reaching the high-speed deformation state. The average vertical displacement rate of each measuring point was less than −2.00 mm/d, indicating that the slope surface was dominated by the horizontal displacement. The cumulative displacement curve of each measuring point rose significantly in the later period, which was consistent with the deep displacement. The surface displacement of the slope also entered the critical-sliding acceleration stage. In addition, the average and maximum rates of 1-GNSS2 were about 2–3 times than that of other measuring points. According to the distribution location of measuring points, the area near the small mileage end of the third stage platform had shown obvious potential failure signs before the slope collapsed.
From June 19 to 21 June 2021, except for the 4-GNSS1, the horizontal displacement rate of the other monitoring points increased rapidly to the super-high values of 47.22–681.56 mm/d, which was 763%–3,032% of that in the previous monitoring period. Within 3 days, the accumulated displacement in the horizontal stage was 141.65–2044.69 mm, showing that the displacement in the horizontal direction was still much greater than that in the vertical direction. The surface displacement took precedence over the deep displacement in the case of the collapse of the shallow slope suddenly. The horizontal and vertical cumulative displacement curves suddenly rose and fell from June 19, with the corresponding tangent angle greater than 80°. Thus, the surface displacement of the slope was in the sliding failure stage. In addition, the displacement rate of 1-GNSS2 and 2-GNSS3 were far greater than those of the other measuring points, i.e., the deformation from the small mileage end to the middle area of the third-level platform was the most serious, which was consistent with the case in the local collapse area. Combined with the location of measuring points, the rule of “large front, small back,” the displacement of the area near the bottom of the slope was much greater than that of the area near the top of the slope, was presented. Therefore, the displacement of the measuring points on the surface conformed to the deformation characteristics of the tractive landslide and was consistent with the deep displacement.
The micro-variation monitoring could obtain an intuitive cloud map about the surface displacement distribution, showing the areas with larger surface displacement (Figure 9). In addition, the surface displacement and displacement rate-time curves of each characteristic point in micro-variation monitoring could also be obtained. The results of typical feature points in the area with larger displacement were selected, as shown in Figure 10. The displacement rate of the characteristic points decreased to a relatively safe level, the surface displacement-time curve gradually became gentle, and the slope showed no tendency of further failure. The overall results were consistent with the GNSS displacement monitoring results (Figure 10).
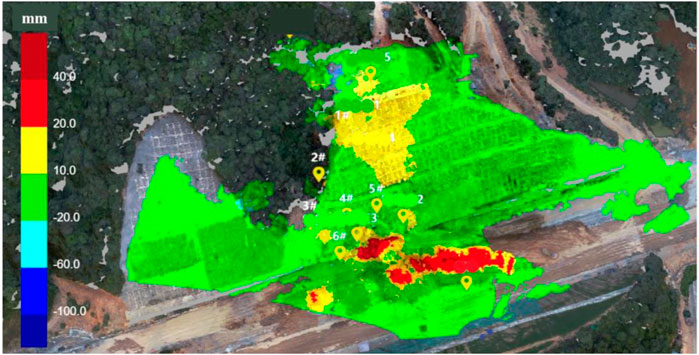
Figure 9. Thumbnail of surface displacement distribution in micro-variation monitoring.
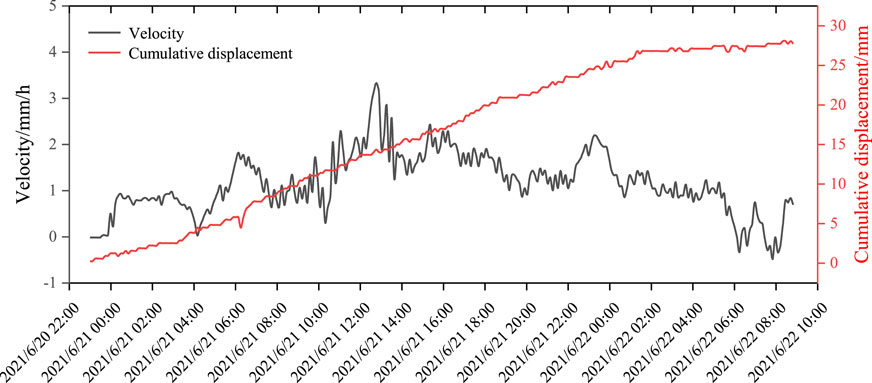
Figure 10. Surface displacement and displacement rate-time curves in micro-variation monitoring.
From June 22 to 2 July 2021, the average horizontal rate of each measuring point was 0.63–36.65 mm/d, which decreased to 5%–22% of that during the collapse period. The vertical rate was −0.13–4.84 mm/d, which decreased to 13%–59% of that during the collapse period. Compared with the previous period, the cumulative displacement curve significantly transformed to slow development with a small angle, indicating the positive regulating effect of the emergency rescue measures (counter pressure at the bottom of the slope and anchor pile at the top of the slope) on the slope. The gradual filling of the counter-pressure body effectively prevented the shear destruction of the first to third-slope platforms, greatly reducing the displacement rate of 1-GNSS1 and 2-GNSS3. The construction of anchored piles restrained the internal deformation of the upper slope, thus reducing the displacement rate of 1-GNSS1 and 3-GNSS1. During this period, the slope was in the stage with deceleration deformation.
From July 3 to August 13, 2021, the displacement rate of all surface measuring points further decreased comparing with that in the previous period. The horizontal displacement rate was 1.63–3.16 mm/d, which decreased to 47%–65% of that in the previous monitoring period. Besides, the vertical displacement rate was −0.97–2.11 mm/d, which was the same with the previous period. The horizontal and vertical displacement curves tended to develop horizontally. Affected by the heavy rainfall at the end of July, the slope had a small increase in displacement compared with that before the rainfall. Overall, a low-speed deformation state was presented during this period. The emergency rescue measures positively improved the surface displacement of the slope (Figures 11, 12).
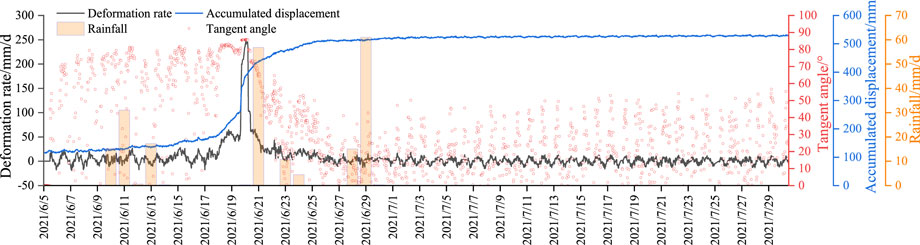
Figure 11. Cumulative displacement-time curve of 1-GNSS1.
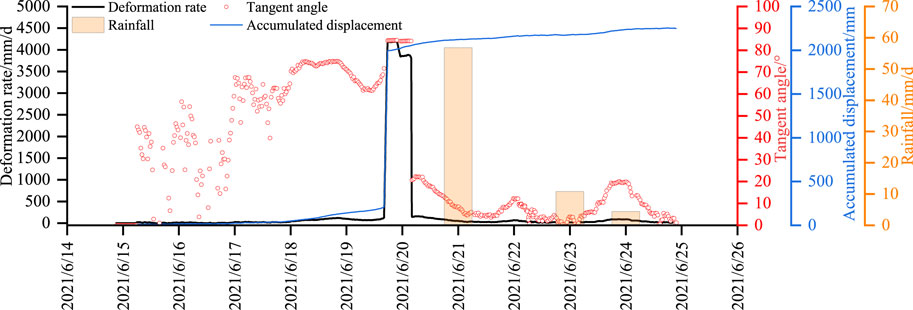
Figure 12. Cumulative surface displacement-time curve at 2-GNSS1.
The artificial surface displacement monitoring started from the initial completion of rescue work on June 28 and ended with the full completion on August 13. From June 28 to July 31, the horizontal displacement rate of each measuring point on the slope surface was 0.57–2.20 mm/d, the vertical displacement rate was −0.08–0.7 mm/d, and the displacement curve gently developed at a small angle, maintaining an overall low-rate displacement state. From August 1 to 13, the rescue work was completed, the horizontal displacement rate of each measuring point was 2.96–6.42 mm/d, and the vertical displacement rate was −2.62–14.20 mm/d. The displacement curve for the slope increased, with the displacement increasing more obviously than the one in previous period, which may be attributed to a large amount of precipitation seeping into the slope. By the comparison, the development trend of the artificial surface displacement was consistent with those of deep slope displacement and GNSS surface displacement, and the stability of the slope and the effectiveness of monitoring data were corroborated.
4.1.3 Monitoring and analyzing the settlement of tower foundation with hydrostatic level
From the implementation of the time before the local failure of the slope, the average settlement rate of each measuring point of the tower foundation at the slope top was less than 1 mm/d. In the process of slope collapse, the tower foundation suffered obvious settlement. The average settlement measuring point of the tower foundation at the toprate of each measuring point was −3.59–12.88 mm/d, 9.74–19.94 times than the value before the collapse, indicating that the tower foundation settlement was significantly affected by the slope displacement. Since the tower foundation settlement was aggravated due to the rescue construction, the settlement rate of each measuring point was less than −0.30 mm/d. At the same time, the settlement curve had slowed to develop horizontally, indicating that the emergency rescue construction on the slope could effectively prevent the rapid settlement of the tower. Among the four settlement measuring points of the tower, the settlement at JL-03, the farthest from the slope surface, was the smallest, and the settlement at JL-02, the closest to the slope surface, was the largest. That was, the settlement difference between JL-02 and JL-03 was the largest. In combination with the location and distribution of the measuring points, it showed that the tower was mainly inclined towards the subgrade (Figure 13).
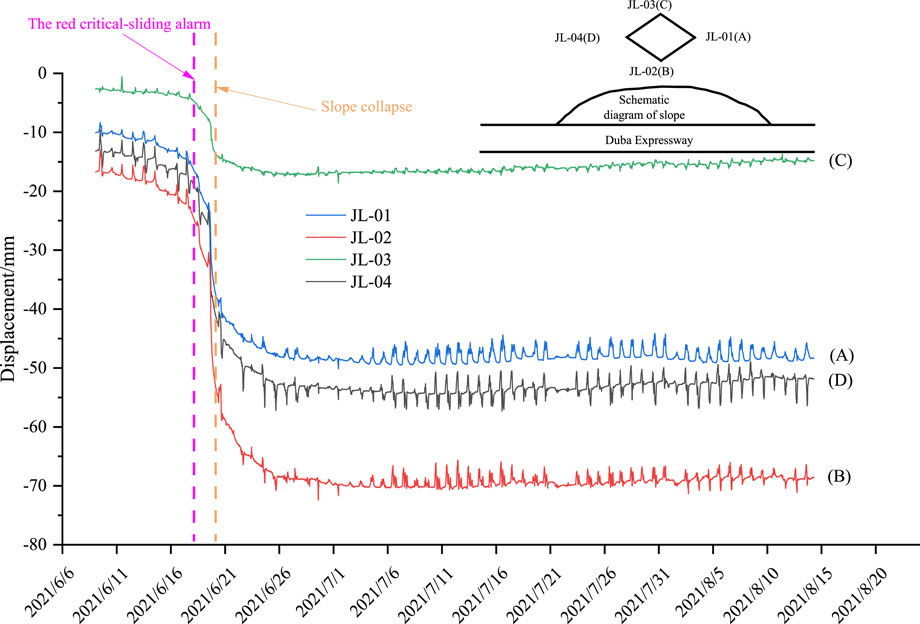
Figure 13. Accumulated surface settlement-time curve for the tower foundation.
4.2 Early warning of the slope
4.2.1 Criteria for early warning
The criteria for graded monitoring and early warning were given in Table 5. According to the displacement and deformation rate, the early warning level was divided into blue-attention level, yellow-caution level I, yellow-caution level II, orange-guard level, and red-alarm level.
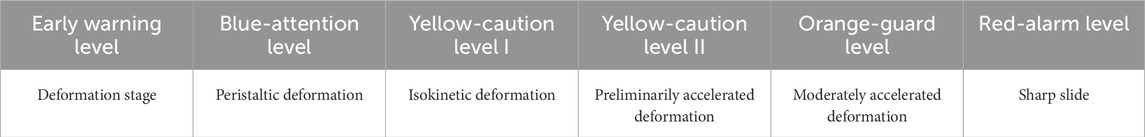
Table 5. Criteria for graded monitoring and early warning.
4.2.2 Early warning methods
The early warning system employed for the Naliang slope integrates various monitoring technologies and data analysis techniques to assess the risk of slope failure dynamically. This system leverages the tangent angle and displacement rate as primary indicators, which are crucial for assessing the stability and predicting potential landslide events. Key aspects of the early warning method include:
Real-Time Monitoring: Continuous monitoring using deep displacement inclinometers and surface displacement sensors provides a comprehensive understanding of the slope’s behavior under varying environmental conditions.
Data Integration: The system integrates data from multiple sources, including rainfall gauges, soil moisture sensors, and seismic activity monitors, to enhance the predictive accuracy of the early warning system.
Tangent Angle Analysis: This technique involves calculating the tangent angle of the cumulative displacement-time curve to identify acceleration phases that may precede a landslide. A critical threshold of 83° has been established as an indicator of imminent slope failure.
Automated Alerts: The system is configured to automatically categorize risk levels and issue alerts ranging from blue (attention) to red (critical alarm), based on pre-defined thresholds of displacement and deformation rates.
4.2.3 Examples
With the multiple monitoring means and according to the reasonable analysis of various monitoring data, five early warnings were issued during the construction and rescue process of Naliang slope and described as follows.
From April 3 to 5, 2021, the deep displacement inclinometer borehole, namely, CX2-1 showed a significant inflection point at the depth of 18 m. The differential settlement of the static leveling point of the tower foundation support on the top of the slope was 1.91 mm and 0.29 mm. The tower showed a tilt towards the main subgrade line. The first orange warning was issued on April 6.
On April 26, the monitoring data from the surface and deep displacement measuring points showed that the slope experienced a moderately accelerated deformation state, which triggered the orange alert again and issued the second orange warning.
On June 14, the deformation rates of the three deep displacement inclinometer boreholes in the main monitoring section increased to 12.84 mm/d, 14.80 mm/d, and 19.60 mm/d, respectively. The slope entered the high-speed deformation stage, and the tangent angle of the deep cumulative displacement-time curve reached 83°, activating the red critical-sliding alarm. On June 15, the early warning level was adjusted from the orange guard to red critical-sliding alarm.
The maximum cumulative displacement at the deep slope reached 51 mm from 21:00 on June 17 to 15:00 on June 18, which could be converted to a daily rate of 144 mm/d. The second red critical-sliding alarm was issued on June 18.
The first stage of rescue work for the local collapse of Naliang slope ended on June 26. The horizontal displacement rate of all surface and deep monitoring points showed a downward convergence trend. The axial force of anchor cables remained within the allowable range, and the early warning level for the slope was lowered to an orange-guard level.
4.3 Rescue measures for Naliang slope
On the afternoon of 19 June 2021, the Naliang slope suffered local instability and failure, presenting the trend of further development to the overall instability. The rescue construction was carried out immediately by counter pressure with piled soil and reinforcement with anchor piles.
4.3.1 Counterpressure with piled soil
The designed height of on-site counterpressure was 37 m, and the initial volume of counterpressure earthwork was 150,000 m3. The concrete pump was used to pump concrete to block the mountain cracks at the collapse site further to prevent rainwater from pouring down. The earth surface and slope surface in the exposed slope area was covered with colored strip cloth to further prevent rainwater from seeping into the soil layer and aggravating the slip. After the preliminary counterpressure, the final earthwork was continuously counter-pressed to the third-level platform (30 m), and the actual counter-pressure backfill volume was 249,000 m3 in total. The area from the third-level platform to 37 m was counter-pressed using the lifted geotextile bag filled with soil.
4.3.2 Construction of anchor piles
The anchor piles were used to reinforce the slope, and the pile top and power tower deformation was confined with the concrete anchorage and tensioned steel cables. The power tower at the front and rear ends of the slope body was strengthened by cable pulling. Three rows of anchor piles were set along the range of 26 m in front of the tower with a spacing of 1 × 1 m, and 74 anchor reinforcement piles were completed. To limit the top displacement of the pile, three anchorages were added at the rear of the high-voltage transmission line tower to form a pair of tension with the anchor piles, ensuring the temporary stability of the tower.
4.3.3 Rescue effect
The first stage of rescue work for the local collapse of Naliang slope was completed on June 26, 2021 After the rescue construction, as of 8:00 a.m. on July 5, the tilt rate of the tower foundation was 4.675%, while the tilt rate of the tower tip was 4.225%. The total tilt rate of the tower remained constant for 288 consecutive hours. The cumulative settlement and horizontal displacement fluctuated steadily, whereas the deformation rate slowed down significantly. The curve converged, while the slope and power tower were in a stable state.
There was no significant change after the heavy rain from June 28 to 30, 2021. The data from two surface displacement monitoring points, 3-GNSS1 and 4-GNSS1, showed that the trend of further deformation and failure of the slope was effectively controlled after the rescue measures were carried out (Figure 14). Therefore, the early warning level of the main slope was reduced from red to orange, and the safety level of the power tower was reduced from red to yellow.
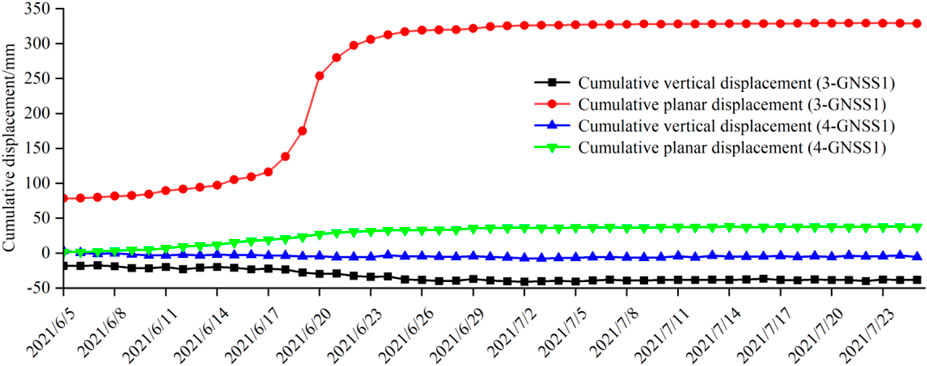
Figure 14. Cumulative surface displacement-time curves at 3-GNSS1 and 4-GNSS1.
5 Conclusion
Taking the high and steep slopes along highways in the distribution area of high-voltage transmission line towers as the engineering background, the intelligent monitoring, early warning, forecasting and emergency disposal work for Naliang slope were carried out, and the conclusions are as follows.
(1) Similar to the deformation characteristics of natural slopes, the deformation of engineering slopes composed of sandstone and mudstone with protective measures is often characterized by creep, and the whole deformation process of slopes can be divided into initial deformation, isovelocity deformation and accelerated deformation of three deformation stages. Once the deformation of slopes enters into the stage of near-slip, which signifies that the evolution of the slopes has entered into the critical state, overall destabilization of damage and landslides are about to occur.
(2) According to the deformation rate, the deformation state of the slope can be judged, which is convenient for taking measures in time. In the early stage of slope collapse, the cumulative displacement and rate curves of each deep inclinometer holes are generally developed with time at a certain slope rate, and the deformation rate when the slope is in the state of high-speed deformation is 12.84–19.60 mm/d, the average displacement rate is 5.08–6.20 mm/d, and the cumulative displacement in the stage is 45.72–55.81 mm, and the displacement of the deep part of the slope in the stage of pro-slip acceleration reaches the maximum rate of 19.90–30.26 mm/d, and the displacement in the stage of pro-slip acceleration reaches the maximum rate of 19.90–30.26 mm/d.
(3) The tangent angle landslide early warning criterion can be applied to the landslide early warning and forecasting of high steep engineering slopes in sandstone and mudstone. When the slope is in the stage of sliding failure, the slope of the cumulative displacement curve of each hole increases sharply, and the corresponding tangent angle of the data point is greater than 80°.
(4) Due to the high voltage transmission line tower being located within the influence range of the slope, when the use of automated monitoring means to carry out monitoring work, special attention should be paid to strengthening the geotechnical body deep displacement monitoring work. Deep displacement monitoring data is an important basis for determining the later engineering plan.
(5) On the basis of analyzing and determining the location of the slope slip surface, the use of timely layered counter-pressure, anchor bar piles and other micro-pile emergency measures can effectively control the deformation scope of the steep slope, and prevent further deterioration slope and subsequent landslide.
Data availability statement
The original contributions presented in the study are included in the article/Supplementary Material, further inquiries can be directed to the corresponding author.
Author contributions
XiL: Conceptualization, Data curation, Formal Analysis, Project administration, Software, Visualization, Writing–original draft. XL: Formal Analysis, Funding acquisition, Methodology, Resources, Writing–review and editing. YS: Investigation, Methodology, Software, Writing–review and editing. CC: Resources, Visualization, Writing–review and editing. GL: Investigation, Validation, Writing–review and editing. YL: Data curation, Methodology, Writing–review and editing. ML: Validation, Visualization, Writing–review and editing. XW: Validation, Writing–original draft, Investigation. YC: Validation, Writing–review and editing, Software, Visualization.
Funding
The author(s) declare that financial support was received for the research, authorship, and/or publication of this article. This work was supported by Guangxi Science and Technology Program, China (Grant Nos. AB24010353, AB22035024, and AB24010043).
Conflict of interest
Authors XL, YS, CC, GL, YL, ML, and XW were employed by Guangxi Communications Design Group Co., Ltd.
The remaining authors declare that the research was conducted in the absence of any commercial or financial relationships that could be construed as a potential conflict of interest.
Publisher’s note
All claims expressed in this article are solely those of the authors and do not necessarily represent those of their affiliated organizations, or those of the publisher, the editors and the reviewers. Any product that may be evaluated in this article, or claim that may be made by its manufacturer, is not guaranteed or endorsed by the publisher.
References
Chen, H., Li, Y. J., Fang, R., et al. (2015). A novel technique for monitoring deep displacement and early-warning of landslide. Chin. J. Rock Mech. Eng. 34 (Suppl. 2), 4063–4070. doi:10.13722/j.cnki.jrme.2015.0867
Dai, K., Li, Z., Xu, Q., Burgmann, R., Milledge, D. G., Tomas, R., et al. (2020). Entering the era of earth observation-based landslide warning systems: a novel and exciting framework. IEEE Geoscience Remote Sens. Mag. 8 (1), 136–153. doi:10.1109/mgrs.2019.2954395
Gariano, S. L., and Guzzetti, F. (2016). Landslides in a changing climate. Earth-Science Rev. 162, 227–252. doi:10.1016/j.earscirev.2016.08.011
Guzzetti, F., Gariano, S. L., Peruccacci, S., Brunetti, M. T., Marchesini, I., Rossi, M., et al. (2020). Geographical landslide early warning systems. Earth-Science Rev. 200, 102973. doi:10.1016/j.earscirev.2019.102973
Li, Q., Wang, Y. M., Zhang, K. B., Yu, H., and Tao, Z. Y. (2020). Field investigation and numerical study of a siltstone slope instability induced by excavation and rainfall. Landslides 17, 1485–1499. doi:10.1007/s10346-020-01396-5
Li, S., Qiu, C., Huang, J., Guo, X., Hu, Y., Mugahed, A. S. Q., et al. (2022). Stability analysis of a high-steep dump slope under different rainfall conditions. Sustainability 14 (18), 11148. doi:10.3390/su141811148
Li, X., Li, Q., Wang, Y., Liu, W., Hou, D., Zheng, W., et al. (2023). Experimental study on instability mechanism and critical intensity of rainfall of high-steep rock slopes under unsaturated conditions. Int. J. Min. Sci. Technol. 33 (10), 1243–1260. doi:10.1016/j.ijmst.2023.07.009
Liu, C. Z. (2021). Three types of displacement-time curves and early warning of landslides. J. Eng. Geol. 29 (1), 86–95. doi:10.13544/j.cnki.jeg.2020-525
Qin, H. X., Gui, L., Yu, Y. T., et al. (2021). Emergency measures based on early warning classification of landslide. Bull. Geol. Sci. Technol. 40 (4), 187–195. doi:10.19509/j.cnki.dzkq.2021.0412
Scaioni, M., Feng, T., Lu, P., Qiao, G., Tong, X., Li, R., et al. (2015). Close-range photogrammetric techniques for deformation measurement: applications to landslides. Mod. Technol. landslide Monit. Predict., 13–41. doi:10.1007/978-3-662-45931-7_2
Shi, W., Zhang, J., Song, D., Liu, X., Wang, E., and Zhao, J. (2024). Dynamic response characteristics and instability mechanism of high-steep bedding rock slope at the tunnel portal in high-intensity seismic region. Rock Mech. Rock Eng. 57 (2), 827–849. doi:10.1007/s00603-023-03629-0
Taalab, K., Cheng, T., and Zhang, Y. (2018). Mapping landslide susceptibility and types using Random Forest. Big Earth Data 2 (2), 159–178. doi:10.1080/20964471.2018.1472392
Tao, Y., Xue, Y., Zhang, Q., Yang, W., Li, B., Zhang, L., et al. (2021). Risk assessment of unstable rock masses on high-steep slopes: an attribute recognition model. Soil Mech. Found. Eng. 58 (2), 175–182. doi:10.1007/s11204-021-09724-0
Uhlemann, S., Smith, A., Chambers, J., Dixon, N., Dijkstra, T., Haslam, E., et al. (2016). Assessment of ground-based monitoring techniques applied to landslide investigations. Geomorphology 253, 438–451. doi:10.1016/j.geomorph.2015.10.027
Vivoda Prodan, M., Mileusnić, M., Mihalić, A. S., and Arbanas, Ž. (2017). Influence of weathering processes on the shear strength of siltstones from a flysch rock mass along the northern Adriatic coast of Croatia. Bull. Eng. Geol. Environ. 76, 695–711. doi:10.1007/s10064-016-0881-7
Wang, B., and Shi, B. (2010). Distributed fiber monitoring test and its application to slope deformation. J. Disaster Prev. Mitig. Eng. 30 (1), 28–34. doi:10.3724/SP.J.1011.2010.01138
Wang, W., Zhao, W., Chai, B., Du, J., Tang, L., and Yi, X. (2022). Discontinuity interpretation and identification of potential rockfalls for high-steep slopes based on UAV nap-of-the-object photogrammetry. Comput. Geosciences 166, 105191. doi:10.1016/j.cageo.2022.105191
Wang, Y., Chen, C., Wang, J., and Baldick, R. (2015). Research on resilience of power systems under natural disasters—a review. IEEE Trans. Power Syst. 31 (2), 1604–1613. doi:10.1109/tpwrs.2015.2429656
Xie, M., Hu, M., and Wang, L. (2013). Landslide monitoring by three-dimensional laser scanner-case study of the displacement detection of the Jinpingzi landslide (Southwest, China). Chin. J. Geol. Hazard Control 24 (4), 85–92. doi:10.16031/j.cnki.issn.1003-8035.2013.04.024
Xu, H., Li, S., Xu, D., Liu, X. y., Xia, Y. l., Wang, G. q., et al. (2024). Investigation on the failure mechanism of a tunnel entrance high-steep slope with ultra-large wedge blocks based on discrete element method. Comput. Geotechnics 166, 106055. doi:10.1016/j.compgeo.2023.106055
Xu, Q. (2020a). Understanding the landslide monitoring and early warning: consideration to practical issues. J. Eng. Geol. 28 (2), 360–374. doi:10.13544/j.cnki.jeg.2020-025
Xu, Q. (2020b). Understanding and consideration of related issues in early identification of potential geohazards. Geomatics Inf. Sci. Wuhan Univ. 45 (11), 1651–1659. doi:10.13203/j.whugis20200043
Xu, Q., Tang, M. G., Xu, K. X., et al. (2008). Research on space-time evolution laws and early warning-prediction of landslides. Chin. J. Rock Mech. Eng. 27 (6), 1104–1112. doi:10.3321/j.issn:1000-6915.2008.06.003
Yan, J., Chen, J., Tan, C., Zhang, Y., Liu, Y., Zhao, X., et al. (2023). Rockfall source areas identification at local scale by integrating discontinuity-based threshold slope angle and rockfall trajectory analyses. Eng. Geol. 313, 106993. doi:10.1016/j.enggeo.2023.106993
Yang, Z., Fan, X., Yang, Y., Hou, K., Du, J., Chen, X., et al. (2022). Deformation patterns and failure mechanism of high and steep stratified rock slopes with upper steep and lower gentle style induced by step-by-step excavations. Environ. Earth Sci. 81, 229. doi:10.1007/s12665-022-10327-7
Yang, Z., Li, Z., Zhu, J., Wang, Y., and Wu, L. (2020). Use of SAR/InSAR in mining deformation monitoring, parameter inversion, and forward predictions: a review. IEEE Geoscience Remote Sens. Mag. 8 (1), 71–90. doi:10.1109/mgrs.2019.2954824
Yong, C., Jinlong, D., Fei, G., Bin, T., Tao, Z., Hao, F., et al. (2022). Review of landslide susceptibility assessment based on knowledge mapping. Stoch. Environ. Res. Risk Assess. 36 (9), 2399–2417. doi:10.1007/s00477-021-02165-z
Zhang, C. C., Zhu, H. H., Liu, S. P., Shi, B., and Zhang, D. (2018). A kinematic method for calculating shear displacements of landslides using distributed fiber optic strain measurements. Eng. Geol. 234, 83–96. doi:10.1016/j.enggeo.2018.01.002
Zhang, W., Zhao, X., Pan, X., Wei, M., Yan, J., and Chen, J. (2022). Characterization of high and steep slopes and 3D rockfall statistical kinematic analysis for Kangyuqu area, China. Eng. Geol. 308, 106807. doi:10.1016/j.enggeo.2022.106807
Keywords: high-steep slope, monitoring and early warning, tangential angle, emergency rescue, solpe deformation
Citation: Liu X, Lü X, Shao Y, Chen C, Liu G, Li Y, Li M, Wu X and Chen Y (2024) Monitoring and disaster prevention of high and steep sandstone slopes along highways under construction. Front. Earth Sci. 12:1444592. doi: 10.3389/feart.2024.1444592
Received: 05 June 2024; Accepted: 16 July 2024;
Published: 05 August 2024.
Edited by:
Haijun Qiu, Northwest University, ChinaReviewed by:
Nan Jiang, China University of Geosciences Wuhan, ChinaShaokun Ma, Guangxi University, China
Copyright © 2024 Liu, Lü, Shao, Chen, Liu, Li, Li, Wu and Chen. This is an open-access article distributed under the terms of the Creative Commons Attribution License (CC BY). The use, distribution or reproduction in other forums is permitted, provided the original author(s) and the copyright owner(s) are credited and that the original publication in this journal is cited, in accordance with accepted academic practice. No use, distribution or reproduction is permitted which does not comply with these terms.
*Correspondence: Xilin Lü, eGlsaW5sdUB0b25namkuZWR1LmNu