 Andrea Di Benedetto
 Anna Figlioli
 Antonino D’Alessandro
 Giosue’ Lo Bosco
- 1Osservatorio Nazionale Terremoti, Istituto Nazionale di Geofisica e Vulcanologia, Roma, Italy
- 2Dipartimento di Matematica e Informatica, Università degli Studi di Palermo, Palermo, Italy
- 3Sezione di Milano, Istituto Nazionale di Geofisica e Vulcanologia, Milano, Italy
- 4Dipartimento di Scienze della Terra e del Mare, Università degli Studi di Palermo, Palermo, Italy
- 5Dipartimento di Scienze per l’Innovazione Tecnologica, Istituto Euro-Mediterraneo di Scienza e Tecnologia, Palermo, Italy
The collection of a significant catalogue of seismo-volcanic data involves the selection of relevant parts of raw signals, which can be automatised by using the short-term over long-term average (STA/LTA) method. The STA/LTA method employs the “Characteristic Function” to describe a section of a seismic record in terms of trace amplitude and first-time difference. This function is calculated in a short-term and long-term window; the ratio between the two windows defines a quantity that is controlled through threshold values, i.e., trigger on and trigger off. These threshold values indicate whether there is an increase in the energy in the seismic signal compared to the background noise. The common approach to the selection of the STA/LTA values is the adoption of literature-suggested ones. This could be a limitation as there may be cases in which a choice adapted to a specific raw signal may significantly help in the extraction of the relevant parts. To overcome the possible drawbacks of a non-adaptive choice imposed by such standard literature values, in this study, we propose a methodology for the automatic selection of STA/LTA values that can optimise the extraction of explosion quakes (EQs) from a seismo-volcanic raw signal. The values are obtained through a grid search over an index named quality–numerosity index (QNI) that measures the accordance in the automatic cuts and the consequent number of triggered seismo-volcanic events with the ones suggested by a human expert. The method was applied in the volcano domain for the specific application of the explosion quake signal extraction at Stromboli volcano. The experiments were conducted by selecting a subset of the dataset as training where to search for the best values, which were subsequently adopted in a test set. The results prove that the values suggested by our approach significantly improve the quality of the relevant part compared to the one extracted by adopting the values indicated in the literature. The methodology presented in this study can be applied to a wider typology of signals of volcanic, seismic, and other origin, potentially becoming a widely used approach in parameter optimisation processes.
1 Introduction
The issue of detecting seismo-volcanic events and their waveform extraction from raw seismic signals is a key problem of volcanic seismology (Sosa et al., 2024; Journeau et al., 2020; Soubestre et al., 2018). With the continuous growth of available data over time, due to the expansion of seismic networks, meeting this request with the help of a human operator can be laborious and time-consuming. Thus, computational methods need to be adopted, such as machine learning methods, for near real-time event detection and waveform extraction, especially for rapid risk assessment related to potential destructive events (Makus et al., 2024; Konstantinou, 2023; Lara et al., 2020). Machine learning methodologies also emerge in managing post-event intervention (Cannioto et al., 2017). The scientific community is focused on identifying and analysing the seismic signals generated by volcanic activity, for characterising potential precursors that may serve as early indicators of eruptions. This is especially crucial for the Stromboli volcano, where paroxysms—sudden and intense eruptions—pose the greatest danger to populations living in the surrounding areas (Andronico et al., 2021; Metrich et al., 2021; Giudicepietro et al., 2020). The Stromboli volcano (926 m) is part of the Aeolian archipelago in the Tyrrhenian Sea (Italy) and is renowned for its persistent explosive activity, often referred to as “Strombolian eruptions” (Giudicepietro et al., 2020). This volcanic behaviour is characterised by rhythmic bursts of gas and pyroclasts, driven by the degassing of magma (Chouet, 1996). The study of Stromboli’s volcanic signals, including seismic activity, ground deformation, and gas emissions, provides crucial insights into the underlying magmatic processes and potential eruption forecasts. Seismic activity signals, such as volcanic tremors and explosions, are particularly significant as they reflect the movement of magma and gas within the volcanic conduit. Ground deformation, monitored through techniques such as GPS and InSAR, offers valuable data on the magma’s movement beneath the surface (Schaefer et al., 2019). Gas emissions, especially the flux of sulphur dioxide
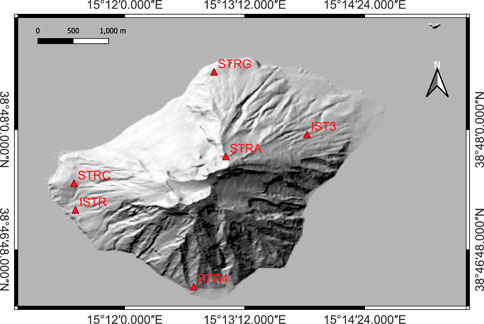
Figure 1. Permanent seismic network of Istituto Nazionale di Geofisica e Vulcanologia (INGV) on Stromboli. Map created using QGIS Development Team (2024).
The analysis of seismological data is crucial for understanding and monitoring the volcanic activity, and the short-term average/long-term average (STA/LTA) method is one of the most widely used techniques for detecting seismic events within continuous waveform data. STA/LTA is a ratio-based approach that compares the average signal amplitude over a short time window with the one over a longer time window. When a seismic event occurs, the short-term window will capture the strong amplitudes associated with the event, causing a significant increase in the STA/LTA ratio. This increase serves as a detection threshold, and when the ratio exceeds this threshold, it triggers an event detection. This method is particularly effective in identifying the onset of seismic events, such as volcanic tremors, explosions, and microseismicity, by highlighting abrupt changes in the amplitude, which indicate the start of an event (Allen, 1978). In volcanic environments, where seismic signals are often complex and embedded within noisy data, STA/LTA provides a robust mechanism for real-time event detection. The sensitivity of the STA/LTA algorithm can be adjusted by tuning the window lengths, making it adaptable to different types of seismic signals and noise levels (Withers et al., 1999). This adaptability is crucial for monitoring diverse volcanic phenomena, where the nature of seismic signals can vary significantly depending on the type of volcanic activity. Selecting STA/LTA window lengths can be an iterative process and ought to be based on real data analysis. This optimisation process may be time-consuming for human operators. The application of STA/LTA in the context of volcanic seismology has proven invaluable for the early detection of eruptive activity, allowing for timely alerts and the implementation of mitigation strategies. Furthermore, the integration of STA/LTA with other signal processing techniques enhances the overall reliability of volcanic monitoring systems (Hagerty et al., 2000). Automatic picking and cutting techniques for seismograms are essential tools in seismic data analysis, particularly in monitoring volcanic activity. These methods involve the automatic detection of seismic phases, such as P-waves and S-waves, and the precise segmentation of relevant seismic events from continuous waveform data. The automation of these processes is crucial in volcanology, where the rapid analysis of large datasets is necessary for timely eruption forecasts and hazard assessments (Beyreuther et al., 2010). Advanced algorithms, such as those based on machine learning and neural networks, have significantly improved the accuracy and efficiency of phase picking, even in the presence of noise, which is common in volcanic environments (Ross et al., 2018). Additionally, the development of techniques for automatic cutting or windowing of seismograms enables researchers to isolate specific seismic events, such as volcanic tremors or explosions, facilitating a detailed analysis of their characteristics (Hammer et al., 2012). These automated processes not only enhance the speed and reliability of seismic monitoring but also reduce the potential for human error in interpreting complex seismic signals, thereby improving the overall understanding of volcanic processes and aiding in the mitigation of volcanic risks.
In this work, we have implemented a system to perform the automatic detection and waveform extraction of a seismo-volcanic event from raw seismic signals such as EQs, using the STA/LTA method. The data were provided by the Osservatorio Vesuviano (OV)-INGV. The time range selected for the analysis is from 01 June 2019 to 14 June 2019, before the occurrence of the double paroxysm of the Stromboli volcano (Andronico et al., 2021). We have chosen the first days of the dataset as the learning set on which to perform the training of our method, owing to the large number of EQs detected.
This study is divided into four main sections:
2 Methodology for parameter selection
STA/LTA is based on the analysis of the ratio between short-term and long-term averages of the seismic signal amplitude. This method provides an efficient way to discriminate between seismic events and background noise in seismogram data. With the STA/LTA method, short-term window and long-term window lengths are defined to compute the average amplitudes of seismic signals. The short-term window typically spans a few seconds, capturing the immediate variations in the signal caused by seismic waves. The long-term window, on the other hand, is usually several times longer, capturing the overall background noise level. The STA/LTA ratio is calculated by dividing the average amplitude of the short-term window by the average amplitude of the long-term window. Thus, the STA/LTA is a parametric approach where two basic parameters are STA and LTA window lengths. The ratio between the two windows defines a quantity that is controlled through two other parameters, i.e., trigger on and trigger off. Selection of these parameters can be an iterative process based on real data analysis, where one must remember to continuously monitor the performance of our detection system and make the necessary updates to adapt it to the evolution of the observed phenomenon. We conducted an exploratory research to find the combination of parameters of the STA/LTA method that automatically cut at best EQs, compared to the cuts made by the expert operator. We used our tool developed for our active learning approach (D’Alessandro et al., 2022, see Section 2) to manually cut the EQs. As an example of events present in the dataset, Figure 2A shows the case of two EQs in raw signals, with a zoom on the last one (Figure 2B). To extract the spectrogram, a short-time Fourier transform was calculated using 0.5-s sliding time windows with 90% time overlapping. Figure 3 shows the STA/LTA ratio (bottom) calculated on the zoomed EQ of Figure 2 and the triggers on the signal (top): the red bar consists of trigger on threshold and the blue bar consists of trigger off threshold. When the slope of the curve exceeds the value of the trigger threshold, both for trigger on and trigger off, the red and blue bars are applied on the plot, respectively.
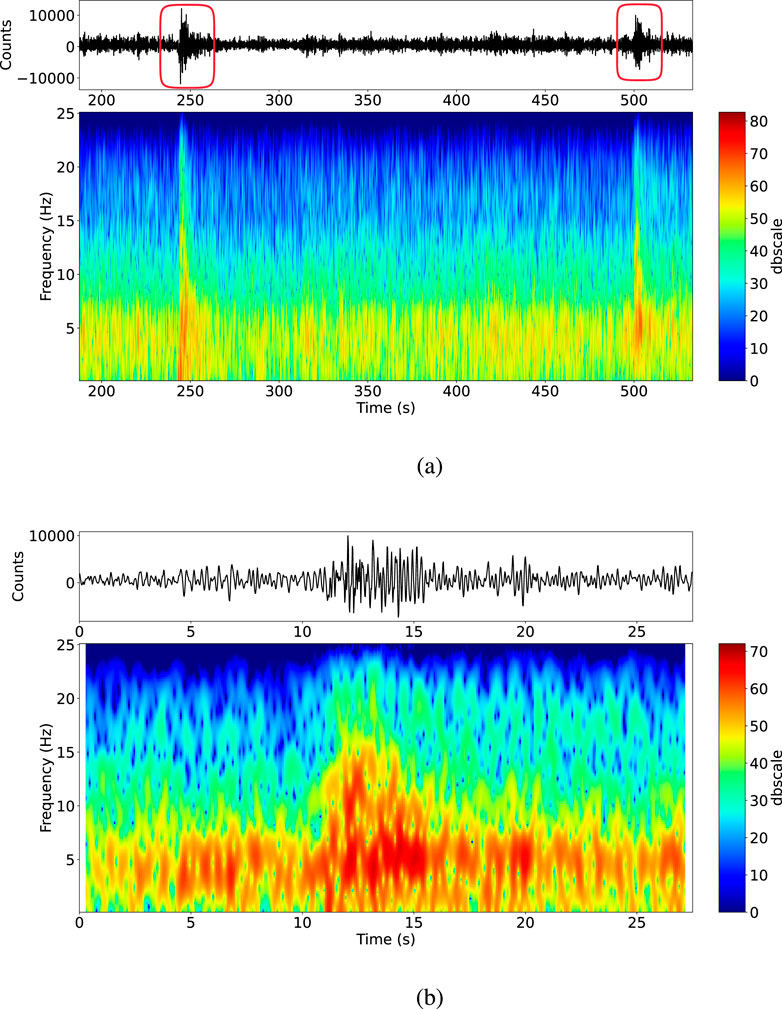
Figure 2. This figure presents a representative case of explosion quakes observed in raw seismo-volcanic signals. Each subfigure consists of two components: the raw signal displayed at the top and the corresponding spectrogram at the bottom. The raw signal is plotted with time on the x-axis, while the spectrogram illustrates the representation of this raw signal in the frequency–time domain. The side colour bar indicates frequency values in decibels. In subfigure (A), multiple explosion quakes from the Stromboli volcano’s signal are marked with red circles. In subfigure (B), a detailed view of the second explosion quake is provided.
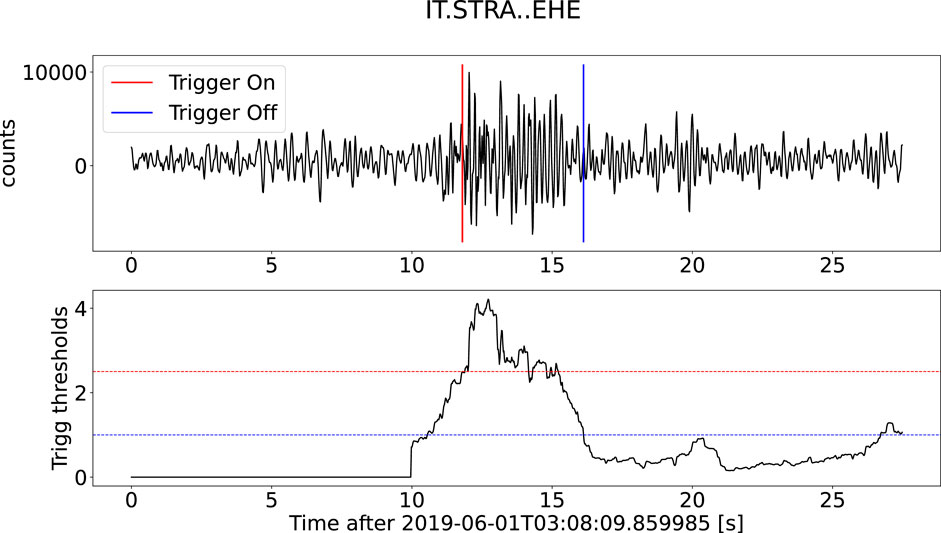
Figure 3. STA/LTA performed on the zoomed EQ of Figure 2. Red bar is trigger on and blue bar is trigger off. The figure above illustrates the raw seismo-volcanic signal, while the figure below represents time along the x-axis and trigger threshold values along the y-axis. In this example case, the chosen values of the parameters for this example were STA 1 s, LTA 10 s, trigger on 2.5, and trigger off 1.
The concept underlying our approach is based on the start and end of the time interval when the event occurs. The start and end times suggested by our approach can be compared with the selections performed by an expert operator by defining a specific measure. In particular, we have proposed two measures: the quality index and the numerosity index. The product of these two is used to define an overall measure called quality–numerosity index (QNI). As a first approach, the characteristic function (CF)
where
to underline the importance of the amplitude and derivative.
For each raw signal considered, the STA/LTA method outputs a list of triggered events, characterised by start time and end time. Those values are compared individually with the ones chosen by the operator. For this comparison, the absolute deviation in terms of the temporal distance is computed. If this value does not exceed a certain residual value
2.1 Evaluation measures
The quality index of a cut is designated as
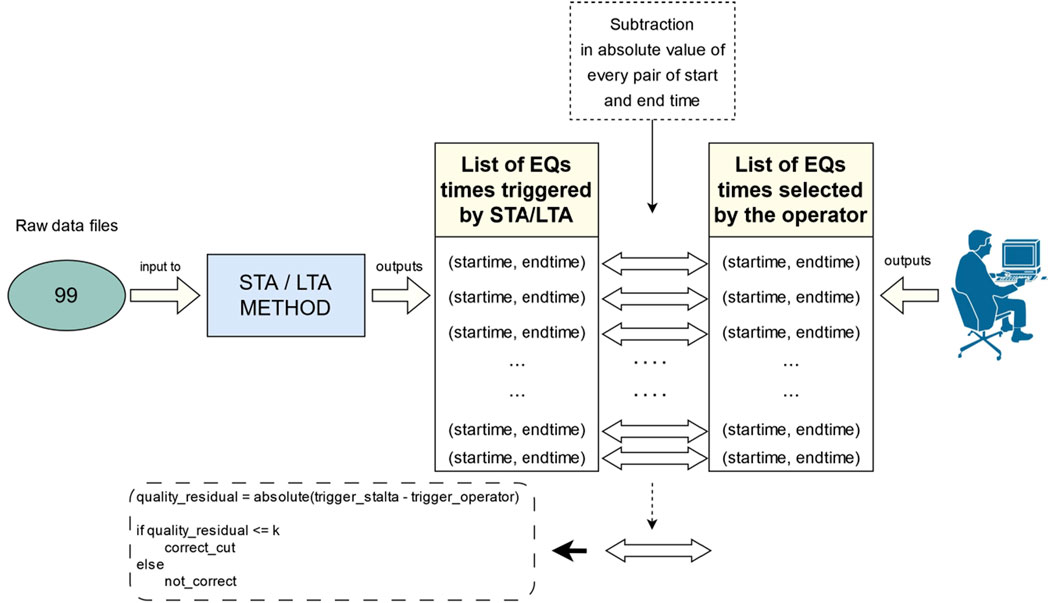
Figure 4. Selection of the trigger’s start time and end time temporally close to the times of the EQs.
All the computed deviations are stored in a list, and the mean deviation
The ni measures the agreement between the number of events triggered by the automatic approach and the number of cuts selected by the human operator.
Let
The
Finally, the combination of the number of events and their temporal precision selected by the automatic process, compared to human experts, makes the QNI the overall measure. This overall measure determines the effectiveness of the cut made by STA/LTA and is defined as follows (Equation 5):
The
2.2 Grid-search technique
Grid search is a widely used technique in machine learning and algorithm parameter optimisation. It is used to search for the optimal combination of parameters for a model or algorithm while varying multiple parameters simultaneously. In the present case, a grid search enables an exhaustive search of the quadruples that correspond to the optimum QNI values. Figure 5 shows an example of a representative scheme of the search.

Figure 5. Grid-search technique for QNI values.
The grid is composed of STA window sizes represented in rows and LTA window sizes represented in columns. Every cell is also a grid, where in abscissa the
Algorithm 1. Pseudocode for recursive exploratory grid-search algorithm.
1: procedure grid_search(
2:
3:
4:
5: for all
6:
7: if
8:
9:
10:
11:
12:
13:
14:
15: end if
16: end for
17: if
18: return
19: else
20:
21: if
22:
23: end if
24:
25: if
26:
27: end if
28:
29: if
30:
31: end if
32:
33: if
34:
35: end if
36:
37: if
38:
39: end if
40:
41: if
42:
43: end if
44: return grid_search(
45: end if
46: end procedure
3 Experiments and results
Starting from 14 days of raw data, our recently developed tool was used (D’Alessandro et al., 2022) to extract the EQ dataset thanks to the expertise of our operator. The entire dataset extracted contains 1,506 EQs. The most significant number of EQs are in the first 4 days of July, i.e., 743 EQs. This set was used as a training set. The subdivision of the training and test datasets is described in Table 1.

Table 1. Dataset subdivision for training and test.
3.1 Training phase
A large grid was explored to better view the distribution of the QNI values. We found the densest grid in the training phase with the highest QNI values by combining a range of window values of STA and LTA, respectively, from 2 s to 16 s and 20 s to 220 s, in steps of 2 s for STA and 20 s for LTA. The same representation of the parameter values as in Figure 5 was used. For each combination of windows,
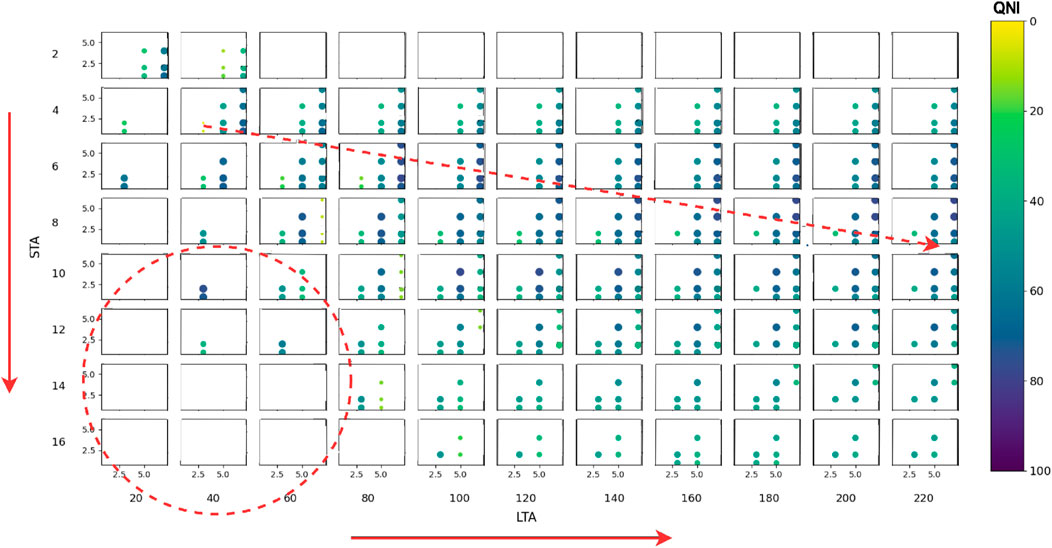
Figure 6. Grid-search exploration for STA windows (rows) and LTA windows (columns), represented by the red rows. Both STA and LTA windows are expressed in seconds. Trigger on/off thresholds, respectively, in abscissa and ordinate, are shown in every cell of the matrix. The red circle shows a region where most of the QNI values are 0. The red dashed line indicates a direction where the QNI values are increasing.
In the lower-left region (highlighted by a red circle), where STA is between 12 s and 16 s and LTA is between 20 s and 60 s, most of the QNI are 0 (no visible circles), and only a few QNI values are approximately 20, which means that this parameter’s combination is not suitable for detecting the EQs efficiently. A dashed red line was outlined to show a direction where the QNI values are increasing. The highest values of QNI are found in the central region from left to right, where STA is between 6 s and 10 s, LTA between 60 s and 220 s,
From the training phase, we extracted the list of the QNI values in descending order and generated a plot, shown in Figure 7. An index identifying the value of the QNI is indicated on the abscissa, while the value of the QNI is indicated on the ordinate. The QNI decreases with a moderate slope up to the value 30 and then rapidly decreases to 0. As a consequence, we decided to extract the quadruple associated with the highest QNI value to carry out the test phase, i.e., the one with value 0.78 resulting from the quadruple: 6, 80, 7, and 2. As can be seen, the quadruple is positioned exactly in the distribution indicated by the dashed red line in Figure 6. The selected
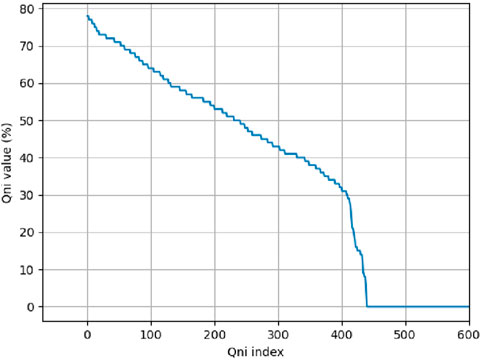
Figure 7. QNI value distribution.
3.2 Testing phase
The common approach to the selection of the STA/LTA values is the adoption of literature-suggested ones. Specifically, these values are STA 1 s and LTA 10 s. Regarding the
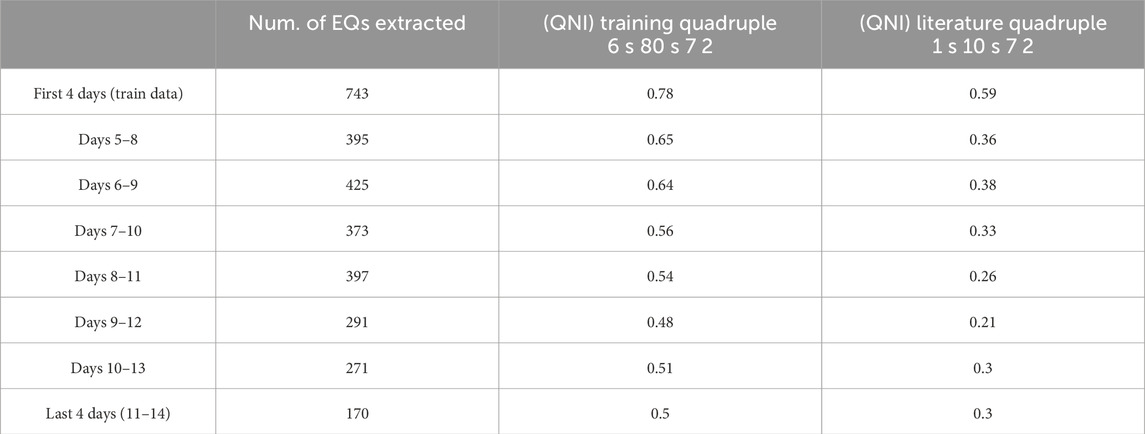
Table 2. Testing results.
4 Discussion
The literature has shown that there is no one single strategy to search the STA and LTA moving windows to select events based on triggers (Earle and Shearer, 1994). The lengths for the STA and LTA windows depend on the frequency content of the seismogram. Long-period records require larger averaging windows than short-period records, which require shorter averaging windows. Among different approaches, we have chosen the work by Küperkoch et al. (2010) as the base case comparison owing to the completeness of this work, focussing on P-phase arrival time, where several CFs for STA/LTA were used to compare their method. They have implemented an algorithm based on higher-order statistics (HOS) for automatic P-phase arrival time determination for local and regional seismic events. The algorithm was applied to a large dataset with very heterogeneous qualities of P-onsets. They calculated several CFs by evaluating higher-order statistical moments, like skewness, kurtosis, mean, and variance. In our case, we decided to use the CF reported in Equation 1, which is the base case determined by Allen (1978). When choosing a “literature quadruple,” there is no clear standard choice for the types of events analysed, yet Küperkoch et al. (2010) values can provide a useful comparison. The results presented in the previous paragraph indicate that, as we move further away from the training set, the QNI appears to vary over time. This is due to the rapid evolution of the volcanological phenomenon, and therefore the EQs generated by it. As is well known (Andronico et al., 2021), the duration, amplitude, and frequency content of the EQs can vary rapidly as the volcanic process evolves. The results show that on average, our training quadruple produced a QNI 0.24 higher than the literature quadruple. Another strength of our approach is the tuning of the evaluation measures: for instance,
Certainly, the main limitation of our study is the low cardinality of the dataset. Based on the time-consuming process of extracting the seismo-volcanic events from real raw data, future improvements will mainly concern the variability of the dataset; extending not only to other types of seismo-volcanic events, such as the following: VLP, landslides, volcanic tremors, and others (Wassermann, 2012), but also to local, regional, and teleseismic events. To achieve this, we aim to replace the human operator by automating the validation process through the use of multiple seismic stations recording the same signal within the same area. This approach replicates the current method used by operators but will be enhanced by deploying seismic stations positioned at approximately equal distances around the crater (Fenner et al., 2022), ensuring more uniform coverage and reducing potential sources of error. Another limitation is specific to the grid-search technique. In general, grid search is a powerful technique for optimising algorithm parameters, but it ought to be used judiciously as it may be time-consuming when there are many parameter combinations to evaluate. Other techniques such as random search or Bayesian optimisation may be more efficient alternatives in some cases. The choice depends on the specific problem domain and available resources. Stromboli remains a case study, but the method is applicable to any type of seismo-volcanic signal and can therefore be used on other volcanoes as well. For instance, it is also suitable for earthquakes in non-volcanic areas.
5 Conclusion and future improvements
In this scientific study, we have explored the potential of using a grid-search method to study the STA/LTA parameters to select seismo-volcanic events, starting from raw signals, with a particular focus on the volcanic activity of Stromboli. Through this application, we have proved the ability to efficiently detect local events, such as explosion quakes. The results showed a more accurate choice of parameters, compared to what was proposed in the literature (Küperkoch et al., 2010), for searching local events, such as EQs. As a first example for the approach, we exploited the constant presence of EQs before the occurrence of the double paroxysms of Stromboli volcano (Andronico et al., 2021).
With this method, one can collect seismo-volcanic events that can be used from the machine learning perspective, such as classification or regression problems, where a certain amount of data is needed for the dataset (Zhu and Beroza, 2018; Mousavi et al., 2020). We decided to use, among possible characteristic functions for STA/LTA, the classic one by Allen (1978) as the first approach. It is also possible to test other CFs as Küperkoch et al. (2010) did for their method. To compare our quadruple, we referred to the work by Küperkoch et al. (2010) to find the baseline quadruple in the literature for the detection of local events (classifying the explosion quakes as local events).
In summary, the integration of our approach is a compelling way to simplify the acquisition of labelled data in seismic–volcanic and more generally of seismic research. By synergising active learning (D’Alessandro et al., 2022) with robust deep learning algorithms and a large dataset, a path towards greater accuracy, effectiveness, and a comprehensive analysis of seismic–volcanic phenomena can be achieved.
Data availability statement
The datasets presented in this study can be found in online repositories. The names of the repository and accession number(s) can be found at: https://github.com/Andry92/grid-search-sta-lta.
Author contributions
ADB: conceptualization, data curation, formal analysis, investigation, methodology, project administration, software, supervision, validation, visualization, writing–original draft, and writing–review and editing. AF: data curation, formal analysis, investigation, resources, software, writing–original draft, and writing–review and editing. AD’A: conceptualization, formal analysis, investigation, methodology, supervision, validation, visualization, writing–original draft, and writing–review and editing. GLB: conceptualization, formal analysis, investigation, methodology, software, supervision, validation, visualization, writing–original draft, and writing–review and editing.
Funding
The authors declare that no financial support was received for the research, authorship, and/or publication of this article.
Acknowledgments
The authors would like to acknowledge Dario Delle Donne from Istituto Nazionale di Geofisica e Vulcanologica—Osservatorio Vesuviano (INGV-OV), for helping us to extract the data from STRA seismic station.
Conflict of interest
The authors declare that the research was conducted in the absence of any commercial or financial relationships that could be construed as a potential conflict of interest.
Publisher’s note
All claims expressed in this article are solely those of the authors and do not necessarily represent those of their affiliated organizations, or those of the publisher, the editors, and the reviewers. Any product that may be evaluated in this article, or claim that may be made by its manufacturer, is not guaranteed or endorsed by the publisher.
References
Aiuppa, A., Bertagnini, A., Métrich, N., Moretti, R., Di Muro, A., Liuzzo, M., et al. (2010). A model of degassing for stromboli volcano. Earth Planet. Sci. Lett. 295, 195–204. doi:10.1016/j.epsl.2010.03.040
Allen, R. V. (1978). Automatic earthquake recognition and timing from single traces. Bull. Seismol. Soc. Am. 68, 1521–1532. doi:10.1785/BSSA0680051521
Andronico, D., Del Bello, E., D’Oriano, C., Landi, P., Pardini, F., Scarlato, P., et al. (2021). Uncovering the eruptive patterns of the 2019 double paroxysm eruption crisis of stromboli volcano. Nat. Commun. 12, 4213. doi:10.1038/s41467-021-24420-1
Beyreuther, M., Barsch, R., Krischer, L., Megies, T., Behr, Y., and Wassermann, J. (2010). ObsPy: a Python toolbox for seismology. Seismol. Res. Lett. 81, 530–533. doi:10.1785/gssrl.81.3.530
Calvari, S., Giudicepietro, F., Di Traglia, F., Bonaccorso, A., Macedonio, G., and Casagli, N. (2021). Variable magnitude and intensity of strombolian explosions: focus on the eruptive processes for a first classification scheme for stromboli volcano (Italy). Remote Sens. 13, 944. doi:10.3390/rs13050944
Cannioto, M., D’Alessandro, A., Lo Bosco, G., Scudero, S., and Vitale, G. (2017). Brief communication: vehicle routing problem and uav application in the post-earthquake scenario. Nat. Hazards Earth Syst. Sci. 17, 1939–1946. doi:10.5194/nhess-17-1939-2017
Chouet, B. (1996). Long-period volcano seismicity: its source and use in eruption forecasting. Nature 380, 309–316. doi:10.1038/380309a0
Chouet, B., Dawson, P., Ohminato, T., Martini, M., Saccorotti, G., Giudicepietro, F., et al. (2003). Source mechanisms of explosions at stromboli volcano, Italy, determined from moment-tensor inversions of very-long-period data. J. Geophys. Res. Solid Earth 108. doi:10.1029/2002jb001919
D’Alessandro, A., Di Benedetto, A., Lo Bosco, G., and Figlioli, A. (2022). “An active learning approach for classifying explosion quakes,” in 2022 IEEE International Conference on Evolving and Adaptive Intelligent Systems (EAIS), Larnaca, Cyprus, May 25–26, 2022 (IEEE), 1–6. doi:10.1109/EAIS51927.2022.978751910
Earle, P. S., and Shearer, P. M. (1994). Characterization of global seismograms using an automatic-picking algorithm. Bull. Seismol. Soc. Am. 84, 366–376. doi:10.1785/BSSA0840020366
Fenner, D., Rümpker, G., Li, W., Chakraborty, M., Faber, J., Köhler, J., et al. (2022). Automated seismo-volcanic event detection applied to stromboli (Italy). Front. Earth Sci. 10. doi:10.3389/feart.2022.809037
Gentili, S., and Michelini, A. (2006). Automatic picking of P and S phases using a neural tree. J. Seismol. 10, 39–63. doi:10.1007/s10950-006-2296-6
Giudicepietro, F., Calvari, S., Alparone, S., Bianco, F., Bonaccorso, A., Bruno, V., et al. (2019). Integration of ground-based remote-sensing and in situ multidisciplinary monitoring data to analyze the eruptive activity of stromboli volcano in 2017–2018. Remote Sens. 11, 1813. doi:10.3390/rs11151813rs11151813
Giudicepietro, F., López, C., Macedonio, G., Alparone, S., Bianco, F., Calvari, S., et al. (2020). Geophysical precursors of the July-August 2019 paroxysmal eruptive phase and their implications for Stromboli volcano (Italy) monitoring. Sci. Rep. 10, 10296. doi:10.1038/s41598-020-67220-1
Hagerty, M., Schwartz, S., Garcés, M., and Protti, M. (2000). Analysis of seismic and acoustic observations at arenal volcano, Costa Rica, 1995–1997. J. Volcanol. Geotherm. Res. 101, 27–65. doi:10.1016/s0377-0273(00)00162-11016/S0377-0273(00)00162-1
Hammer, C., Beyreuther, M., and Ohrnberger, M. (2012). A seismic-event spotting system for volcano fast-response systems. Bull. Seismol. Soc. Am. 102, 948–960. doi:10.1785/0120110167
Harris, A., and Ripepe, M. (2007). Synergy of multiple geophysical approaches to unravel explosive eruption conduit and source dynamics – a case study from Stromboli. Chem. Erode - Geochem. 67, 1–35. doi:10.1016/j.chemer.2007.01.0032007.01.003
Jones, J., and Baan, M. (2015). Adaptive sta–lta with outlier statistics. Bull. Seismol. Soc. Am. 105, 1606–1618. doi:10.1785/0120140203
Journeau, C., Shapiro, N., Seydoux, L., Soubestre, J., Ferrazzini, v., and Peltier, A. (2020). Detection, classification, and location of seismovolcanic signals with multi-component seismic data, example from the piton de la fournaise volcano (la reunion, france). doi:10.1002/essoar.10501605.2
Konstantinou, K. (2023). A review of the source characteristics and physical mechanisms of very long period (vlp) seismic signals at active volcanoes. Surv. Geophys. 45, 117–149. doi:10.1007/s10712-023-09800-0
Küperkoch, L., Meier, T., Lee, J., Friederich, W., and Group, E. (2010). Automated determination of p-phase arrival times at regional and local distances using higher order statistics. Geophys. J. Int. 181, 1159–1170. doi:10.1111/j.1365-246X.2010.04570.x
Lara, F., Lara-Cueva, R., Larco, J., Carrera, E., and Leon, R. (2020). A deep learning approach for automatic recognition of seismo-volcanic events at the Cotopaxi volcano. J. Volcanol. Geotherm. Res. 409, 107142. doi:10.1016/j.jvolgeores.2020.1071421016/j.jvolgeores.2020.107142
Legrand, D., and Perton, M. (2021). What are vlp signals at stromboli volcano? J. Volcanol. Geotherm. Res. 421, 107438. doi:10.1016/j.jvolgeores.2021.107438
Liang, C., Karlstrom, L., and Dunham, E. (2020). Magma oscillations in a conduit-reservoir system, application to very long period (vlp) seismicity at basaltic volcanoes: 1. theory. J. Geophys. Res. Solid Earth 125. doi:10.1029/2019JB017437
Makus, P., Denolle, M., Sens-Schönfelder, C., Kopfli, M., and Tilmann, F. (2024). Analyzing volcanic, tectonic, and environmental influences on the seismic velocity from 25 years of data at Mount St. Helens. Seismol. Res. Lett. 95, 2674–2688. doi:10.1785/0220240088
Mattia, M., Aloisi, M., Di Grazia, G., Gambino, S., Palano, M., and Bruno, V. (2008). Geophysical investigations of the plumbing system of Stromboli volcano (Aeolian islands, Italy). J. Volcanol. Geotherm. Res. 176, 529–540. doi:10.1016/j.jvolgeores.2008.04.022
Metrich, N., Bertagnini, A., and Pistolesi, M. (2021). Paroxysms at Stromboli volcano (Italy): source, genesis and dynamics. Front. Earth Sci. 9, 593339. doi:10.3389/feart.2021.593339feart.2021.593339
Mousavi, S., Ellsworth, W., Weiqiang, Z., Chuang, L., and Beroza, G. (2020). Earthquake transformer—an attentive deep-learning model for simultaneous earthquake detection and phase picking. Nat. Commun. 11, 3952. doi:10.1038/s41467-020-17591-w1038/s41467-020-17591-w
Petrone, C., Mollo, S., Gertisser, R., Buret, Y., Scarlato, P., Del Bello, E., et al. (2022). Magma recharge and mush rejuvenation drive paroxysmal activity at Stromboli volcano. Nat. Commun. 13, 7717. doi:10.1038/s41467-022-35405-z
Ripepe, M., Delle Donne, D., Legrand, D., Valade, S., and Lacanna, G. (2021a). Magma pressure discharge induces very long period seismicity. Sci. Rep. 11, 20065. doi:10.1038/s41598-021-99513-4
Ripepe, M., and Harris, A. (2008). Dynamics of the 5 April 2003 explosive paroxysm observed at stromboli by a near-vent thermal, seismic and infrasonic array. Geophys. Res. Lett. 35. doi:10.1029/2007gl0325332007GL032533
Ripepe, M., Lacanna, G., Pistolesi, M., Silengo, M., Aiuppa, A., Laiolo, M., et al. (2021b). Ground deformation reveals the scale-invariant conduit dynamics driving explosive basaltic eruptions. Nat. Commun. 12, 1683. doi:10.1038/s41467-021-21722-2s41467-021-21722-2
Ripepe, M., Pistolesi, M., Coppola, D., Delle Donne, D., Genco, R., Lacanna, G., et al. (2017). Forecasting effusive dynamics and decompression rates by magmastatic model at open-vent volcanoes. Sci. Rep. 7, 3885. doi:10.1038/s41598-017-03833-3s41598-017-03833-3
Ross, Z. E., Meier, M., Hauksson, E., and Heaton, T. H. (2018). Generalized seismic phase detection with deep learning. Bull. Seismol. Soc. Am. 108, 2894–2901. doi:10.1785/0120180080
Schaefer, L. N., Di Traglia, F., Chaussard, E., Lu, Z., Nolesini, T., and Casagli, N. (2019). Monitoring volcano slope instability with synthetic aperture radar: a review and new data from Pacaya (Guatemala) and Stromboli (Italy) volcanoes. Earth-Science Rev. 192, 236–257. doi:10.1016/j.earscirev.2019.03.009
Sosa, Y. M., Molina, R. S., Spagnotto, S., Melchor, I., Nuñez Manquez, A., Crespo, M. L., et al. (2024). Seismic event detection in the copahue volcano based on machine learning: towards an on-the-edge implementation. Electronics 13, 622. doi:10.3390/electronics13030622
Soubestre, J., Shapiro, N., Seydoux, L., de Rosny, J., Droznin, D., Droznina, S., et al. (2018). Network-based detection and classification of seismovolcanic tremors: example from the klyuchevskoy volcanic group in kamchatka. J. Geophys. Res. Solid Earth 123, 564–582. doi:10.1002/2017JB014726
Wassermann, J. (2012). Volcano seismology, IASPEI new manual of seismological observatory practice 2 (NMSOP-2). Potsdam: Deutsches GeoForschungsZentrum GFZ, 1–77.
Withers, M., Aster, R., and Young, C. (1999). An automated local and regional seismic event detection and location system using waveform correlation. Bull. Seismol. Soc. Am. 89, 657–669. doi:10.1785/bssa0890030657BSSA0890030657
Keywords: short-term over long-term average method, machine learning, parametrization tuning, grid search, seismo-volcanic signals, explosion quakes, Stromboli volcano
Citation: Di Benedetto A, Figlioli A, D’Alessandro A and Lo Bosco G (2024) Grid-search method for short-term over long-term average parameter tuning: an application to Stromboli explosion quakes. Front. Earth Sci. 12:1440967. doi: 10.3389/feart.2024.1440967
Received: 30 May 2024; Accepted: 23 September 2024;
Published: 16 October 2024.
Edited by:
Pierdomenico Romano, National Institute of Geophysics and Volcanology (INGV), ItalyReviewed by:
Manuel Titos, Icelandic Meteorological Office, IcelandAlexander Yates, Université Libre de Bruxelles, Belgium
Copyright © 2024 Di Benedetto, Figlioli, D’Alessandro and Lo Bosco. This is an open-access article distributed under the terms of the Creative Commons Attribution License (CC BY). The use, distribution or reproduction in other forums is permitted, provided the original author(s) and the copyright owner(s) are credited and that the original publication in this journal is cited, in accordance with accepted academic practice. No use, distribution or reproduction is permitted which does not comply with these terms.
*Correspondence: Andrea Di Benedetto, YW5kcmVhLmRpYmVuZWRldHRvQGluZ3YuaXQ=