- CNOOC Research Institute Ltd., Beijing, China
During the exploration and development of deep coalbed methane (CBM), delineating the thickness of coal seam and lithofacies of the roof and floor is one of the major challenging tasks. In past attempts, the prediction methods of these parameters have been limited to the conventional inversion. However, the effect of coal shielding on adjacent reflecting layers restricts the identification of underlying sand effectively by conventional inversion. Also, the depth at which the deep CBM zone is located (1,500–2000 m) produces a significant overlap of P-wave impedance and Vp/Vs of sands and shale which increases classification uncertainty between these two lithofacies. We proposed a new workflow for high-precision quantitative seismic interpretation of deep CBM reservoir. Not only P-wave impedance but also GR is selected as the optimized attributes for lithofacies classification. To reduce the effect of strong reflection of coal seam and identifying thin coal layers, the seismic waveform indication inversion method is used to obtain high-resolution results of P-wave impedance and GR. It uses horizontal changes in seismic waveforms to reflect lithological assemblage characteristics for facies-controlled constraints. Then, Bayesian classification theory is used to achieve three-dimensional lithofacies classification with multi-source data. To improve the continuity and accuracy of the interpreted results, a Markov chain is applied in the Bayesian rule as the spatial prior constraint. A well-associated synthetic test and field data application in Ordos Basin demonstrates the accuracy of the proposed workflow. Compared with conventional inversion, the results of proposed workflow showed higher resolution and accuracy. By providing a new solution for the identification of roof and floor lithofacies of deep CBM reservoir, this workflow aims to contribute to the better exploration and development of deep CBM.
1 Introduction
Deep coalbed methane (CBM) resources at depths below 1524 m are abundant globally, as indicated by the review of major coal-bearing basins worldwide (Kuuskraa and Wyman, 1993). Countries such as the United States and Canada realized the commercial development of deep CBM resources in the last century owing to the relatively simple geological conditions in these countries (Moore, 2012; Li et al., 2018). For instance, The United States pioneered the co-production of deep coal seams and sandstones in the Piceance Basin, with 60% of gas production originating from coal seams. This approach led to significant advancements in the industrial exploitation of deep CBM. In contrast, although the latent capacity of deep CBM in China is considerable, the exploration and production of deep CBM is still in its exploratory stage. The CBM resources within deep formations (depth >1,000 m) in China were estimated to be 22.5 × 10¹² m3 (61.2% of total CBM resource). Qinshui Basin and eastern Ordos Basin are two leading basins with proven CBM resources over 100 × 109 m3. Notably, in 2023, CNOOC’s discovery of a trillion cubic meters of deep CBM in the Shenfu area of the Ordos Basin substantially enhanced industry confidence (Fan et al., 2024; Guo et al., 2024).
In the process of CBM exploration and production, the accurate lithofacies identification of the coal seam roof and floor is essential for assessing the potential of CBM reservoir (Hemza et al., 2009). The reason is that the lithofacies, thickness, and mechanical properties of the coal seam roof and floor are pivotal in determining the storage capacity. Shale, in contrast to the porous and permeable sandstone, exhibit relatively smaller pore sizes, and lower permeability, which are conducive to the sequestration of CBM (Saghafi et al., 2010; Liu et al., 2020). Commonly, the lithofacies identification by seismic data is executed on the basis of seismic inversion-derived elastic attributes, including P-wave impedance and S-wave impedance, as well as density. Based on these attributes, an objective function is formulated by applying probabilistic and statistical principles to conduct lithofacies classification. Thus, the key challenge to construct reliable 3D CBM reservoir lithofacies models is to accurately predict feasible elastic attributes using seismic inversion.
Different seismic attribute pairs vary in their ability to classify lithofacies. Pore fluid and rock property variation can be discriminated over a crossplot of acoustic impedance versus the ratio of P-wave velocity to S-wave velocity (Vp/Vs) (Avseth et al., 2003). However, for sandstone and shale in proximity to deep CBM reservoir, there is considerable overlap in the crossplot of P-wave impedance against Vp/Vs, resulting high uncertainty in reservoir characterization using this seismic attribute pair (Avseth et al., 2003; Aleardi and Ciabarri, 2017). To reduce this uncertainty, the proposed workflow conducts a comparative analysis of confusion matrix for various attribute pairs. P-wave impedance and nature gamma (GR) are selected as the optimized pair of attributes for lithofacies classification.
Another problem is that, coal seams are characterized by low P-wave impedance, forming a strong impedance contrast with surrounding strata and high seismic reflection coefficient. In scenarios with low seismic resolution, the strong seismic reflections interfere with weaker adjacent reflections, leading to the appearance of strong amplitudes on seismic profiles. This phenomenon presents a challenge to precisely delineate sandstone formations adjacent to coal seams for conventional inversion methods, including conventional post-stack inversion and pre-stack amplitude versus offset (AVO) inversion, among others (Veeken and Da Silva, 2004; Phan and Sen, 2018; Yuan et al., 2019). To address this challenge, we utilize a seismic waveform indication inversion approach, which imports horizontal waveform similarity to invert for high-frequency geological data from well logs, thus achieving high-resolution inversion. In recent years, waveform indication inversion techniques have gradually been applied to thin reservoir prediction, sand body identification and boundary delineation, carbonate reservoir type recognition, and exploration of subtle hydrocarbon traps, yielding favorable application outcomes (Gao et al., 2017; Duan, 2019). Gu et al. (2017) employed seismic waveform indication inversion techniques, thereby enhancing the resolution of inversion results and effectively addressing the prediction of thin sandstone reservoirs under conditions of strong amplitude masking.
It is a complex nonlinear classification issue for lithofacies identification using seismic attributes. Discriminant analysis, Bayesian inference, neural network modeling, support vector machine (SVM), and K-nearest neighbors (KNN) classification are prevalent methodologies employed in classification techniques (Mukerji et al., 2001; Baddari et al., 2009; He et al., 2022). Among these, Bayesian classification is recognized for its advanced and extensively applied nature (Avseth et al., 2005; Grana, 2018). Bayesian classification methods exploit the seismic likelihood function, coupled with a set of a priori information (derived from well log data), to calculate a posterior probability, which quantify the likelihood of each sample belonging to a specific lithological class (Grana, 2016; Aleardi and Ciabarri, 2017). Furthermore, within the Bayesian framework, a 1D Markov chain a priori model, in the form of a transition probability matrix, is often incorporated as additional priori information to ensure the vertical continuity of the lithofacies (Larsen et al., 2006; Wang et al., 2019).
We first employ a multi-attribute high-resolution waveform indication inversion technique to obtain the 3D of GR and P-wave impedance, thereby achieving a detailed characterization of deep coal seams. Then, to interpret different lithofacies from elastic parameters of seismic inversion, the statistical rock-physics technique in Mukerji et al. (2001) and Avseth et al. (2005) is subsequently applied to GR and P-wave impedance volumes. This enables the realization of refined coal seam description and prediction of the lithology of the coal seam roof and floor. This proposed workflow is demonstrated by application to synthetic data and real seismic data from the Ordos Basin in China. The results show that the method can identify coal seams as thin as 3 m, thereby enhancing the accuracy of prediction.
2 Geologic information
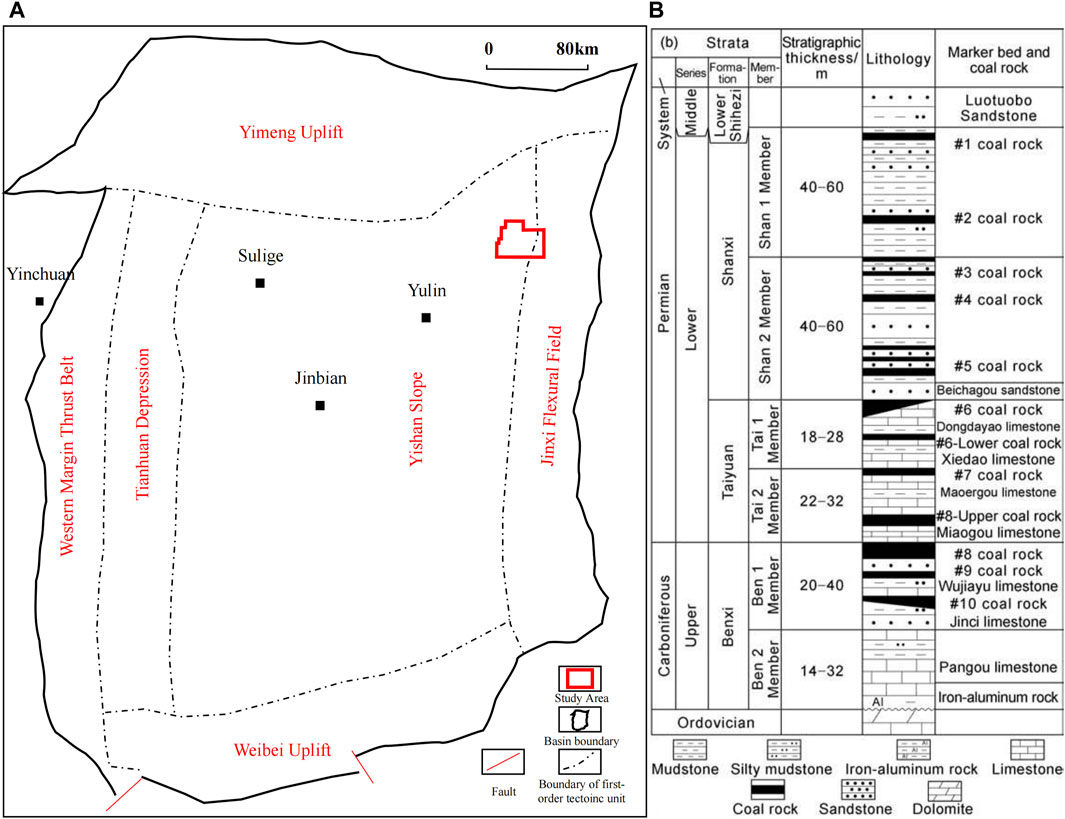
The study area (H area) is located in the east margin of Ordos Basin, as depicted in Figure 1. It is tectonically positioned within the northeastern extremity of the Yishan Slope and the western region of the Shanxi Fold Belt, characterized by a topography that inclines from the northeast to the southwest. Within the region, the Upper Paleozoic Carboniferous-Permian strata are developed, which from the base to the top, sequentially manifest a transition from marine-terrestrial intercalated strata to terrestrial deltaic deposits. Furthermore, the Benxi Formation, influenced by the sedimentary environment of the study area, exhibits a facies transition from delta front to lagoon-tidal, leading to horizontally discontinuous sand body development and vertically complex lithological assemblages. The principal hydrocarbon source rocks are the No.8+9 and No.4+5 coal seams. Analysis of drilled wells within the study area reveals that the No.8+9 coal seam of the Benxi Formation possesses a thickness that varies between 3 and 20 m, averaging 11.5 m, and is buried at depth about 1,500 m. It is classified within the deep CBM category. The metamorphic grade of the No. 8+9 coal seam increases progressively with greater burial depth, with a vitrinite reflectance value ranging from 0.8% to 0.9%, classifying it as a medium rank CBM (Qin et al., 2021; Zhu et al., 2022).
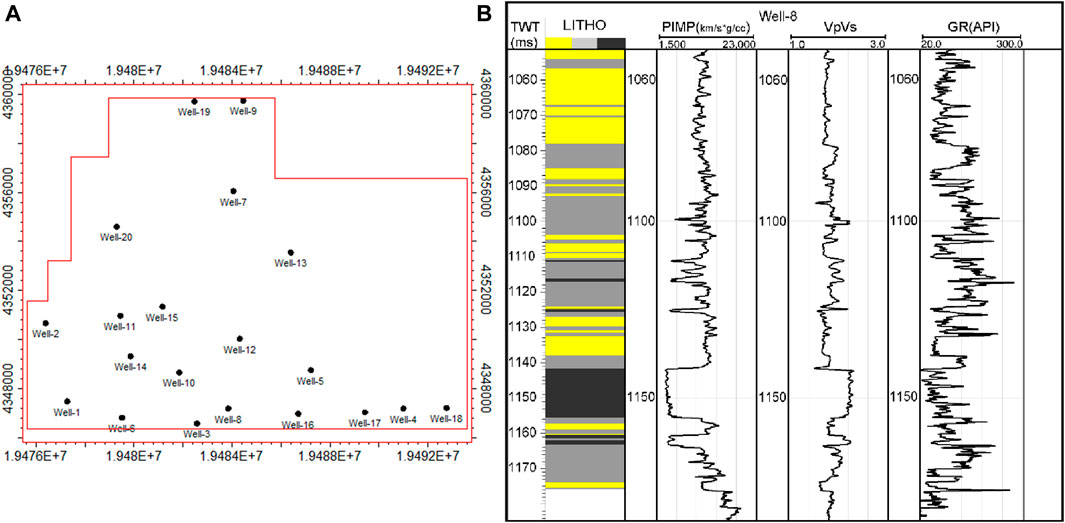
Within the study area, a total of 20 wells have been drilled. This research classifies the lithologies within the study area into three categories including sandstone, shale and coal seams based on the analysis of porosity, mineral content and water saturation well log curves. Figure 2 presents the spatial distribution of the aforementioned 20 wells, alongside the elastic parameter curves and the true vertical lithofacies profile derived from the actual well log measurements for Well 8. The lithofacies profile utilizes yellow color for sandstone, black for coal seams, and gray for shale. The majority of the wells are situated in the southern sector of the operational area. Logging interpretations indicate that the thinnest coal seam observed within 20 wells is a mere 3 m in thickness. Concurrently, the dominant frequency of the existing seismic dataset is around 35 Hz, a value substantially lower than the minimum resolution necessary for seismic discrimination of such thin layers. This discrepancy presents a significant challenge to the precise characterization of deep CBM reservoirs.
3 Methodology
Figure 3 delineates the workflow for lithofacies prediction within coal-bearing strata. It encompasses four main stages: 1) Log curve upscaling. Utilizing the Backus averaging theory (Gelinsky and Shapiro, 1997), log curves are up-scaled to match the well-seismic scale precisely, ensuring precise scale match between well data and seismic information. 2) Seismic attribute pair selection. Initially, kernel density estimation (KDE) is applied to derive the probability density functions (PDFs) for various seismic attribute pairs. These PDFs act as likelihood functions within the Bayesian classification framework. Also, the corresponding Bayesian confusion matrix for each pair is calculated to assess the classification efficacy of each attribute pair. The objective of this stage is to identify the seismic attribute pair that exhibits the greatest sensitivity to sandstone and shale. 3) High-resolution seismic inversion. Utilizing the selected pair of attributes in step 2), seismic waveform indication inversion is executed, integrating well log data alongside seismic data. This process yields high-resolution results of P-wave impedance and GR. 4) Seismic attributes interpretation. Constructing upon the foundation laid in step 2), PDFs derived from well logs are applied to conduct Bayesian classification of seismic attributes volumes. This stage interprets seismic data into discernible lithological categories in accordance with the relationships previously defined.
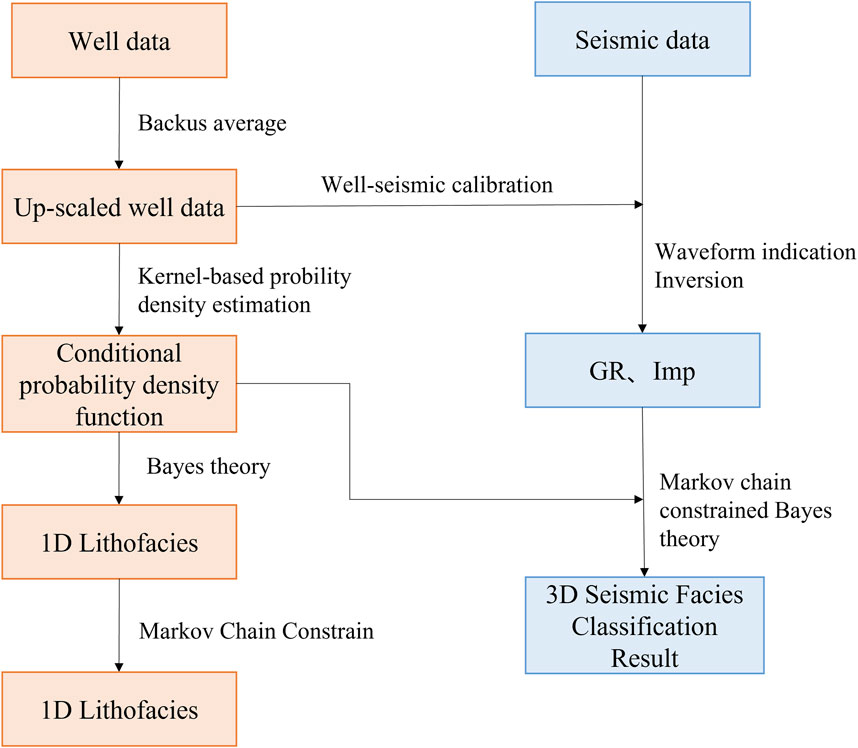
Figure 3. Flow chart of the deep coal lithofacies prediction technology based on high-resolution seismic inversion.
This comprehensive workflow integrates both statistical analysis and geophysical inversion techniques to enhance the precision of lithofacies prediction in complex coal-bearing strata.
3.1 Well log curve upscaling
Well logs provide precise reservoir and rock physics information at the wellbore points, typically sampled at an interval of 0.125 m. Conversely, 3D seismic data offer a comprehensive reflection of subsurface geological information but are sampled at a coarser scale, conventionally around 1 ms (Cao, 2015). This disparity in vertical resolution, which can be an order of magnitude higher, impedes the direct application of well log data for seismic interpretation. The Backus equivalent averaging method is extensively employed for upscaling purpose. It accounts for the anisotropy induced in stratified media under conditions of long-wavelength, thereby enhancing the accuracy of well-seismic data correlation while maintaining the equivalence of parameters (Lindsay and Van Kouqhnet, 2001; Bayuk et al., 2008). The Backus averaging formula, adapted for isotropic media, can be reformulated to compute the vertical and horizontal wave velocities and density as follows:
where
Figure 4 illustrates the results of applying the Backus averaging scale-up process to the well log data for the work area, as depicted by the red line. An empirical value of 1/8 of the wavelet wavelength was chosen as the scale-up window for this process.
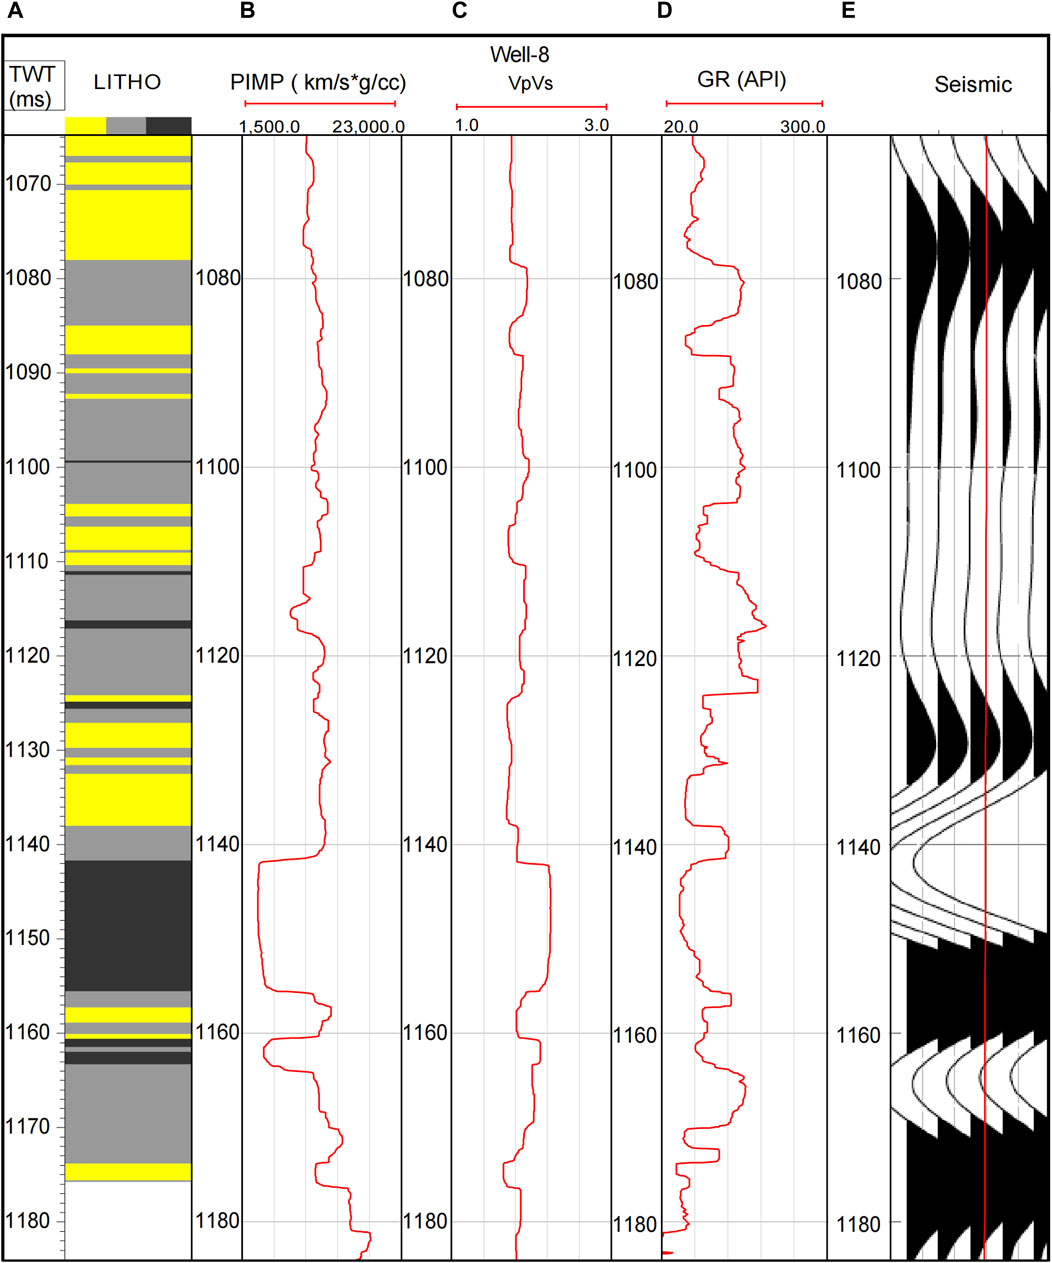
Figure 4. (A) Lithofacies distribution extracted from up-scaled well logs: shale (gray), sand (yellow), and coal (black). Up-scaled well logs of (B) P-wave impedance, (C) ratio of Vp to Vs., and (D) nature gamma ray (GR). (E) Stacked seismic traces at the well location corresponding to CDP 550.
3.2 Bayesian lithofacies classification technique
Indeed, as the burial depth increases, the elastic properties of sandstone and shale become increasingly similar (Avseth et al., 2003), which complicates the classification of lithofacies based on seismic attributes. Figure 5 presents the cross-plots of various attribute pairs for 20 wells within the study area, where black represents coal seams, yellow denotes sandstone, and gray corresponds to shale. Evidently, within these cross-plots, coal seams exhibit a distinctively low impedance characteristic, allowing clear differentiation from other lithologies. However, there is an overlap between sandstone and shale across multiple attribute pairs, which precludes a definitive distinction between each other.

Figure 5. The crossplot for lithofacies of sand (yellow), coal (black) and shale (grey) corresponding to different attribute pairs. (A) GR-Impedance, (B) Vp/Vs-Impedance.
To address the aforementioned issues, this paper utilizes Bayesian classification algorithms to conduct lithofacies classification based on various combinations of well log attributes, and introduces the classification confusion matrix (CM) to quantify the classification capability (Avseth et al., 2005; González, 2006), thereby selecting the attribute pairs with optimal discriminative power to enhance the resolution of sandstone and shale above and below coal seams. Furthermore, to enhance the accuracy and spatial continuity of the identifications, this paper also establishes a Markov chain prior model to incorporate the interrelationships between neighboring points as spatial constraints (Larsen et al., 2006).
The Bayesian classification algorithm bases its categorization on the probability densities of classes, achieving statistically optimal classification results. Assuming there are n lithofacies to be differentiated, represented by
where
where m represents the total number of known samples, h represents the bandwidth (or smoothing parameter), x signifies a random sample point,
In geology, it is commonly assumed that stratigraphic sequences exhibit Markov properties (Eidsvik et al., 2004). Incorporating these Markov properties into a prior model enhances the posterior probabilities to better align with the characteristics of the depositional process, thereby improving the accuracy of lithology identification. The fundamental assumption of a first-order Markov chain is that the probability distribution of lithofacies at given time t depends solely on the lithofacies category at the immediately preceding time t − 1, and is independent of all other previous states. Thus, the evolution of a Markov chain through time can be viewed as transitions between different states, which are represented by a transition probability matrix
where
Figure 6 presents PDFs for different lithofacies, which have been derived from upscaled well data using various attribute pairs. In accordance with the observations from the attribute cross-plots, PDFs for sandstone and shale exhibit overlapping regions. Furthermore, a comparison of the probability density function graphs reveals a greater overlap for sandstone and shale when using the Vp/Vs-Impedance attribute pair rather than the GR-Impedance attribute pair, suggesting that the GR-Impedance attribute pair offer enhanced discriminatory potential between sandstone and shale. Subsequently, we shall demonstrate lithofacies classification utilizing well data to substantiate this assertion. Utilizing Well-8 as an illustrative case, the classification of lithofacies is executed employing PDFs derived from Equation 4. The classification is subsequently conducted applying the Bayesian rule outlined in Equation 3, succeeded by the calculation of a confusion matrix to evaluate the efficacy of the classification. The diagonal elements of the confusion matrix represent the probabilities of correct classifications, for instance, signifies the probability that a sample truly belonging to class 1 is classified as class 1.

Figure 6. Probability density functions of lithofacies corresponding to different pairs of attributes (A) GR–Impedance, (B) Vp/Vs–Impedance.
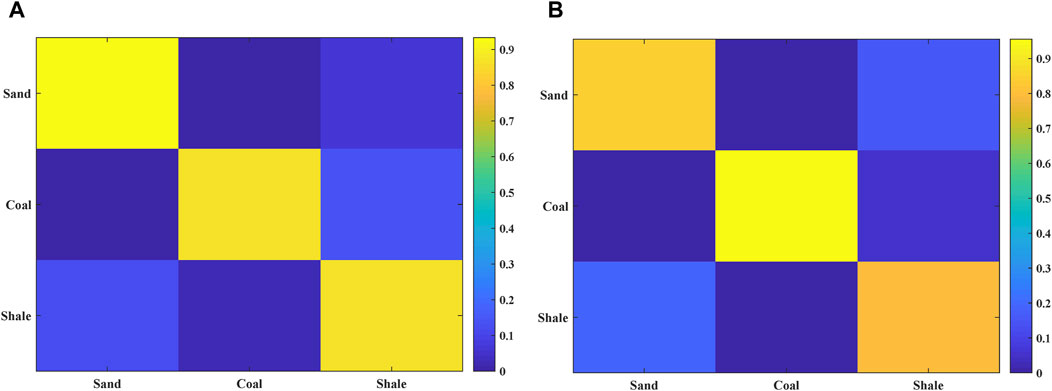
Figure 7 delineates the classification outcomes utilizing distinct attribute pairs. Specifically, Figure 7A displays the log curves of the target layer and the interpreted lithology from Well-8, Figure 7B illustrates the lithology classification outcome employing the GR-Impedance attribute pair, and Figure 7C represents the classification result utilizing the Vp/Vs-Impedance attribute pair. It is evident that the Vp/Vs-Impedance pair’s lack of sensitivity to sandstone and shale lithofacies results in numerous misclassifications, notably within the interval ranging from 1750 m to 1800 m. Figure 8 presents the confusion matrix results for the aforementioned attribute pairs, with yellow denoting high discriminatory power and blue signifying low discriminatory power. Clearly, the GR-Impedance attribute pair exhibits superior discrimination across all three lithofacies. The GR-Impedance attribute combination displays the most robust capability for lithology classification. This analysis leads to the conclusion that the GR-Impedance attribute pair accurately classifies each lithofacies type with a probability that surpasses 80%, indicative of its high lithology classification capacity. Consequently, this attribute pair is chosen for the computation of conditional probability density functions and is designated as the definitive inversion parameters for subsequent inversion procedures.
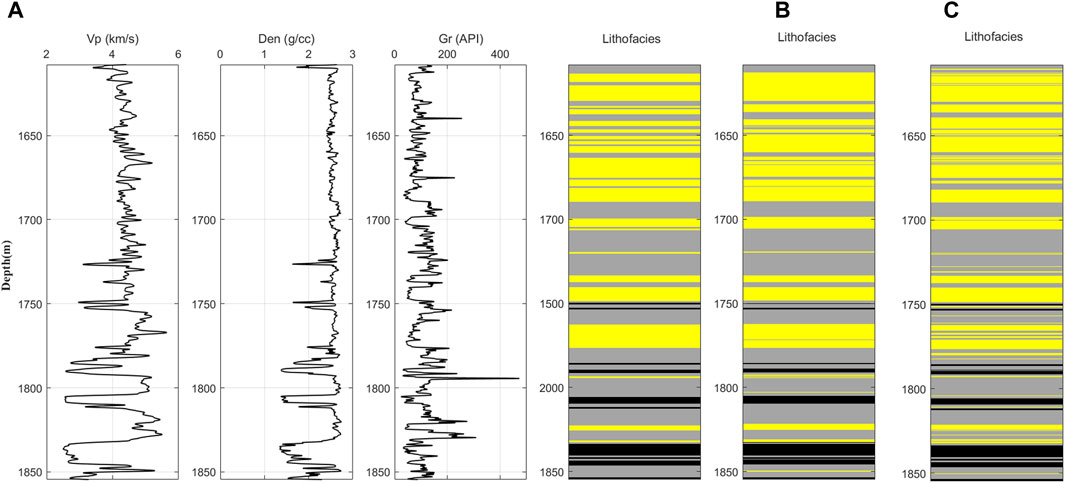
Figure 7. (A) Real lithofacies distribution and well curves extracted from Well-8, (B) Bayesian classification based on GR-Impedance elastic attributes, and (C) Bayesian classification based on Vp/Vs-Impedance elastic attributes.
3.3 Seismic waveform indication inversion
According to statistical data from 20 wells drilled in the area, the No. 8 + 9 coal seam thickness ranges from 3 to 20 m and exhibits a vertical pattern characterized by an intercalation of continuous and bifurcated deposition. At low seismic resolution, the strong seismic reflection signature from coal seams has a tendency to obscure weaker reflections. The acquired seismic data, with a dominant frequency of approximately 35 Hz, renders conventional inversion incapable of accurately predicting thin coal seams and the lithology of their roof and floor, thereby hampering the effective identification of sweet spots for deep coalbed methane reservoirs.
The aforementioned study has identified P-wave impedance and GR attributes as the optimal pair for lithofacies discrimination. To achieve the high-resolution seismic attributes, a waveform indication inversion method is introduced to the study. Researches have revealed that well log curves and their corresponding seismic traces exhibit certain degree of similarities within defined frequency bands (Wang et al., 2022). Leveraging this characteristic, seismic waveform indication inversion establishes a mapping relationship between the high-frequency information of well logs and seismic waveform, thereby enhancing the lateral and vertical resolution of the inversion results.
The principle of waveform indication inversion is herein simplified as follows. Implement dynamic clustering analysis of seismic waveforms through singular value decomposition, to obtain the correspondence between different reservoir types of seismic waveforms and the characteristics of well logging curves, establish an initial sample set, and carry out waveform indication inversion under the Bayesian framework for different reservoir types. Assuming that the noise adheres to a Gaussian distribution, the posterior probability distribution of the model parameters within the Bayesian framework is articulated as:
where the vector
The solution where the probability is maximized in Equation 6 is the final solution of the inversion, that is, the maximum a posteriori probability solution. By taking the logarithm of both sides of Equation 6 and omitting parameters that are irrelevant to the solution, the objective function is obtained.
To maximize the posterior probability, we differentiate the above equation with respect to the model parameters and obtain:
Taking the derivative of the above equation with respect to the model parameter, and setting it to zero, yields the point of maximum posterior probability. At this point, the perturbation can be determined as follows:
Substituted into the objective function, the maximum probability is the answer of the inversion problem. The final inversion result approximates the sample data by the perturbation of the iteration model.
The specific process of seismic waveform indication inversion can be divided into three steps: 1) Each seismic trace is individually compared with the borehole nearby traces, and the top N wells with the highest similarity are selected, where N represents the number of effective samples. Log curves from these top N wells are taken and, using singular value decomposition, waveform clustering techniques are applied to establish a mapping relationship between seismic traces and log curve samples, forming a sample set. 2) Employing wavelet transform technology, the log curves in the sample set are decomposed into information across different frequency ranges. Common structural features in the low-to-middle frequency components are extracted and used to construct the initial model. 3) Based on seismic data, relative impedances are derived, and in conjunction with well log data, absolute impedances are calculated to establish a likelihood function. Grounded in Bayesian theory, Markov Chain Monte Carlo (MCMC) stochastic simulation is employed to introduce random perturbations to the initial model, ensuring the inversion results conform to both middle-frequency seismic information and well log structural characteristics. Here, the MCMC method is employed to calculate the expected value of complex posterior distributions. The concrete implementation of MCMC algorithm using in Seismic waveform indicated inversion is Metropolis Hastings Sampling. The idea of MH is to construct a Markov chain that tends to converge to a stationary distribution, which then converges to the posterior probability. Utilizing this framework to derive sampling samples facilitates the computation of the target expected value, bypassing the need to directly engage with the posterior probability. If conformity is not met, the perturbation process is iteratively repeated until inversion results that meet the criteria are obtained.
3.4 Field data results
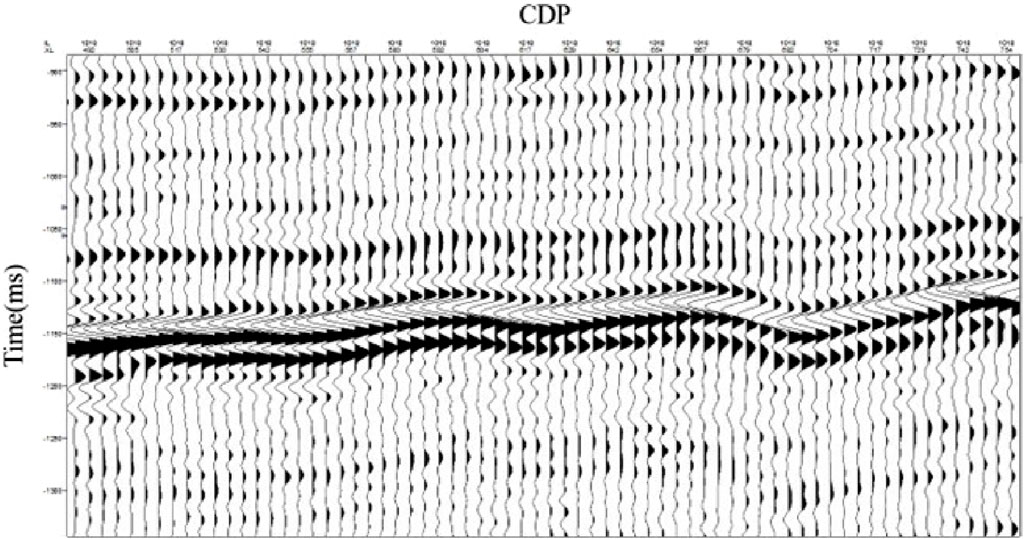
We conduct an application of proposed lithofacies identification workflow on 3D seismic data from Ordos Basin as an example to test the prediction effect of the proposed method. Figure 9 presents a seismic profile near wellbore. The predominant frequency of the 3D seismic data for the target stratum is 35 Hz, with an average P-wave velocity of the formation at 4,200 m/s. Based on the Rayleigh criterion (Kallweit and wood, 1982), the maximum reservoir thickness identifiable by seismic data is approximately 30 m, which is clearly insufficient for the identification of thin interbedded sand bodies in the roof and floor strata.
The selected inversion parameters are enumerated as follows: smoothing radius = 1, number of effective samples = 5, optimal cut-off frequency = 300 Hz, and target sampling rate = 0.2 ms. The smoothing radius parameter exerts an influence on the lateral resolution of the inversion results, whereas the optimal cut-off frequency impacts the vertical resolution. Figure 10A displays the P-wave impedance inversion result section, wherein blue indicates low P-wave impedance values, associated with coal seams, and red denotes high P-wave impedance values, indicative of sandstone and shale. It illustrates the efficacy of the inverted P-wave impedance in the delineation of coal seams. Furthermore, this study implemented waveform indication inversion on a GR data volume, as depicted in Figure 10B, where blue signifies low GR values, corresponding to coal seams and sandstones, and red indicates high GR values, characteristic of shale. This figure elucidates the discriminatory capability of GR between sandstones and shale. Additionally, Figure 10C portrays the traditional post-stack impedance inversion, from which it is evident that it possesses a lower resolution compared to the aforementioned results.
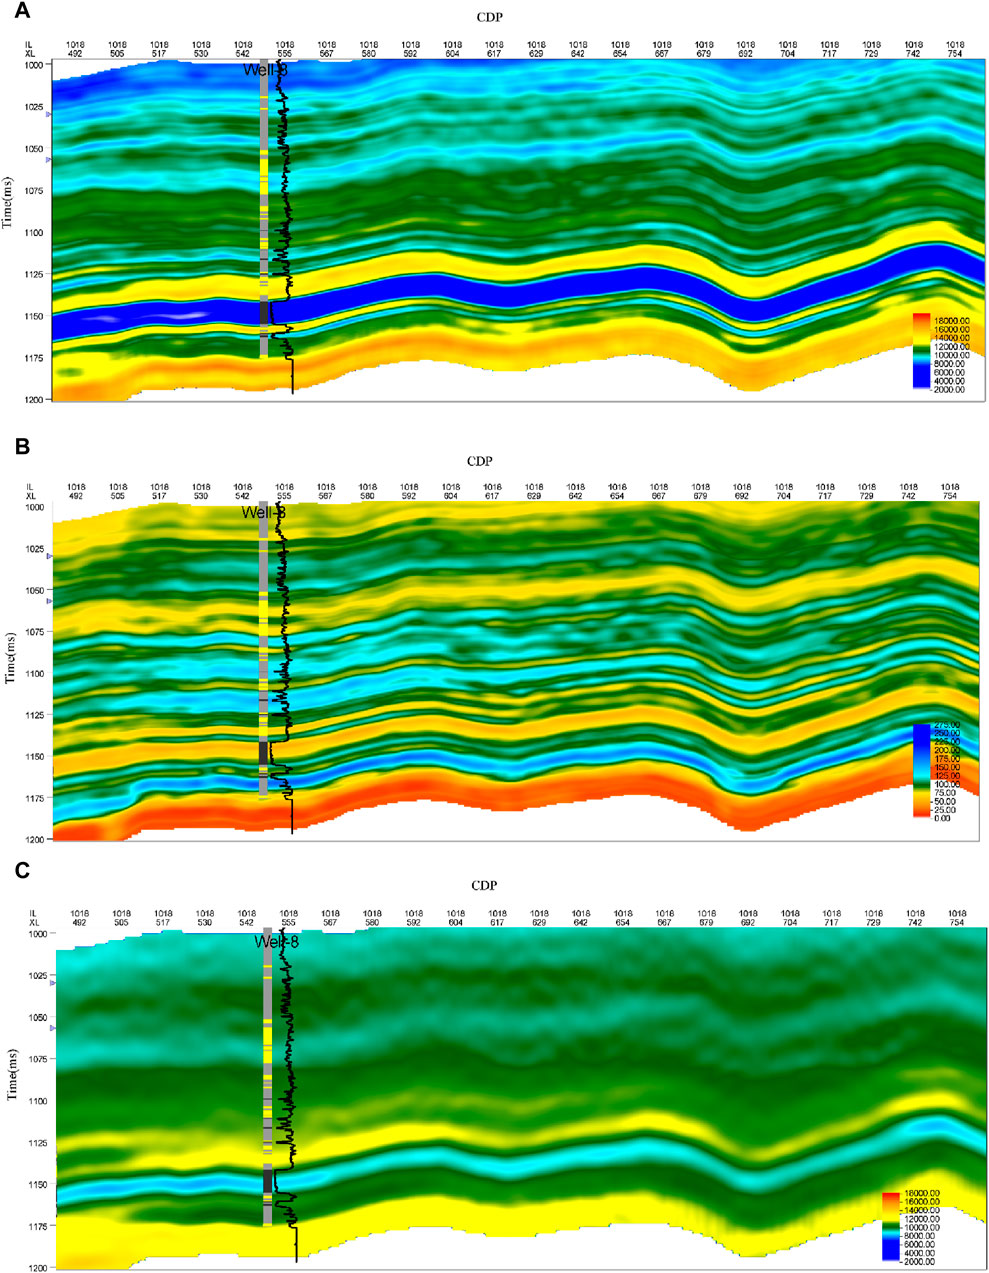
Figure 10. (A) High resolution seismic waveform indication inversion of P-impedance, (B) high resolution seismic waveform indication inversion of GR, (C) conventional post-stack inversion of P-impedance.
Utilizing the high-resolution P-wave impedance and GR data volumes from the prior inversions, this study employed the Bayesian classification theory for lithofacies classification. And the Markov chain prior information of Bayes frame is derived by using Equation 4. To accurately describe the thickness distribution of the target layer, a time-depth conversion was also performed on the time domain results, utilizing a velocity model derived from the seismic data processing workflow. The software implementation details of the time-depth conversion are not discussed here. The 3D lithofacies data volume provides a directly depiction of coal seam thicknesses and the lithologies of the roof and floor strata.
Figure 12A shows the lithofacies prediction results based on the Vp/Vs-Impedance attribute pairs, where the Vp/Vs attribute is obtained by model-based pre-stack inversion, while the impedance attribute is obtained by traditional post-stack inversion. The lithofacies profile using proposed workflow is illustrated in Figure 12B. Compared with Figure 12A, the results in Figure 12B exhibit a more significant concordance with the interpretations derived from well logs. And moreover, the figure illustrates that the new method is capable of identifying thin coal seams as little as 3.3 m thick. To quantitatively evaluated the goodness of the results, the diagonal element confusion matrix is introduced here. It is calculated using the classification results at well location and true vertical lithofacies profile derived from the actual well log measurements for Well 8. The prediction accuracy of sand, coal, shale for proposed workflow is [0.90 0.86 0.85]. The prediction accuracy of sand, coal, shale for traditional inversion is [0.80 0.85 0.75]. The results show the proposed workflow exhibits a higher accuracy rate.
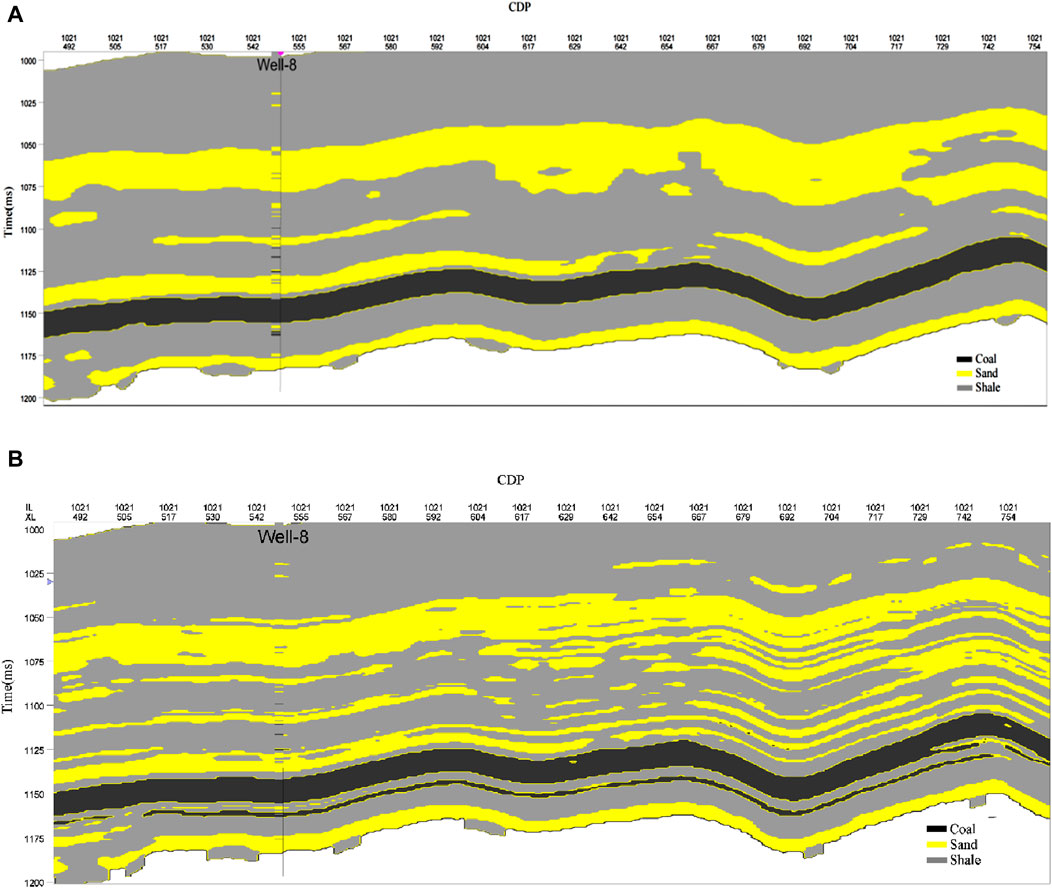
Figure 12. Classification results of lithofacies at well location. (A) Classification results based on traditional inversion (B) classification results based on proposed method.
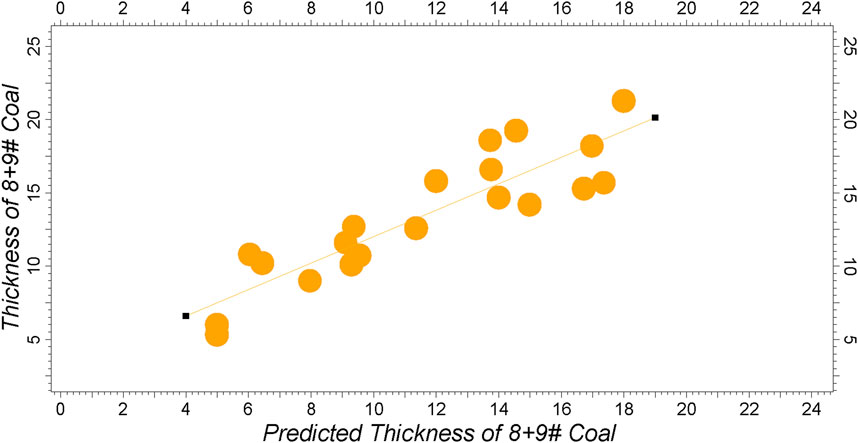
By statistically analyzing the depth-domain inversion results at well locations for the No. 8+9 coal seam thickness, it was found that the predicted thicknesses from 20 wells correlate with the actual thicknesses with a coefficient of 0.89, as shown in Figure 13. This substantiates the precision of the lithofacies classification results.
To further emphasize the superiority of the aforementioned method in terms of vertical resolution, Figure 11 presents the inversion outcomes alongside actual well log curves, where black solid lines denote logging data and red solid lines denote inversion results. The correlation coefficient between the P-wave impedance inversion and well logs attain a value of 0.91, whereas the coefficient for the GR simulation is 0.88. These inversion results indicate that the technique enhances inversion resolution and improves the accuracy of coal seam characterization.
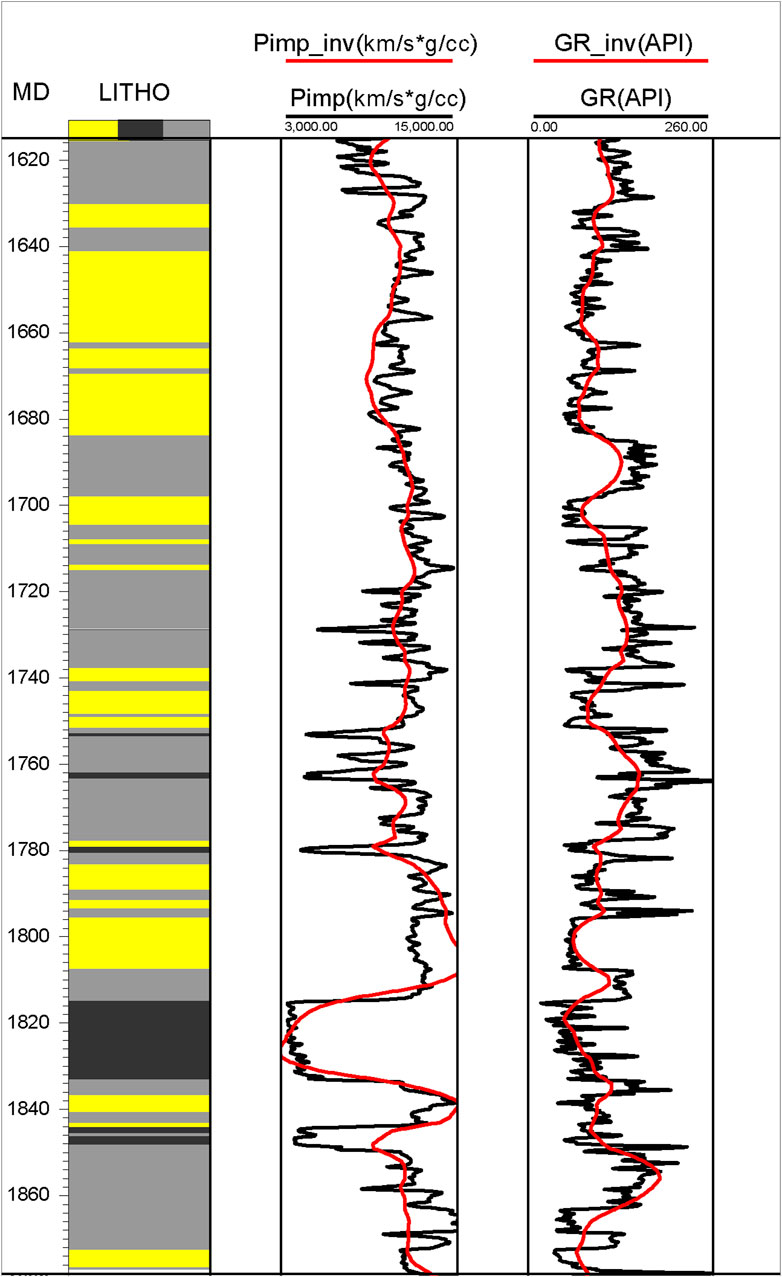
Figure 11. Comparison between the inversion results (red) and real well data (black) of P-impedance and GR for Well-8.
Figure 14 shows extracted layer slice attributes from the lithofacies data volume. Figure 14A presents a plan view map of the No. 8+9 coal seam thickness distribution across the study area, revealing extensive development of thick coal seams in the southern-central part, indicative of pre-coal peat swamp and post-coal formation interdistributary bay development zones. Figure 14B depicts the distribution of sandstone thickness within the upper 10 m of the coal seam roof across the study area, showing the development of underwater distributary channels in the western part, where thicker sandstones have been deposited. Figure 14C illustrates the distribution of sandstone thickness within the lower 10 m of the coal seam floor across the study region, with two underwater distributary channels distributing sandstones on the east and west sides. These findings align with sedimentological understandings. The above analysis indicates that the proposed lithofacies prediction method has been well applied in Ordos Basin, and the obtained 3D lithofacies cube is of guiding significance to the exploration and development of deep CBM.
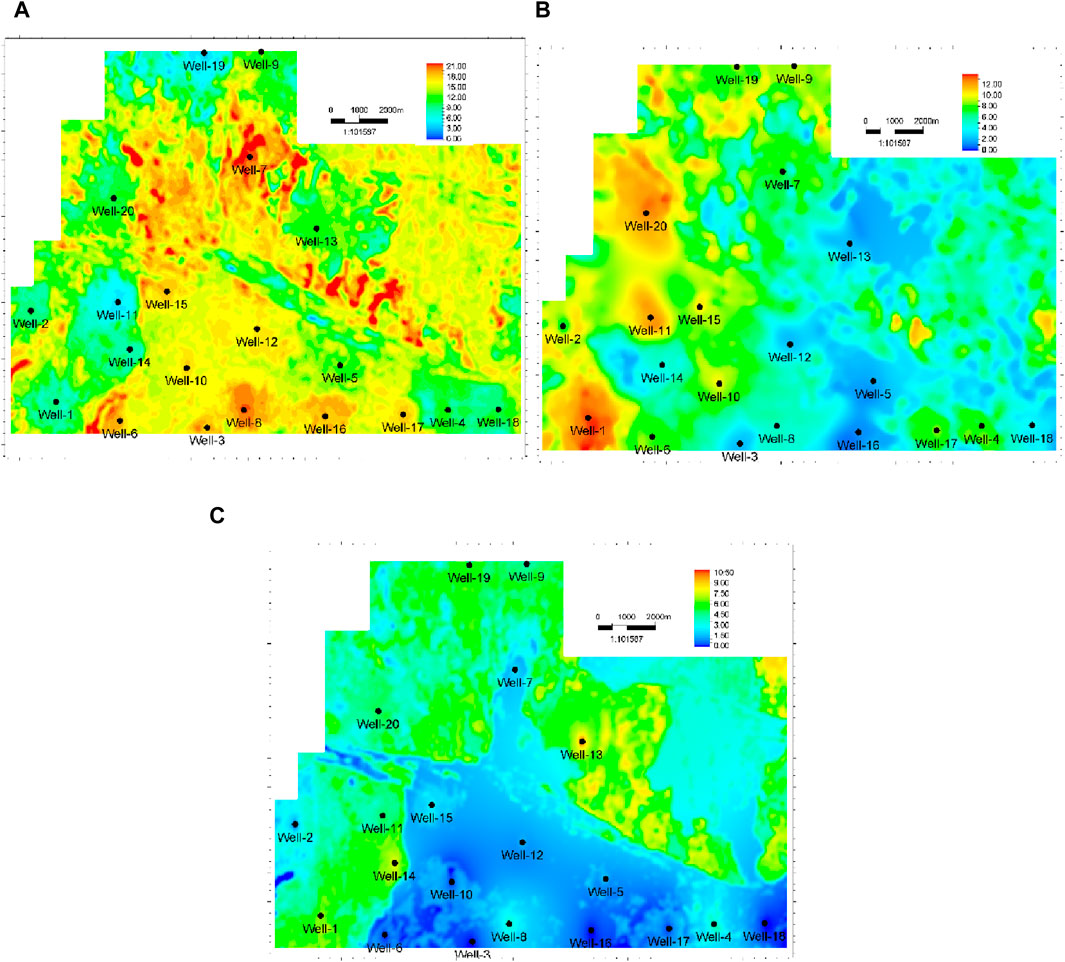
Figure 14. Distribution characteristics of (A) the coalbed thickness of No.8 and No.9 coal seam, (B) the thickness of roof sand of No.8 and No.9 coal seam and (C) the thickness of floor sand of No.8 and No.9 coal seam.
4 Discussion
The representation of deep CBM reservoir lithofacies as a 3D model has advantages in recognizing productive zones of CBM reservoirs, designing horizontal wells and hydraulic fracturing. It is used to build and analyze the distribution of deep coal and roof/floor lithofacies in a 3D space, which is important to better understand the local and regional scale distribution of CBM productive zones. Though we have provided a new solution for the identification of roof and floor lithofacies of deep CBM reservoir, this workflow can be improved for better application.
The method mainly includes waveform indication inversion and Bayesian lithofacies classification. With respect to waveform indication inversion, the selected attributes to be inverted is not limited in using P-wave Impedance and GR. For the discrimination of shale and sand, research indicates that the GR can discriminate these two lithofacies effectively, and the characteristic has been applicated in Suez Rift Basin and Appalachian Basin (Grana et al., 2015). However, the selected optimized attributes may be different when it comes to different reservoirs, such as carbonate or dolomite reservoir. We suggest the discrimination ability of different attributes should be cautiously evaluated using the confused matrix or other way to allow more reliable lithofacies identification. Furthermore, Bayesian lithofacies classification has been widely used in worldwide, for instance in North Sea sandstone reservoir, shale reservoir in China (Larsen, et al., 2006; Wang, et al., 2019). The main limitation of the case study is that the prior information about the spatial correlation in horizontal for the lithofacies model has not been taken into account. Numerically, the prior model on the lithofacies classes can be characterized by a Markov random field instead a Mrkov chain that captures the locally vertical and horizontal continuities (Larsen et al., 2006; Ulvmoen and More, 2010). This should be considered in future work.
5 Conclusion
A new seismic interpretation workflow based on high resolution seismic waveform indication inversion and Bayesian classification is proposed to enable the lithofacies identification of the deep coal-bearing strata. P-wave impedance and GR are selected as the optimized pair of attributes to classify three lithofacies including shale, tight sand and coal. The seismic waveform indication inversion method is used for reducing the effect of coal shielding on adjacent reflecting layers to obtain high-resolution results of P-wave impedance and GR. A Markov chain is applied to maintain the spatial continuity of the lithofacies classification. This study, taking the Block H in Ordos Bain, China as an example, has established a comprehensive workflow for predicting 3D lithofacies volumes. This methodology has demonstrated the capability to discern coal seams with a minimal thickness of 3.3 m. Furthermore, the coal seam thicknesses predicted from the lithofacies data volume exhibited a significant correlation coefficient of 0.89 with the real measured thicknesses, thus achieving a quantitative characterization of the coal seams and the lithology of the roof and floor strata. Despite the existence of thinner reservoir layers that may lie beneath the resolution threshold of seismic data, along with the pronounced lateral variability in rock properties and fluid phases, the research outcomes remain satisfactory. However, to substantiate these findings, the drilling of additional wells represents a viable option for further validation. The 3D lithofacies model obtained from the workflow provides a good basic data for development of deep CBM, and has great potential to be applicated in other region or depth. Nevertheless, in regard to considering horizontal continuities, there is still room for this proposed lithofacies identification method for deep CBM reservoir.
Data availability statement
The original contributions presented in the study are included in the article/supplementary material, further inquiries can be directed to the corresponding author.
Author contributions
YQ: Writing–original draft, Writing–review and editing. KW: Writing–review and editing. BW: Writing–review and editing, Writing–original draft. XZ: Writing–review and editing. Wenlan Li: Writing–review and editing. DL: Writing–review and editing.
Funding
The author(s) declare that financial support was received for the research, authorship, and/or publication of this article. This study was supported by the “14th Five-Year Plan” major science and technology project of China National Offshore Oil Corporation, topic 1“Standards for Geological and Engineering Parameters of Coalbed Methane and Evaluation Technology for Sweet Spots” (KJGG 2022-1001).
Conflict of interest
Authors YQ, KW, BW, XZ,and WL were employed by CNOOC Research Institute Ltd.
Publisher’s note
All claims expressed in this article are solely those of the authors and do not necessarily represent those of their affiliated organizations, or those of the publisher, the editors and the reviewers. Any product that may be evaluated in this article, or claim that may be made by its manufacturer, is not guaranteed or endorsed by the publisher.
References
Aleardi, M., and Ciabarri, F. (2017). Application of different classification methods for litho-fluid facies prediction: a case study from the offshore Nile Delta. J. Geophys. Eng. 14 (5), 1087–1102. doi:10.1088/1742-2140/aa7301
Avseth, P., Flesche, H., and Van Wijngaarden, A. J. (2003). AVO classification of lithology and pore fluids constrained by rock physics depth trends. Lead. Edge 22 (10), 1004–1011. doi:10.1190/1.1623641
Avseth, P., Mukerji, T., and Mavko, G. (2005). Quantitative seismic interpretation. Cambridge University Press.
Baddari, K., Aïfa, T., Djarfour, N., and Ferahtia, J. (2009). Application of a radial basis function artificial neural network to seismic data inversion. Comput. and Geosciences 35 (12), 2338–2344. doi:10.1016/j.cageo.2009.03.006
Bayuk, I. O., Ammerman, M., and Chesnokov, E. M. (2008). Upscaling of elastic properties of anisotropic sedimentary rocks. Geophys. J. Int. 172 (2), 842–860. doi:10.1111/j.1365-246x.2007.03645.x
Cao, D. P. (2015). The upscaling method of the well logging data based on Backus equivalence average method. Geophys. Prospect. Petroleum (in Chinese) 1, 105–111. doi:10.3969/j.issn.1000-1441.2015.01.015
Duan, N. (2019). Application of prestack seismic waveform indicates inversion in thin reservoir prediction. Progress in Geophysics (in Chinese) 34, 523–528. doi:10.6038/pg2019CC0023
Eidsvik, J., Mukerji, T., and Switzer, P. (2004). Estimation of geological attributes from a well log: an application of hidden Markov chains. Mathematical Geology 36, 379–397. doi:10.1023/b:matg.0000028443.75501.d9
Fan, D. L., Wang, Z. L., Li, J., and Wang, Y. Y. (2024). Analysis of domestic and international oil and gas resources situation in 2023 and outlook. China Mining Magazine 33 (1), 30–37. doi:10.12075/j.issn.1004-4051.20240076
Gao, J., Bi, J. J., Zhao, H. S., and Fu, Z. F. (2017). Seismic waveform inversion technology and application of thinner reservoir prediction. Progress Geophysics (in Chinese) 32, 142–152. doi:10.6038/pg20170119
Gelinsky, S., and Shapiro, S. A. (1997). Poroelastic Backus averaging for anisotropic layered fluid-and gas-saturated sediments. Geophysics 62 (6), 1867–1878. doi:10.1190/1.1444287
González, E. F. (2006). Physical and quantitative interpretation of seismic attributes for rocks and fluids identification. Stanford University.
Grana, D. (2016). Bayesian linearized rock-physics inversion. Geophysics 81 (6), D625–D641. doi:10.1190/geo2016-0161.1
Grana, D. (2018). Joint facies and reservoir properties inversion. Geophysics 83 (3), M15–M24. doi:10.1190/geo2017-0670.1
Grana, D., Schlanser, K., and Campbell-Stone, E. (2015). Petroelastic and geomechanical classification of lithologic facies in the Marcellus Shale. Interpretation 3 (1), 51–63. doi:10.1190/int-2014-0047.1
Gu, W., Zhang, X., Xu, M., Liang, H., Zhang, D. J., Luo, J., et al. (2017). High precision prediction of thin reservoir under strong shielding effect and its application: a case study from Sanzhao Depression, Songliao Basin. Geophysical Prospecting for Petroleum (in Chinese) 56, 439–448. doi:10.3969/j.issn.1000-1441.2017.03.014
Guo, G. S., Xu, F. Y., Liu, L. F., Cai, Y. D., Qin, W., Chen, Z. H., et al. (2024). Enrichment and accumulation patterns and favorable area evaluation of deep coalbed methane in the Fugu area, Ordos Basin. Coal Geology and Exploration 52 (2), 81–91. doi:10.12363/issn.1001-1986.23.08.0521
He, S. M., Song, Z. H., Zhang, M. K., Yuan, S. Y., and Wang, S. X. (2022). Incremental semi-supervised learning for intelligent seismic facies identification. Applied Geophysics 19 (1), 41–52. doi:10.1007/s11770-022-0924-8
Hemza, P., Sivek, M., and Jirásek, J. (2009). Factors influencing the methane content of coal beds of the Czech part of the Upper Silesian Coal Basin, Czech Republic. International Journal of Coal Geology 79, 29–39. doi:10.1016/j.coal.2009.04.003
Kallweit, R. S., and Wood, L. C. (1982). The limits of resolution of zero-phase wavelets. Geophysics 47 (7), 1035–1046. doi:10.1190/1.1441367
Kuuskraa, V., and Wyman, R. (1993). “Deep coal seams: an overlooked source for long-term natural gas supplies,” in SPE unconventional resources conference/gas technology symposium.
Larsen, A. L., Ulvmoean, M., Omre, H., and Buland, A. (2006). Bayesian lithology/fluid prediction and simulation on the basis of a Markov-Chain prior model. Geophysics 71 (5), R69–R78. doi:10.1190/1.2245469
Li, X., Yan, X., and Kang, Y. (2018). Effect of temperature on the permeability of gas adsorbed coal under triaxial stress conditions. Journal of Geophysics and Engineering 15 (2), 386–396. doi:10.1088/1742-2140/aa9a98
Lindsay, R., and Van Koughnet, R. (2001). Sequential Backus averaging: upscaling well logs to seismic wavelengths. The Leading Edge 20 (2), 188–191. doi:10.1190/1.1438908
Liu, D. M., Liu, Z. S., and Cai, Y. D. (2020). Research progress on accumulation mechanism and formation geological conditions of coalbed methan. Coal Science and Technology 48 (10), 1–16. doi:10.13199/j.cnki.cst.2020.10.001
Moore, T. A. (2012). Coalbed methane: a review. International Journal of Coal Geology 101, 36–81. doi:10.1016/j.coal.2012.05.011
Mukerji, T., Avseth, P., Mavko, G., Takahashi, I., and González, E. F. (2001). Statistical rock physics: combining rock physics, information theory, and geostatistics to reduce uncertainty in seismic reservoir characterization. The Leading Edge 20, 313–319. doi:10.1190/1.1438938
Phan, S., and Sen, M. K. (2018). Hopfield networks for high-resolution prestack seismic inversion. SEG International Exposition and Annual Meeting. doi:10.1190/segam.2018-2996244.1
Qin, Q., Cheng, H., Wang, M., Sun, M., and Zhao, L. (2021). Analyzing the wettability of tight sandstone of Taiyuan Formation in Shenfu block, eastern margin of Ordos Basin. IOP Conference Series Earth and Environmental Science 671 (1), 012022. doi:10.1088/1755-1315/671/1/012022
Saghafi, A., Javanmard, H., and Roberts, D. (2010). “Parameters affecting coal seam gas escape through floor and roof strata,” in Proceedings of the 2010 Coal Operators’ Conference, Mining Engineering, University of Wollongong, February 18–20, 2019.
Ulvmoen, M., and More, H. (2010). Improved resolution in Bayesian lithology/fluid inversion from prestack seismic data and well observations: Part 1 — methodology. Geophysics 75 (2), R21–R35. doi:10.1190/1.3294570
Veeken, P. C. H., and Da Silva, A. M. (2004). Seismic inversion methods and some of their constraints. First Break 22 (6), 47–70. doi:10.3997/1365-2397.2004011
Wang, J., Li, Z., Chen, C., and Meng, C. (2022). Predicting gas content in coalbed methane reservoirs using seismic waveform indication inversion: a case study from the Upper Carboniferous Benxi Formation, eastern Ordos Basin, China. Acta Geophysica 70 (2), 623–638. doi:10.1007/s11600-022-00745-3
Wang, L., Zhang, F., Li, X. Y., Di, B. R., and Zeng, L. B. (2019). Quantitative seismic interpretation of rock brittleness based on statistical rock physics. Geophysics 84 (4), IM63–IM75. doi:10.1190/geo2018-0094.1
Yuan, S. Y., Wang, S. X., Luo, Y. N., Wei, W. W., and Wang, G. C. (2019). Impedance inversion by using the low-frequency full-waveform inversion result as an a priori model. Geophysics 84 (2), R149–R164. doi:10.1190/geo2017-0643.1
Zhu, G. H., Li, B. L., Li, Z. Z., Du, J. J., Liu, Y. C., and Wu, L. F. (2022). Practice sand development trend of un conventional natural gas exploration in eastern Margin of Ordos Basin: taking Linxing-Shenfu gas field as an example. China Offshore Oil and Gas 34 (4), 16–29. doi:10.11935/j.issn.1673-1506.2022.04.002
Keywords: deep coalbed methane, lithofacies identification, seismic waveform indication inversion, bayes classification, ordos basin
Citation: Qi Y, Wu K, Wang B, Zheng X, Li W and Li D (2024) Lithofacies identification of deep coalbed methane reservoir based on high-resolution seismic inversion. Front. Earth Sci. 12:1440729. doi: 10.3389/feart.2024.1440729
Received: 29 May 2024; Accepted: 08 August 2024;
Published: 21 August 2024.
Edited by:
Sanyi Yuan, China University of Petroleum, ChinaReviewed by:
Suzhen Shi, China University of Mining and Technology, ChinaSheng Zhang, Taiyuan University of Technology, China
Copyright © 2024 Qi, Wu, Wang, Zheng, Li and Li. This is an open-access article distributed under the terms of the Creative Commons Attribution License (CC BY). The use, distribution or reproduction in other forums is permitted, provided the original author(s) and the copyright owner(s) are credited and that the original publication in this journal is cited, in accordance with accepted academic practice. No use, distribution or reproduction is permitted which does not comply with these terms.
*Correspondence: Yu Qi, cWl5dUBjbm9vYy5jb20uY24=
 Yu Qi*
 Bo Wang
 Dan Li