 Lin Teng
 Yuanyuan He
 Yan Wang1
- 1College of Civil Engineering, Qilu Institute of Technology, Jinan, China
- 2Key Laboratory of Geological Hazards on Three Gorges Reservoir Area, China Three Gorges University, Ministry of Education, Yichang, China
- 3College of Civil Engineering and Architecture, China Three Gorges University, Yichang, China
Structurally controlled slope failure in open-pit mining occurs when the shear stress acting on the geological structure exceeds its shear strength. Mining slope stability is an extremely important topic from the ramifications of safety, social, economic, environmental and regulatory factors. This study reports the engineering geological setting of a bedded mining slope in China, and evaluates its stability via a numerical approach. First, a slope profile model is constructed using a synthetic rock mass (SRM) modeling approach. More specifically, the mechanical behavior of colluvium, intact rock and discontinuities are represented by linear contact model, bonded particle model and smooth joint model, respectively. Then, the factor of safety (FOS) and instability process are investigated by integrating the discrete fracture network (DFN)-distinct element method (DEM) and strength reduction technique (SRT). In addition, shear stress analyses of colluvium and bedrock are conducted for revealing the potential failure mechanism. Finally, the well-established limit equilibrium (LEM) and finite element method (FEM) are adopted for simulation results comparison and validation.
1 Introduction
The uncontrolled rock slope failure in open-pit mining operations and quarries may cause many adverse consequences, such as loss of life, operation disruption and closure consideration (Read and Stacey, 2009). Rock slope stability is mainly governed by the discontinuities within the rock mass, e.g., fault, bedding plane and joint. An unfavorable orientation combination of major structural planes and bedding planes commonly yields a structurally controlled failure, i.e., planar, wedge or toppling (Hoek and Bray, 1981; Stead and Wolter, 2015; Gong et al., 2023). As a result, the geometrical features and mechanical behavior of discontinuities should be of great concern when aiming to evaluate rock slope stability.
The available approaches for opencast slope stability assessment include kinematic analysis, rock mass rating, analytical method, numerical method and probabilistic method (Stead and Wolter, 2015; Raghuvanshi, 2019). Kinematic method aims to investigate the potential failure modes of rock slope based on the angular relationship between discontinuities and slope surfaces, without considering the forces that cause the sliding mass to move (Hoek and Bray, 1981; Yan et al., 2022a). For this reason, it is a pure geometric method. Empirical rock mass classification systems for slope stability condition rating have been well developed (Jaiswal et al., 2024). They are effective tools, but the accuracy is strongly limited by the user’s geological experiences. The commonly mentioned analytical method is the limit equilibrium method (LEM). It calculates the factor of safety (FOS) of a generalized rock slope for both moment and force equilibrium using a searching algorithm. Different slip surfaces can be tested by varying the assumptions on the interslice forces (Zhou et al., 2019). Another analytical method is the block theory (Goodman and Shi, 1985). It aims to search key blocks from an excavation slope by integrating geometric topology and simplified LEM. The analytical methods fail to consider the complex stress-strain relationship in the rock mass and usually ignore the resistant shear forces that act on the lateral release surface (Jiang and Zhou, 2017).
To address the limitations in the LEM, numerical simulation methods are developed with the improvement of computation efficiency in the recent decade years. Continuum modelling approaches treat the extremely jointed rock mass as an equivalent medium which is meshed using triangular or quadrilateral elements in 2d (Stead and Wolter, 2015). A constitutive model allows the variety of rock mass mechanical behavior from elastic to elasto-plastic. The most common continuum numerical methods are finite element method (FEM) and finite difference method (FDM) (Bao et al., 2019a; Ren et al., 2020; Chand and Koner, 2024). Discontinuum modelling approaches focus on the simulation of joint media and block separation behavior using force-based contact models. According to the deformability and interpenetrability of the contact objects, distinct element method (DEM) and discontinuous deformation analysis (DDA) method are differentiated (Yan et al., 2020; Ma et al., 2020; Zheng et al., 2021; Cui et al., 2021). Nowadays, discrete fracture network (DFN)-DEM or coupled numerical methods (such as the finite-DEM, FDEM) provide more precise solutions on the simulation of non-persistent joint and crack propagation (Elmo et al., 2022; Li C. et al., 2022; Li X. et al., 2022). The probabilistic methods facilitate to incorporate the variety and uncertainty of rock mass properties by integrating kinematic analysis (Obregon and Mitri, 2019; Yan et al., 2022b), LEM (Du et al., 2022), block theory (Zheng et al., 2015; Xue et al., 2023) or numerical methods (Basahel and Mitri, 2019; Xing et al., 2023; Zhang and Yang, 2023). They express failure criteria in probabilistic terms and provide the probability distribution of the FOS values.
This study describes a bedded opencast slope in China, and evaluates its stability for landslide disaster mitigation. First, a rigorous numerical slope model is constructed using the synthetic rock mass (SRM) modeling approach. Then, its FOS, instability process and failure mechanism are investigated using the DFN-DEM and strength reduction technique (SRT). Finally, the slope stability simulation results are verified by comparing with the LEM and FEM.
2 Study area
2.1 Engineering geology setting
The studied open-pit mining area is located in the Hubei province, China. It is in a hill region that covered well with plants, and the relative relief height is 120 m. About 50% of the annual precipitation is concentrated from June to September, and the maximum monthly precipitation is 1,600 mm. The tectonic setting is relatively stable and no large faults cut through the mining area. The main lithology of the mining area is Ordovician limestone with a bedding orientation of 130°∠8°, and karrens are observed in the excavation face. Additionally, two steeply inclined discontinuity sets are developed in the rock mass. Their orientation are 230°∠81° and 130°∠78°, respectively. Since there are no known major structures (e.g., faults) within the immediate mining area, the stability of opencast side slope is mainly controlled by the orientation combination of minor structures (Obregon and Mitri, 2019), such as bedding planes and joints.
2.2 Slope failure mode analysis
Nine sectors are differentiated according to the slope dip direction. They are numbered from Ⅰ to Ⅸ. Stereographic analyses are conducted for all sectors, and one plot indicates that sector Ⅵ is a consequent bedding rock slope (Figure 1). Of these, the high steep excavation face is the free surface; the gentle dip bedding plane is the potential sliding surface; and the steeply inclined joints are lateral release surfaces. Under the combination of given orientations, block instabilities or even cataclinal rock slides may be trigged by torrential rainfall or human activities (Wang F. et al., 2022). For this reason, the stability of the sector Ⅵ should be carefully investigated.
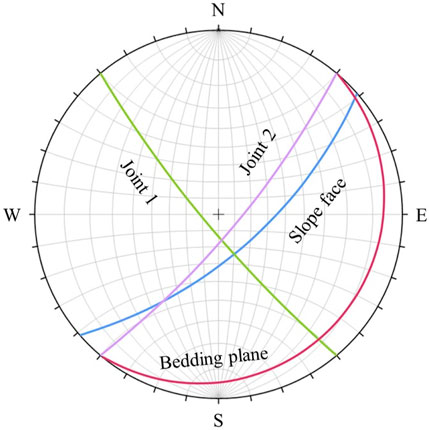
Figure 1. Stereographic analysis plot for sector Ⅵ.
2.3 Slope material properties
A typical pit slope profile of sector Ⅵ is shown in Figure 2. The slope height is 55.8 m. Colluvium deposits with an average thickness of 4.5 m are distributed on the upper and lower slope. These loose materials are a mixture of gravel (25%) and silty clay (75%). The gravel is composed of non-rounded limestone block with a diameter mainly distributed between 5 and 15 cm. The internal friction angle (φc) and cohesion (Cc)of the colluvium deposits refer to a laboratory direct shear test presented by She et al. (2018). They are 30° and 87.8 kPa, respectively. The colluvium deposits are in unconformable contact with the underlying heavy-layer limestone of the Dawan Formation. The spacing of the bedding plane is about 4 m. The strength and deformation parameters of the bedrock refer to a laboratory uniaxial compression test presented by Wang X. et al. (2022). The uniaxial compressive strength (UCS), elastic modulus (E) and Poisson ratio (ν) are 64.5 MPa, 25.1 GPa and 0.24, respectively. The shear strength parameters of discontinuities refer to the empirical values suggested by the Standard for Engineering Classification of Rock Mass. The corresponding internal friction angle (φj) and cohesion (Cj) are 42° and 0.4 MPa, respectively.
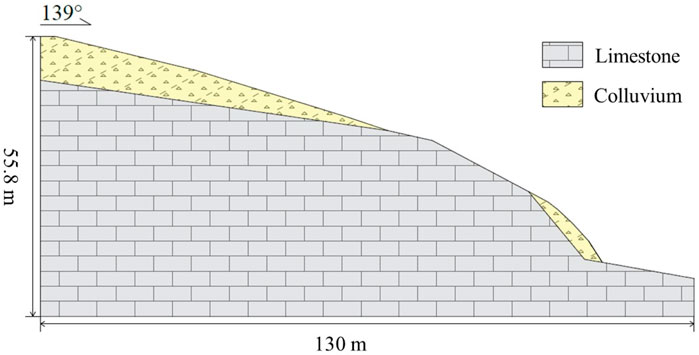
Figure 2. Slope profile of sector Ⅵ.
3 Methodologies
3.1 Distinct element method
The distinct element method (DEM) introduced by Cundall (1971) was originally used for the analysis of rock mechanics problems. It was later applied to granular material by Cundall and Strack (1979). The Particle Flow Code (PFC) can be viewed as a simplified implementation of the DEM because of the strict assumption on non-deformable particles (Itasca Consulting GroupInc, 2021). The dynamic behavior is represented numerically by a timestepping algorithm, and the solution scheme is identical to the explicit finite-difference method in continuum analysis. The calculation cycles performed in the PFC alternate between the application of Newton’s second law to the particles and a force-displacement law at the contacts (Figure 3). Following this, the velocity and displacement of a particle within each timestep can be obtained. In this study, the two dimensional PFC (PFC2D) is used for pit slope stability assessment.
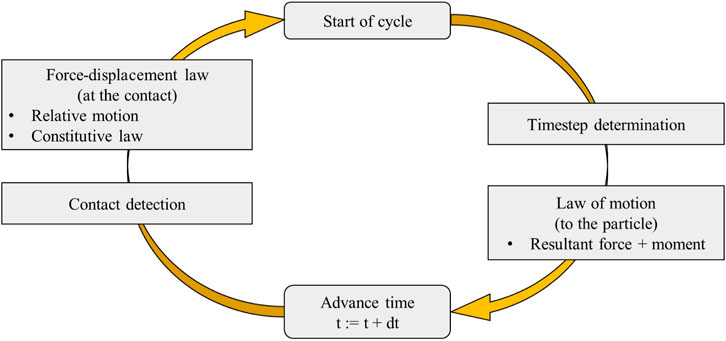
Figure 3. Calculation cycles in PFC (Itasca Consulting GroupInc, 2021).
3.2 Slope numerical model construction
Ball and wall are two fundamental body types in the PFC. Of these, ball is a rigid disk with unit thickness in 2D, while wall is a manifold surface composed of lines segments in 2D termed facets (Itasca Consulting GroupInc, 2021). Using the two elements, ball-wall and ball-ball models are available for construction of a slope numerical model (Li et al., 2012; Wei et al., 2019). The latter model is adopted mainly because that the slip surface has not been determined in this case.
Regarding the slope materials, colluvium deposits are simulated by an assembly of balls. The large and small ball elements represent soil and gravel, respectively. Note that the mass percentage within two size ranges are in accordance with onsite investigation. The mechanical behavior of colluvium deposits is modeled using the linear contact model. The bedrock is simulated using the synthetic rock mass (SRM) modeling approach (Esmaieli et al., 2010; Mas Ivars et al., 2011). To facilitate reading, an illustration of this approach is shown in Figure 4. Note that the superiority of SRM in characterizing fractured rock mass has been examined by some recent published studies (Bester et al., 2021; Zhang et al., 2021; Xing et al., 2023), thus this study follows their modelling procedures. First, the bonded particle model (BPM) proposed by Potyondy and Cundall (2004) is used to represent intact rock. Then, discrete fractures network (DFN) are generated in the intact rock to represent the in-situ joint network. Finally, by assigning the smooth-joint contact model (SJM) to the ball-ball contact that intersects with fractures, the mechanical behavior of jointed rock mass can be simulated. Regarding the boundary conditions, virtual and boundary walls are separated for model construction (Bao et al., 2019b). Of these, the former is used to create the shape of the slope and partition material zones where particles can be generated; and the latter is used to fix the displacement of the bottom particles.
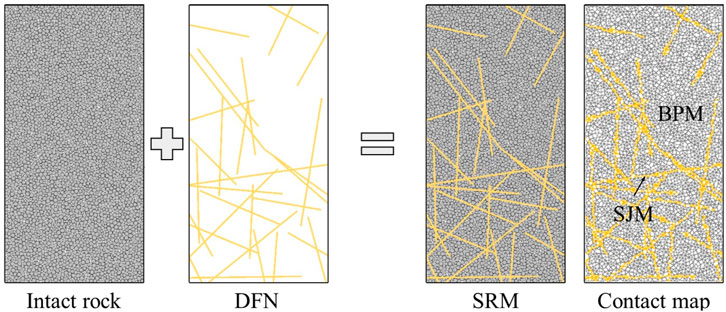
Figure 4. An illustration of the SRM modeling approach.
The area of colluvium deposits in the slope profile is 413.9 m2, and is filled by 6067 balls with radius between 0.1 and 0.15 m for soil and 0.2 and 0.25 m for gravel (yellow and blue particles in Figure 5). Upper and lower colluvium herein are differentiated by their elevations. The area of bedrock is 4,202.4 m2 where an assembly of 5914 balls with radius between 0.35 and 0.5 m are generated (gray particles in Figure 5). The number of bedding planes and joints are defined as 7 (orange lines in Figure 5) and 46 (pink lines in Figure 5), respectively. Their size and position are determined based on a detailed field investigation. Considering the significant differences in the stochasticity and persistence of the two types of geological structures, multiple geometrical parameters are assigned. More specifically, the position of bedding planes is in accordance with the field rock slope exposure, and full-persistence is assumed for such geological structure. For comparison, the joints in the slope numerical model follows a uniform distribution, and non-persistence is assumed for them. Furthermore, interval values (79–83° and 2.5–5.5 m) are assigned to simulate the variety of orientation and trace length involved in the dominant joint sets.
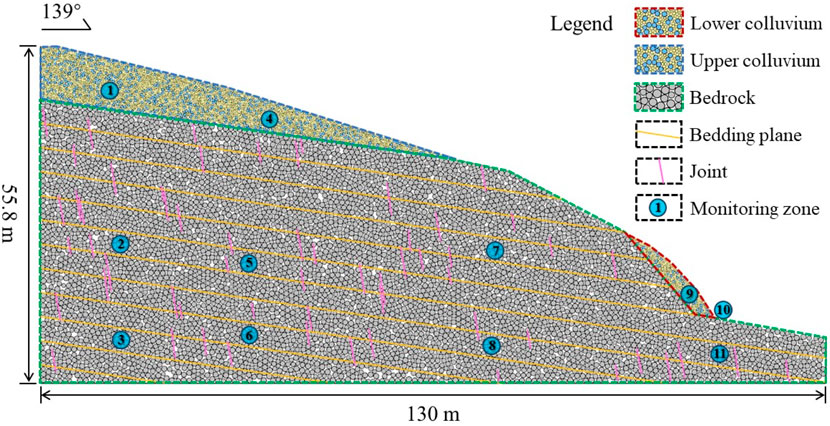
Figure 5. Opencast slope numerical model.
3.3 Contact models and micro-parameters
Contacts are created/deleted automatically during cycling. They are detected via termed piece based on the principles of different contact models. The contact types of piece are ball-ball and ball-facet. The aforementioned BPM and SJM are two built-in contact models in the PFC.
The BPM model provides the behavior of two interfaces: a linear model and a parallel bond (Potyondy and Cundall, 2004) (Figure 6A). In the linear model, rotation is allowed, and slip is adapted to the Coulomb limit on the shear surface. Linear contact is active if the surface gap is less than or equal to zero, and can be activated again when the criterion is satisfied. The micro-parameters of linear group are mainly: friction coefficient (μ), normal stiffness (kn) and shear stiffness (ks). The parallel-bond component acts in parallel with the linear component and establishes an elastic interaction between the pieces. The parallel bonds are broken when the threshold bond strength is exceeded, and cannot be reactivated. The parallel-bond group includes the following micro-parameters: bond normal stiffness (
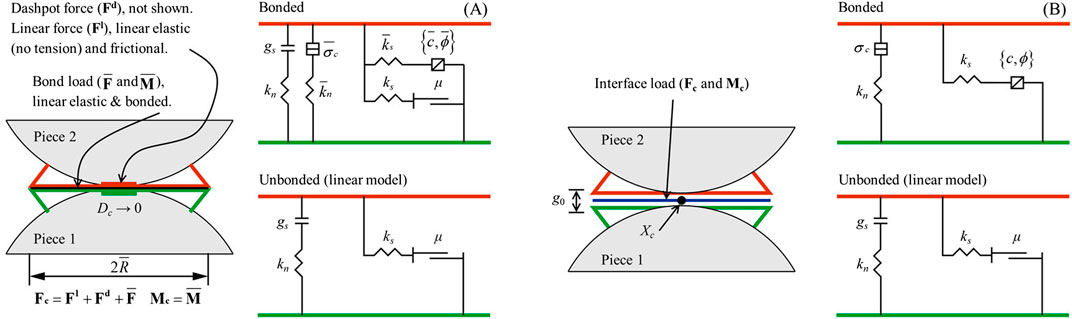
Figure 6. Behavior and rheological components of (A) BPM model and (B) SJM model (Itasca Consulting GroupInc, 2021).
In the SJM model, smooth joints are created by removing the bond between particles and applying a set of elastic spring uniformly over a rectangular cross section (Mas Ivars et al., 2011) (Figure 6B). Particle pairs intersected by a smooth joint may overlap and pass through each other rather than forced to move around one another (Bahaaddini et al., 2015). The smooth joints remain active while there is a nonzero overlap between particles. The main micro-parameters in the SJM model are normal stiffness per unit area (kn), shear stiffness per unit area (ks), friction coefficient (μ), tensile strength (
PFC derives macro-scale material properties from the interactions among micro-scale particles (Lu et al., 2014; Yan et al., 2022a). Unfortunately, the universal or accurate analytical equations between micro- and macro-parameters have not been established (Tang et al., 2009; Lu et al., 2014; Lin; Lin and Lin, 2015; Wei et al., 2019). Alternatively, the trial test was used to determine the appropriate micro-parameters. It calibrates micro-parameters from the macroscopic response of a particle assembly by repeating numerical tests until the modeled macro-parameters approach to the laboratory values (Bao et al., 2020; Yan et al., 2022b). For linear contact model and SJM, their micro-parameters can be obtained after several rounds of failed attempts. However, a rational strategy should be adopted for calibrating the micro-parameters of the BPM. Fortunately, some previous studies suggested a straightforward flowchart (Zhang et al., 2012; Lu et al., 2014; Bahaaddini et al., 2015). First, E is matched by adjusting kn,
Using the trial and error test, numerical direct shear tests of colluvium and joint and numerical uniaxial compression test of intact rock are repeated by adjusting micro-parameters until the simulated macro-parameters are similar to the reference values (Figure 7). The calibrated micro-parameters of slope materials are listed in Table 1. Then, a balanced numerical slope model is established using these micro-parameters, and a contact map is shown in Figure 8.
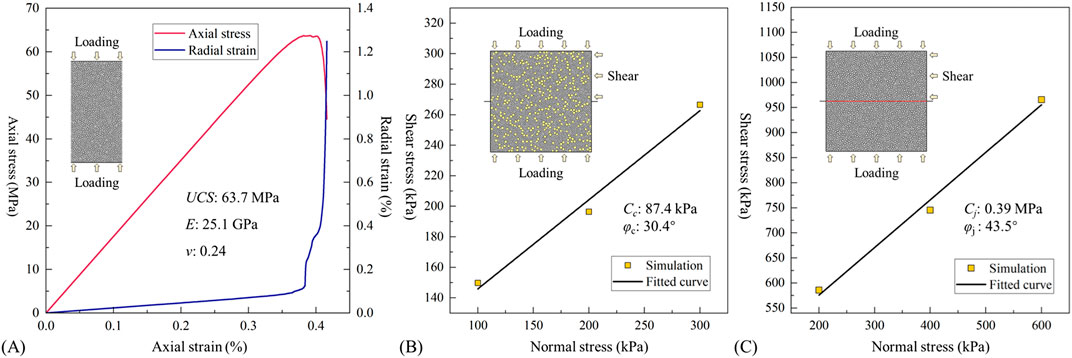
Figure 7. Micro-parameter calibration of (A) Intact rock, (B) Colluvium and (C) Discontinuity using numerical uniaxial compression and direct shear tests.
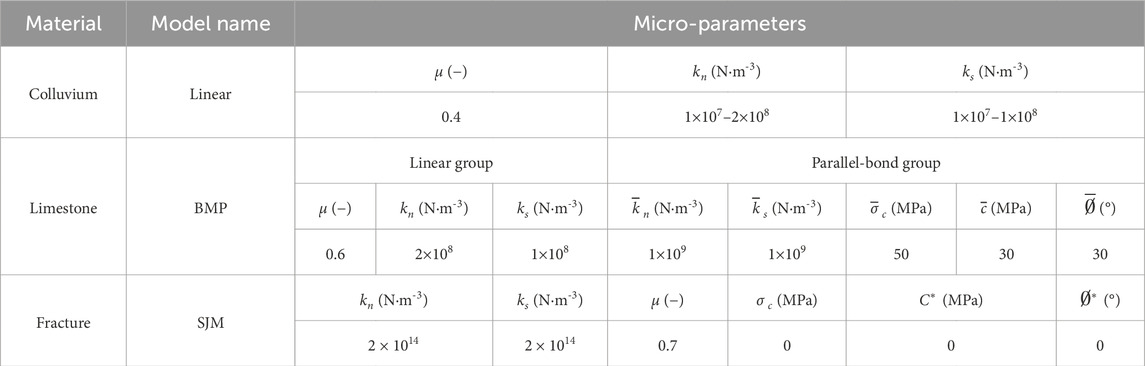
Table 1. Micro-parameters of slope materials.

Figure 8. Contact map of the numerical slope model.
3.4 Strength reduction technique
Factor of safety (FOS) is the most widely used quantitative index in slope stability assessment. The concept of the FOS is derived from the limit equilibrium method (LEM), and can be expressed as Equation 1. To combine FOS with numerical approach, strength reduction technique (SRT) was first introduced by Zienkiewicz et al. (1975). Following this, SRT has gradually became a well-recognized technique for FOS calculation in the finite element (Jiang et al., 2015; Bao et al., 2019a; Jia et al., 2024) or distinct element (Bao et al., 2019b; Su et al., 2019; Li Y. et al., 2022; Xing et al., 2023) analyses of slope stability.
where C and
In the finite element analysis, the SRT defines two new shear strength parameters (CR and
Numerical non-convergence criterion, plastic yield zone connection criterion and displacement mutation criterion are commonly used for judging the limit failure state of a slope (Jiang et al., 2015). Of these, the displacement-based criterion is more clear in the distinct element analysis (Li C. et al., 2022; Xing et al., 2023) and is adopted in this study. Using the SRT, the instability dynamic process of the studied rock slope can be simulated and the FOS can also be obtained.
4 Results
4.1 Stability of the opencast slope
As mentioned above, FOS is equal to SRF when the slope reaches a limit failure state in the SRT. From this, SRF should be preliminarily set as an interval value for seeking the interest value corresponding to the critical stability state. In this study, SRF refers to previous papers (Bao et al., 2019a; Su et al., 2019; Li X. et al., 2022), as well as considers the current geological model. The trial SRF values are tentatively created from 1.0 to 5.0 with an increment of 1.0. The relationship between SRF and the displacement of different slope materials is plotted in Figure 9. The modeled slope is stable when the SRF is equal to 1; and that exhibits significant failure when the SRF is equal to 5. From this, the pre-defined interval value is reasonable.
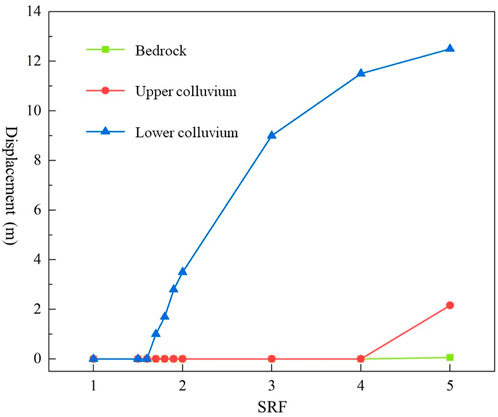
Figure 9. SRF vs. displacement of slope materials.
More specifically, the average displacement of the lower colluvium is gradually greater with increasing the SRF values, but the corresponding displacement increment reduces gradually (Figure 9). In contrast, the displacement of the upper colluvium and bedrock is not sensitive to the SRF values. The FOSs of the upper colluvium and bedrock are greater than 4.0 and 5.0, respectively. To obtain a more accurate FOS value for the lower colluvium, a total of four SRF values with a range between 1.5 and 2.0 with an increment of 0.1 are created. The SRF value corresponding to the displacement mutation point is 1.7. Therefore, the current opencast slope is stable in general.
4.2 Slope instability process
The scenario with a SRF equal to 5.0 is used to investigate the potential failure process of the opencast slope. The calculation cycles are terminated when the velocity of slope materials is less 0.01 m/s. The history curves of velocity and displacement of different slope materials are plotted in Figure 10. The major instability process lasts 4 × 10⁶ steps. Of these, the lower colluvium experiences a significant acceleration stage and a deceleration stage. The maximum velocity and displacement are 8.36 m/s and 12.56 m, respectively. The velocity of the upper landslide deposit decreases rapidly after initiation, and the final displacement is only 2.16 m. The velocity of the bedrock converges to 0.1 m/s after 1 × 10⁶ steps, and the associated displacement curve is a near-horizontal line. It indicates that bedrock remains stable even under a high SRF, thus the risk of planar failure is extremely low.

Figure 10. (A) Average velocity and (B) Displacement of slope materials vs. step.
The velocity and displacement maps of the slope instability process are shown in Figures 11, 12, respectively. Different instability processes are observed between the upper and lower colluvium because of the difference of slope angle. Regarding the upper gentle colluvium, failure occurs in the shallow layer and a circular slip surface is observed. Maximum deformation of this shallow layer is approximately 10 m, and some surficial particles fall at the toe. For comparison, deformation of the deep layer is not obvious. As for the lower steep colluvium, it slides along the lithologic interface under gravity. More specifically, it accelerates away from the slope toe in the first 2 × 10⁶ steps. Subsequently, the sliding mass moves slower with decreasing slope angle. Finally, the sliding mass deposits at the slope toe.
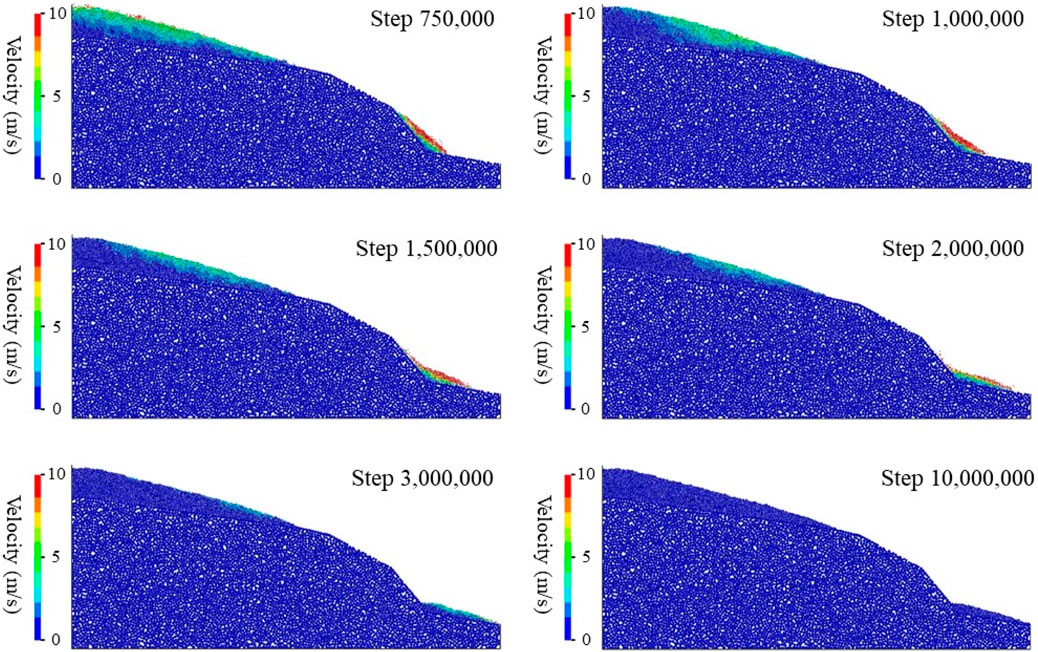
Figure 11. Velocity map of the opencast slope instability process (SRF=5.0).
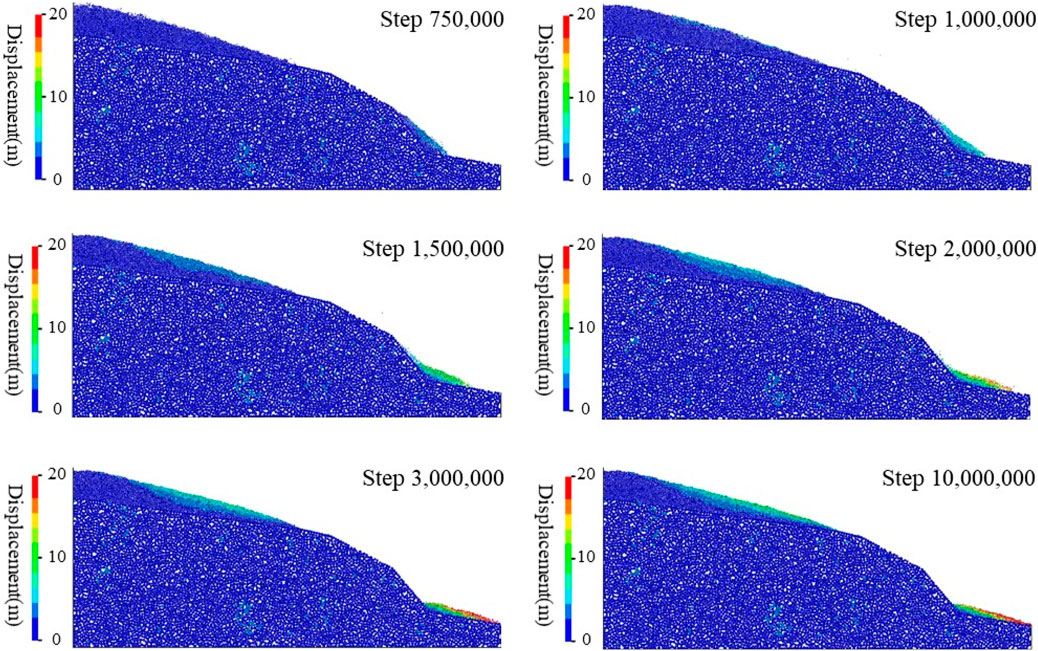
Figure 12. Displacement map of the opencast slope instability process (SRF=5.0).
Affected by the relative larger friction coefficient of the bedrock, high velocity layer is observed in the surficial of the sliding mass, while low velocity layer is observed at the bottom of the sliding mass (Figure 11). Since the acceleration distance is very short, the expansion of the landslide deposits is not obvious. Besides the effect of friction coefficient of slip surface on the particle motion, the front particles also obstruct the latter particle motion. For this reason, the front surficial particles have a relative larger displacement (Figure 12).
4.3 Shear stress analysis for slope instability
To investigate the relationship between the variation of shear stress and slope instability process, a total of eleven monitoring balls are set in the slope (Figure 5). Of these, two for the upper colluvium, two for the lower colluvium and seven for the bedrock.
The shear stress in bedrock fluctuates strongly in the first 1 × 10⁶ steps (Figure 13), which is in accordance with the variation characteristics in the velocity map. After 5 × 10⁶ steps, the shear stress of each monitoring ball converges to a constant. The general features of the modelled shear stress field are: 1) the shear stress of the monitoring balls near the slope face is greater than that inside the slope; 2) stress concentration is most significant at the slope toe; and 3) shear stress is related to the slope height. From this, bedrock is generally stable because that the shear strength of rock mass is greater than the shear stress. The material at the slope toe is prone to instability, which is consistent with the simulation results (Figures 11, 12).
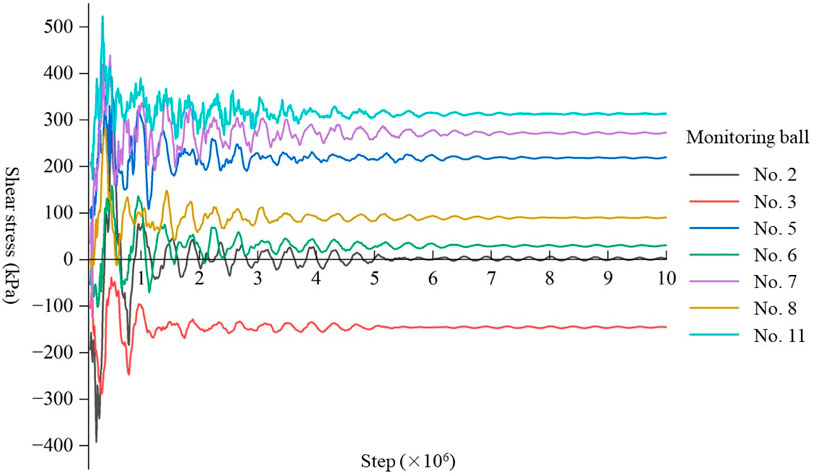
Figure 13. History curves of monitoring balls in the bedrock.
The history shear stress in the colluvium fluctuates more strongly than that in the bedrock in the first 4 × 10⁶ steps (Figure 14). It is because that instabilities mainly occur in the colluvium layer. Since the lower colluvium has completely slid from its original region, the rear portion of the history curve of the monitoring ball No. 9 is missing. The shear stress in the colluvium is smaller than that in the bedrock due to the differences in the contact models. The lowest shear stress (9.79 kPa) is observed in the lower colluvium because that the landslide deposits reaches a more stable equilibrium state. In general, the modelled shear stress field well explains the mechanism of slope instability process.
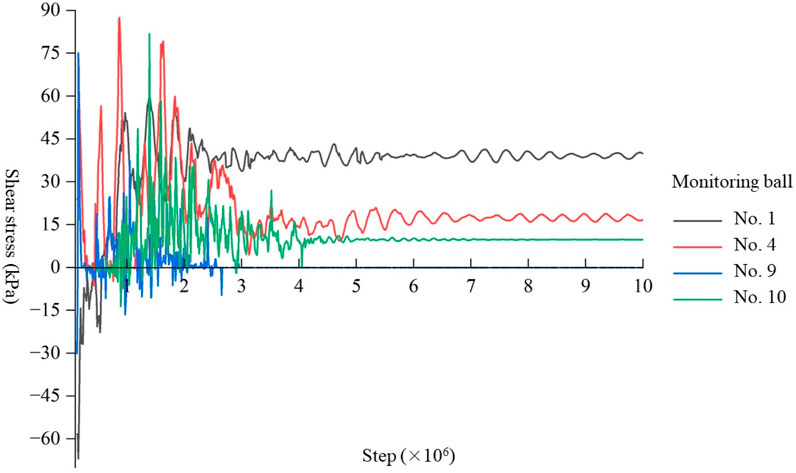
Figure 14. History curves of monitoring balls in the colluvium.
5 Discussion
In this section, both LEM and FEM are used to make a result comparison with the DEM. Regarding the LEM, similar slip surfaces are calculated by varying four searching algorithms, i.e., Bishop, Janbu, Ordinary and Spencer (Figure 15). The slight differences in the FOS results are caused by the different pre-defined assumptions on the interslice forces. LEM derives FOS from macro-parameters (e.g., cohesion and internal friction angle), and the complex strain-stress conditions in a slope rock mass is not considered. For comparison, DEM derives FOS from the micro-view of the slope instability process by solving the particle displacement and contact force iteratively. Therefore, different results are obtained from the two methods.
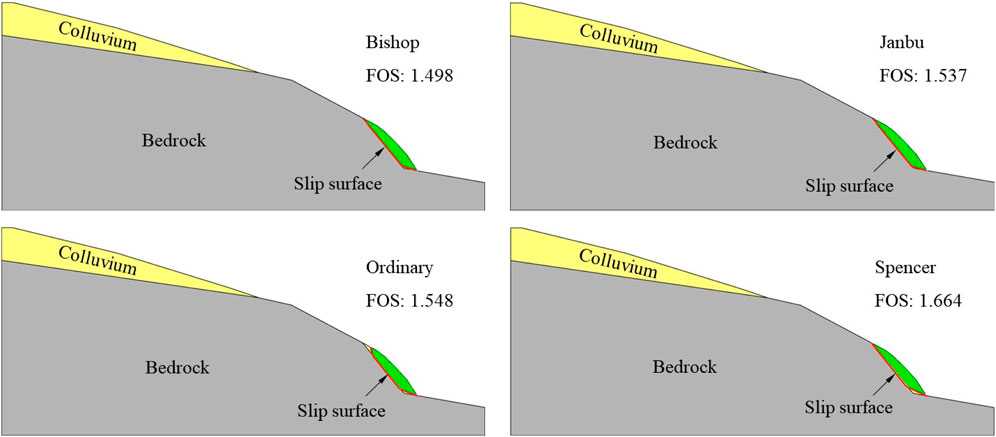
Figure 15. Slope stability assessment via LEM.
Further comparison is conducted by using the FEM and SRT. Figure 16 shows the simulated plastic penetration zone of the opencast slope, and the corresponding FOS is 1.63. Both FEM and DEM are numerical methods, and utilize SRT to find the limit failure state. However, since the difference in calculation rationale between continuum-based and discontinuum-based methods (e.g., particle assembly and continuum mesh), as well as the ambiguous relationship between macro- and micro-parameters, different results are also observed from the two methods.
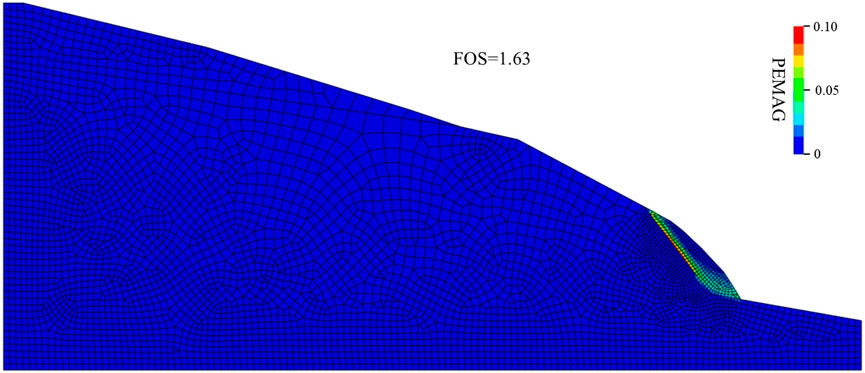
Figure 16. Plastic penetration zone simulated via FEM.
Based on the visible distinction among the methods and results, an argument about “How to model more rationally to make the results more referable” is introduced here. In the authors’ opinion, three aspects should be fully considered, i.e., numerical method, slope numerical model and adequate parameter. For the first aspect, continuum-based or discontinuum-based numerical methods should be determined according to the rock mass structure of the studied slope. In other words, FEM-SRT with macro-parameters is suggested for cataclastic slope, while DEM-SRT is more recommended for fractured rock slope. In this study, the latter is adopted due to the slope mass is mainly composed of bedded rock mass. For the second aspect, a numerical slope model should be consistent with the actual geological conditions. In this study, colluvium deposits are simulated by an assembly of balls, and the linear contact model is assigned. The bedrock is simulated using the SRM modeling approach. Of these, the mechanical behavior of intact rock and discontinuities are represented by BPM and SJM models, respectively. It seems that slope materials are explicitly distinguished by assigning different models, which improve the accuracy of the simulation results. For the third aspect, parameters should refer to laboratory tests or remarkable studies. If conditions permit, comparison with in-situ monitoring devices can also verify the simulation results and further make the results more referable.
6 Conclusion
The strength reduction DFN-DEM modelling approach is used to investigate the stability of a bedded mining slope. The major findings of this study are summarized as follows. Using a displacement mutation criterion, the FOS of the mining slope is equal to 1.7. The possible sliding mass and slip surface are the lower colluvium with a steep angle and the lithologic interface, respectively. Regarding the underlying bedrock, it is still stable even though the SRF is set as 5.0. A shallow failure for the upper colluvium and a translational slide for the lower colluvium are observed in the simulated instability process. They are explained by a shear stress analysis. LEM and strength reduction FEM yield a lower FOS, but the searched slip surfaces are similar. This can be attributed to the differences of model parameters and media assumptions among the three methods. To make a simulation result more referable, numerical method, slope numerical model and adequate parameter should be well considered on the basis of the actual geological conditions of a rock slope.
Data availability statement
The raw data supporting the conclusions of this article will be made available by the authors, without undue reservation.
Author contributions
LT: Data curation, Formal Analysis, Funding acquisition, Methodology, Resources, Software, Validation, Writing–original draft. YH: Conceptualization, Investigation, Project administration, Writing–review and editing. YW: Funding acquisition, Validation, Visualization, Writing–review and editing. CS: Formal Analysis, Visualization, Writing–review and editing. JY: Funding acquisition, Writing–review and editing.
Funding
The author(s) declare that financial support was received for the research, authorship, and/or publication of this article. This research was supported by the National Natural Science Foundation of Shandong Province of China (Grant No. ZR2022ME188), the Project of Slope Safety Control and Disaster Prevention Technology Innovation Team of “Youth Innovation Talent Introduction and Education Plan” of Shandong Colleges and Universities [Grant No. Lu Jiao Ke Han (2021) No. 51], the Jinan City “New University 20” Research Leader Studio Project (Grant No. 20228108) and Open Fund of Hubei Key Laboratory of Disaster Prevention and Mitigation (China Three Gorges University) (Grant No. 2023KJZ06).
Acknowledgments
The authors would like to thank the editors and two reviewers for their comments and suggestions, which helped a lot in making this paper better.
Conflict of interest
The authors declare that they have no known competing financial interests or personal relationships that could have appeared to influence the work reported in this paper.
Publisher’s note
All claims expressed in this article are solely those of the authors and do not necessarily represent those of their affiliated organizations, or those of the publisher, the editors and the reviewers. Any product that may be evaluated in this article, or claim that may be made by its manufacturer, is not guaranteed or endorsed by the publisher.
References
Bahaaddini, M., Hagan, P. C., Mitra, R., and Hebblewhite, B. K. (2015). Parametric study of smooth joint parameters on the shear behaviour of rock joints. Rock Mech. Rock Eng. 48 (3), 923–940. doi:10.1007/s00603-014-0641-6
Bao, Y., Han, X., Chen, J., Zhang, W., Zhan, J., Sun, X., et al. (2019a). Numerical assessment of failure potential of a large mine waste dump in Panzhihua City, China. Eng. Geol. 253, 171–183. doi:10.1016/j.enggeo.2019.03.002
Bao, Y., Sun, X., Chen, J., Zhang, W., Han, X., and Zhan, J. (2019b). Stability assessment and dynamic analysis of a large iron mine waste dump in Panzhihua, Sichuan, China. Environ. Earth Sci. 78 (2), 48. doi:10.1007/s12665-019-8043-4
Bao, Y., Zhai, S., Chen, J., Xu, P., Sun, X., Zhan, J., et al. (2020). The evolution of the Samaoding paleolandslide river blocking event at the upstream reaches of the Jinsha River Tibetan Plateau. Geomorphology 351, 106970. doi:10.1016/j.geomorph.2019.106970
Basahel, H., and Mitri, H. (2019). Probabilistic assessment of rock slopes stability using the response surface approach–A case study. Int. J. Min. Sci. Technol. 29 (3), 357–370. doi:10.1016/j.ijmst.2018.11.002
Bester, M., Stacey, T. R., and Russell, T. (2021). Synthetic rock mass modelling and geotechnical mapping: an open pit mine case study in anisotropic rock. Int. J. Min. Reclam. Environ. 35 (5), 356–378. doi:10.1080/17480930.2020.1834177
Chand, K., and Koner, R. (2024). Failure zone identification and slope stability analysis of mine dump based on realistic 3D numerical modeling. Geotechnical Geol. Eng. 42, 543–560. doi:10.1007/s10706-023-02588-1
Cui, Z., Zhang, M., and Sheng, Q. (2021). DEM-based numerical investigation of seismic stability of rock slope in terms of rigid block displacement. Lithosphere 2021 (7), 3287963. doi:10.2113/2022/3287963
Cundall, P. (1971). “A computer model for simulating progressive large scale movements in blocky rock systems,” in Proceedings of the symposium of the international society of rock mechanics.
Cundall, P. A., and Strack, O. D. L. (1979). A discrete numerical model for granular assemblies. Geotechnique 29 (1), 47–65. doi:10.1680/geot.1979.29.1.47
Du, S., Saroglou, C., Chen, Y., Lin, H., and Yong, R. (2022). A new approach for evaluation of slope stability in large open-pit mines: a case study at the Dexing Copper Mine, China. Environ. Earth Sci. 81 (3), 102. doi:10.1007/s12665-022-10223-0
Elmo, D., Stead, D., Yang, B., Marcato, G., and Borgatti, L. (2022). A new approach to characterise the impact of rock bridges in stability analysis. Rock Mech. Rock Eng. 55 (5), 2551–2569. doi:10.1007/s00603-021-02488-x
Esmaieli, K., Hadjigeorgiou, J., and Grenon, M. (2010). Estimating geometrical and mechanical REV based on synthetic rock mass models at Brunswick Mine. Int. J. Rock Mech. Min. Sci. 47 (6), 915–926. doi:10.1016/j.ijrmms.2010.05.010
Gong, Y., Yao, A., Li, Y., Li, Y., Li, Y., and Sun, Y. (2023). Model test study on sliding-toppling composite deformation evolution of anti-dip layered rock slope. Bull. Eng. Geol. Environ. 82 (5), 194. doi:10.1007/s10064-023-03213-4
Goodman, R., and Shi, G. (1985). Block theory and its application to rock engineering. New Jersey: Prentice Hall.
Hoek, E., and Bray, J. (1981). Rock slope engineering. London: The Institution of Mining and Metallurgy.
Jaiswal, A., Verma, A. K., and Singh, T. N. (2024). A novel proposed classification system for rock slope stability assessment. Sci. Rep. 14 (1), 10992. doi:10.1038/s41598-024-58772-7
Jia, Y., Luan, S., Asheghabadi, M., Xing, D., Yuan, H., and Liu, J. (2024). Slope stability analysis of coastal geotechnical structures under combined effects of earthquake and rainfall. Front. Earth Sci. 11, 1335756. doi:10.3389/feart.2023.1335756
Jiang, Q., Qi, Z., Wei, W., and Zhou, C. (2015). Stability assessment of a high rock slope by strength reduction finite element method. Bull. Eng. Geol. Environ. 74 (4), 1153–1162. doi:10.1007/s10064-014-0698-1
Jiang, Q., and Zhou, C. (2017). A rigorous solution for the stability of polyhedral rock blocks. Comput. Geotechnics 90, 190–201. doi:10.1016/j.compgeo.2017.06.012
Li, C., Chen, G., Guo, L., Gao, J., Peng, X., and Yu, P. (2022a). Slope stability and post-failure analysis of soil-rock-mixture using the modified 2D DDA-SPH method. Int. J. Rock Mech. Min. Sci. 157, 105170. doi:10.1016/j.ijrmms.2022.105170
Li, L., Tang, C., Zhu, W., and Liang, Z. (2009). Numerical analysis of slope stability based on the gravity increase method. Comput. Geotechnics 36 (7), 1246–1258. doi:10.1016/j.compgeo.2009.06.004
Li, W., Li, H., Dai, F., and Lee, L. (2012). Discrete element modeling of a rainfall-induced flowline. Eng. Geol. 149, 22–34. doi:10.1016/j.enggeo.2012.08.006
Li, X., Liu, J., Gong, W., Xu, Y., and Bowa, V. (2022b). A discrete fracture network based modeling scheme for analyzing the stability of highly fractured rock slope. Comput. Geotechnics 141, 104558. doi:10.1016/j.compgeo.2021.104558
Li, Y., Chen, J., Zhou, F., Bao, Y., Li, Z., Song, S., et al. (2022c). Stability evaluation of rock slope based on discrete fracture network and discrete element model: a case study for the right bank of Yigong Zangbu Bridge. Acta Geotech. 17 (4), 1423–1441. doi:10.1007/s11440-021-01369-5
Lin, C., and Lin, M. (2015). Evolution of the large landslide induced by typhoon Morakot: a case study in the Butangbunasi River, southern Taiwan using the discrete element method. Eng. Geol. 197, 172–187. doi:10.1016/j.enggeo.2015.08.022
Lu, C., Tang, C., Chan, Y., Hu, J., and Chi, C. (2014). Forecasting landslide hazard by the 3D discrete element method: a case study of the unstable slope in the Lushan hot spring district, central Taiwan. Eng. Geol. 183, 14–30. doi:10.1016/j.enggeo.2014.09.007
Ma, K., Liu, G., Guo, L., Zhuang, D., and Collins, D. S. (2020). Deformation and stability of a discontinuity-controlled rock slope at Dagangshan hydropower station using three-dimensional discontinuous deformation analysis. Int. J. Rock Mech. Min. Sci. 130, 104313. doi:10.1016/j.ijrmms.2020.104313
Mas Ivars, D., Pierce, M., Darcel, C., Reyes, J., Potyondy, D., Young, R., et al. (2011). The synthetic rock mass approach for jointed rock mass modelling. Int. J. Rock Mech. Min. Sci. 48 (2), 219–244. doi:10.1016/j.ijrmms.2010.11.014
Obregon, C., and Mitri, H. (2019). Probabilistic approach for open pit bench slope stability analysis–A mine case study. Int. J. Min. Sci. Technol. 29 (4), 629–640. doi:10.1016/j.ijmst.2019.06.017
Potyondy, D., and Cundall, P. (2004). A bonded-particle model for rock. Int. J. Rock Mech. Min. Sci. 41 (8), 1329–1364. doi:10.1016/j.ijrmms.2004.09.011
Raghuvanshi, T. (2019). Governing factors influence on rock slope stability-Statistical analysis for plane mode of failure. J. King Saud University–Science 31 (4), 1254–1263. doi:10.1016/j.jksus.2019.01.002
Ren, S., Tao, Z., He, M., Pang, S., Li, M., and Xu, H. (2020). Stability analysis of open-pit gold mine slopes and optimization of mining scheme in Inner Mongolia, China. J. Mt. Sci. 17 (12), 2997–3011. doi:10.1007/s11629-020-6217-x
She, M., Deng, K., Wu, Z., Hu, X., and Li, Z. (2018). Study on the direct shear test of limestone gravel soil. Water Conservancy Sci. Technol. Econ. 24 (10), 18–21.
Stead, D., and Wolter, A. (2015). A critical review of rock slope failure mechanisms: the importance of structural geology. J. Struct. Geol. 74, 1–23. doi:10.1016/j.jsg.2015.02.002
Su, H. A., Fu, Z., Gao, A., and Wen, Z. (2019). Numerical simulation of soil levee slope instability using particle-flow Code method. Nat. Hazards Rev. 20 (2), 04019001. doi:10.1061/(asce)nh.1527-6996.0000327
Tang, C., Hu, J., Lin, M., Angelier, J., Lu, C., Chan, Y., et al. (2009). The Tsaoling landslide triggered by the Chi-Chi earthquake, Taiwan: insights from a discrete element simulation. Eng. Geol. 106 (1-2), 1–19. doi:10.1016/j.enggeo.2009.02.011
Wang, F., Zhao, Z., Chen, Y., Zhu, G., Nam, K., and Ye, Z. (2022a). Guocun landslide in a slate slope with dip structure on 27 march 2021 in tonglu county, zhejiang province, China. Landslides 19 (6), 1435–1447. doi:10.1007/s10346-022-01846-2
Wang, X., Shi, W., Xiong, S., Liao, D., and Wu, Z. (2022b). Study on the calibration of meso-scale parameters of limestone based on microscopic mineral content. Chin. J. Undergr. Space Eng. 18 (2), 428–437.
Wei, J., Zhao, Z., Xu, C., and Wen, Q. (2019). Numerical investigation of landslide kinetics for the recent Mabian landslide (Sichuan, China). Landslides 16 (11), 2287–2298. doi:10.1007/s10346-019-01237-0
Xing, L., Gong, W., Li, B., Zhao, C., Tang, H., and Wang, L. (2023). Probabilistic analysis of earthquake-induced failure and runout behaviors of rock slopes with discrete fracture network. Comput. Geotechnics 159, 105487. doi:10.1016/j.compgeo.2023.105487
Xue, J., Cao, C., Tan, C., Yan, J., Ji, Y., and Chen, J. (2023). An integrated maximum safe slope angle analysis approach based on probabilistic kinematic and block theory for discontinuity-controlled rock slope instabilities: a transportation corridor case. Environ. Earth Sci. 82 (24), 604. doi:10.1007/s12665-023-11278-3
Yan, J., Chen, J., Li, Y., Li, Z., Zhang, Y., Zhou, X., et al. (2022a). Kinematic-based failure angle analysis for discontinuity-controlled rock slope instabilities: a case study of Ren Yi Peak Cluster in Fusong County, China. Nat. Hazards 111 (3), 2281–2296. doi:10.1007/s11069-021-05137-2
Yan, J., Chen, J., Zhou, F., Li, Y., Zhang, Y., Gu, F., et al. (2022b). Numerical simulation of the Rongcharong paleolandslide river-blocking event: implication for the longevity of the landslide dam. Landslides. 19 (6), 1339–1356. doi:10.1007/s10346-022-01872-0
Yan, P., Zhang, J., Kong, X., and Fang, Q. (2020). Numerical simulation of rockfall trajectory with consideration of arbitrary shapes of falling rocks and terrain. Comput. Geotechnics 122, 103511. doi:10.1016/j.compgeo.2020.103511
Zhang, F., and Yang, T. (2023). Stability and probabilistic assessment of a large asymmetric bedding slope with a weak interlayer. Environ. Sci. Pollut. Res. 30 (49), 107811–107826. doi:10.1007/s11356-023-29655-7
Zhang, L., Tang, H., Xiong, C., Huang, L., and Zou, Z. (2012). Movement process simulation of high-speed long-distance Jiweishan landslide with PFC3D. Chin. J. Rock Mech. Eng. 31 (A01), 2601–2611.
Zhang, Y., Liu, X., Guo, P., Jia, P., Yang, T., and Ren, F. (2021). Numerical characterization of slope rock mass through considerations of hydraulic and mechanical properties. Landslides 18 (7), 2465–2481. doi:10.1007/s10346-021-01672-y
Zheng, J., Kulatilake, P. H. S. W., and Deng, J. (2015). Development of a probabilistic block theory analysis procedure and its application to a rock slope at a hydropower station in China. Eng. Geol. 188, 110–125. doi:10.1016/j.enggeo.2015.01.010
Zheng, Y., Wang, R., Chen, C., and Meng, F. (2021). Analysis of flexural toppling failure in rock slopes using discrete element method. Front. Earth Sci. 9, 773088. doi:10.3389/feart.2021.773088
Zhou, X., Zhao, X., Wong, L., and Cheng, H. (2019). A modified Sarma method for stability analysis of layered slopes. Bull. Eng. Geol. Environ. 78 (3), 1893–1909. doi:10.1007/s10064-017-1199-9
Keywords: opencast slope, stability assessment, numerical simulation, distinct element method, strength reduction technique, factor of safety
Citation: Teng L, He Y, Wang Y, Sun C and Yan J (2024) Numerical stability assessment of a mining slope using the synthetic rock mass modeling approach and strength reduction technique. Front. Earth Sci. 12:1438277. doi: 10.3389/feart.2024.1438277
Received: 25 May 2024; Accepted: 19 August 2024;
Published: 11 September 2024.
Edited by:
Faming Huang, Nanchang University, ChinaReviewed by:
Liangfu Xie, Xinjiang University, ChinaYang Gao, Chinese Academy of Geologi-cal Sciences (CAGS), China
Copyright © 2024 Teng, He, Wang, Sun and Yan. This is an open-access article distributed under the terms of the Creative Commons Attribution License (CC BY). The use, distribution or reproduction in other forums is permitted, provided the original author(s) and the copyright owner(s) are credited and that the original publication in this journal is cited, in accordance with accepted academic practice. No use, distribution or reproduction is permitted which does not comply with these terms.
*Correspondence: Yuanyuan He, aGV5dWFueXVhbkBjdGd1LmVkdS5jbg==