 Yuanyue Pi
 Zhong Sun1
- 1School of Architecture, Nanyang Institute of Technology, Nanyang, China
- 2China Railway 19th Bureau Group Second Engineering Co., Ltd., Liaoyang, China
Tunnel water inrush may not only cause hundreds of millions of economic losses and serious casualties, but also leads to a series of ecological and environmental problems such as the decline of groundwater level, soil salinization and surface vegetation degradation. In this study, considering hydrogeology, construction, and dynamic monitoring factors, a new risk prediction model of water inrush is proposed based on fuzzy mathematical theory. The element of novelty is that this approach comprehensively considers nonlinearity and randomness factors, and the index values, weights, and membership are expressed as interval numbers instead of constant values. The interval membership degree of each index is calculated by an improved sigmoid membership function (SMF). A coupling algorithm of improved analytic hierarchy process and entropy method is used to calculate the index weight. In addition, the Boolean matrix is introduced into the relative advantage analysis of the interval vector, and the final risk level of water inrush is determined by the ranking result. The proposed model is applied to the analysis of the water inrush risk in the Ka−Shuang 2 (KS2) tunnel in Xinjiang, China. The predicted results align well with the actual excavation results, which indicates that this novel model has high accuracy and reliability. Simultaneously, a risk management response mechanism for different risk levels of water inrush is discussed, which is expected to provide a new research perspective for risk control of other related projects and promote regional sustainable development.
1 Introduction
Currently, China has become one of the countries with the most significant tunnel scales and the most complicated tunnel structures in the world (Zhang et al., 2019). In the process of tunnel construction, various uncertain risks may be encountered, such as water inrush, collapse, rock burst and other geological disasters, which cause huge economic losses every year in the world. Particularly for water inrush, it not only seriously threatens the lives and safety of construction personnel, but also brings great challenges to local environmental protection (Beard, 2010; Ma et al., 2018). When the tunnel passes through water-rich areas such as rivers, lakes, and oceans, the hydrological and geological conditions are more complex, the construction conditions are more difficult, and various uncertainties are more prominent, which further increases the risk of tunnel water inrush. Therefore, an accurate and useful prediction of water inrush risk is of great practical significance to ensure engineering safety and promote regional sustainable development.
Water inrush is an extremely complex dynamic process influenced by multiple factors (Cui et al., 2015; Wang et al, 2019a). How to precisely predict water inrush has become a worldwide research focus. In recent years, many researchers have conducted theoretical research on the mechanism of water inrush from different perspectives and put forth corresponding methods for water inrush risk prediction. These methods mainly include geological analysis method (Li et al, 2017a), random forest method (Zhao et al., 2018; Zhao et al., 2020), geography information system method (Liu et al., 2018; Lyu et al., 2018), attribute mathematical theory (Yang and Zhang, 2018), cloud model theory (Lin et al., 2020; Wang et al., 2020), and Numerical Simulation Method (Cao et al., 2024; Wu et al., 2024). The above methods have their advantages and provide some scientific judgment for the prediction of water inrush risk. However, many methods do not consider the dynamic monitoring factor, which makes them have some limitations in practical engineering application. Besides, due to the complexity of water inrush risk prediction, such as multivariable, nonlinearity and randomness, the index value expressed as a constant cannot clearly reflect the uncertainty of water inrush risk prediction. Therefore, it is necessary to develop some more suitable approaches to improve the accuracy of water inrush risk prediction.
In this paper, a new risk prediction model of water inrush based on fuzzy mathematical theory is proposed. This model comprehensively considers the impact of hydrogeology, construction and dynamic monitoring factors on water inrush. At the same time, in view of the uncertainty of water inrush risk prediction, the index value, weight and membership degree are expressed as interval numbers instead of constant values, which is more in line with the actual project. The main purpose of this paper is to provide a scientific basis for the risk management of water inrush.
The remainder of this paper is organized as follows: Section 2 presents the general situation of the study area. Section 3 proposes a new risk prediction model of water inrush based on fuzzy mathematical theory and the coupling weight algorithm. Section 4 discusses the prediction results of the proposed model applied to KS2 tunnel. Section 5 verifies that the actual excavation situations are consistent with the prediction results and establishes a risk management response mechanism. Finally, Section 6 summarizes the research of this paper.
2 Study area
2.1 Topography and physiognomy
The KS2 tunnel is located at the northeastern edge of the Jungger Basin in Xinjiang Province, China (Figure 1). The total length of the tunnel is 8.35 km, the longitudinal slope is 1/2,583, and the depth of the overburden is 158–215 m. The elevation is 790–816 m, the degree of topography change is small, and the general height difference is 10–30 m. The section KS80+140−KS82+494 is located in the valley area of Ulungur River, where the terrain is flat and open, and it is a floodplain and river terrace. The width of the river valley is 1.6–2.0 km, the heart beach and floodplains are developed, and the main channel is about 40–160 m wide. The physiognomy of the study area is presented as Figure 2.
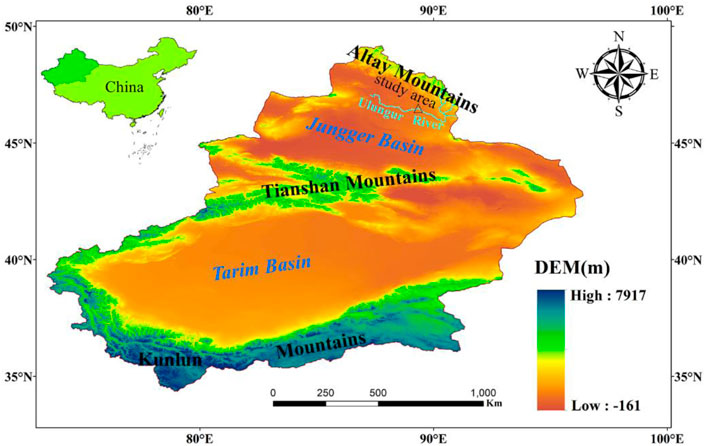
Figure 1. The geographical location of the study area.
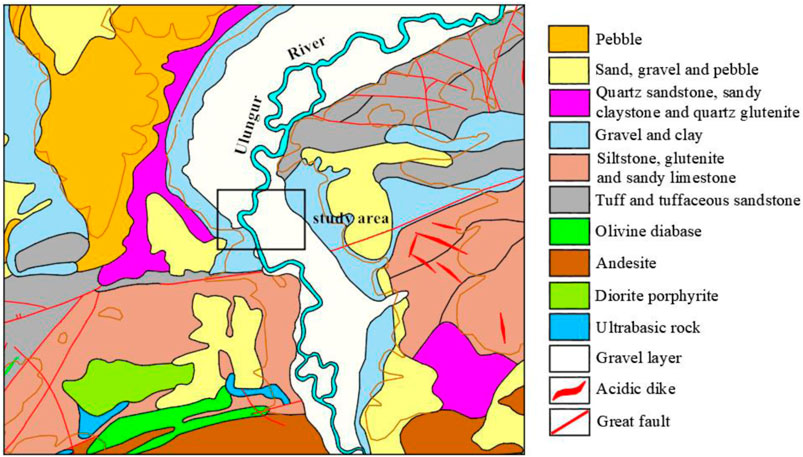
Figure 2. The physiognomy of the study area.
2.2 Geological structure
The Ulungur River fault is a large-scale fault near the KS2 tunnel. The fault extends from southwest to northeast and has a length of more than 170 km. It is a compressive fault with an occurrence of 305°–325° SW∠80° and a crushing bandwidth of about 100–150 m. According to the exploration drilling, the strata passing through KS80+140−KS82+494 are mainly Carboniferous strata. The stratigraphic lithology of KS80+140−KS81+227 is basalt, the lithology of KS81+227−KS82+177 is lithic tuff, and the lithology of KS82+177−KS82+494 is tuffaceous sandstone. Besides, there are 16 faults developed in this section, with a NE or NW strike direction, a steep dip angle of 60–80°, and a fault-breaking bandwidth of 0.5–4.8 m. The geological profile of the KS2 tunnel is shown in Figure 3.
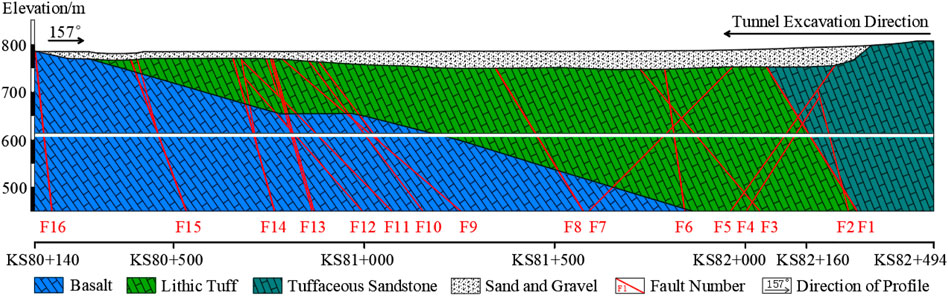
Figure 3. Geological profile of the KS2 tunnel (KS80+140−KS82+494).
2.3 Hydrological conditions
The types of groundwater in the section of KS80+140−KS82+494 are mainly Quaternary pore water and bedrock fissure water. Quaternary pore diving water is mainly located in the overburden of the river valley. It is replenished by the river water and the water volume is abundant. Bedrock fissure water is mainly distributed in structural fracture zones or tensile fissures and in a linear way along the structure. It mainly receives recharge from river water, Quaternary pore diving water, and atmospheric precipitation, and it infiltrates deep into the structural belt.
3 Risk prediction model of water inrush
To improve the risk management level in the process of tunnel construction, this paper proposes a novel model for risk prediction of tunnel water inrush based on nonlinear fuzzy mathematical methods, as shown in Figure 4. Firstly, a multi-index prediction system was established based on the mechanism of water inrush. Secondly, the improved SMF was used to construct the membership degree matrix of the prediction index. Thirdly, the index weight was calculated by the coupling algorithm of subjective and objective weights. Finally, the Boolean matrix was introduced into the relative advantage analysis of the interval vector, and the risk grade of water inrush was determined by the ranking result.
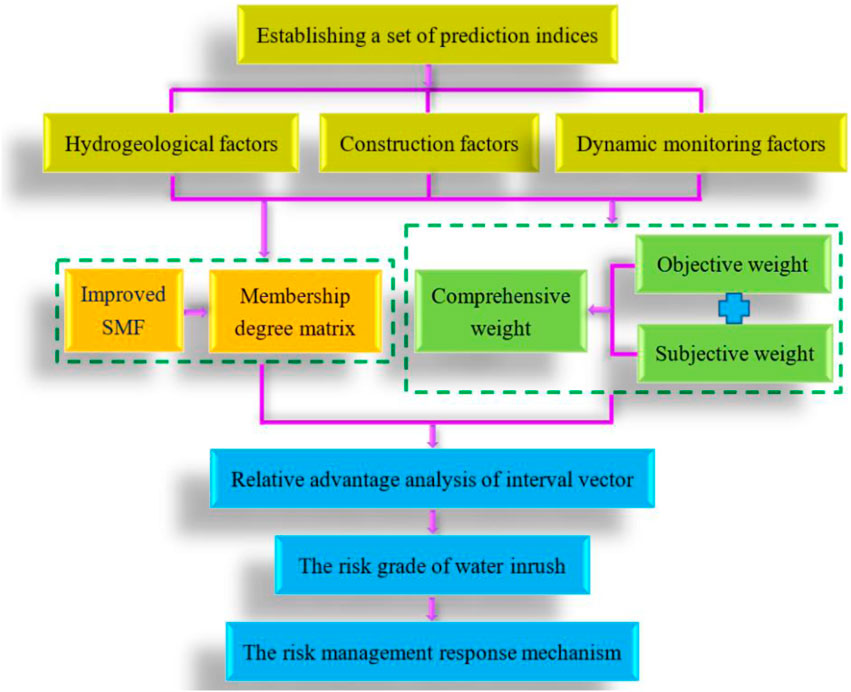
Figure 4. The proposed prediction model of water inrush risk.
3.1 Establishing a set of risk prediction indices for water inrush
In actual projects, various objective and subjective factors cause the water inrush. Based on previous research results (Li and Yang, 2018; Wang et al., 2020), we adopted ten indices (Table 1) to quantitatively predict the risk of water inrush, including landform and physiognomy (LP), unfavorable geological conditions (UGC), strata inclination (SI), elevation head (EH), water supply (WS), strength of surrounding rock (SSR), excavation disturbance (ED), supporting measures (SM), monitoring measurement (MM) and geological prediction (GP). X1−X6 are hydrogeological factors (H1), X7 and X8 are construction factors (H2), X9 and X10 are dynamic monitoring factors (H3). The prediction indices were quantitatively classified into four levels, as shown in Table 1.
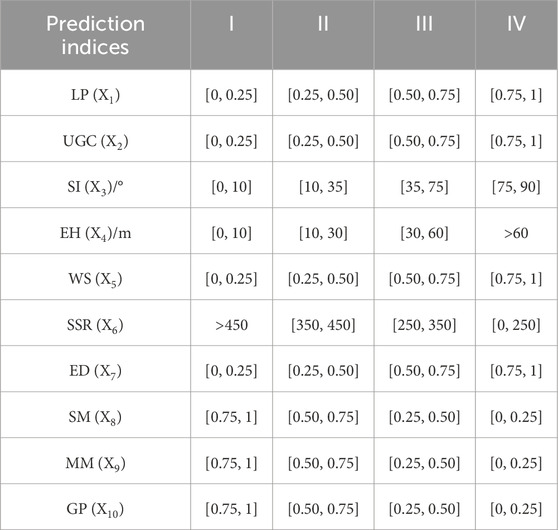
Table 1. The classification standards of prediction indices for water inrush.
3.1.1 Hydrogeological factors (H1)
3.1.1.1 LP (X1)
To a certain extent, the variation characteristics of the topography above the tunnel can reflect the possibility of tunnel water inrush. If the topography is undulating and a large area of depression exists, atmospheric precipitation and groundwater gather easily in this area, and there is a high possibility of water inrush. This paper quantified the proportion of negative terrain area above the tunnel (Li and Wu, 2019). It divided this area into four levels: no negative terrain [0, 0.25], small-scale negative terrain [0.25, 0.50], medium-scale negative terrain [0.50, 0.75] and large-scale negative terrain [0.75, 1], as shown in Table 1.
3.1.1.2 UGC (X2)
Under normal circumstances, the UGC encountered during the construction of tunnels refer to faults and surrounding rock fissures. Infiltration channels for groundwater form because of the existing faults and fissures. During the construction process, the groundwater’s spatial distribution balance in the strata is destroyed, and the groundwater stored in the strata pours easily into the tunnel along these channels, which increases the probability of tunnel water inrush. Considering the degree of development of faults and fissures (Li et al, 2017b), this paper classified the UGC into four grades: undeveloped strata [0, 0.25], weakly developed strata [0.25, 0.50], moderately developed strata [0.50, 0.75], and strongly developed strata [0.75, 1], as shown in Table 1.
3.1.1.3 SI (X3)
The degree of groundwater infiltration in the rock formation is related to the size of SI. The higher the SI, the greater the penetration rate of groundwater in the rock formation. In this paper, the angle β (0–90°) between the trend of stratum and the tunnel axis was selected as the SI, and it was classified into four grades (Yang and Zhang, 2018), as shown in Table 1.
3.1.1.4 EH (X4)
EH reflects the distribution characteristics of groundwater in the rock layer. A high water pressure on the tunnel increase the risk of tunnel water inrush. In this study, EH was classified into four grades (Wang et al., 2017), as shown in Table 1.
3.1.1.5 WS (X5)
When a tunnel crosses a river, the river water is the main source of groundwater recharge, and the connected groundwater recharge channel becomes a significant element that leads to a large scale of water inrush and long duration (Li and Yang, 2018). Considering the replenishment capacity of the water source, it was classified into four grades in this study: weak [0, 0.25], low-medium [0.25, 0.50], medium [0.50, 0.75], and strong [0.75, 1], as shown in Table 1.
3.1.1.6 SSR (X6)
If the surrounding rocks’ strength level is low, they are more likely to collapse and deform, increasing the water inrush risk. In this study, the basic quality (BQ) of surrounding rocks was selected as their strength index, and it was divided into four grades (Wang et al, 2019b), as shown in Table 1.
3.1.2 Construction factors (H2)
3.1.2.1 ED (X7)
The smaller the ED, the lower the risk of tunnel water inrush. Considering the disturbance degree of surrounding rocks during the tunnel excavation, this paper divided ED into four levels: small disturbance [0, 0.25], medium disturbance [0.25, 0.50], large disturbance [0.50, 0.75], relatively high disturbance [0.75, 1] (Table 1).
3.1.2.2 SM (X8)
After tunnel excavation, the surrounding rocks need to be supported in time to reduce the amount of settlement and deformation in them. Reasonable SM can prevent weathering and reduce groundwater erosion in the surrounding rocks (Xu et al., 2011). Considering the rationality of SM, this paper divided it into four grades: unreasonable [0, 0.25], basically reasonable [0.25, 0.50], reasonable [0.50, 0.75], and more reasonable [0.75, 1] (Table 1).
3.1.3 Dynamic monitoring factors (H3)
3.1.3.1 MM (X9)
MM are important means to achieve information design and dynamic construction. Through continuous on-site observation and measurement, a large amount of dynamic changes information of hydrogeological conditions and deformation of surrounding rocks can be obtained, which provides a basis for judging the stability of surrounding rocks and the water inrush risk. Considering the rationality of the measurement program, this paper divided MM into four grades: unreasonable [0, 0.25], basically reasonable [0.25, 0.50], reasonable [0.50, 0.75], more reasonable [0.75, 1] (Table 1).
3.1.3.2 GP (X10)
GP is an essential technical means to analyze the size and distribution of water storage in front of the tunnel face, which can reduce the probability of geological disasters and the degree of damage (Li and Wu, 2019). Reasonable geological prediction methods can not only warn the construction personnel of any potential risk early on, but it can also provide technical support for optimizing construction plans. In this paper, it was classified into four grades: unreasonable [0, 0.25], basically reasonable [0.25, 0.50], reasonable [0.50, 0.75], and more reasonable [0.75, 1], as shown in Table 1.
3.2 Membership degree based on improved SMF
3.2.1 Improved SMF
Fuzzy mathematics is an effective method to study uncertainty and randomness with fuzzy set theory (Moore and Lodwick, 2003). SMF is a monotone continuous nonlinear membership function whose output value is mapped between [0, 1], as shown in Figure 5. The function curve has good stability and a clear physical meaning, which is widely used in classification studies (Liu et al., 2013). For a variable
where
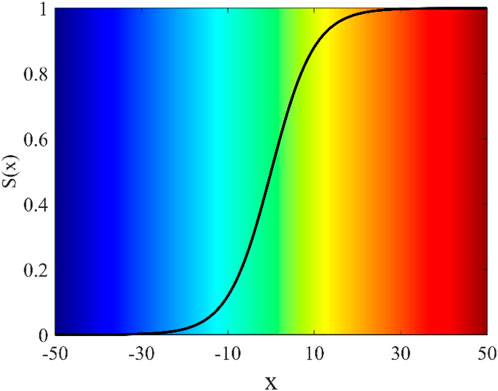
Figure 5. A sigmoid membership function with the shape parameter a=0.2.
Let
where
3.2.2 Construct interval membership degree matrix
In the actual engineering survey and tunnel construction process, many prediction indices are mainly descriptive, which should be quantified during the prediction process. To facilitate the calculation, the value range of the qualitative index is set to [0, 1], and the width of the range belonging to different risk grades is 0.25. According to the grading standard of water inrush risk, the improved SMF of different indices were defined as:
3.2.2.1 The improved SMF of quantitative indices
For index X3, the improved SMF is (Figure 6A):
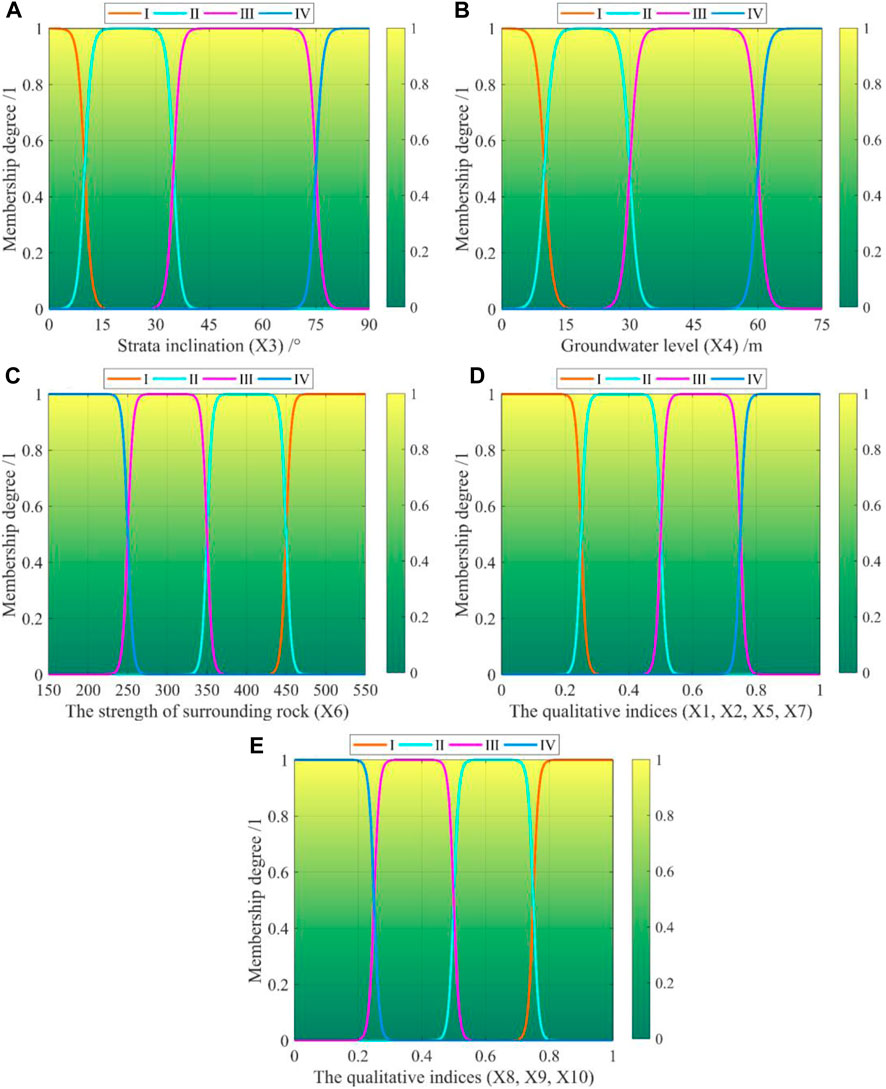
Figure 6. The improved SMF of prediction indices (A) SI (X3), (B) EH (X4), (C) SSR (X6), (D) LP (X1), UGC (X2), WS (X5), and ED (X7), and (E) SM (X8), MM (X9), and GP (X10).
For index X4, the improved SMF is (Figure 6B):
For index X6, the improved SMF is (Figure 6C):
3.2.2.2 The improved SMF of qualitative indices
For indices X1, X2, X5, and X7, the improved SMF is (Figure 6D):
For indices X8, X9, and X10, the improved SMF is (Figure 6E):
According to Eqs 5–24, the interval membership degree matrix
3.3 Interval weights of prediction indices
3.3.1 Subjective weight
Analytic hierarchy process (AHP), proposed by American operations researcher Thomas Saaty, is a method to solve the multi-criteria problem (Saaty, 2003). It can quantitatively analyze the potential logical relationship between research objects and has the characteristics of simplicity, flexibility, and applicability. In this paper, the improved analytic hierarchy process (IAHP) is used to calculate the subjective weight of indices, and the specific steps of IAHP are as follows (Wang et al., 2012; Zhang et al., 2013):
Firstly, according to the established prediction index set, using 1–9 scale method to compare pairs of two indices at the same level (Liu et al., 2018), the interval judgment matrix
where
Secondly, the normalized eigenvectors corresponding to the maximum eigenvalues of
where
Finally, the subjective weight
3.3.2 Objective weight
Entropy was originally a thermodynamic concept. Entropy can measure the uncertainty of the system when it is introduced into information theory. The greater the difference in the probability of random occurrence of various events in the system, the smaller the uncertainty, and the greater the amount of useful information provided by the event. The basic idea of entropy method is to determine the index weight according to the amount of information provided by the index value (Mehdi et al., 2019; Perera et al., 2019).
Suppose there are m tunnel water inrush cases and n prediction indices. The index value is standardized and expressed by the standardized matrix
where
Based on the basic principle of information entropy, the entropy value of the prediction index
The objective weight
where
3.3.3 Comprehensive weight
Comprehensive weight is the coupling of subjective and objective weights to make the weight value more consistent with the actual situation. Based on the subjective weight
where
3.4 Relative advantage analysis of interval vector based on the Boolean matrix
According to Eqs 25, 37, the interval vector
Suppose
The Boolean matrix
Based on the sorting method of a Boolean matrix, the result vector
The final water inrush risk grade can be determined by the maximum value of
4 Results
Currently, the KS2 tunnel has been excavated from the downstream to the upstream to KS82+077. In this paper, KS82+494−KS82+077 was selected as the research area. The surface cover thickness in this section is 31–36.4 m, which is mainly Quaternary Holocene sand and gravel. It is a strong permeable layer. The underlying stratum is Carboniferous tuff sandstone, with developed joint fissures, and with F1, F2, F4, and F5 faults passing through. F1 fault width is 3-4 m, the occurrence is 300° SW∠70°, while F2 fault width is 1 m, and the occurrence is 79° SE∠76°. In addition, the width of F4 and F5 faults are 0.5 m and 0.6m, and the occurrences are 11°NW∠65° and 320°NE∠75°, respectively. According to the geological survey, hydrological conditions, construction management, and geological forecast of the KS2 tunnel, the research area was divided into four sections, and the corresponding prediction index values were obtained, as shown in Table 2.
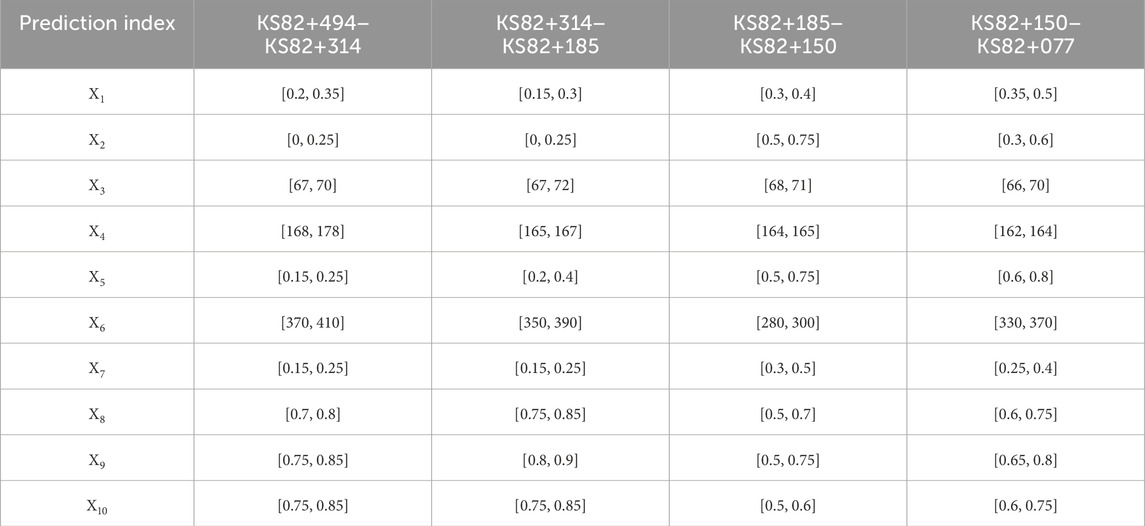
Table 2. The prediction index values of water inrush risk in the section KS82+494−KS82+077.
4.1 Index weight
Based on the set of prediction indices established in this paper, the judgment matrices
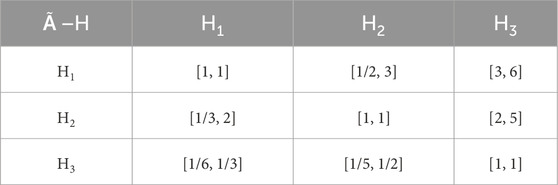
Table 3. Judgment matrix of
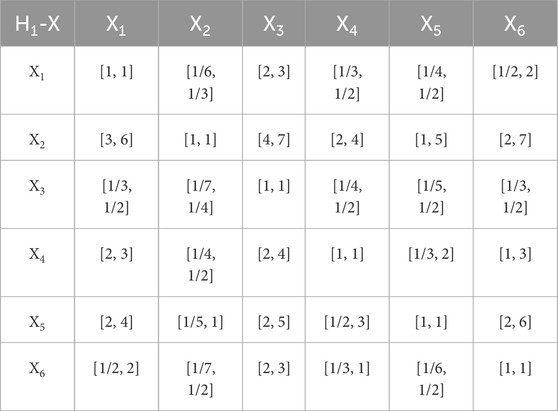
Table 4. Judgment matrix of H1−X.
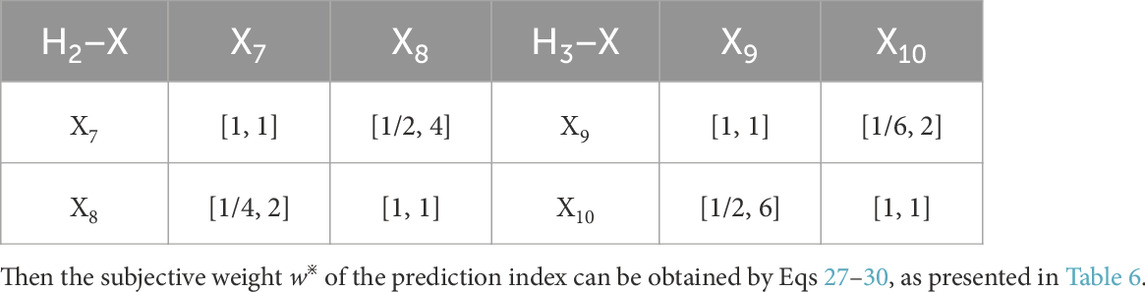
Table 5. Judgment matrix of H2−X and H3−X.
According to Eqs 31–36 and the prediction index values (Table 2), the objective weight
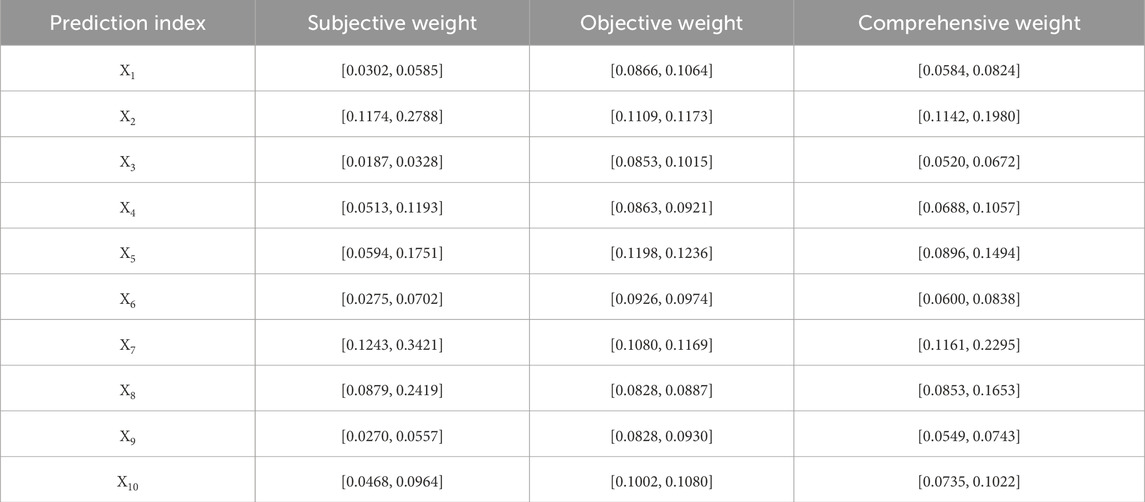
Table 6. The weight of the prediction index.
4.2 The membership degree of the prediction index
The membership degree matrix L of the prediction index can be constructed by Eq. 25.
In Eqs 44–47,
4.3 Relative advantage analysis of interval vector
According to Eqs 40–43, the prediction results of KS82+494−KS82+077 were obtained, as shown in Table 7.
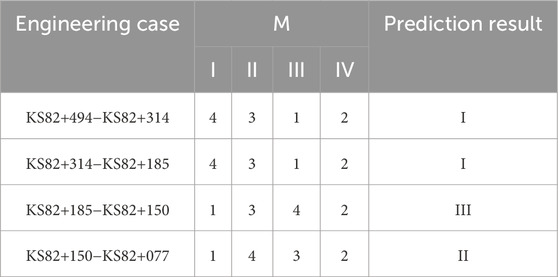
Table 7. Risk prediction results of KS82+494−KS82+077 for water inrush.
In Table 7, the result vector M of KS82+494−KS82+314 and KS82+314−KS82+185 belonging to the different risk levels is
5 Discussion
5.1 Excavation verification
After the KS2 tunnel was excavated to KS82+494, water seepage and linear inrush began to appear on the wall. According to the construction record, the measured maximum water inrush volumes in sections KS82+494−KS82+314 and KS82+314−KS82+185 were 45 m3/h and 95 m3/h, respectively. To further understand the hydrogeological conditions in front of the tunnel face, the seismic wave method and induced polarization method were used to enhance the advanced geological prediction of the KS2 tunnel. The detection results show that the surrounding rock of KS82+172−KS82+150 has poor integrity, joint fractures are developed, and there is a possible risk of water inrush, as shown in Figures 7, 8.
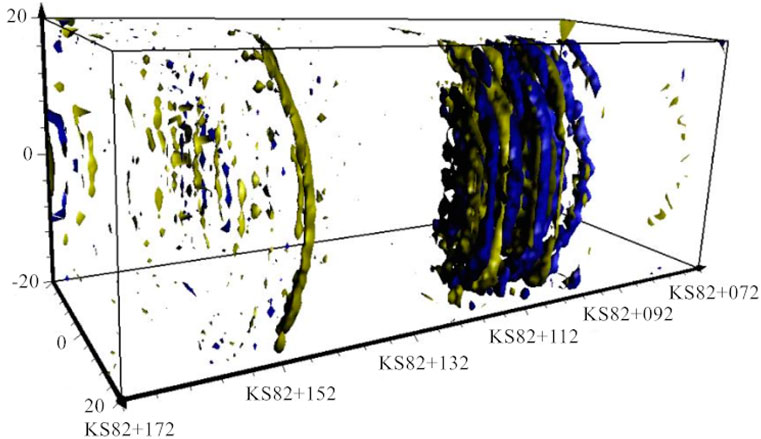
Figure 7. Three-dimensional imaging of the seismic wave at KS82+172.
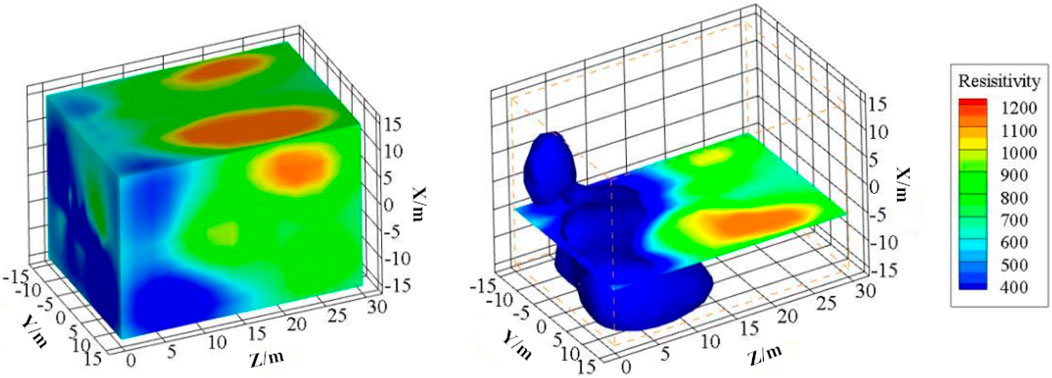
Figure 8. Three-dimensional imaging of the induced polarization method at KS82+172.
When the KS2 tunnel was excavated to KS82+172, a large area of collapse occurred on the right wall of the tunnel face. The width of the collapse was about 10.5 m, the maximum depth of the collapsing cavity was 5 m. Simultaneously, large-scale water inrush occurred, and the maximum water inrush is 880 m3/h. Due to the insufficient drainage capacity in the tunnel, the KS2 tunnel was submerged, as shown in Figure 9. Moreover, water inrush occurred again at KS82+145 on 20 April 2020, and the maximum water inrush is 320 m3/h.
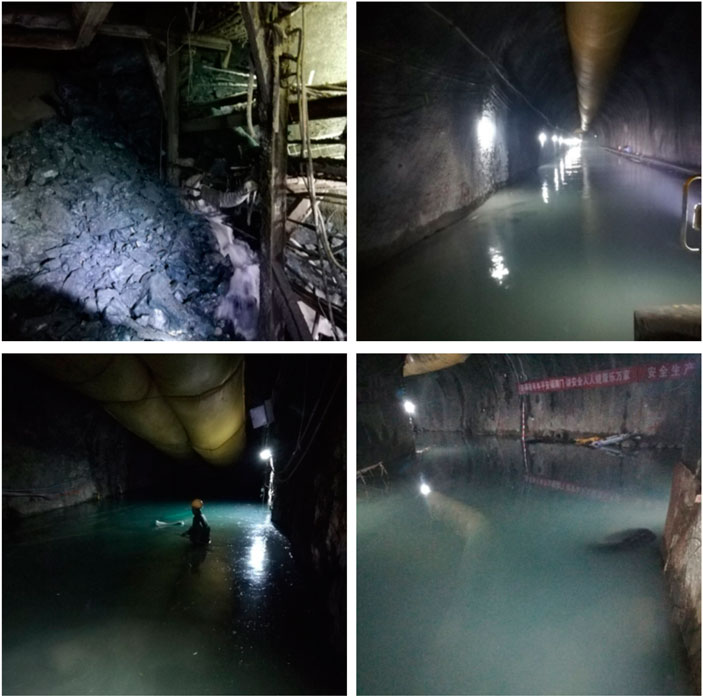
Figure 9. The actual situation of the KS2 tunnel water inrush.
Through comparison and analysis with the prediction results of the proposed model, the prediction results are in good agreement with the actual excavation conditions, indicating that the proposed model has high accuracy and reliability.
5.2 Risk management
To improve the risk control ability during the construction process, developing a risk management response mechanism is very necessary. If the risk level of water inrush is level I, the disturbance to the surrounding rock should be minimized and the supporting measures should be strengthened in the process of tunnel construction. For tunnel water inrush with a risk grade of II, monitoring measurement and geological prediction should be strengthened during tunnel construction, and the construction scheme should be dynamically adjusted in time. When the risk level of tunnel water inrush is level III or IV, the construction of the tunnel should be stopped immediately and the emergency drainage scheme should be formulated. Meanwhile, advance grouting intercept water is carried out in front of the tunnel face, and the next excavation cycle will be carried out after the grouting is completed.
6 Conclusion
This research proposes a novel risk prediction model of water inrush based on improved SMF, the approach can improve the accuracy of water inrush prediction considering nonlinearity, randomness and dynamic monitoring factors. The model used interval value to predict the risk of tunnel water inrush, avoiding the situation that the traditional single index value is directly applied to the risk prediction, and which is more in line with the engineering practice. According to the IAHP and entropy methods, a coupling algorithm of subjective and objective weights was proposed to calculate the index weight, which reflected both subjective experience and objective facts. In addition, the Boolean matrix was introduced into the relative advantage analysis of interval vector, and the final risk grade of water inrush was determined by the maximum value of the result vector M.
The proposed model was applied to the analysis of the water inrush risk in the KS2 tunnel. The predicted results have a high consistency with the actual situation, indicating that this model is of high accuracy and reliability. In addition, a risk management response mechanism for different risk levels of water inrush is discussed, which is expected to provide a view for risk control of other related projects and promote regional sustainable development.
Since water inrush is characterized as complex, fuzzy, and random, the application of fuzzy mathematical theory to the risk prediction of water inrush is only a preliminary attempt, and there are still some issues to be further studied, such as the flow mechanism and distribution characteristics of groundwater in the fractures of the surrounding rock. In addition, it is worth exploring the introduction of the numerical simulation into the risk analysis of water inrush, which can be combined with other methods to analyze and predict the risk of water inrush.
Data availability statement
The original contributions presented in the study are included in the article/Supplementary Material, further inquiries can be directed to the corresponding author.
Author contributions
YP: Data curation, Formal Analysis, Methodology, Writing–review and editing, Writing–original draft. ZS: Software, Supervision, Writing–review and editing. YL: Software, Supervision, Writing–review and editing. JX: Data curation, Formal Analysis, Writing–review and editing.
Funding
The author(s) declare that financial support was received for the research, authorship, and/or publication of this article. This study was supported by the Doctoral research start-up Fund of Nanyang Institute of Technology (NGBJ-2022-37, NGBJ-2022-38).
Acknowledgments
The authors appreciate the aid provided by the reviewers and editors to improve the paper.
Conflict of interest
Author JX was employed by China Railway 19th Bureau Group Second Engineering Co., Ltd.
The remaining authors declare that the research was conducted in the absence of any commercial or financial relationships that could be construed as a potential conflict of interest.
Publisher’s note
All claims expressed in this article are solely those of the authors and do not necessarily represent those of their affiliated organizations, or those of the publisher, the editors and the reviewers. Any product that may be evaluated in this article, or claim that may be made by its manufacturer, is not guaranteed or endorsed by the publisher.
References
Beard, A. N. (2010). Tunnel safety risk assessment and decision-making. Tunn. Undergr. Sp. Tech. 25 (1), 91–94. doi:10.1016/j.tust.2009.07.006
Cao, Z. Z., Yang, X. Q., Li, Z. H., and Feng, D. (2024). Evolution mechanism of water-conducting fractures in overburden under the influence of water-rich fault in underground coal mining. Sci. Rep. 14, 5081. doi:10.1038/s41598-024-54803-5
Cui, Q. L., Wu, H. N., Shen, S. L., Xu, Y. S., and Ye, G. L. (2015). Chinese karst geology and measures to prevent geohazards during shield tunnelling in karst region with caves. Nat. Hazards 77, 129–152. doi:10.1007/s11069-014-1585-6
Li, Q. D., Han, G. Z., Zeng, W. Y., and Yu, X. C. (2016). Ranking method of interval numbers based on Boolean matrix. Control Decis. 31 (4), 629–634. doi:10.13195/j.kzyjc.2015.0135
Li, S. C., and Wu, J. (2019). A multi-factor comprehensive risk assessment method of karst tunnels and its engineering application. Bull. Eng. Geol. Environ. 78, 1761–1776. doi:10.1007/s10064-017-1214-1
Li, T. Z., and Yang, X. L. (2018). Risk assessment model for water and mud inrush in deep and long tunnels based on normal grey cloud clustering method. KSCE. J. Civ. Eng. 22, 1991–2001. doi:10.1007/s12205-017-0553-6
Li, S. C., Wu, J., Xu, Z. H., and Li, L. P. (2017a). Unascertained measure model of water and mud inrush risk evaluation in karst tunnels and its engineering application. KSCE. J. Civ. Eng. 4, 1170–1182. doi:10.1007/s12205-016-1569-z
Li, X. Z., Zhang, P. X., He, Z. C., Huang, Z., Cheng, M., and Guo, L. (2017b). Identification of geological structure which induced heavy water and mud inrush in tunnel excavation: a case study on Lingjiao tunnel. Tunn. Undergr. Sp. Tech. 69, 203–208. doi:10.1016/j.tust.2017.06.014
Li, Z., Liu, W. B., and Dong, F. (2018). Research on capability evaluation of equipment support based on comprehensive weighting method and cloud model. Command. Control Simul. 40, 69–74. doi:10.3969/j.issn.1673-3819.2018.05.014
Lin, C. J., Zhang, M., Zhou, Z. Q., Li, L. P., Shi, S., Chen, Y., et al. (2020). A new quantitative method for risk assessment of water inrush in karst tunnels based on variable weight function and improved cloud model. Tunn. Undergr. Sp. Tech. 95, 103136. doi:10.1016/j.tust.2019.103136
Liu, Q., Chen, X., Wu, Z., Liu, X., Jie, W., and Zhanwei, C. (2013). Determination method of nonlinear membership function based on the fuzzy density means cluster. Res. J. Appl. Sci. Eng. Technol. 5 (8), 2527–2530. doi:10.19026/rjaset.5.4691
Liu, W. T., Li, Q., and Zhao, J. Y. (2018). Application on floor water inrush evaluation based on AHP variation coefficient method with GIS. Geotech. Geol. Eng. 36, 2799–2808. doi:10.1007/s10706-018-0502-2
Lyu, H. M., Sun, W. J., Shen, S. L., and Arulrajah, A. (2018). Flood risk assessment in metro systems of megacities using a GIS-based modeling approach. Sci. Total Environ. 626, 1012–1025. doi:10.1016/j.scitotenv.2018.01.138
Ma, D., Duan, H., Cai, X., Li, Z., Li, Q., and Zhang, Q. (2018). A global optimization-based method for the prediction of water inrush hazard from mining floor. Water 10, 1618. doi:10.3390/w10111618
Mehdi, S., Hossein, M., Seyed, Z. H., and Ali, R. I. (2019). Assessment of flood hazard mapping in urban areas using entropy weighting method: a case study in Hamadan city, Iran. Acta. Geophys. 67, 1435–1449. doi:10.1007/s11600-019-00342-x
Moore, R., and Lodwick, W. (2003). Interval analysis and fuzzy set theory. Fuzzy Sets Syst. 135 (1), 5–9. doi:10.1016/S0165-0114(02)00246-4
Perera, E. N. C., Jayawardana, D. T., Jayasinghe, P., and Ranagalage, M. (2019). Landslide vulnerability assessment based on entropy method: a case study from Kegalle district, Sri Lanka. Model. Earth Syst. Environ. 5, 1635–1649. doi:10.1007/s40808-019-00615-w
Saaty, T. L. (2003). Decision-making with the AHP: why is the principal eigenvector necessary. Eur. J. Oper. Res. 145, 85–91. doi:10.1016/s0377-2217(02)00227-8
Wang, C., Lin, L., and Liu, J. (2012). Uncertainty weight generation approach based on uncertainty comparison matrices. Appl. Math. 3 (5), 499–507. doi:10.4236/am.2012.35075
Wang, Y. C., Jing, H. W., Yu, L. Y., Su, H. J., and Luo, N. (2017). Set pair analysis for risk assessment of water inrush in karst tunnels. Bull. Eng. Geol. Environ. 76, 1199–1207. doi:10.1007/s10064-016-0918-y
Wang, X., Shi, K. B., Shi, Q., Dong, H. W., and Chen, M. (2020). A normal cloud model-based method for risk assessment of water inrush and its application in a super-long tunnel constructed by a tunnel boring machine in the arid area of northwest China. Water 12 (3), 644. doi:10.3390/w12030644
Wang, J., Li, S. C., Li, L. P., Lin, P., Xu, Z. H., and Gao, C. l. (2019a). Attribute recognition model for risk assessment of water inrush. Bull. Eng. Geol. Environ. 78, 1057–1071. doi:10.1007/s10064-017-1159-4
Wang, X. T., Li, S. C., Xu, Z. H., Lin, P., Hu, J., and Wang, W. (2019b). Analysis of factors influencing floor water inrush in coal mines: a nonlinear fuzzy interval assessment method. Mine Water Environ. 38, 81–92. doi:10.1007/s10230-018-00578-x
Wu, Y. J., Cao, Z. Z., Li, Z. H., Feng, D., Wenqiang, W., Minglei, Z., et al. (2024). Seepage evolution characteristics and water inrush mechanism in collapse column under mining influence. Sci. Rep. 14, 5862. doi:10.1038/s41598-024-54180-z
Xu, Z. H., Li, S. C., and Li, L. P. (2011). Risk assessment of water or mud inrush of karst tunnels based on analytic hierarchy process. Rock Soil Mech. 32 (6), 1757–1766. doi:10.1007/s12182-011-0118-0
Yang, X. L., and Zhang, S. (2018). Risk assessment model of tunnel water inrush based on improved attribute mathematical theory. J. Cent. South Univ. 25 (2), 379–391. doi:10.1007/s11771-018-3744-5
Zhang, S. R., Sun, B., Yan, L., and Wang, C. (2013). Risk identification on hydropower project using the IAHP and extension of TOPSIS methods under interval-valued fuzzy environment. Nat. Hazards 65, 359–373. doi:10.1007/s11069-012-0367-2
Zhang, Z. Q., Xu, P., Zhang, H., and Zhang, K. J. (2019). Dynamic change characteristics of groundwater affected by super-long tunnel construction in the western mountainous area of China. Sustainability 11, 2329. doi:10.3390/su11082329
Zhao, D. K., Wu, Q., Cui, F. P., Xu, H., Zeng, Y., Cao, Y., et al. (2018). Using random forest for the risk assessment of coal-floor water inrush in Panjiayao Coal Mine, northern China. Hydrogeology J. 26, 2327–2340. doi:10.1007/s10040-018-1767-5
Keywords: water inrush, SMF, comprehensive weight, interval number, risk prediction
Citation: Pi Y, Sun Z, Lu Y and Xu J (2024) A novel model for risk prediction of water inrush and its application in a tunnel in Xinjiang, China. Front. Earth Sci. 12:1404133. doi: 10.3389/feart.2024.1404133
Received: 20 March 2024; Accepted: 17 July 2024;
Published: 02 August 2024.
Edited by:
Manoj Khandelwal, Federation University Australia, AustraliaReviewed by:
Zhengzheng Cao, Henan Polytechnic University, ChinaDavide Sartirana, University of Milano-Bicocca, Italy
Copyright © 2024 Pi, Sun, Lu and Xu. This is an open-access article distributed under the terms of the Creative Commons Attribution License (CC BY). The use, distribution or reproduction in other forums is permitted, provided the original author(s) and the copyright owner(s) are credited and that the original publication in this journal is cited, in accordance with accepted academic practice. No use, distribution or reproduction is permitted which does not comply with these terms.
*Correspondence: Yuanyue Pi, cGl5dWFueXVlMTdAbWFpbHMudWNhcy5hYy5jbg==