 Xuan Yan1,2
 Miao Li
- 1College of Geographical Science, Harbin Normal University, Harbin, China
- 2Heilongjiang Province Key Laboratory of Geographical Environment Monitoring and Spatial Information Service in Cold Regions, Harbin, China
Carbon storage plays a vital role in the provision of ecosystem services, and the alteration of land use has a profound influence on the carbon storage capacity of ecosystems. Therefore, in this study, two scenarios of natural evolution scenario (NES) and ecological conservation scenario (ECS) were set up based on the development of Mohe City,China. Meanwhile, a coupled model of LUCC and ecosystem carbon storage was established using Logistic-CA-Markov and InVEST models, as well as optimal parameters_based geographical Detector and GeoDa, to predict the distribution and change of ecosystem carbon storage based on LUCC in the future. The effects of different influencing factors on the spatial differentiation of carbon storage were also explored. The results show that: (1) From 1980 to 2020, the land use type in Mohe City was dominated by the forest and its area decreased; the area of wetland increased. From 2020 to 2040, ecological benefits will be shown under the ECS, with an increase in forest and a slower expansion of built-up. (2) Carbon loss in Mohe City from 1980 to 2020 was 4.04Tg. Under the ECS carbon storage increased slightly by 0.2Tg. Soil carbon storage was the main carbon pool in Mohe City, and forest was the largest contributor. The carbon storage of Mohe city in 2030 and 2040 has a strong positive spatial correlation. Hot spots in more than a cold spots area, the high value area is concentrated in the east, low concentrated in urban areas. (3) Apart from LUCC, mean annual precipitation was the most significant factors affecting the spatial differentiation variability of carbon storage. The interactions of mean annual precipitation and population density with other factors exhibit a non-linear enhancement,which had a coefficient of 21.91%. This study contributes to a deeper understanding of the relationship between LUCC and carbon storage.
1 Introduction
Terrestrial ecosystem carbon storage is an important component of global carbon storage and plays a vital role in maintaining the global carbon cycle and addressing climate change. It is significant in reducing the concentration of greenhouse gases, such as CO2 in the atmosphere, regulating the regional microclimate, mitigating global climate change, and maintaining ecological balance (Houghton, 2003; Ge et al., 2008; Lu et al., 2022). Meanwhile, as one of the components of ecosystem services, carbon storage has been identified as key in assessing the response of terrestrial ecosystem services to global climate change (Zhu et al., 2022). Land use/cover change (LUCC) is the main factor affecting carbon storage in terrestrial ecosystems, second only to fossil fuel combustion in terms of its contribution to the increase of CO2 concentration in the air (Houghton et al., 2012; Baumann et al., 2017). It has been demonstrated that the increase in CO2 is closely related to the ecosystem carbon stocks affected by LUCC (Wang et al., 2022b). Previous studies have shown that the impact of LUCC on ecosystem carbon storage depends mainly on how ecosystem types and land types are converted (Zhu et al., 2020). The carbon storage increases when land types with a high carbon density are converted to those with low carbon density, and vice visa (Ren et al., 2021). Thus, the conversion of land types in the region will lead to changes in the total carbon storage. It also changes the energy, structure and biological cycles of the ecosystem, thus changing the carbon sequestration capacity of the soil and vegetation (Bai and Xue, 2020). As vegetation and soil are the two most important carbon pools in terrestrial ecosystems, the changes in vegetation growth and soil environment caused by land use dynamics will directly affect the changes in carbon storage (Alam et al., 2013). Currently, global ecosystem services are gradually declining under the influence of human activities and climate change (He et al., 2023). Therefore, quantifying the relationship between land use dynamics can effectively monitor the changes of regional carbon and carbon storage is important for optimizing land use patterns, balancing the carbon cycle process, and achieving sustainable development in the region.
Methods used to evaluate carbon storage include field measurements, ecosystem carbon fluxes monitoring, and model simulations (Zhang and Peng, 2012; Li et al., 2020; Sun et al., 2022). Although field measurements and ecosystem carbon flux monitoring methods are more direct and accurate, they are inevitably time consuming and costly (He et al., 2023). Also, long-term and large-scale carbon storage changes and impact mechanisms cannot be studied (Sun and Liu, 2020). Compared with the first two methods, the model simulation methods have been employed by many scholars to evaluate carbon storage due to their obvious advantages in large scale and spatial-temporal series variation (Chen et al., 2015; Zhao and Cao., 2018). The InVEST (Integrated Valuation of Ecosystem Services and Trade-Offs) model is widely adopted due to advantages including the use of few parameters, fast operation, reflecting the relationship between LUCC and carbon storage, and the ability to spatially express the carbon storage distribution (Hou et al., 2018; Zhao et al., 2018). The process of land use dynamics under different scenarios is complex, and combined with the results of land use projections, the carbon storage under different future scenarios can be assessed. The CA-Markov (Cellular Automata-Markov) model is extensively used in the simulation of LUCC under different scenarios as it can set each policy as a constraint and can use natural, economic and social factors as drivers in the prediction process, resulting in high prediction accuracy (Shi et al., 2021; Hao et al., 2022). Currently, numerous domestic and international studies have demonstrated the effectiveness of the CA-Markov and InVEST models in simulating and evaluating LUCC and its impact on carbon storage (Liang et al., 2021; Sarathchandra et al., 2021; Yang et al., 2021). For example, at the scale of urban clusters, Zhu et al. (2022) explored the impact of land use/land cover change on ecosystem carbon storage in coastal areas of China from 1980–2050. At the watershed scale, Zhu et al. (2020) studied the ecosystem carbon storage in the Qihe Basin under different scenarios. At the conservation area scale, Zhang et al. (2022b) projected changes in carbon storage in the Qinba Mountains ecosystem under different development scenarios from 2000 to 2040.
However, the mechanism of carbon storage was often analyzed from the perspective of LUCC. There is a lack of spatial variation of carbon storage from the perspective of natural and socioeconomic factors, to quantitatively analyze the spatial-temporal influences on long-term carbon storage from a multi-dimensional perspective. Forest ecosystems accumulate nearly 40% of terrestrial biomass carbon and are an important source of carbon storage (Hoque et al., 2021). Most of the current studies focus on the impact of urban expansion on carbon storage, and there is a shortage of studies on forestry resource development-oriented areas. Forestry resource development cities undertake vital ecological services and provide important services such as soil and water conservation and carbon sinks. At the same time, nearly 25 percent of the world’s population relies primarily on forest resources for their livelihoods (Islam et al., 2022). With the introduction of various resource conservation policies in China this category of cities has begun to transform, which has led to changes in the land use change situation. The Mohe city is an ecological safety and security zone in China, which is known for its richness in forests, minerals, and rare plants. The city is rich in forest and wetland resources, accounting for more than 80 percent of the total area, and is an important carbon sink and carbon storage area for China’s terrestrial ecosystem. But in the course of economic development forest land has been consumed on a large scale. To protect forest resources and the ecological environment, the State has implemented some ecological projects, such as returning farmland to forest. However, in previous studies, the overall carbon storage in Mohe City has not been assessed in a holistic manner, as well as exploring the impacts of LUCC on it. In summary, combined with eleven driving factors, this paper applies the CA-Markov model to predict the spatial pattern of land use under two scenarios of natural evolution and ecological conservation in 2030 and 2040, based on clarifying the LUCC in Mohe City from 1980 to 2020. We also combined the InVEST model and the Optimal Parameters-based Geographical Detector (OPGD) to explore the characteristics of the spatial-temporal distribution of carbon storage in Mohe City, and analyzed the driving factors of its spatial differentiation, in order to provide suggestions for the carbon balance and optimization of land use structure in Mohe City.
2 Data and method
2.1 Study area
Mohe City (121°12′E−127°00′E, 50°11′N-53°33′N) belongs to the Greater Hinggan Mountains region and is located in northwestern Heilongjiang Province with an elevation range of 159–1,404 m (Figure 1). It is the city with the highest latitude in China, has an area of approximately 18,427 km2 and is situated in a typical perennial permafrost zone within China (Zhou and Guo, 1982). It has a cold continental monsoon climate with long, dry and cold winters and short, hot and humid summers (He et al., 2015). The mean annual temperature and precipitation are −5.5°C and 260–600 mm, respectively, with precipitation mainly concentrated in July and August (Zhang et al., 2022a). The topography of Mohe City is high in the south and low in the north, with a sloping downward trend from north to south, and a landform type that can be divided into three zones from south to north, with the middle mountain zone in the south, the low hill zone in the middle and the hilly zone along the river plain in the north. The area contains large forests and wetlands with a high carbon sequestration capacity (Chen et al., 2022). The city has six towns and a permanent population of about 54,000 people. Major industries include tourism, wood processing, and coal. The total GDP value in 2022 will be about $4.67 billion, with a first growth rate in the Greater Hinggan Mountains region.
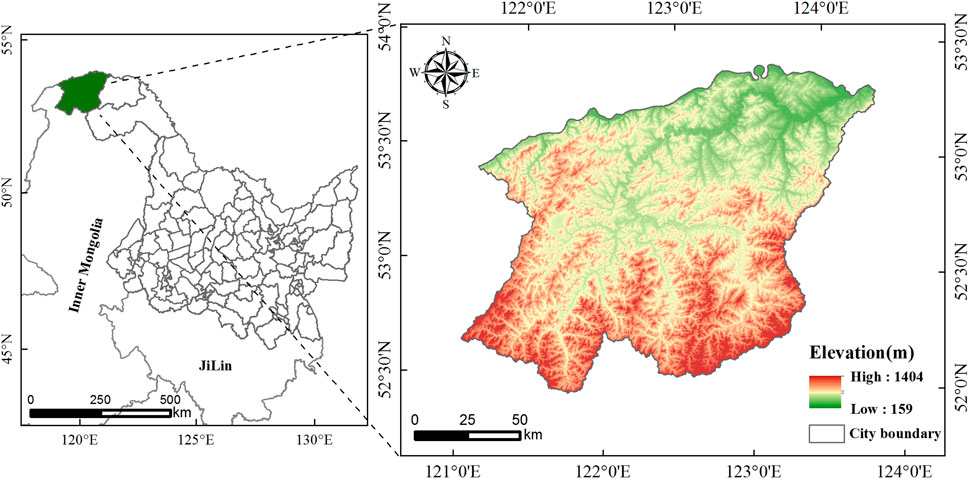
Figure 1. Schematic diagram of the study area.
2.2 Data
2.2.1 Land use data
In this study, the land use data were obtained from the Resources and Environment Science and Data Center of the Chinese Academy of Sciences (RESDC, https://www.resdc.cn/) with a spatial resolution of 30 m. And selected from five periods of historical data between 1980 and 2020 (1980, 1990, 2000, 2010 and 2020). Based on the actual conditions of the study area, reclassify 16 land use types in the region into six secondary land classes, namely, farmland, forest, grassland, water, built-up and wetland.
2.2.2 Natural impact factors data
In this study, Digital elevation model (DEM) obtained from the Geospatial Data Cloud (https://www.gscloud.cn/) with a spatial resolution of 30 m; slope and aspect data were extracted from DEM data. Mean annual temperature, Mean annual precipitation, Normal Difference Vegetation Index (NDVI) and vegetation type data used had a spatial resolution of 1 km provided by RESDC. The soil type data had a spatial resolution of 1 km and were obtained from the Soil Science Database (http://vdb3.soil.csdb.cn/).
2.2.3 Social economical impact factors data
The population density, night light and GDP data used had a spatial resolution of 1 km. All of them were obtained from RESDC. Data on highways and rivers were obtained from the National Catalogue Service For Geographic Information (https://www.geodata.cn/). And the POI data were provided by Open Street Map (https://www.openstreetmap.org/).
2.3 Method
2.3.1 InVEST model
The InVEST model mainly includes three evaluation modules, namely, the Freshwater Ecosystem Marine assessment and Terrestrial Ecosystem assessments (Tang et al., 2015). The Carbon module in the Terrestrial Ecosystem assessment module is widely used to calculate regional carbon storage (Lei et al., 2017; Liu et al., 2019; Zhang et al., 2022c). This study applies the module to estimate the time and space distribution of carbon in Mohe City from 1980 to 2040, based on the land use types of vegetation on the ground, underground vegetation, and the soil carbon density values. The principle of calculating carbon storage is describing as follows:
Where i is a given land type; n is the number of land use types, and equals to six in this study;
The carbon density correction formula was chosen for its high degree of generality and similar climatic conditions (Ren et al., 2021). In this study, the carbon density data obtained from the studies of Xi et al. (2010), Li et al. (2003) and Xie et al. (2004) were selected and corrected by the carbon density correction formula based on the data from Mohe City. The relationship between annual precipitation and biomass and soil carbon density was corrected using the equations in Alam et al., 2013) [formulas (3); (4)]. The relationship between mean annual temperature and biomass carbon density was modified following the equation in Giardina and Ryan. (2000) and Chen et al. (2007) (formula (5).
Where MAP is mean annual precipitation (mm); MAT is mean annual temperature (°C); CSP is the soil carbon density (Mg/hm2) corrected for annual precipitation; and CBP and CBT are biomass carbon density (Mg/hm2) corrected for mean annual precipitation and mean annual temperature, respectively.
Where KBP and KBT are the mean annual precipitation factor and mean annual temperature factor correction factors for biomass carbon density, respectively; KB and KS are the biomass carbon density correction factor and the soil carbon density correction factor respectively; C′ and C″ are the corresponding data obtained from the mean annual precipitation and mean annual temperature for Mohe city and the whole country and Heilongjiang Province respectively. The carbon density correction factor is multiplied with the national and Heilongjiang Province carbon density values to obtain the carbon density data for Mohe city (Table 1).
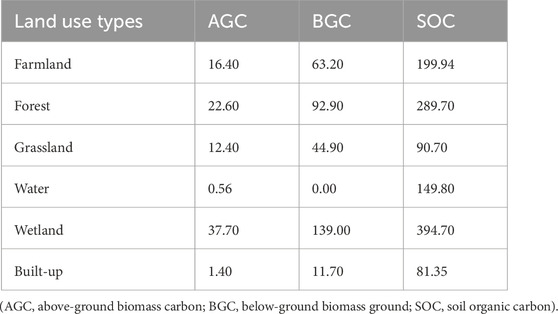
Table 1. Carbon density of different land use types (Mg/hm2).
The Chinese Terrestrial Ecosystem Carbon Density Datasets (2010–2019) from Xu et al. (2019) was used to validate the carbon density values, showing similar values for all categories in Mohe City to the results of this study. This indicates that the corrected carbon density values are in line with the actual situation.
2.3.2 Logistic regression analysis
Logistic regression analysis is suitable for regression analyses where the dependent variable consists of two categorical or continuous variables, and can be used to assess the impact of each driver on LUCC. If the independent variable xi = (x1, x2, . xn) is the driving factor for case i, and the dependent variable Yi takes the value of 0 or 1 (Yi = 0 means that the subject event does not occur, and Yi = 1 means that the subject event occurs). Y = 1 when there is a change in a particular land category, otherwise Y = 0. Suppose P is the probability of the event occurring and takes the range 0–1, then 1-P is the probability of the event not occurring. The specific formula is as follows Deng et al. (2022):
Logit transformation of formula (12) to convert to linear formula (13):
Where Pi is the probability of a land use type i in each grid,
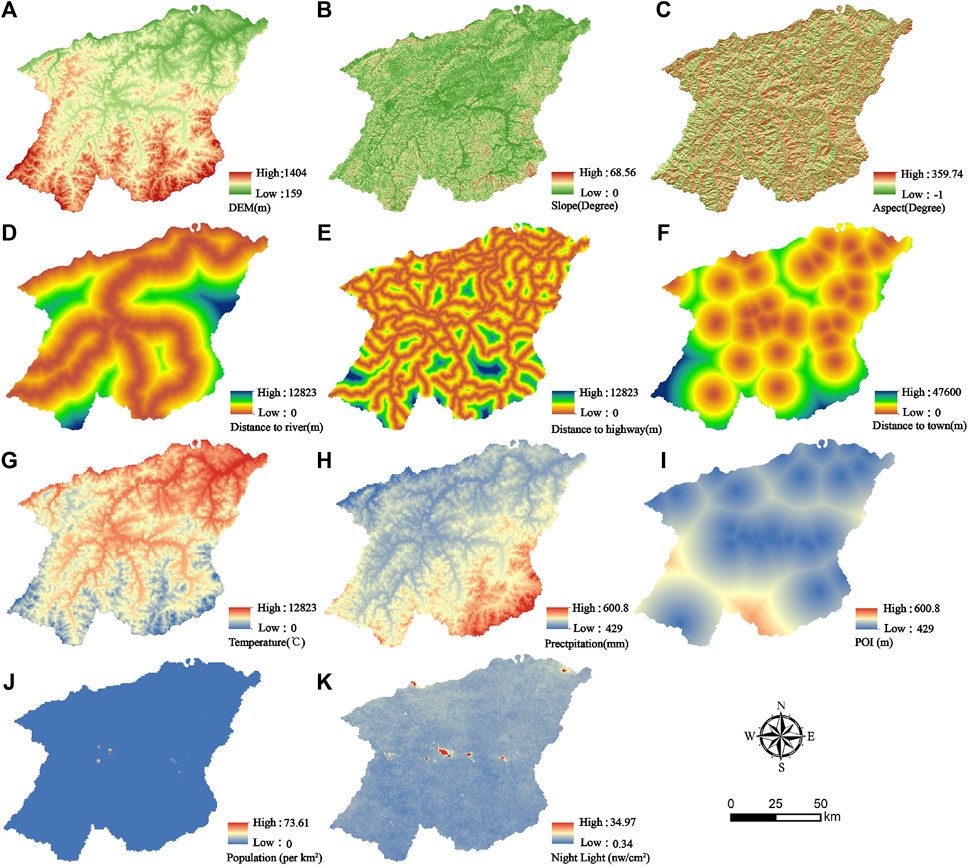
Figure 2. Driving factors of LUCC in Mohe city:(A) DEM, (B) Slope, (C) Aspect, (D) Distance to river, (E) Distance to highway, (F) Distance to town, (G) Mean annual temperature, (H) Mean annual precipitation, (I) POI, (J) Population density,(K) Night Light.
2.3.3 CA-markov model
The CA-Markov model is a combination of the CA and Markov approaches. It can simulate future LUCC in multiple directions over time using a transfer probability matrix (Kura and Beyene, 2020; Yang et al., 2021). Markov is used to simulate LUCC over time by finding the probability of land use transfer in the first and second phases, and to provide a basis for subsequent predictions (Zhao et al., 2018). The formulae for Markov are as follows:
where St and St+1 are the land use states at moments t and t+1 respectively;
Cellular automation (CA) is a spatial-temporally discrete dynamical system with a major emphasis on predictions in the spatial dimension. It can effectively generate the spatial distributions of landscapes with transition rules and simulate the spatial-temporal evolution of various natural processes, including land use dynamics (Basse et al., 2014). The model can be defined as follows:
We used the Markov method to obtain improved predictions of each land area by setting the different parameterization processes. Specifically, two scenarios were designed to understand the potential land use demand from 2020 to 2040 (Figure 3).
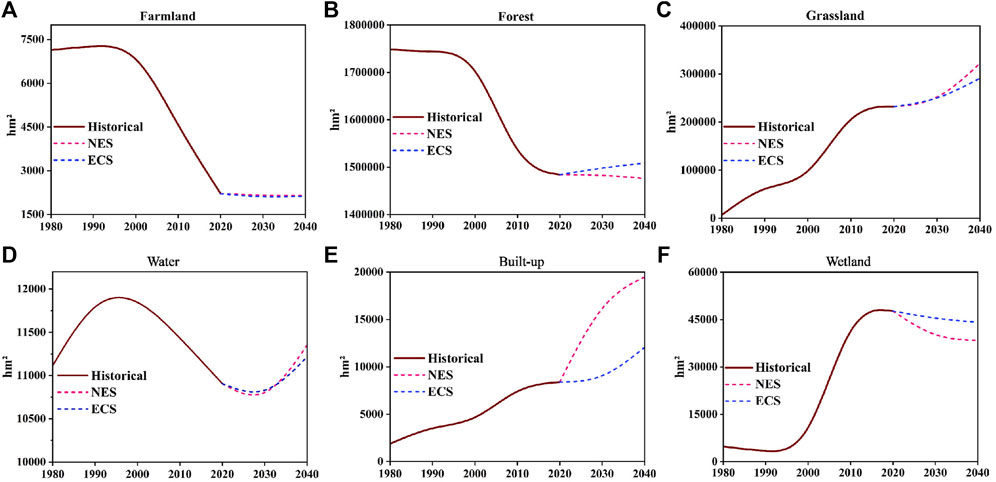
Figure 3. CA-Markov model prediction of future land use demands in Mohe City: (A) Farmland, (B) Forest, (C) Grassland, (D) River, (E) Built-up, (F) Wetland.
Each scenario was set according to the ecological protection policy, economic development, and local land use of Mohe City. The scenarios are the following: (1) Natural evolution scenario (NES): This is a future land scenario assuming no change in factors affecting LUCC in 2040. Continuing the trend of LUCC in the historical period and performing future scenario land simulation. (2) Ecological conservation scenario (ECS): This scenario accounts for ecological development, gives priority to the development of forest and wetland, and increases the probability of transfer from other lands to forest and wetland. It also restricts the expansion of built-up and simulates the implementation of policies such as returning farmland to forest, i.e., strictly controlling LUCC.
2.3.4 Optimal parameters-based geographical detectors
Geographical Detector is a method of driving analysis behind the study of spatially heterogeneous phenomena that reveals the association of spatially dependent and independent variables (Wang, 2017). It has the capability to examine the variables that influence the distribution of terrestrial carbon storage. However, its reliance on subjective criteria for determining the division of drivers results in inadequate categorization and subjectivity (Song et al., 2020). The OPGD model explores the optimal combination of different spatial data discretization methods and spatial layers, and the parameter optimization process enables further extraction of information contained in geographic features and spatial explanatory variables in the GeoDetector (Wang et al., 2023). Consequently, this research chose the OPGD to quantitatively analyze the effects of the driving factors of carbon storage in Mohe City and the interactions among the factors on the spatial differentiation of carbon storage. The calculation formula is as follows:
In the formula, q is a measure of the explanatory power of the independent variable with a value range of [0, 1]. L is the stratification of variables or factors, h is the different driving factor variables, N is the number of cells in layer h, and
2.3.5 Spatial auto correlation analysis
Spatial autocorrelation indicates whether elements with spatial units and attributes are spatially related to their neighbours (Zuo et al., 2022). The Moran’s I index is used to analyse the degree of clustering and dispersion of elements within a region as a whole, and can be divided into two categories: global autocorrelation and local autocorrelation (Getis and Ord, 1992). Since global spatial autocorrelation can only reflect the overall distribution characteristics of spatial elements, Mohe City was divided into a 3,000 m × 3,000 m grid, and local spatial autocorrelation (LISA) was used to show the spatial concentration of carbon storage in local. The formula of LISA is as follows:
The value of LI is between −1 and 1, xi and xj are respectively the values of the i and j observation objects in space; wij is the spatial weight matrix. In this study, the local concentration of carbon storage was divided into five types: High-High Cluster, Low-Low Cluster, High-Low Cluster, Low-High Cluster, and Not Significant.
3 Result
3.1 Land use dynamics during 1980–2040
3.1.1 Land use dynamics from 1980–2020
Land use changes (Table 2; Figure 4)from 1980–2020 were as follows: forest was the land use type with the most obvious change in Mohe city, making up 79.98%–94.7% of the total area, followed by grassland accounting for 3.76%–15.48%. The amount of farmland transferred out was about half of the land area. Built-up was rarely converted to other land types. The wetland transfer area was small, but the other land classes converted to wetland area was large. The water also changes less. Farmland, water, and built-up all accounted for a very small share of the area (less than 1% each).
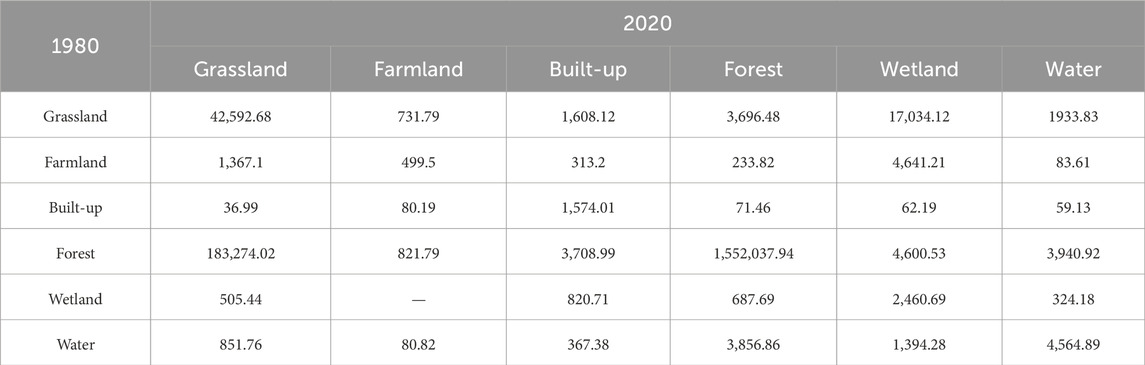
Table 2. The transition matrix of land use in Mohe city from 1980–2020 (hm2).
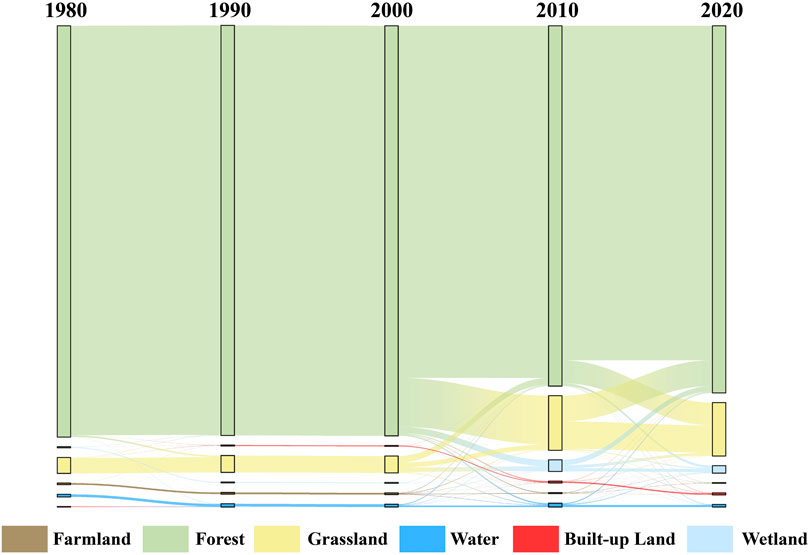
Figure 4. Dynamics of land use transformations during 1980–2020.
In the past 40 years, the transformation between categories was not obvious and was at a stable development stage from 1980 to 2000 (Figure 5). Following 2000, the conversion accelerated, with the proportion of conversion between categories increasing, particularly for forests, grasslands, and wetlands. The area of grassland and wetland showed a significant trend of increase, of which the area of grassland increased the most, by about 9%, followed by wetland by about 1.6%. The area of built-up land and water area changed less, with an increase of less than 1%. The continuous reduction of farmland was mainly due to the expansion of land for built-up and the implementation of the “return of farmland to forest” policy. The decreasing trend of forest can be attributed the continuous expansion of grassland, wetland and built-up, however the reduction rate slowed down following 2010. This was mainly due to the implementation of the Ecological Protection and Economic Transformation Plan for the Great and small Hingan Mountains Forest Areas (2010–2020) and the second phase of the Natural Forest Resources Protection Project, which completely stopped the commercial logging of natural forests and strengthened the protection of forest resources.
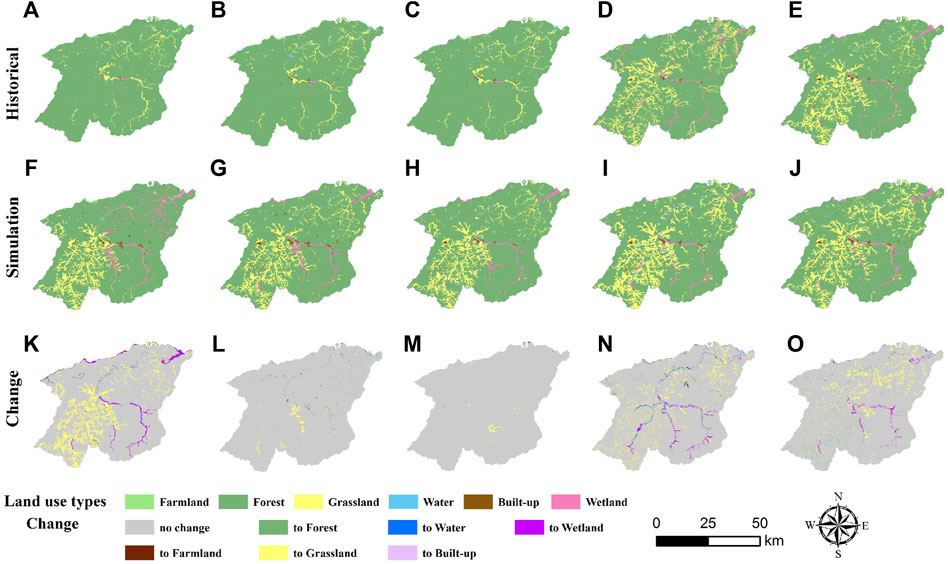
Figure 5. Land use distribution and change from 1980–2020 in Mohe city:(A) 1980, (B) 1990, (C) 2000, (D) 2010, (E) 2020, (F) Prediction 2020, (G) 2030NES, (H) 2030ECS, (I) 2040NES, (J) 2040ECS, (K) 2040ECS, (L) 1980–2020, (M) 2020-2030NES, (N) 2020-2030ECS, (O) 2020-2040NES.
3.1.2 Land use dynamics from 2020–2040
Firstly, Logistic regression analysis of the selected driving factors was performed using SPSS 19.0 software. The ROC method proposed by Pontius R.G was used to evaluate the accuracy of Logistic regression results. The regression results showed that the obtained ROC values all reached above 0.7, which indicated that the selected drivers were realistic and could be used to model future LUCC (Table 3). Combined with the results of logistic regression analysis, the changes in land use pattern in the study area in 2030 and 2040 were predicted based on the CA-Markov module in IDRISI 17.0. Firstly, based on the land use data for the three periods of 2000, 2010 and 2020, calculated the transfer probability matrix, area matrix and suitability atlas. Secondly, using the 2000 land use data as the base period data, the transfer area matrix and suitability atlas were overlaid to predict the 2020 land use in the study area. The land use results obtained from the simulation for 2020 were then compared with the actual data for the same year using the Kappa consistency index (KIA) to assess the degree of consistency between the two land use coverage maps (Landis and Koch, 1977). The obtained Kappa coefficient was 0.895 (0.61–0.80 high degree of consistency (substantial), indicating that the CA-Markov model had better simulation ability and was able to reliably predict the future land use distribution in Mohe city. Finally, the 2020 land use data was used as the basis for the predictions using the validated CA-Markov model rules and suitability atlas. The prediction results were shown in Figure 4.
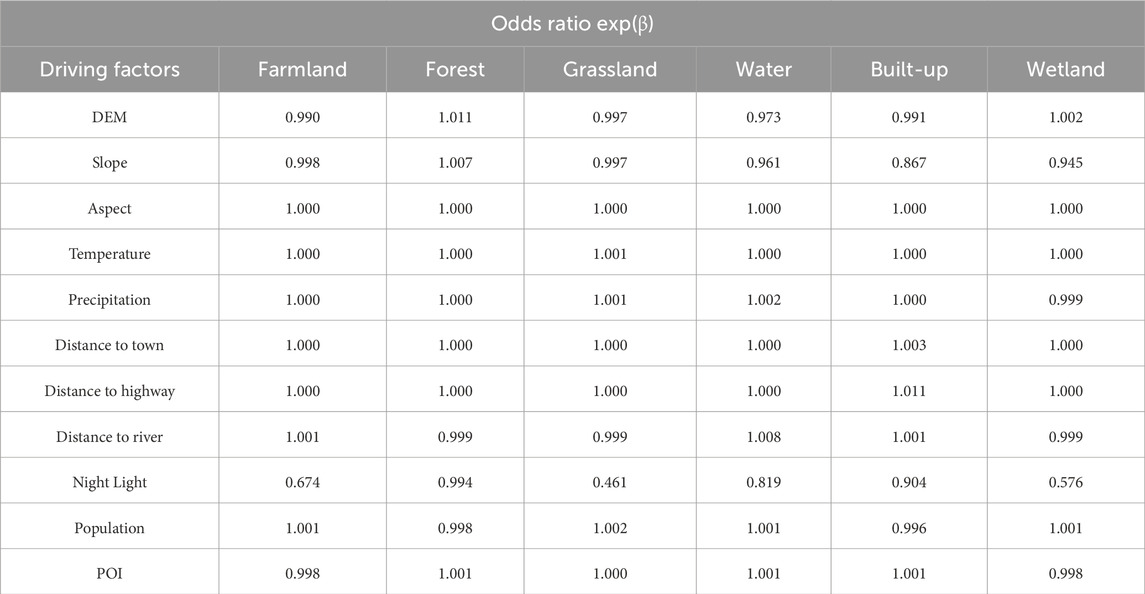
Table 3. Logistic regression analysis of driving factors.
The simulation indicated a decreasing trend in the area of farmland, forest, and wetland from 2020–2040 under both scenarios. On the other hand, grassland, waters, and built-up land will exhibit an increasing trend. In terms of the direction of transfer (Figure 6, under the NES, the reduced forest and grassland are mainly converted to wetland and built-up, with a transfer area of 1,374.07 hm2 and 8,114.29 hm2, respectively, and 5,300.73 hm2 of the forest was converted to grassland. Built-up and wetlands show a clear trend of increase, with large transfers in, but fewer transfers out. The transition between classes in 2040 is more similar to that in 2030, maintaining previous trends. In the ECS, the transfer between categories is relatively small due to the limitations of ecological protection, and in particular, no significant expansion of built-up land occurs by 2040, with an increase of only 350.63 hm2. Overall, there are large differences in changes between land types under the two scenarios, and very little change between land types under the ECS. At the same time, although forest tends to shrink in both scenarios, it shrinks less than in the NES, and the expansion of built-up land is limited by the ecological scenario, which reduces the scale of expansion.
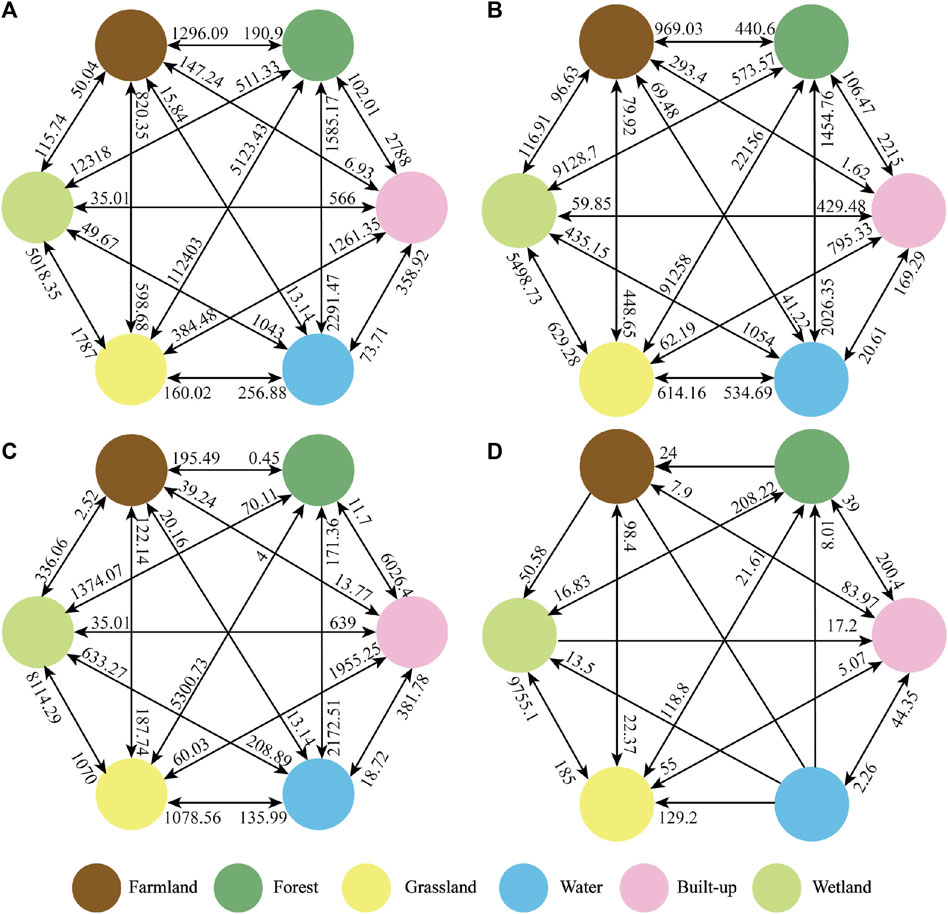
Figure 6. Transfer matrices of land use under the natural evolution scenario and ecological conversion scenario during 2020–2040 (hm2): (A) 2020-2030NES, (B) 2020-2030ECS, (C) 2020-2040NES, (D) 2020-2040ECS.
3.2 Characteristics of carbon storage dynamics during 1980–2040
3.2.1 Temporal variation characteristics of carbon storage dynamics from 1980–2040
The Carbon module of the InVEST model was used to calculate the carbon storage in Mohe city for the five periods of 1980, 1990, 2000, 2010, and 2020, determining values of 77.50Tg, 72.29Tg, 72.28Tg, 68.85Tg, and 68.46Tg, respectively (Figure 7). A “slight decrease—rapid decrease—rapid increase” trend was observed. Among them, the carbon storage decreased the fastest from 2000 to 2010, with reductions of 3.43Tg and 4.75%, respectively. The decrease was mainly due to the development of forest resources and the expansion of built-up land during the period. The decrease in carbon storage became less from 2010 to 2020, which was mainly due to the implementation of the policy of returning farmland to forest and the implementation of ecological and environmental protection, so that the forest is gradually well protected, thus providing a positive impetus for the increase of sinks in Mohe city. In terms of the overall change of carbon storage in Mohe City over the past 40 years, the carbon storage has decreased by a total of 4.04Tg, which is not significant compared to the decrease in 2000, so the overall carbon storage change in Mohe city is relatively stable. The carbon storage projections for 2030 and 2040 under the NES are 67.81 Tg and 67.44Tg, respectively. Carbon storage continues its previous downward trend, decreasing by 0.65 Tg and 1.02 Tg from 2020, respectively. Overall, the adoption of ecological protection measures can effectively reduce the loss of carbon storage, restore the level of regional carbon storage, and achieve a certain degree of carbon sequestration.
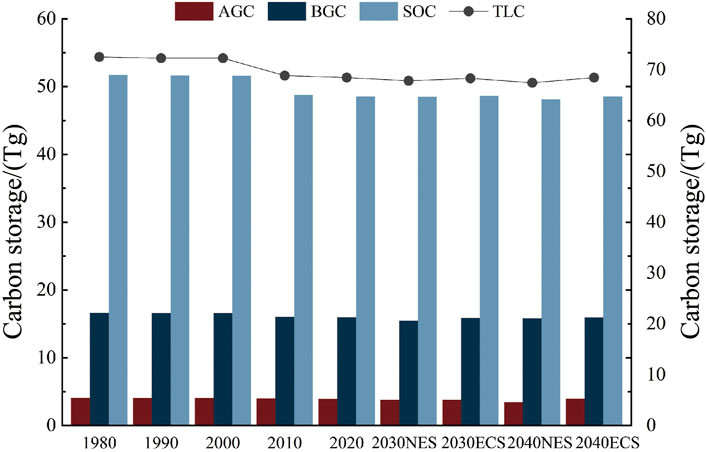
Figure 7. Changes in carbon storage in Mohe City during 1980–2040 (Tg).
From the perspective of each carbon pool, the soil carbon pool accounts for the largest share is the most important carbon pool and is the main carbon pool responsible for changes in carbon storage. All three carbon pools showed a decreasing trend from 1980–2010 and an increasing trend from 2010–2020. Among the three carbon pools, soil organic carbon decreased the most, with a total loss of 3.2Tg, accounting for 79.73% of the total carbon storage loss. Above-ground and below-ground carbon storage lost 0.13 Tg and 0.69Tg, accounting for 3.2% and 17.02% of the total carbon storage loss, respectively. All three major carbon pools in the 2020–2040 NES show a decrease, with the soil pool showing the largest decrease of 0.45Tg, which is directly responsible for the decrease in the carbon pools in the next 20 years of the NES. In contrast, in the ECS, the carbon storage of the three major carbon pools shows a weak increasing trend, which, although the increase is small, still reflects that the ecological conservation measures are effective. The soil carbon pool dominates the overall carbon storage in the study area because the carbon density of each taxon in the soil pool is generally higher than the carbon density of each taxon in the other pools.
Considering the alterations in carbon storage across categories, variations can be observed in the influence of transitions between land use types on carbon storage (Table 4). Forest was the dominant land type within Mohe city and the land type that contributed most to the changes in carbon storage over time, accounting for more than 80% of the total change. Among them, the changes in carbon storage were relatively small from 1980 to 2000, and LUCC was not significant during that period. Carbon storage in forest, wetland, and grassland from 2000 to 2010 had the greatest change in the past 40 years, with forest decreasing by 7.39 Tg and wetland and grassland increasing by 2.638 Tg and 2.375Tg, respectively. In 2010–2020, the trend of decreasing carbon storage decreased, and in particular, the rate of decrease of carbon storage in forest was significantly narrowed. This correlated strongly with the introduction of forest conservation policies, which limited the conversion of forest to land types with low carbon density. In the next 20 years, the carbon storage in built-up land and grassland will increase by 0.125 Tg and 1.293Tg, respectively, under the NES. Carbon storage in farmland, forests, wetlands, and waters will be reduced by 0.007 Tg, 1.939 Tg, 0.5 Tg, and 0.04Tg, respectively. Under the ECS, the carbon storage of built-up land, grassland, and waters increased by 0.104Tg, 0.431Tg, and 0.002Tg, respectively. Although farmland, forest, and wetland showed a decreasing trend, carbon storage in woodland decreased by only 0.198 Tg and in wetland by 0.178Tg, which is a smaller loss of carbon storage compared to the NES.
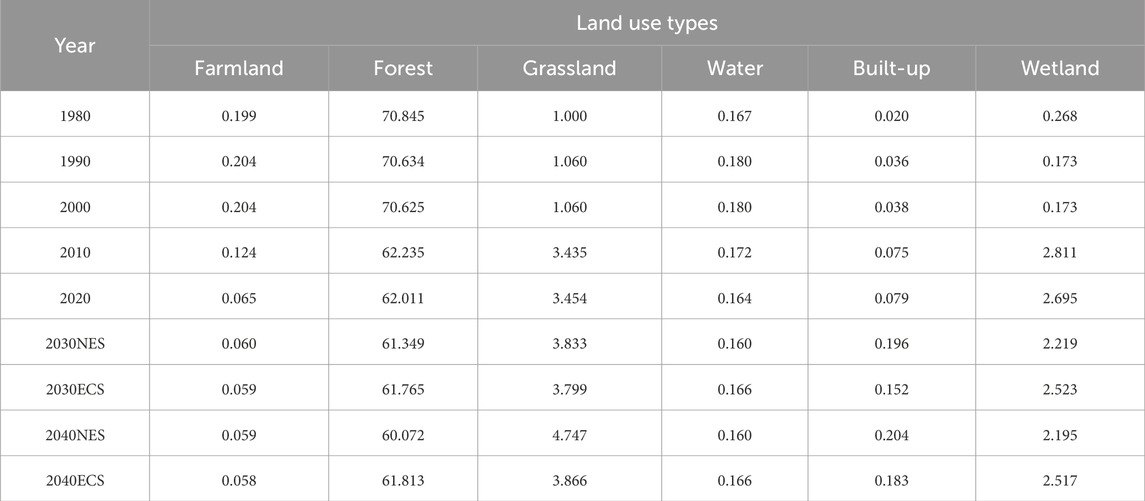
Table 4. Changes in carbon storage of different land use types in Mohe City during 1980–2040 (Tg).
3.2.2 Spatial variation characteristics of carbon storage dynamics from 1980–2040
Figure 8 depicts the spatial distribution of carbon storage in Mohe city, revealing a consistent spatial distribution from 1980 to 2000. In particular, the western and southern regions of Mohe city were high-value areas of carbon storage during this period, with the highest carbon density reaching 51.42 (Mg/hm2). In this period, the forest resources were intact and had strong carbon sequestration capacity. Low-value carbon storage regions were mainly located in the areas of Mohe city, Tuqiang town, and Xing’an town, as well as near the basins of the Amur rivers. The spatial distribution of carbon storage has changed since 2010, with a significant decrease in carbon storage in the west and south of Mohe city. This was mainly due to the accelerated urbanization process, the extensive exploitation of forest resources, and the rapid expansion of built-up land. This has led to a change in the distribution of vegetation, with a shift from vegetation with a high carbon sequestration capacity, such as forest, to land types with a low carbon sequestration capacity, such as built-up land and grassland. Under the natural evolution and ecological conservation scenarios, the spatial distribution pattern of carbon storage in Mohe City over the next 20 years has a small range of changes in the main body, (Figure 7; Figures 8F–I). The low carbon density areas were still mainly distributed in the southwestern part of the study area, which was mainly related to the direction of built-up land expansion and the transformation of vegetation types. In the northeast, the spatial distribution of low carbon value areas was more dispersed, and the degree of carbon storage change was weakened.
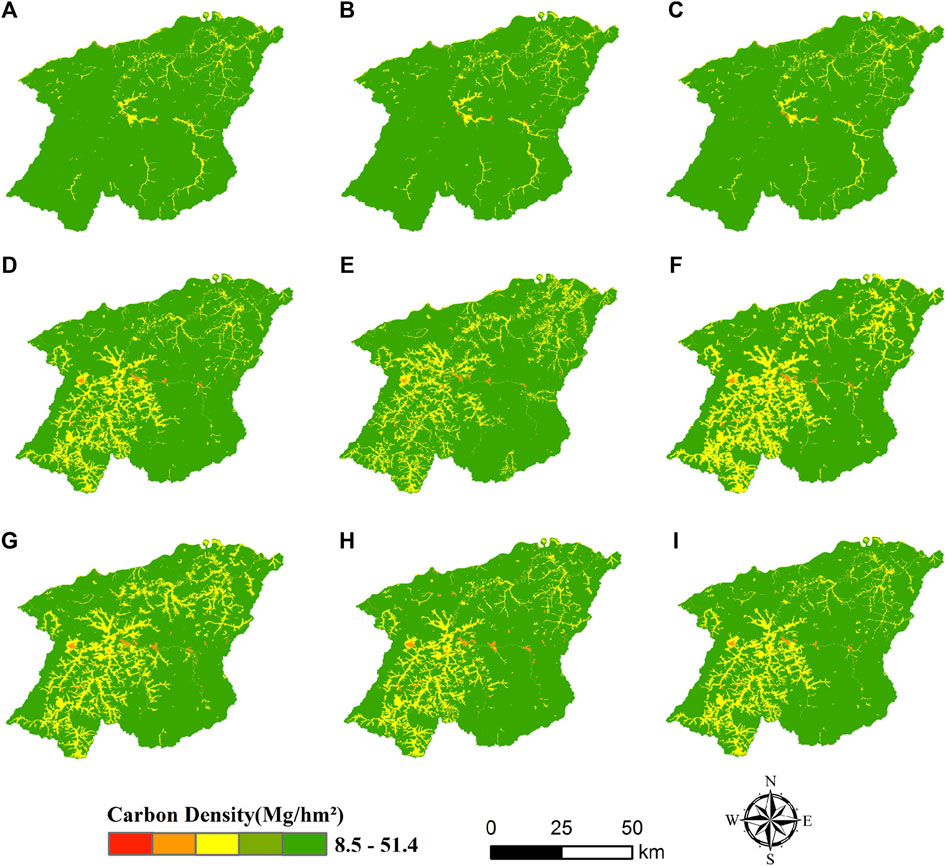
Figure 8. Spatial distribution of carbon density in Mohe City during 1980–2040:(A) 1980, (B) 1990, (C) 2000, (D) 2010, (E) 2020, (F) 2030NES, (G) 2030ECS, (H) 2040NES, (I) 2040ECS.
To better illustrate the changes in carbon storage within the study area at a spatial scale, the spatial variances in carbon storage were calculated between 1980 and 2020 and categorized into three groups (Figure 9; Table 5). From 1980 to 2020, the carbon storage in Mohe city was not much varied spatially, 87.02% of the area remained unchanged, 10.89% showed a decreasing trend, and 2.08% showed an increasing trend. Most of the change in reserve loss occurred near towns and in the southwestern part of the study area. The areas with increased carbon storage are mainly located near the Amur River basin and the northern part of Mohe City, and the conversion of land use was mainly from farmland to grassland and forest, and from grassland to wetland. The most pronounced changes were observed between 2000 and 2010 throughout the study period, which is the same trend as the LUCC. Overall changes in carbon storage for the next 20 years are more pronounced for the NES than for the ECS. Under the NES, the rate of change in the area of carbon storage reduction is 8.92% higher, and the decrease in carbon storage change is mainly concentrated in the northeast and southwest, which is mainly related to the expansion of built-up land and the conversion of forest to land types with low carbon densities. In contrast, the increasing area is mainly concentrated in the lower part of the Amur River Basin and near natural scenic areas, and although the carbon density shows higher growth, the global share is still lower than that of the decreasing area. The ECS accounts for a smaller proportion of carbon density reduction areas than the NES, and the reduction areas are mainly concentrated in areas with high values of nighttime light radiance. Although the carbon storage increasing areas accounted for a smaller proportion of the total, they were higher than the decreasing areas, thus showing an overall increasing trend.
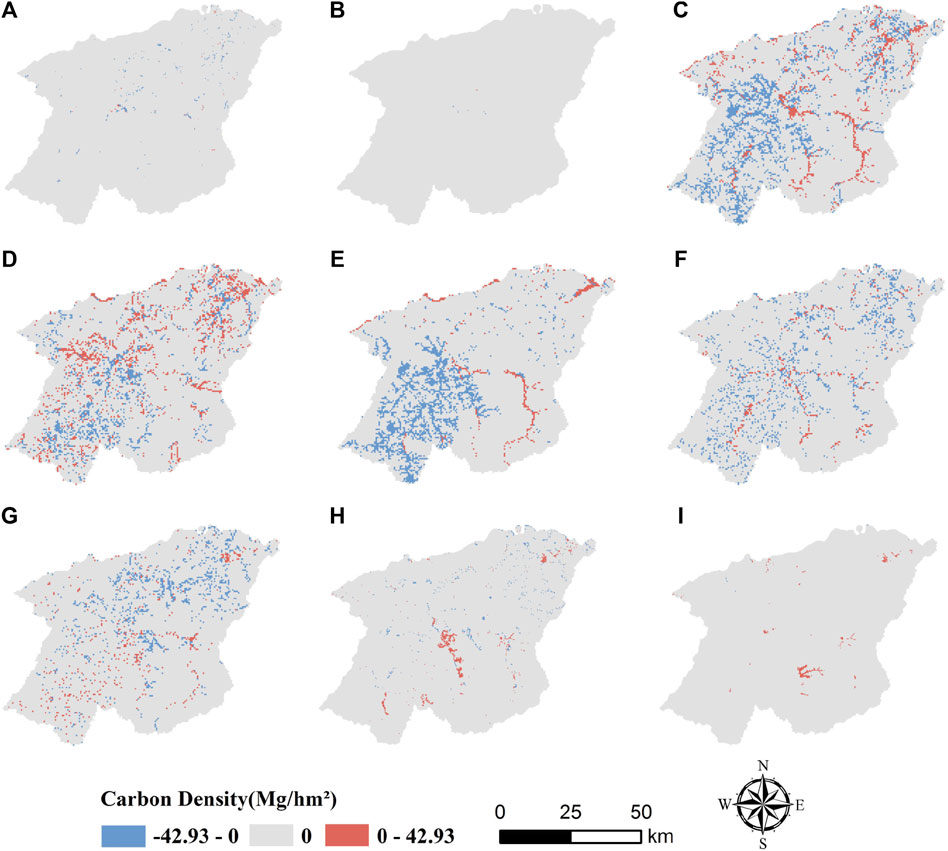
Figure 9. Spatial variation of carbon change in Mohe City during 1980–2040: (A) 1980–1990, (B) 1990–2000, (C) 2000–2010, (D) 2010–2020, (E) 1980–2020 (F) 2020-2030NES, (G) 2020-2030ECS, (H) 2020-2040NES, (I) 2020-2040ECS.
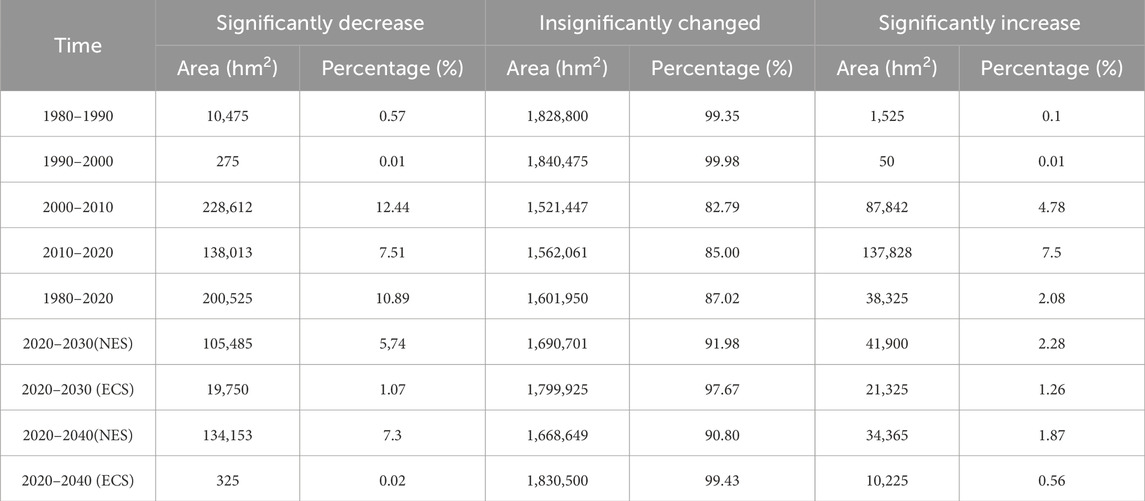
Table 5. Comparison of changes in carbon intensity under different scenarios in Mohe city.
3.3 Carbon storage spatial distribution driving force analysis
3.3.1 Optimal parameter identification
The reasons for the spatial variation in carbon storage in regional ecosystems are influenced by natural and socioeconomic factors. In this paper, the OPGD analysis is performed by selecting the factors that characterize the natural and socioeconomic factors, including DEM (X1), slope (X2), slope direction (X3), mean annual temperature (X4), mean annual precipitation (X5), soil type (X6), vegetation type (X7), NDVI (X8), population density (X9), GDP (X10), and nightlight (X11), which are 11 drivers in total, in a synthesized manner with reference to several literature. The results revealed that the q-values varied significantly across different discretizations and combinations of intervals (Figure 10). Existing studies usually use the combination with the largest q-value as the optimal parameter for discretizing the data in the study. Therefore, the natural breaks method was chosen to classify DEM, slope, precipitation, temperature, NDVI, and GDP into seven categories; slope direction into seven categories using the standard deviation classification method; population density into eight categories using the quantile method; and nightlight into five categories using the geometric interval method.
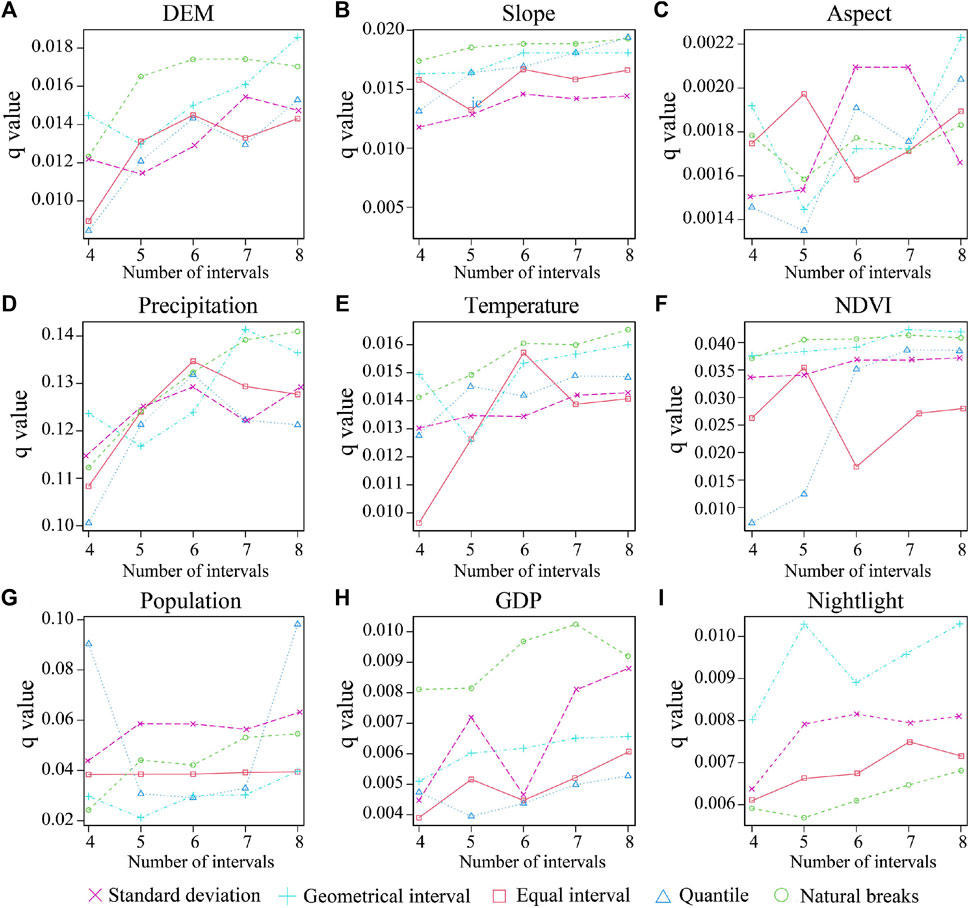
Figure 10. Discretization for continuous variables: (A) DEM (B) Slope (C) Aspect (D) Mean annual precipitation (E) Mean annual temperature (F) NDVl (G) Population density (H) GDP (I) Night Light. (Note: The parts of the graph without values are those that do not pass the test of significance).
3.3.2 Single factor detection
The results from the single-factor analysis demonstrated that all factors significantly influenced the spatial distribution characteristics of carbon storage in Mohe city (all p-values are less than 0.001). The explanatory power of natural environmental factors on carbon storage was greater than that of socioeconomic factors, which is closely related to the actual development of Mohe City (Figure 11A). The explanatory power of average annual precipitation was 0.1413, which was the strongest among the factors in explaining the spatial differentiation of carbon storage. This was followed by population density (0.0978), NDVI (0.0454), and vegetation type (0.0442). The slope has the smallest drive of 0.0022. Specifically, precipitation has a great impact on the hydrothermal conditions in the whole study area, which mainly affects the net primary productivity of vegetation photosynthesis, constrains the formation of regional carbon storage, and influences the spatial differentiation of carbon storage. Population density was an important factor in characterizing socioeconomic and could reflect the intensity of human activity in the area. Generally, higher population density correlates with increased land use efficiency. However, this trend may also prompt the conversion of high carbon density vegetation into low carbon density construction land, consequently diminishing regional carbon storage and yielding areas with reduced carbon storage value.
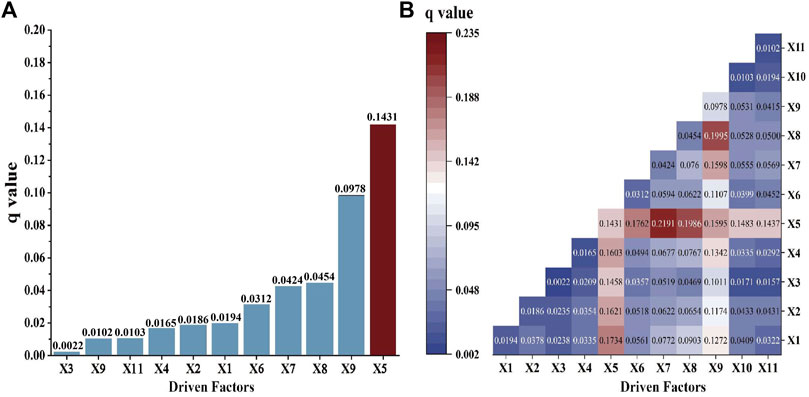
Figure 11. (A) Factor detection and (B) interactive detection results.
3.3.3 Interactive factor detection
According to the interaction factor analysis (Figure 11B), the spatial-temporal changes of carbon storage in Mohe city are not merely affected by individual factors, but rather shaped by the cumulative impact of multiple influences. A total of 55 interaction tests were generated for the 11 influece factors selected for this study. Interactions between any two factors exhibit either bivariate enhancement or non-linear enhancement, indicative of the collective explanatory potency of combining distinct elements for discerning the spatial differentiation of carbon storage. The proportion of brivate enhancement is 34.5%, and the proportion of non-linear enhancement is 65.5%. Notably, the synergy between mean annual precipitation and vegetation type exhibits the most robust interactive explanatory power, with a value of 0.2191. The explanatory power of population density ∩ NDVI is second only to mean annual precipitation ∩ vegetation type, at 0.1995. In addition to the above two interacting factors, the interactions of mean annual precipitation and population density with other factors were consistently larger, and it can be seen that mean annual precipitation and population density have a greater influence on the spatial differentiation of carbon storage in the study area, and this is stronger in combination with natural factors.
3.4 Auto correlation analysis of carbon storage space
In order to further investigate the spatial distribution of carbon storage in Mohe City, this paper adopted the spatial autocorrelation analysis method to explore the characteristics of the spatial distribution of carbon storage in Mohe City. Under the NES and ECS, the Moran’s I value of carbon storage in Mohe City in 2030 and 2040 were 0.744, 0.694, 0.698, and 0.678, respectively, indicating a positive correlation of agglomeration. To continuously analyse the degree of spatial aggregation of carbon storage, the results were analyzed by Local Indicators of Spatial Association (LISA agglomeration), and the results are shown in Figure 12. The spatial distribution of carbon storage values in Mohe City in 2030 and 2040 under the two scenarios showed some similarity, and there were more carbon storage hot spots than cold spots under the NES. The distribution of high-high clusters in carbon storage hotspot areas was concentrated, mostly in the northeast and southeast of Mohe City, and low-low clusters were mostly distributed in towns and cities, and showed the distribution structure of high-value agglomerations around low-value agglomerations.
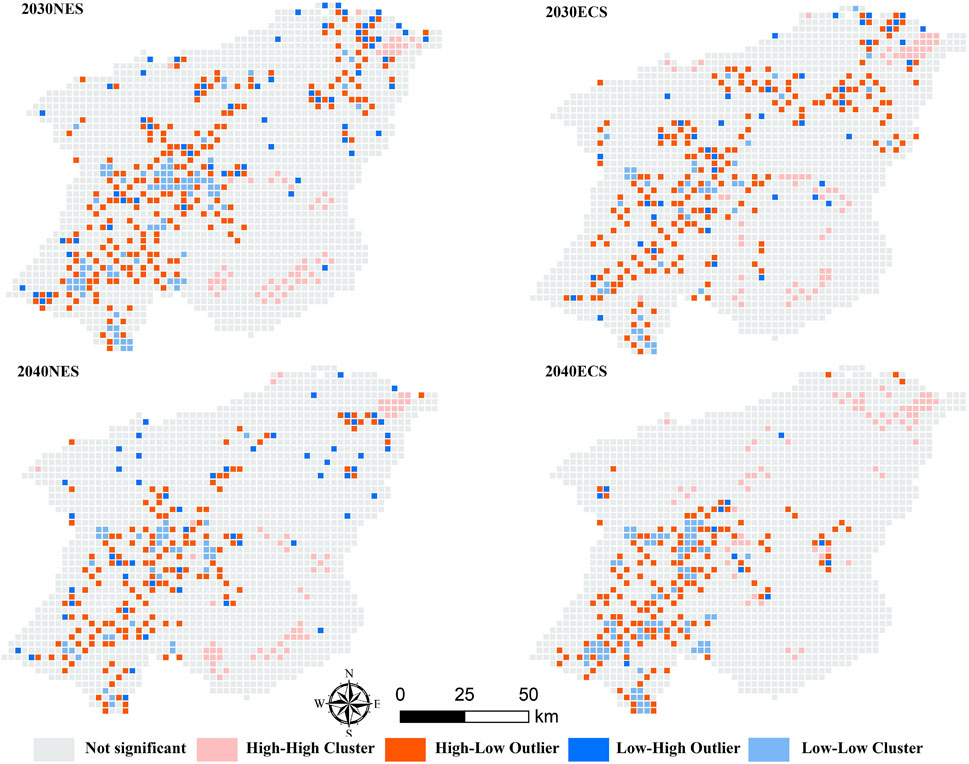
Figure 12. Local spatial autocorrelation analysis of carbon storage under two scenarios for Mohe City in 2030、2040.
4 Discussion
4.1 Response of carbon storage to LUCC
LUCC can alter the structure and function of ecosystems, thus affecting the process of ecosystem carbon cycle. And carbon storage can reflect the land use status in the region to a certain extent (Shi et al., 2023). The carbon density data used in this study were comprehensive in the literature. We compared it with the carbon density data in the results of the published literature, in which Kao Qingyun’s estimation of the carbon storage of forest vegetation in Heilongjiang Province obtained that the carbon density of the coniferous and broad-mixed forest type of vegetation was 49.63 t/hm2, which is not very much different from the carbon density of the forest vegetation obtained in this study, which was 57.75 Mg/hm2 (Kao et al., 2022). According to Zhao’s research on Zhalong wetland, the carbon density of wetland soil is 1.9–3.4 times that of farmland, and the carbon density of wetland soil in this study is within this range (Zhao et al., 2011). Overall, the more important carbon density data of this study are correspondingly reliable and can be applied to the study of overall spatial-temporal changes in carbon storage. The carbon storage showed a decreasing trend from 1980 to 2020, and the area of built-up expanded rapidly during that period, and the expansion of built-up was mainly at the cost of forest. In addition, the forest resources of Mohe City were heavily exploited during this period. Consequently, the sharp decrease in forest from 1980 to 2020 may be the main reason for the decline in total carbon storage in Mohe city. This result is consistent with the results of Liu et al. (2019) in the study of carbon storage in Northeast China. The higher carbon density of forest and wetland in terrestrial ecosystems can effectively increase the level of carbon sinks, and the conversion of these land types to other land types will reduce vegetation and soil carbon storage, exerting a great impact on the carbon storage of terrestrial ecosystems (Liang et al., 2021; Ren et al., 2021; Shao et al., 2022). Zhang’s estimation of forest carbon storage in Heilongjiang Province showed a decreasing trend from 1973 to 2013, and the results of this study are consistent with it (Zhang et al., 2018). The simulated spatial distribution of land use types and carbon storage in the next two decades indicated that under the ECS, carbon storage in Mohe City will increase, while under the NES, carbon storage will decrease. Under the ECS, the expansion of built-up is limited, and this mitigates to some extent the intensity of encroachment on forest, wetland, etc. Moreover, limiting the exploitation of forest and wetland resources, reduces the loss of carbon storage. This suggests that the ecological conservation policy is beneficial to increasing carbon storage, which is consistent with the findings of Zhao et al. (2018) and Li (2019). The implementation of ecological protection policies is observed to be conducive to limiting the transfer of high carbon density land types to low carbon density land types, promoting the stable development of land types with high carbon sequestration capacity, and increasing the total carbon storage capacity in Mohe city.
4.2 Driving factors of spatial distribution of carbon storage
This paper used OPGD to characterize the drivers of spatial and temporal carbon storage divergence. The results showed that average annual precipitation was the strongest driver of spatial differentiation of carbon storage in the region among the natural socio-economic factors, followed by population density, NDVI, vegetation type, and soil type. This is similar to the findings of Mao et al. (2023) and Li et al. (2021) who concluded that population density and average annual precipitation play a dominant role in the spatial differentiation of carbon storage. Increased precipitation could enhance soil moisture, reduce evaporation, provide better hydrothermal conditions for vegetation, and contribute to carbon sequestration in vegetation (Wang et al., 2022a). Tang et al. (2018) also showed an increase in carbon density with increasing precipitation. Areas with high population densities store less carbon, which can be attributed to the fact that areas with high population densities are more intensively developed and have a weaker capacity to sequester carbon. Regions with high vegetation cover and high carbon density have a strong carbon sequestration capacity and make a stronger contribution to carbon storage in the region, so NDVI and vegetation type have an important influence on regional carbon storage. Studies have shown that the influence of soil type on carbon storage is mainly because different soils have different physical and chemical factors on the retention of organic carbon in the soil, resulting in different carbon densities, and thus affecting the distribution of carbon storage (Wang et al., 2023). From the interaction factors, it could be seen that mean annual precipitation ∩ vegetation type was the interaction with the strongest explanatory power. This can be attributed to the fact that changes in climatic conditions have significant effects on the spatial distribution patterns of vegetation, ultimately leading to an increase in biomass and carbon storage. The results of this study are similar to those of Liu et al. (2021). The second strongest explanatory power is population density NDVI, which indicates that both natural and socioeconomic factors have an influence on the spatial differentiation of carbon storage in Mohe City. However, the influence of natural factors is stronger than that of socioeconomic factors. The interaction between different factors can enhance the influence on the spatial partitioning of carbon storage, which suggests that the influence of drivers on terrestrial carbon storage can be considered in an integrated manner when enhancing carbon storage in a region.
4.3 Advantages and limitations of the model
In this study, the Logistic-CA-Markov model and InVEST model were used to simulate the land use and carbon storage in Mohe City, which reduced the complexity of the previous simulation to a certain extent and improved the implementation. In the analysis of the factors affecting the spatial differentiation of carbon storage, the OPGD model was used to discuss different cases of the discretization method and the number of classifications to more accurately determine the geographic characteristics of the driving factors. But there also exist errors that are unavoidable in the model. CA-Markov model ignores the influence of remote sensing image interpretation accuracy and local polices on land use distribution, which makes the simulation results uncertain (Hoque et al., 2020). The carbon density data entered into the InVEST model is fixed, but in fact the carbon density value is changed by the environment (Zhu et al., 2022). Improving the spatial resolution of the land use data to enhance the accuracy of the carbon storage assessment results. Moreover, Future research should determine how factors such as policies and institutions can be introduced into model simulations to improve the comprehensiveness of simulations. Finally, the InVEST model should incorporate additional real-world data with more detailed classification estimates for vegetation and soils when setting the carbon density parameters. And use experimental data to verify the plausibility of carbon density.
5 Conclusion
This study employed CA-Markov models to simulate land use dynamics in 2030 and 2040, considering the NES and ECS scenarios in Mohe City. The InVEST model was utilized to evaluate carbon storage, along with an analysis of the spatial-temporal patterns of carbon storage evolution. The driving factors of the spatial differentiation of carbon storage were analyzed by using the OPGD. The following conclusions were obtained.
(1) From 1980 to 2020, the area of grassland, built-up, and wetland all exhibited an increasing trend, while other land types showed a declining trend. Over the next 20 years, the change trend of different areas remains consistent across both scenarios. This suggests a continuation of past trends, with the natural evolution of these changes becoming more conspicuous.
(2) From 1980 to 2020, the carbon storage in Mohe City showed a decreasing trend of 4.04 Tg. Among the different land use types, forests made the most substantial contribution to carbon storage, averaging at 66.99 Tg. Between 2020 and 2040 the NES scenario demonstrated a downward trend in carbon storage, aligning with historical patterns. Conversely, carbon storage under the ECS scenario displayed a weak increasing trend, resulting in an increment of 0.2 Tg.
(3) Spatial-temporal variations in carbon storage are the result of a combination of factors. Besides LUCC, the dominant factors influencing temporal variations in carbon storage include average annual precipitation and population density, exerting the greatest impact. The interaction between mean annual precipitation and vegetation type exhibits the most pronounced synergistic effect on changes in carbon storage.
Data availability statement
The original contributions presented in the study are included in the article/supplementary material, further inquiries can be directed to the corresponding author.
Author contributions
XY: Formal Analysis, Writing–original draft. ML: Funding acquisition, Methodology, Validation, Writing–review and editing. DG: Data curation, Writing–review and editing. DY: Data curation, Writing–review and editing. DZ: Investigation, Writing–review and editing.
Funding
The author(s) declare that financial support was received for the research, authorship, and/or publication of this article. National Natural Science Foundation of China, No. 42371119; Excellent Young Scholars Program of Natural Science Foundation of Heilongjiang Province, No. YQ 2022D009; Key Joint Program of National Natural Science Foundation of China and Heilongjiang Province for Regional Development, No. U20A2082; Research Team Program of Natural Science Foundation of Heilongjiang Province, No. TD 2023D005.
Acknowledgments
The authors would like to thank the reviewers who provided valuable suggestions for this article.
Conflict of interest
The authors declare that the research was conducted in the absence of any commercial or financial relationships that could be construed as a potential conflict of interest.
Publisher’s note
All claims expressed in this article are solely those of the authors and do not necessarily represent those of their affiliated organizations, or those of the publisher, the editors and the reviewers. Any product that may be evaluated in this article, or claim that may be made by its manufacturer, is not guaranteed or endorsed by the publisher.
References
Alam, S. A., Starr, M., and Clark, B. J. (2013). Tree biomass and soil organic carbon densities across the Sudanese woodland savannah: a regional carbon sequestration study. J. arid Environ. 89, 67–76. doi:10.1016/j.jaridenv.2012.10.002
Bai, e., and Xue, B. (2020). A review of influences of land use and land cover change on ecosystems. Chin. J. Plant Ecol. 44, 543–552. doi:10.17521/cjpe.2020.0071
Basse, R. M., Omrani, H., Charif, O., Gerber, P., and Bódis, K. (2014). Land use changes modelling using advanced methods: cellular automata and artificial neural networks. The spatial and explicit representation of land cover dynamics at the cross-border region scale. Appl. Geogr. 53, 160–171. doi:10.1016/j.apgeog.2014.06.016
Baumann, M., Gasparri, I., Piquer-Rodríguez, M., Gavier Pizarro, G., Griffiths, P., Hostert, P., et al. (2017). Carbon emissions from agricultural expansion and intensification in the Chaco. Glob. change Biol. 23, 1902–1916. doi:10.1111/gcb.13521
Chen, G. S., Yang, Y. S., Liu, L. Z., Li, X. B., Zhao, Y. C., and Yuan, Y. D. (2007). Research review on total belowground carbon allocation in forest ecosystems. J. Subtrop. Resour. Environ. 2, 34–42. doi:10.19687/j.cnki.1673-7105.2007.01.005
Chen, Y. L., Luo, G. P., Ye, H., Wang, Y. G., Huang, X. T., Zhang, Q., et al. (2015). Sources and sinks of carbon caused by forest land use change from 1975 to 2005 in Central Asia. J. Nat. Resour. 30, 397–408. doi:10.11849/zrzyxb.2015.03.004
Chen, Z., Chen, J. P., Liu, T., Zhou, C. F., Song, H. N., and Jiang, P. (2022). Dynamic analysis of land use and ecological conditions in the mohe-tahe region of the great xing'an mountains. Sci. Technol. Eng. 22, 3387–3395.
Cheng, R. B. (2021). County based on logistic-CA-markov model research on simulation of land use change in pingchang. Univ. Chengdu Technol. doi:10.26986/d.cnki.gcdlc.2021.000561
Deng, Y. J., Hou, M. Y., Zhang, X., Jia, L., Li, Y., Yao, S., et al. (2022). Drivers of forestland change in the Qinba Mountain region of Shaanxi based on the Logistic regression model. J. Nanjing For. Univ. Sci. Ed. 46, 106–114. doi:10.12302/j.issn.1000-2006.202009045
Ge, Q. S., Dai, J. H., He, F. N., Pan, Y., and Wang, M. M. (2008). Research on land use, land cover change and carbon cycle in China in the past 300 years. Chin. Sci. Ser. D 38, 197–210. doi:10.3321/j.issn:1006-9267.2008.02.006
Getis, A., and Ord, J. K. (1992). The analysis of spatial association by use of distance statistics. Geogr. Anal. 24, 189–206. doi:10.1111/j.1538-4632.1992.tb00261.x
Giardina, C. P., and Ryan, M. G. (2000). Evidence that decomposition rates of organic carbon in mineral soil do not vary with temperature. Nature 404, 858–861. doi:10.1038/35009076
Hanley, J. A., and Mcneil, B. J. (1982). The meaning and use of the area under a receiver operating characteristic (ROC) curve. Radiology 1982, 29–36. doi:10.1148/radiology.143.1.7063747
Hao, L. N., He, S., Zhou, J. L., Zhao, Q., and Lu, X. (2022). Prediction of the landscape pattern of the Yancheng Coastal Wetland, China, based on XGBoost and the MCE-CA-Markov model. Ecol. Indic. 145, 109735.
He, R. X., Jin, H. J., Ma, F. T., Liu, F. C., and Xiao, D. H. (2015). Recent progress in studying permafrost and cold regions' environment in the Hola basin of north Greater Khingan Mountains. J. Glaciol. Geocryol. 37, 109–117. doi:10.7522/j.issn.1000-0240.2015.0011
He, Y., Ma, J., Zhang, C., and Yang, H. (2023). Spatio-temporal evolution and prediction of carbon storage in guilin based on FLUS and InVEST models. Remote Sens. 15, 1445. doi:10.3390/rs15051445
Hoque, M. Z., Cui, S., Islam, I., Xu, L., and Ding, S. (2021). Dynamics of plantation forest development and ecosystem carbon storage change in coastal Bangladesh. Ecol. Indic. 130, 107954. doi:10.1016/j.ecolind.2021.107954
Hoque, M. Z., Cui, S., Islam, I., Xu, L., and Tang, J. (2020). Future impact of land use/land cover changes on ecosystem services in the lower meghna river estuary, Bangladesh. Sustainability 12, 2112. doi:10.3390/su12052112
Hou, H. Y., Dai, E. F., and Zhang, M. Q. (2018). A review on InVEST model for the evaluation of ecosystem service function. J. Cap. Norm. Univ. 39, 62–67. doi:10.19789/j.1004-9398.2018.04.012
Houghton, R. A. (2003). Revised estimates of the annual net flux of carbon to the atmosphere from changes in land use and land management 1850–2000. Tellus B Chem. Phys. Meteorology 55, 378–390. doi:10.1034/j.1600-0889.2003.01450.x
Houghton, R. A., House, J. I., Pongratz, J., Van Der Werf, G. R., Defries, R. S., Hansen, M. C., et al. (2012). Carbon emissions from land use and land-cover change. Biogeosciences 9, 5125–5142. doi:10.5194/bg-9-5125-2012
Islam, I., Cui, S., Hoque, M. Z., Abdullah, H. M., Tonny, K. F., Ahmed, M., et al. (2022). Dynamics of tree outside forest land cover development and ecosystem carbon storage change in eastern coastal zone, Bangladesh. Land 11 (1), 76. doi:10.3390/land11010076
Kao, Q. Y., Li, J. X., Ou, X. L., and Song, Y. (2022). Temporal change of forest vegetation carbon storage and its influencing factors in hei longjiang Province. China For. Econ., 73–79. doi:10.13691/j.cnki.cn23-1539/f.2022.04.014
Kura, A. L., and Beyene, D. L. (2020). Cellular automata Markov chain model based deforestation modelling in the pastoral and agro-pastoral areas of southern Ethiopia. Remote Sens. Appl. Soc. Environ. 18, 100321. doi:10.1016/j.rsase.2020.100321
Landis, J. R., and Koch, G. G. (1977). The measurement of observer agreement for categorical data. Biometrics 17. doi:10.2307/2529310
Lei, C. J., Liu, J. X., Yong, F., Liu, H. M., Wu, J., Ding, H., et al. (2017). Multi-scenario ecosystem service assessment of Wuma River Valley based on CLUE-S and in VEST models. J. Ecol. Rural Environ. 33, 1084–1093. doi:10.11934/j.issn.1673-4831.2017.12.004
Li, H. Y. (2019). Evaluation of the ecological effect of the conversion of farmland to forest project in Liaoning Province based on remote sensing and InVEST model. Changchun: Jilin University.
Li, K. R., Wang, S. Q., and Cao, M. K. (2003). Vegetation and soil carbon storage in China. Chin. Sci. Ser. D. 33, 72–80. doi:10.3969/j.issn.1674-7240.2003.01.008
Li, M. Y., Z, S. G., and Deng, L. (2021). Spatial distribution of carbon storages in the terrestrial ecosystems and its influencing factors on the Loess Plateau. Acta Ecol. Sin. 41, 6786–6799. doi:10.5846/stxb202010132609
Li, P. J., Yu, X. B., Xia, S. X., Zhao, W., Wang, S. T., and Xu, C. (2020). The spatial distribution of soil organic carbon density and carbon storage in Baiyangdian wetland. Acta Ecol. Sin. 40, 8928–8935. doi:10.5846/stxb201911142431
Liang, Y. J., Hashimoto, S., and Liu, L. J. (2021). Integrated assessment of land-use/land-cover dynamics on carbon storage services in the Loess Plateau of China from 1995 to 2050. Ecol. Indic. 120, 106939. doi:10.1016/j.ecolind.2020.106939
Liu, X. J., Li, X., Liang, X., Shi, H., and Ou, J. P. (2019). Simulating the change of terrestrial carbon storage in China based on the FLUS-InVEST model. Trop. Geogr. 39, 397–409. doi:10.13284/j.cnki.rddl.003138
Liu, Z., Yang, J. G., Ma, L. H., Ke, Z. M., Hu, Y. M., and Yan, X. Y. (2021). Spatial-temporal trend of grassland net primary production and their driving factors in the Loess Plateau, China. J. Appl. Ecol. 32, 113–122. doi:10.13287/j.1001-9332.202101.017
Lu, Y. Y., Xu, X. L., Li, J. C., Feng, X., and Liu, L. (2022). Spatio-temporal evolution of carbon storage in Xinjiang Tianshan Mountains based on the InVEST model. Arid Zone Res. 39, 1896–1906. doi:10.13866/j.azr.2022.06.20
Mao, Y. F., Zhou, Q. G., Wang, T., Luo, H. R., and Wu, L. J. (2023). Spatial-temporal variation of carbon storage and its quantitative attribution in the three gorges reservoir area coupled with PLUS-InVEST geodector model. Resour. Environ. Yangtze Basin 32, 1042–1057. doi:10.11870/cjlyzyyhj202305014
Pontius, R. G., and Schneider, L. C. (2001). Land-cover change model validation by an ROC method for the Ipswich watershed, Massachusetts, USA. Agric. Ecosyst. Environ. 85, 239–248. doi:10.1016/S0167-8809(01)00187-6
Ren, J. X., P, T. T., Chen, Y., Xie, B. P., and Cheng, D. L. (2021). Impact of land ues change on carbon storage in Gansu Province based on carbon density correction. Ecol. Sci. 2021, 66–74. doi:10.14108/j.cnki.1008-8873.2021.04.008
Sarathchandra, C., Alemu Abebe, Y., Worthy, F. R., Lakmali Wijerathne, I., Ma, H., Yingfeng, B., et al. (2021). Impact of land use and land cover changes on carbon storage in rubber dominated tropical Xishuangbanna, South West China. Ecosyst. Health Sustain. 001, 007. doi:10.1080/20964129.2021.1915183
Shao, Z., Chen, R., Zhao, J., Xia, C. Y., He, Y. T., and Tang, F. Y. (2022). Spatio-temporal evolution and prediction of carbon storage in Beijing’s ecosystem based on FLUS and InVEST models. Acta Ecol. Sin. 42 (23), 9456–9469. doi:10.5846/stxb202201100094
Shi, J., Shi, P. J., Wang, Z. Y., and Cheng, F. Y. (2023). Temporal and spatial evolution and prediction of ecosystem carbon storage in Jiuquan City based on PLUS-InVEST model. Environ. Sci., 1–18. doi:10.13227/j.hjkx.202302222
Shi, M. J., Wu, H. Q., J, H. T., Zhu, L., Dong, T. H. P. X., and Y, Q. J. (2021). Temporal and spatial evolution and prediction of carbon stocks in Yili Valley based on MCE-CA-Markov and InVEST models. J. Agric. Resour. Environ. 38 (06), 1010–1019. doi:10.13254/j.jare.2020.0586
Song, Y., Wang, J., Ge, Y., and Xu, C. (2020). An optimal parameters-based geographical detector model enhances geographic characteristics of explanatory variables for spatial heterogeneity analysis: cases with different types of spatial data. GISci. Remote Sens. 57, 593–610. doi:10.1080/15481603.2020.1760434
Sun, J., Zhang, Y., Qin, W., and Chai, G. (2022). Estimation and simulation of forest carbon stock in northeast China forestry based on future climate change and LUCC. Remote Sens. 14, 3653. doi:10.3390/rs14153653
Sun, W., and Liu, X. (2020). Review on carbon storage estimation of forest ecosystem and applications in China. For. Ecosyst. 7 (01), 4–50. doi:10.1186/s40663-019-0210-2
Tang, X., Zhao, X., Bai, Y., Tang, Z., Wang, W., Zhao, Y., et al. (2018). Carbon pools in China’s terrestrial ecosystems: new estimates based on an intensive field survey. Proc. Natl. Acad. Sci. 115, 4021–4026. doi:10.1073/PNAS.1700291115
Tang, Y., Zhu, W. P., Zhang, H., and Song, Y. (2015). A review on principle and application of the InVEST model. Ecol. Sci. 34, 204–208. doi:10.14108/j.cnki.1008-8873.2015.03.032
Wang, C. W., Liao, J. J., and Tang, H. H. (2023). Analysis on the driving force of spatial and temporal differentiation of carbon storage in the taihang mountains based on InVEST model. Ecol. Environ. 32 (02), 215–225. doi:10.16258/j.cnki.1674-5906.2023.02.001
Wang, J. (2017). Spatial stratified heterogeneityGeodetectorq-statisticcategory variable. Acta Geogr. Sin. 72, 116–134. doi:10.11821/dlxb201701010
Wang, J., Li, L., Li, Q., Wang, S., Liu, X., and Li, Y. (2022b). The spatiotemporal evolution and prediction of carbon storage in the yellow River Basin based on the major function-oriented zone planning. Sustainability 14, 7963. doi:10.3390/su14137963
Wang, N. F., Chen, X. P., Zhang, Z. L., and Pang, J. X. (2022a). Spatiotemporal dynamics and driving factors of county-level carbon storage in the Loess Plateau: a case study in Qingcheng County, China. Ecol. Indic. 144, 109460. doi:10.1016/j.ecolind.2022.109460
Xi, X. H., Y, Z. F., C, Y. J., S, S. M., Y, C. G., and L, M. (2010). A study of soil carbon distribution and change in Northeast Plain. Earth Sci. Front. 7, 213.
Xie, X. L., S, B., Zhou, H. Z., and Li, Z. P. (2004). Soil carbon stocks and their influencing factors under native vegetations in China. Acta Pedol. Sin. 41, 699–705. doi:10.3321/j.issn:0564-3929.2004.05.005
Xu, L., He, N. P., and Yu, G. R. (2019). A dataset of carbon density in Chinese terrestrial ecosystems (2010s). China Sci. Data. 4, 90–96. doi:10.11922/csdata.2018.0026.zh
Yang, J., X, B. P., and Z, D. G. (2021). Spatio-temporal evolution of carbon stocks in the Yellow River Basin based on InVEST and CA-Markov models. Chin. J. Eco-Agriculture 29, 1018–1029. doi:10.13930/j.cnki.cjea.200746
Zhang, C., and Peng, D. L. (2012). Remote sensing retrieval model of forest carbon storage based on principal components analysis and radial basis function neural network. J. China Agric. Univ. 17 (4), 148–153. doi:10.1007/s11783-011-0280-z
Zhang, C. H., Wang, L. Y., Song, Q. W., Chen, X. F., Gao, H., and Wang, X. Q. (2018). Biomass carbon stocks and dynamics of forests in Heilongjiang Province from 1973 to 2013. China Environ. Sci. 38, 4678–4686. doi:10.19674/j.cnki.issn1000-6923.2018.0528
Zhang, L. N., Sun, Y. N., Sun, X. Y., and Chen, S. (2022a). Analysis on the variation trend and mutation characteristics of precipitation in Mohe City from 1980 to 2017. Water Resour. Plan. Des. 06, 58–62. doi:10.3969/j.issn.1672-2469.2022.06.013
Zhang, P. O., Li, Y. H., Yin, H. R., Chen, Q. T., Dong, Q. D., and Zhu, L. Q. (2022b). Spatio-temporal variation and dynamic simulation of ecosystem carbon storage in the north-south transitional zone of China. J. Nat. Resour. 37, 1183–1197. doi:10.31497/zrzyxb.20220506
Zhang, X., Wang, J., Yue, C., Ma, S., and Wang, L. J. (2022c). Exploring the spatiotemporal changes in carbon storage under different development scenarios in Jiangsu Province, China. PeerJ 10, e13411. doi:10.7717/peerj.13411
Zhao, C. D., Liu, G. D., Yang, K., Nie, H. F., Peng, M., Li, K., et al. (2011). Estimation of soil carbon storage and its change since 1986 in Zhalong wetland and its surrounding areas, Heilongjiang Province. Earth Sci. Front. 18, 27–33. doi:10.1007/s11629-011-2067-x
Zhao, J. F., and Cao, Y. (2018). Evaluation of NPP and ecological service function of China′s forest ecosystem based on remote sensing and FORCCHN. Ecol. Environ. Sci. 27, 1585–1592. doi:10.16258/j.cnki.1674-5906.2018.09.001
Zhao, M., He, Z., Du, J., Chen, L., Lin, P., and Fang, S. (2018). Assessing the effects of ecological engineering on carbon storage by linking the CA-Markov and InVEST models. Ecol. Indic. 98, 29–38. doi:10.1016/j.ecolind.2018.10.052
Zhou, Y. W., and Guo, D. X. (1982). Main features of permafrost in my country. J. Glaciol. Geocryol. 4 (1), 1–19.
Zhu, L. Y., Song, R. X., Sun, S., Li, Y., and Hu, K. (2022). Land use/land cover change and its impact on ecosystem carbon storage in coastal areas of China from 1980 to 2050. Ecol. Indic. 142, 109178. doi:10.1016/j.ecolind.2022.109178
Zhu, W., Zhang, J., Cui, Y., and Zhu, L. (2020). Ecosystem carbon storage under different scenarios of land use change in Qihe catchment, China. J. Geogr. Sci. 30, 1507–1522. doi:10.1007/s11442-020-1796-6
Keywords: LUCC, carbon storage, logistic-CA-Markov model, InVEST model, optimal parameters-based geographical Detector, spatial autocorrelation analysis
Citation: Yan X, Li M, Guo D, Yang D and Zhan D (2024) Spatial-temporal evolution and prediction of carbon storage in Mohe city by linking the logistic-CA-Markov and InVEST models. Front. Earth Sci. 12:1383237. doi: 10.3389/feart.2024.1383237
Received: 07 February 2024; Accepted: 13 May 2024;
Published: 28 May 2024.
Edited by:
Marcelo Cohen, Federal University of Pará, BrazilReviewed by:
Yongkuan Chi, Guizhou Normal University, ChinaMuhammad Ziaul Hoque, Bangabandhu Sheikh Mujibur Rahman Agricultural University, Bangladesh
Copyright © 2024 Yan, Li, Guo, Yang and Zhan. This is an open-access article distributed under the terms of the Creative Commons Attribution License (CC BY). The use, distribution or reproduction in other forums is permitted, provided the original author(s) and the copyright owner(s) are credited and that the original publication in this journal is cited, in accordance with accepted academic practice. No use, distribution or reproduction is permitted which does not comply with these terms.
*Correspondence: Miao Li, mli@hrbnu.edu.cn