- 1Frankfurt Institute for Advanced Studies, Frankfurt, Germany
- 2Institute of Physics, Johannes Gutenberg University Mainz, Mainz, Germany
- 3Institute of Geosciences, Goethe-University Frankfurt, Frankfurt, Germany
Detailed analyses of past major and minor seismo-volcanic events can help to understand the eruptive behavior of volcanoes and the underlying physical and chemical processes. Catalogs of these eruptions and, specifically, seismo-volcanic events may be generated using continuous seismic recordings at stations in the proximity of volcanoes. Here, we apply a recently-developed automated approach Adaptive-Window Volcanic Event Selection Analysis Module (AWESAM) to seismic data from Stromboli (Italy), Mount Etna (Italy), Yasur (Vanuatu) and Whakaari (New Zealand). We perform an inter-event time analysis to identify characteristic patterns in the events’ recurrence time and the volcanic activity. Using this identical approach for all volcanoes, we were able to discover that despite their differing types and activity, they exhibit similar statistical behaviors. For Whakaari, we noticed a bimodal inter-event time distribution for large events. Since this observation is based on single station data, further in-depth investigations are needed once more data is available in future. We also derive a new amplitude-frequency relationship from seismo-volcanic events. With this relation, we can confirm a change in slope for large events at Stromboli, which is based on 10 years of data. Additionally, we apply a classification model to events from Stromboli to differentiate between low-period (LP) events and high-frequency (HF) events and found an alternating behavior in the frequency of these events before and after the two paroxysms in 2019.
1 Introduction
Despite the growing interest in the continuous monitoring of volcanoes worldwide, accurately forecasting eruptions remains a significant challenge for researchers. As a result, early warning systems frequently fail to provide timely alerts. This is evident in the fatalities caused by recent volcanic eruptions, such as those at Stromboli in 2019 (Andronico et al., 2021) and Whakaari in 2019 (Dempsey et al., 2020). The difficulty arises from the complex, dynamic processes involved, where numerous interconnected (and often unknown) parameters play a role. Nevertheless, analyzing the history of volcanic activitymay reveal characteristic patterns and potential precursors for eruptions. This could not only enhance our understanding of the physical processes occurring within volcanoes but also contribute to the development of more reliable early warning systems.
Identifying potential precursors or regularities in the data is a crucial task, as it may form the basis for early warning systems and event forecasting. For instance, Dempsey et al. (2020) observed an unusual peak in the tremor data recorded at Whakaari several hours to days before an eruption. Later, this finding was applied to several other volcanoes in New Zealand and Alaska by Ardid Segura et al. (2022). For Etna, Langer et al. (2011) detected changes in tremor 1–9 h before the onset of eruptive activity using an unsupervised classification tool (employing self-organizing maps).
The goal of this study is to enhance the characterization of volcanic activity and identify patterns that could contribute to the improvement of early warning systems. The statistical analysis relies on event catalogs generated from seismic data spanning multiple years with various types of events, ranging from major to small eruptions. This approach allowed us to do a long-term comparison of the activity and enhances the statistical significance of the findings.
This type of analysis, particularly focusing on inter-event time analysis and amplitude-frequency relations, has been conducted in various contexts for many volcanoes. Nishimura et al. (2016) compared the amplitude-frequency relations of six volcanoes located in Japan, Indonesia, and Italy for different time periods. However, as some of these volcanoes are less active or not continuously monitored, only a few thousand events were analyzed per volcano. Similarly, Lehr and Rabbel (2021) analyzed data from Villarrica (Chile) to plot the amplitude-frequency relations and derive amplitude distributions. In this case, only 12 days of data were analyzed.
Since volcanic activity can change drastically over extended time periods, using data from longer intervals will provide a more representative analysis. Additionally, the characteristics of large eruptions that occur only a few times per year (or less) can only be investigated by examining sufficiently long time intervals. For instance, Bevilacqua et al. (2020) conducted an extensive analysis of a historical catalog for Stromboli spanning from 1880 to 2020, which included paroxysmal events and major explosions. Further, they executed a detailed inter-event time analysis for this period. However, the inclusion and analysis of smaller events requires instrumentally recorded data, which implies that such an extensive time span cannot currently be considered for this purpose.
2 Data
This study analyzes data from four volcanoes: Stromboli (Italy), Mount Etna (Italy), Yasur (Vanuatu), and Whakaari (New Zealand). These island volcanoes were selected based on their regular activity and the availability of open, reliable seismic data. Additionally, we focused on volcanoes with at least two operational seismological stations, as illustrated in Figure 1. Exemplary 1-h extracts of data from each volcano are displayed in Figure 2. However, due to the significant variations in volcanic activity over time, these signals are not representative of the entire time span. Each volcano exhibits unique characteristics in its activity.
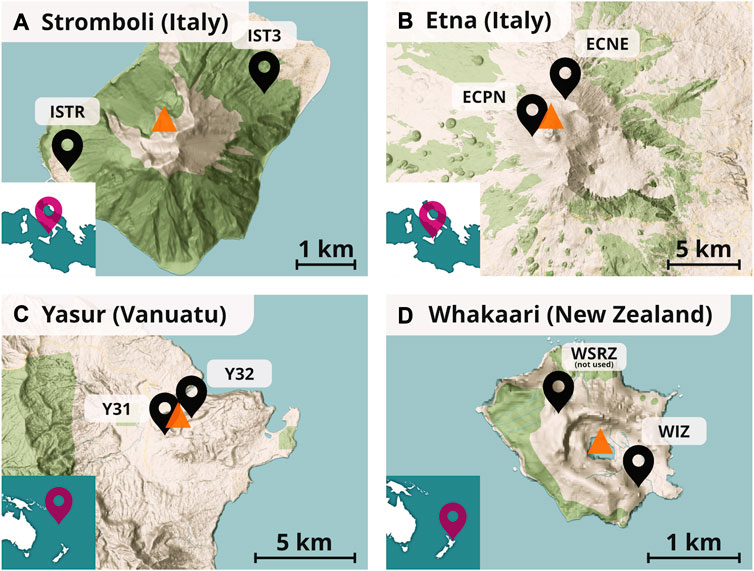
FIGURE 1. Locations of seismic stations used in this study (black pins) and the location of the central crater (orange triangle) for each volcano. OpenStreetMap, https://www.openstreetmap.org.
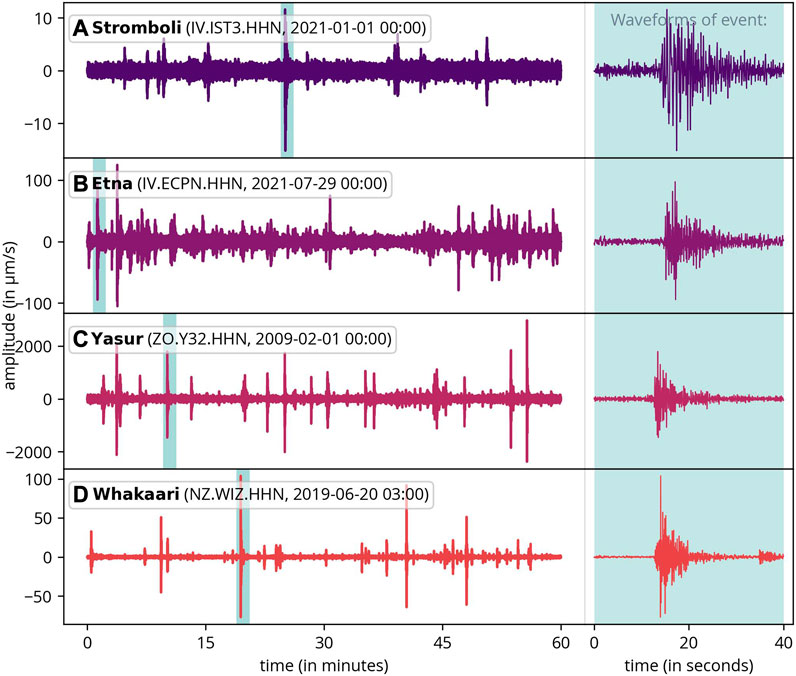
FIGURE 2. One hour of example data for each volcano, along with a detailed waveform of a single event (right). The data has been bandpass-filtered within the range of 0.7–10 Hz.
Stromboli (Italy) is an island volcano situated near Sicily, with documented activity dating back to the 8th century AD (Andronico et al., 2021). It is known for its frequent Strombolian explosions that occur every few minutes and can be observed at several craters within the crater terrace. These medium-sized events, attributed to coalescing and bursting gas bubbles (Nabyl et al., 1997), eject pyroclastic material up to several dozen meters. However, occasional paroxysmal events also occur, posing a serious threat to residents and tourists on the island. The most recent paroxysms occurred in relatively quick succession on July 3, 2019 and August 28, 2019. They ejected material several kilometers from the vents and an eruption column rose to a height of 5 km (Giudicepietro et al., 2020; Andronico et al., 2021). Fortunately, paroxysms are relatively rare, with only 36 occurrences in the last 140 years according to a historical catalog (Bevilacqua et al., 2020). However, paroxysms occurred very irregularly in the past (the longest break in paroxysms is from 1960 to 2002). Their origin is not completely understood (Giudicepietro et al., 2020). Two selected seismic stations (of many others) have been considered on the island, positioned on opposite sides of the volcano and at approximately equal distances from the crater terrace (IV.IST3, IV. ISTR). They have been operational since 2013, with data accessible through the INGV data center (Istituto Nazionale di Geofisica e Vulcanologia, 2005).
Mount Etna (Italy), situated on the island of Sicily, is the largest volcano in Europe. Over the past 30 years, it has experienced active and intense explosive and effusive activity, with eruptions characterized by Strombolian activity, lava fountains, and the formation of eruption columns (Bisson et al., 2021). The Istituto Nazionale di Geofisica e Vulcanologia (INGV) (2005) has installed numerous seismic stations in close proximity to the volcano. However, to detect even smaller events, we selected only stations within a radius of approximately 1 km around the central crater (IV.ECNE, IV. ECPN). These two stations have been operational since 2021.
Yasur (Vanuatu) is a volcano on Tanna Island. Its activity is characterized by very frequent Strombolian explosions, which, similar to Stromboli, are connected to the bursting of gas bubbles (Woitischek et al., 2020). Typically, these events last up to 20 s and eject material up to several hundred meters (Marchetti et al., 2013). We analyzed data from the ARC-Vanuatu Seismic Experiment (Pelletier et al., 2011) conducted in 2008-2009, selecting the two closest stations to the crater (ZO.Y31, ZO. Y32).
Whakaari (New Zealand) is a partially submerged andesite volcano forming a small island in the Bay of Plenty. It is currently New Zealand’s most active volcano (Kilgour et al., 2021). Whakaari’s activity primarily consists of phreatic, phreatomagmatic, and magmatic eruptions (Burton et al., 2021), which are caused by the release of pressurized fluids and gas. During volcanic unrest in the central crater cone, hot springs can be found, and the release of steam often produces gas plumes (Kilgour et al., 2021). Here, too, rare violent explosions can occur, as demonstrated by a tragic event in 2019, when 47 tourists were on the island during an eruption, resulting in the deaths of 22 people (Burton et al., 2021). There is one operational station (NZ.WIZ) that has been providing data through GeoNet (GNS Science, 2021) since 2007. Data from another station (NZ.WSRZ), placed on the opposite side of the volcano, are available for the time from 2013 to 2021. However, the signals recorded at this station were found to be very noisy, and therefore they were not used in our analysis. Because of this, we had to alter the catalog creation process slightly (see next section). Nonetheless, Whakaari remains interesting for our analysis due to its longest data record. Furthermore, its activity, distinct from Strombolian eruptions, makes it interesting to compare to the other volcanoes.
Broadband stations were analyzed at all volcanoes, with three channels (HHN, HHE, and HHZ) employed. The instruments used and their sensitivities were consistent across each volcano, respectively. We accounted for instrument sensitivity to obtain velocity seismograms. For further information regarding the sensors and instrument response, please refer to Supplementary Table S1 in the Supplementary Material.
3 Methods
3.1 Catalog creation: AWESAM
The Adaptive-Window Volcanic Event Selection Analysis Module (AWESAM) is a tool designed to automatically detect seismo-volcanic events from seismic data (Fenner et al., 2022). Originally developed for data from Stromboli, the module has been generalized for this paper to work with various volcanoes and different types of volcanic activity. To achieve this, the event detection algorithm has been extended, making it suitable for volcanoes with high activity (e.g., Yasur, see also Table 1 for details about the frequency of seismo-volcanic events) as well as those with less seismic activity (e.g., Whakaari).

TABLE 1. Statistics of the catalogs created with AWESAM for all volcanoes. The provided durations represent the data utilized in our analysis (data from Stromboli in 2012 was found not reliable and was, therefore, not used). For Whakaari, the complementary station (NZ.WSRZ) was not used because of its high noise level. The first and second distances indicate the distance from the crater to the principal and complementary stations, respectively.
The catalog creation consists of multiple steps: First, the seismic recordings undergo bandpass-filtered using consistent parameters for all stations (0.7–5 Hz). Then, the Adaptive MaxFilter algorithm is applied, followed by a prominence-peak detection, which allows for a direct determination of event times. The amplitude, on the other hand, would be distorted due to the strict frequency interval chosen in the bandpass-filtering. This is why the amplitude is determined from each component (North, East, and Up) separately with a different filter (0.7–10 Hz). When referring to the amplitude subsequently, it denotes the average value derived from the three directional amplitudes. This process is carried out independently for two stations (called principal and complementary station) that are at a similar distance from the volcano (if available).
Next, the complementary catalog is compared to the principal catalog in the catalog consolidation algorithm, which assigns events that appear at both stations a high event probability and events that occur at only one station a low event probability, thus accounting for station-specific local disturbances. This value provides a measure of the probability that the event’s origin is volcanic. Finally, each event is assigned a probability that it is a regional or distant tectonic earthquake with the help of an earthquake catalog such as (ISC, 2023). However, this method is only reliable for larger earthquakes. That is, why we use the global catalog instead of local ones, which might include a greater number of small earthquakes (that the algorithm struggles to accurately analyze). The global ISC catalog, on the other hand, covers a significantly broader area.
The catalogs used for further analysis were created using AWESAM. All data up until December 2022 were taken into account (data with too many gaps was discarded, for example, a couple of months in 2012 at Stromboli). Statistics of the resulting catalogs are summarized in Table 1.
Before analyzing these catalogs, they were filtered so that only events with a high volcanic event probability were included in the analysis. To do this, the event probability pev and earthquake probability peq were combined to form p = pev ⋅ (1 − peq), which reflects the total probability that the event’s origin is volcanic. If the event probability is not available, for example, if one of the two stations has an outage, then p = 1 − peq. For the subsequent analysis, we only considered events with a probability p > 0.3. This threshold was chosen empirically while looking at exemplary events from all volcanoes to avoid inadvertently excluding volcanic events and was found to be suitable.
Of course, the noise level makes it difficult to detect small events. Therefore, the noise level is the single most important limit to the catalog’s completeness. Additionally, changing noise levels over time result in a varying completeness amplitude.
3.2 Event classification
The preceding description did not differentiate between event types. Nevertheless, making such a distinction could unveil characteristic patterns in volcanic activity. Among all the volcanoes studied, we possess the most comprehensive catalog for Stromboli. As a result, we implemented an event classification tailored specifically for Stromboli.
For the classification process (Laumann et al., 2023), the data are initially encoded using the Wavelet scattering transform (Mallat, 2012). Subsequently, the events are embedded into a lower-dimensional space using t-stochastic neighbor embedding (t-SNE) (van der Maaten and Hinton, 2008). These embedded events can then be classified with a simple k-nearest-neighbor classification. This algorithm, which was trained using a dataset from Llaima (Canário et al., 2020), clusters the events into the following classes: long-period (LP) events, volcano-tectonic events (VT), tremors, and regional or distant earthquakes. Each of these event classes exhibits a characteristic frequency content and waveform (Wassermann, 2012; Zobin, 2009). Other event types, such as hybrid events, are not classified separately. Unlike the other event types, regional and distant earthquakes are not directly related to the volcano.
To classify events, a 60-s window starting 10 s before the maximum amplitude of each event is used. If two events are within this window, the data are trimmed appropriately and the remainder is replaced by trailing zeros. Before the classification, these data are normalized and bandpass filtered the same way as the training data. While studying the waveforms of the different classes, differences in LP and VT events were observed, but tremors and tectonic events seemed to be misclassified. In these two classes, no specific characteristics could be observed, and also events with similarities to LP and VT events were noticed. Therefore, we combined these two classes into the class called “indeterminate”, see Figure 3. Nevertheless, the classification is still useful, because the LP events exhibit a characteristic low-frequency component and VT events have high-frequency components. That is, why, in the following, we refer to VT events as high-frequency (HF) events. However, as we are employing a method trained on data from a different volcano, it is anticipated that some events may be misclassified.
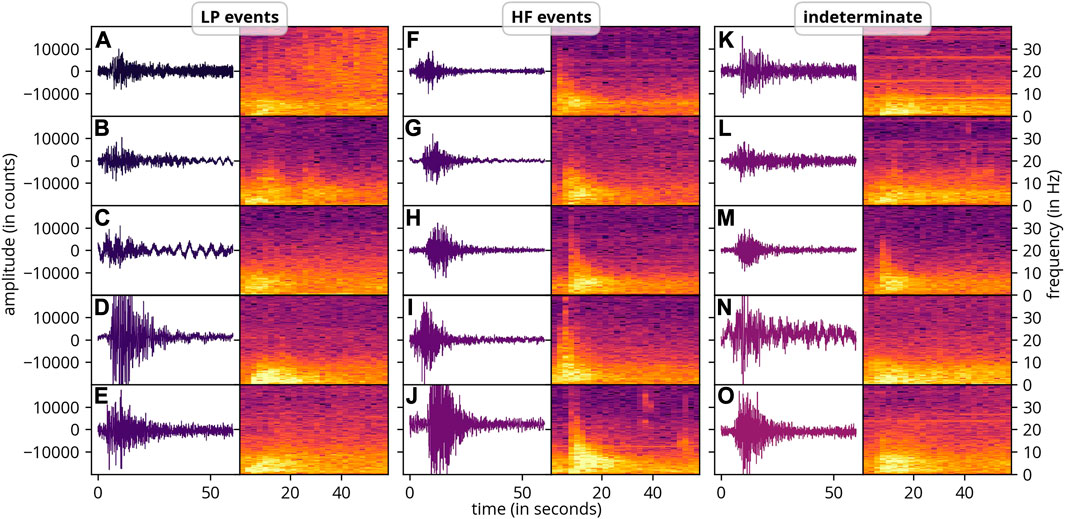
FIGURE 3. Example waveforms and spectrograms of events (from Stromboli) classified with a model based on a wavelet scattering transform and a t-SNE embedding. Long-period (LP) events have a characteristic low-frequency content, while high-frequency (HF) events have much higher frequencies. Events from the class “indeterminate” could not be assigned to a class conclusively.
4 Results
4.1 Amplitude and inter-event time statistics
Figure 4 displays all events in the catalogs for each volcano, with the color representing the relative density of events. It is important to note that amplitudes cannot be compared across different volcanoes due to the use of different instruments and setups. We did not correct for these differences, as they have no impact on our subsequent analysis. The minimal amplitude of events varies over time, which is related to the fluctuating noise level (caused by volcanic activity, wind, or ocean waves).
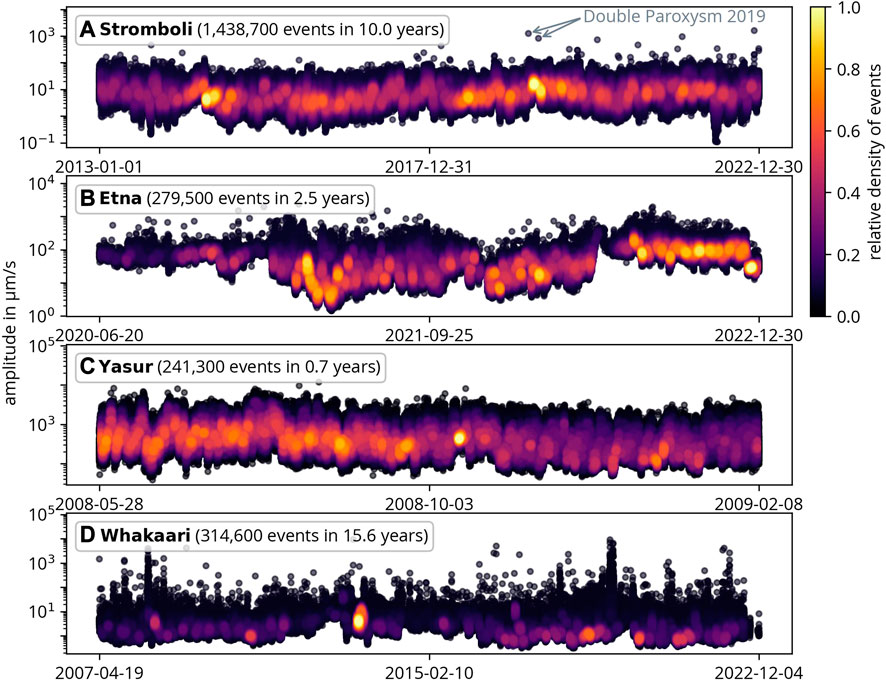
FIGURE 4. All seismo-volcanic events in the analyzed catalogs. The color represents the relative density of events. Note that different time spans and durations are shown. The double paroxysm in 2019 at Stromboli is also indicated.
Whakaari has the fewest detected events by far, with events occurring on average every 30 min. Etna and Stromboli have much more frequent seismo-volcanic events, occurring every 4–5 min. Yasur has an even higher event frequency, with an average inter-event time of 1.5 min. The average event duration for small events is approximately 40 s. These observations support our previous description that volcanic activity varies significantly among the four volcanoes. The plot also highlights the two paroxysms at Stromboli in 2019.
Figure 4 illustrates that the double paroxysm in 2019 was accompanied by a high density of medium-sized events (10–20 μm/s). In Section 4.2, the features of the activity before and after the paroxysms are analyzed in greater detail. It is important to note that seismic amplitude is only a rough measure of the severity of a volcanic eruption, as ejected material, duration, and other factors are unknown. Therefore, events with similar amplitudes in 2020-2022 do not necessarily mean that all of these are classified as paroxysms.
The amplitude-frequency relation in Figure 5 shows the fraction of all events that exceed a particular amplitude and is analogous to the Gutenberg-Richter plot used for earthquakes. To facilitate a comparison of the curves, the median noise level (and the standard deviation) is marked in each plot. It was estimated by the 0.9 quantile of the absolute data and was computed per hour. The value of 0.90 was chosen based on observations and is the best approximation for the noise level. The median was chosen (instead of the average) to avoid outliers affecting the result.
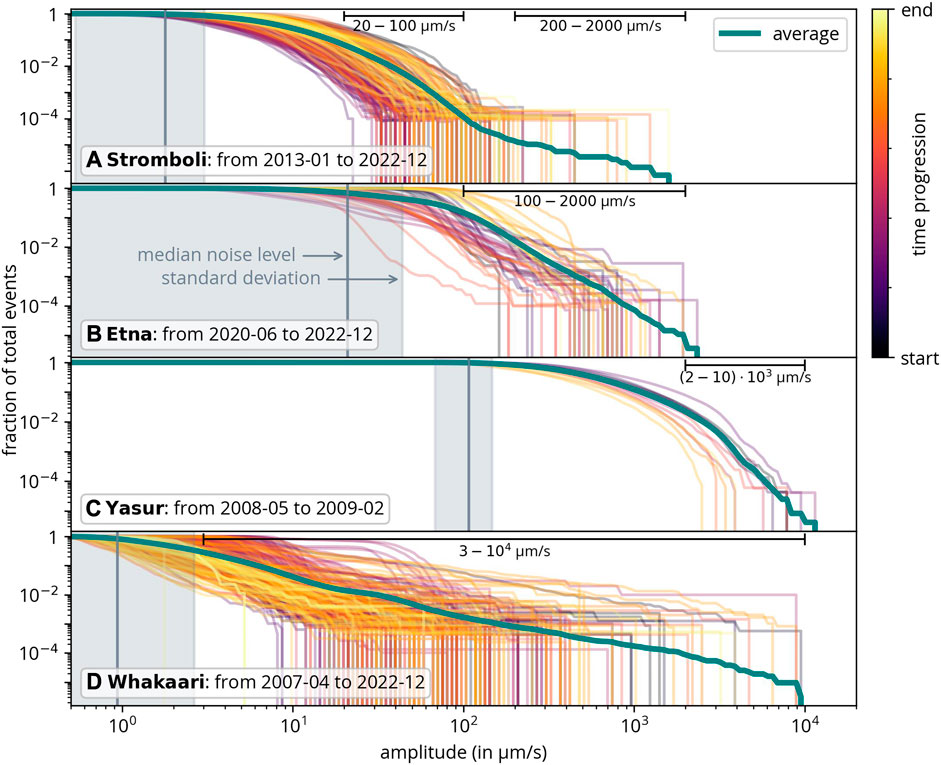
FIGURE 5. Amplitude-frequency relation (analogous to the Gutenberg-Richter relation; lines show the fraction of events that exceed a certain amplitude). The colored lines illustrate the time evolution for every 10 days and the median noise levels for each volcano are indicated. Additionally, the amplitude ranges used to calculate the slopes of the average (green curve) in Figure 6 are displayed too.
The green lines in Figure 5 represent the data from the whole catalog. In the cases of Etna, Yasur and Whakaari, this average approximately follows a linear relation that gradually diminishes towards low amplitudes. This is similar to the Gutenberg-Richter relation for earthquakes. Stromboli, however, shows an interesting change in slope.
To visualize the different slopes in the amplitude-frequency relation, a linear fit was applied to the linear section of each relation. The resulting slopes, or more precisely the absolute values of the slopes, are shown in Figure 6, along with the respective fitting errors. Because Stromboli exhibits two linear sections with different slopes, separate fits were done. It is important to note that the station distance and instrument properties are likely to have no impact on the slope (as only the logarithm of amplitude is considered). Among these volcanoes, Yasur has the highest slope, while Whakaari shows the lowest. This slope is a characteristic property of the volcano, reflecting the relative frequency of larger and smaller events. A lower value indicates that larger amplitudes are relatively abundant. Next, these amplitude distributions will be studied in more detail.
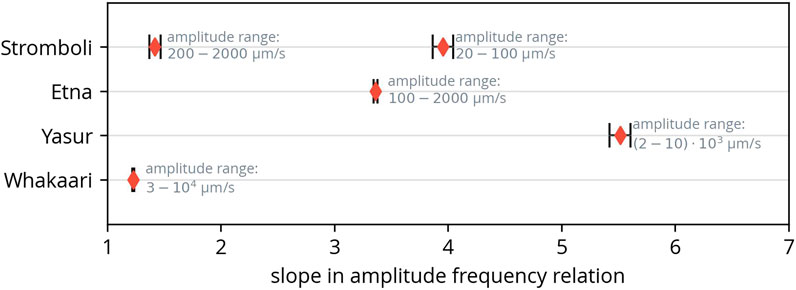
FIGURE 6. Slopes of the linear sections of the amplitude-frequency relation (Figure 5). The two linear sections of the relation for Stromboli were fitted separately. Figure 5 also shows the used amplitude ranges.
Figure 7 shows the amplitude distributions in the left panels. As already noted, the (absolute) amplitudes cannot be compared for different volcanoes due to different station setups. The grey lines again mark the median noise level (for better comparability). The fit with a normal distribution (green line in each plot) shows that the logarithm of the amplitude is approximately normally distributed for most volcanoes (meaning that the amplitude is log-normally distributed). Whakaari exhibits a deviation for larger eruptions.
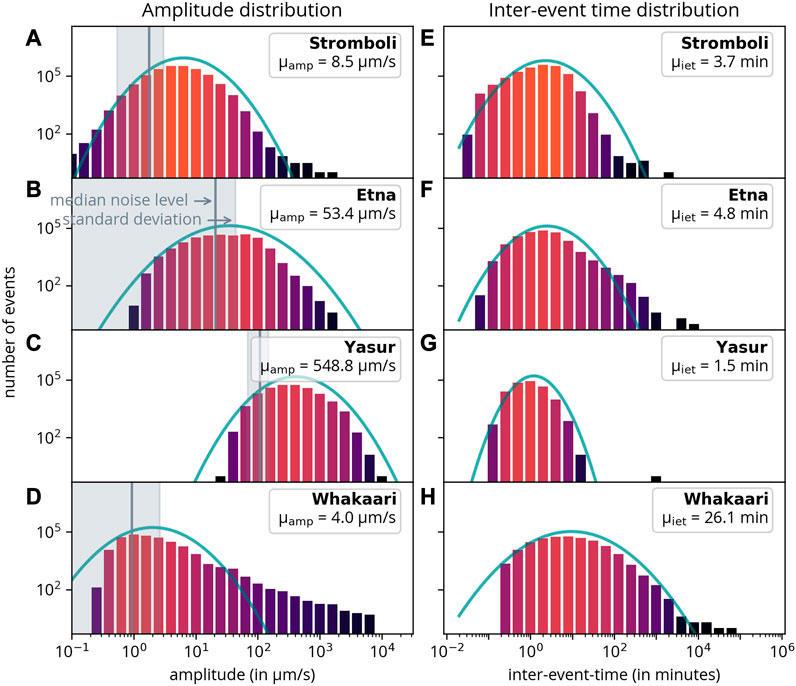
FIGURE 7. Amplitude distributions (left) and inter-event time (right). All distributions are fitted with a normal distribution (green lines). μiet and μamp are the average inter-event times and average amplitudes respectively. Note that the mean μ and standard deviation σ written in the legend refer to the original and not to the log-transformed amplitude.
In addition to the amplitude distributions, the inter-event-time distributions are presented [Figure 7 (right)]. Inter-event time is defined as the time elapsed between an event and the subsequent event, which, in most instances, is equivalent to calculating the time difference relative to the previous event. Naturally, data gaps influence the inter-event time, but this impact is limited to the last event preceding a gap. Given that data-gaps are relatively infrequent, their effect on the overall distribution is generally negligible, with the exception of a few potential outliers.
Again, the logarithm of the inter-event time follows a normal distribution for Yasur and Whakaari indicating that the inter-event time follows a log-normal distribution. For Etna, there is a notable excess of events with high inter-event times, in comparison to a normal distribution of events. Conversely, for Stromboli, there is a marked deficit of events on the high inter-event time side. However, one should take into account that the results depend on the completeness of the catalog. The completeness, in turn, heavily depends on the noise level in the data. The detection of more events naturally leads to smaller inter-event times.
To address this issue and reveal the relationship between inter-event time and amplitude, Figure 8 illustrates the inter-event time distribution for various amplitudes. It is crucial to note that we recompute the inter-event time after selecting events from the respective amplitude bin. Consequently, the distribution displays the time difference between events within the same amplitude bin. The primary advantage of this representation is that the outcome is largely independent of the catalog’s completeness. Note that, for readability, some very large events lie outside the displayed ranges.
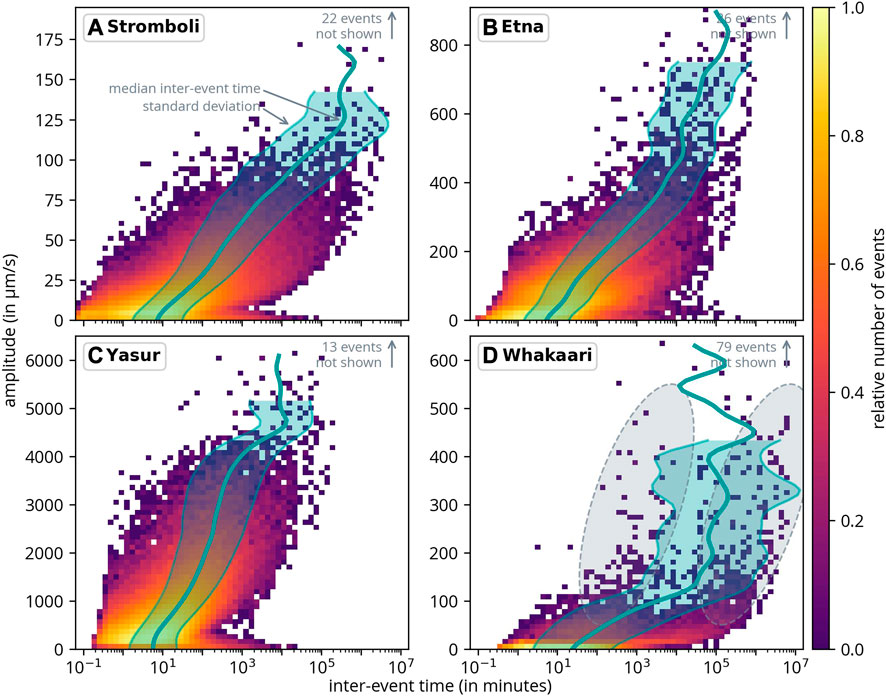
FIGURE 8. Inter-event time distribution as a function of amplitude. The inter-event time only refers to events from the respective amplitude bin. The green lines represent the median inter-event time for events within each amplitude bin, along with their respective standard deviation. A few events fall outside the shown range. The two ellipses in (D) show the two apparent maxima of event densities for Whakaari.
As anticipated, the distribution shifts towards longer inter-event times for higher amplitudes. At Stromboli and Yasur, the inter-event time distribution broadens for smaller events (see the lower right sections in Figures 8A, C). This implies that the fraction of long inter-event times increases for very small events. This phenomenon is a result of the fluctuating noise level, which determines the minimum amplitude that can be detected.
The relationship between amplitude and inter-event time is further investigated by calculating the median inter-event time per amplitude bin. The median was chosen over the average to minimize the influence of outliers on the results. This curve is also depicted in Figure 8, along with the standard deviation of the distribution. For instance, in the case of Etna, if an event with an amplitude of 600 μm/s occurs, the average recurrence time for an event of the same amplitude is approximately 14 days (2 ⋅ 104 min). However, the variance (as indicated by the standard deviation) is quite substantial, ranging from 2 to 70 days (3 ⋅ 103–106 min). As anticipated, for all volcanoes, the inter-event time more or less linearly increases with amplitude. Nonetheless, for larger amplitudes, the slope increases, suggesting that the average recurrence time increases more slowly for high-amplitude events. For some volcanoes, the area representing the standard deviations ceases for larger amplitudes. The reason for this is that, in cases with a low number of events (in the most extreme instances, one or zero), the standard deviation loses its meaning and is consequently not displayed.
Interestingly, for Whakaari, the distribution exhibits two maxima of inter-event time for events with amplitudes between 25 and 75 μm/s. The first maximum occurs at approximately 100 min, while the second appears at around 140 days (see ellipses in Figure 8D). It is worth noting that, unlike the other volcanoes, we were unable to apply catalog consolidation for Whakaari, which could have introduced a bias in the selection of events.
4.2 Event classification
Based on the classification introduced in Section 3.2, the previous analysis methods can be similarly applied to each type of event. The following analysis was only conducted for the catalog from Stromboli, as it is the most comprehensive catalog and the change in slope presents the most intriguing pattern for further investigation.
Figure 9 firstly presents all events by event class for Stromboli, with color indicating the relative density of events. Additionally, the number of events per month is displayed beneath each panel. Additionally, Figure 10 provides a more detailed examination of 2019. Notably, significant changes in activity are observed before and after the two paroxysms in 2019 (as shown in the Figure). Interestingly, the two paroxysms appear to have a significant impact on the types of events that occur: prior to the first paroxysm on July 3, the number of HF events is unusually high. Approximately 1 month before the first paroxysms, the number of HF events abruptly drops. In the days following the first paroxysm, the density of HF events increases, albeit not to the initial level. After the second paroxysm, the number of LP events again increases following a slight decline for about 1 month between the two paroxysms.
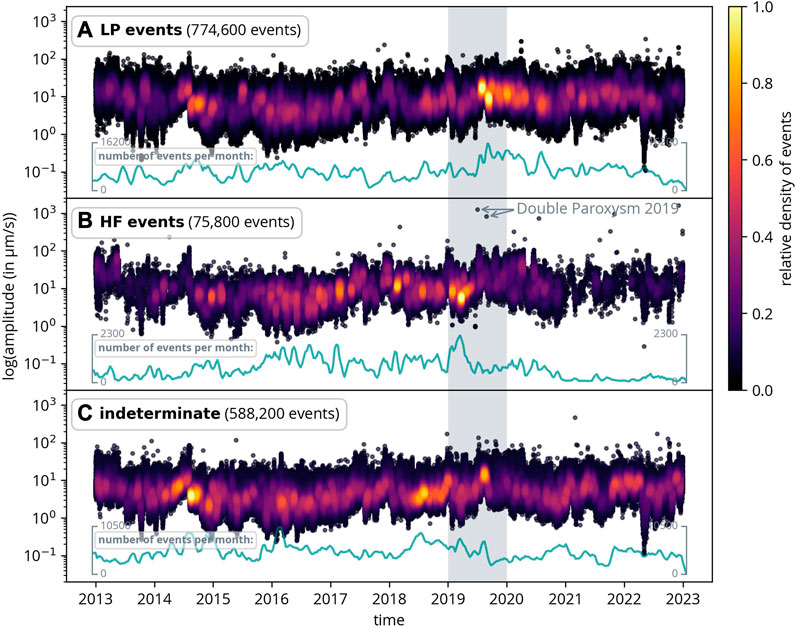
FIGURE 9. All classified events by event class (LP event, HF event, and indeterminate) for Stromboli. The green curve illustrates the number of events per month for each event type. The double paroxysm in 2019 is highlighted. The gray area is shown in more detail in Figure 10.
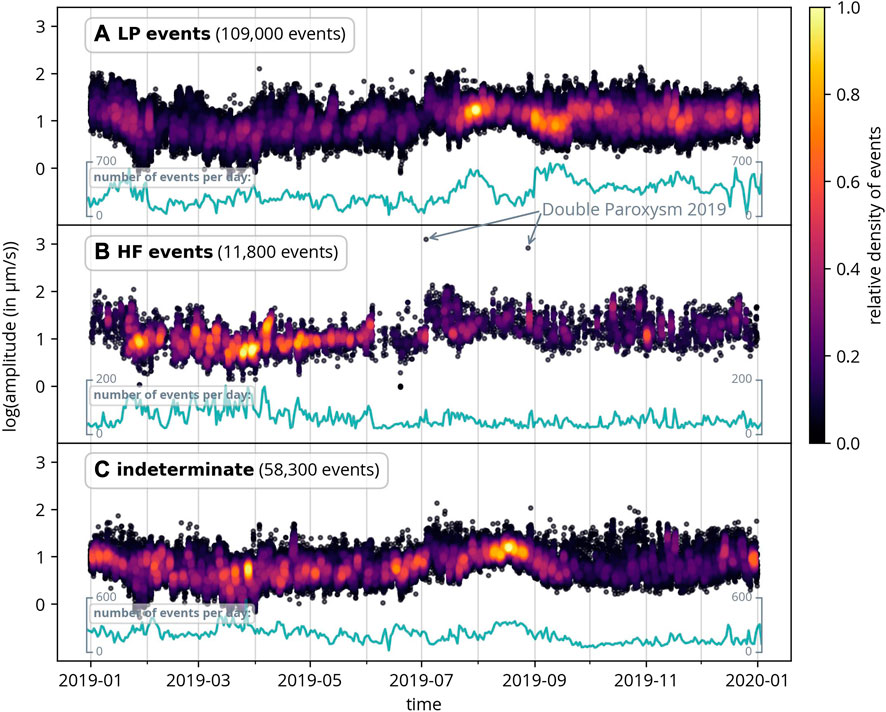
FIGURE 10. All classified events by event class in 2019 at Stromboli. The two paroxysms had a clear influence on the event types both before and after their occurrence. For further description, refer to Figure 9.
Computing the amplitude-frequency relation for the different event types also yields interesting results. Figure 11 confirms that the largest events are HF events. For events of this class, the change in slope is also the most pronounced. Although there is a slight indication of a slope change for LP events, it is not as evident as it is for HF events. However, this could also be explained by the misclassification of a few events. In (Fenner et al., 2022), it was hypothesized that the slope change is due to different event types. Even though this classification did not identify a specific event class that could explain the change in slope, we cannot discount the possibility of sub-event types within the HF events that might account for this phenomenon.
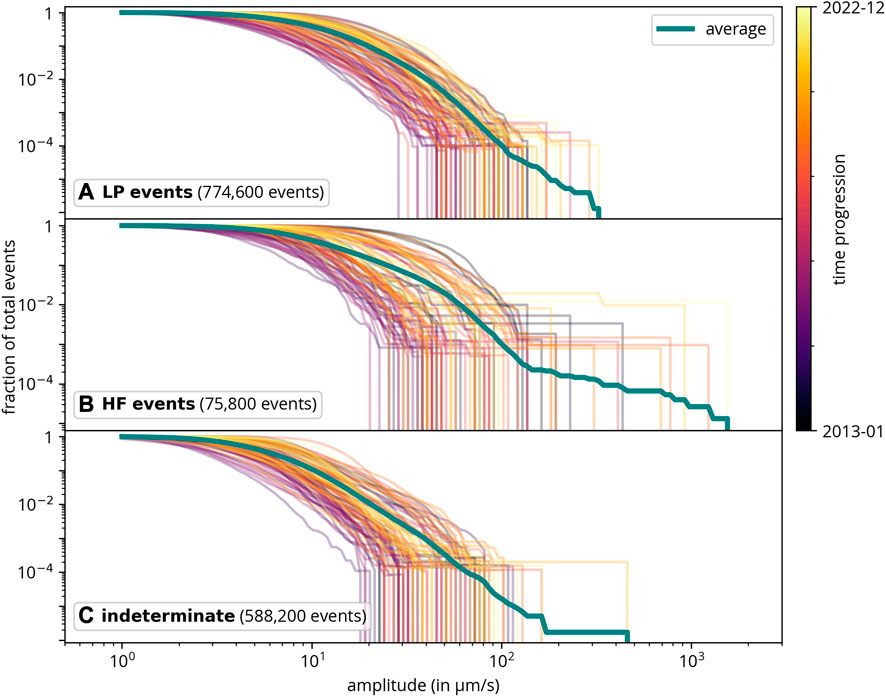
FIGURE 11. Amplitude frequency relations per amplitude at Stromboli. The change in slope is most pronounced for HF events.
We also examined the inter-event time and amplitude distributions, as well as the inter-event time distributions per amplitude for the separate event classes (see Supplementary Material; Supplementary Figures S2, S3). The amplitude distri-butions are similar across all event types, suggesting that there is no clear relationship between event type and amplitude. Similarly, the inter-event time distributions show comparable characteristics across all types.
5 Discussion
Overall, the figures presented in the previous section demonstrate a clear consistency when comparing the volcanoes based on the frequency of all volcanic events (see Table 1). While Stromboli and Etna exhibit a similar frequency of events (per time interval), Yasur has considerably more. For Whakaari, which has the fewest detected events, it should be noted that the number of low-amplitude events may be overestimated because catalog consolidation (i.e., the comparison of two catalogs from two stations) could not be used due to the second station being excessively noisy.
Figure 5A shows a change in slope in the amplitude-frequency relation for Stromboli towards high-amplitude events. Our previous research (Fenner et al., 2022) already showed this relation for Stromboli, but only for data from 2 years. There, this change in slope was already observed for amplitudes larger than ca. 100 μm/s. This implies that there are more large events compared to the distribution observed for earthquakes and it was suggested that this might be related to a different source mechanism of large events. However, this conclusion was drawn from a sample of just 10 events. In this study, we extend the analysis to 10 years of data and validate the observed change in slope (Figure 5A). The increased sample size allows for more statistically significant results, as we now have over 50 events exceeding 100 μm/s. However, as the majority of detected events (1.4 million) were observed at Stromboli, we cannot rule out the possibility that the change in slope would also appear for the other volcanoes if more data were available. Thus, we do not know if this is a unique property of Stromboli, or if it is more generally applicable. It is also worth noting that the change in slope cannot be explained by distant earthquakes, as they were excluded based on the ISC earthquake catalog.
By further analyzing event types for Stromboli, we primarily attribute the change in slope to high-frequency events (Figure 11). High-frequency volcanic events are typically associated with the movement of magma and volcanic gases leading to fracturing (Wassermann, 2012). However, it is possible that if a more detailed classification into further event types were implemented, more differences might emerge.
In most cases, the amplitude-frequency curve flattens out for low amplitudes. Assuming an exponential distribution for the logarithm of event amplitudes (which is observed for earthquakes and is the underlying distribution for the Gutenberg-Richter law), the slope should continue even for small events. On the one hand, this flattening can be explained by the catalog’s completeness–as the noise level obscures small events, these cannot be detected. On the other hand, Lehr and Rabbel (2021), Nishimura et al. (2016), and Cauchie et al. (2015) found evidence suggesting that the flattening cannot be explained by low detection levels. Instead, it could be related to a different amplitude distribution that decreases for small amplitudes compared to the exponential distribution, resulting in a unimodal distribution (i.e., with a maximum for a certain amplitude). For Yasur, this is the most obvious: the average noise level is much lower than the amplitude where the flattening of the curve begins. The assumption of a different amplitude distribution is further supported by the same distributions observed for jet height or gas masses for other volcanoes (Lehr and Rabbel, 2021).
By analyzing the inter-event time distributions for different amplitudes (Figure 8), we found no evidence of any periodic recurrence of events for any given amplitude across all the volcanoes studied. Similarly, the classification of event types for Stromboli revealed no distinct recurrence time per event type (Supplementary Figure S2 in Supplementary Material). Instead, we observed a log-normal distribution for the inter-event time across all volcanoes, a pattern also reported in other studies (Cauchie et al., 2015). Given that Strombolian eruptions are often attributed to the coalescence and bursting of gas bubbles (Nabyl et al., 1997), we may infer that the formation of these gas bubbles within the magma column also follows a log-normal distribution.
As suspected from the analysis of the amplitude-frequency relations (Figure 5), the distributions are indeed unimodal. However, for all volcanoes, the noise level is close to the center of the distribution. Based on this observation, the true maximum (if it exists) could be at lower amplitudes. Since the noise level constraints the detection of smaller events, the true distribution remains unknown from the catalogs. For Whakaari, the high number of events close to the noise level can be attributed to the fact that we did not use catalog consolidation for this volcano as the second station was deemed unsuitable due to its elevated noise level.
There appears to be an alternating pattern between the two event types. In summary, the frequency content of the events preceding both paroxysms was high until 1 month before the first paroxysm. Subsequently, more low-frequency events occurred. This anomaly commences 1 month before the first paroxysm. This observation aligns with the findings from (Giudicepietro et al., 2020), who analyzed the polarity and fractal dimension of the signal and noticed a significant change 1 month prior to the first paroxysm. Similar behavior has also been observed in other volcanoes, such as the Augustine Volcano in Alaska (Buurman and West, 2010). To establish whether these anomalies observed in event types before and after paroxysms are consistently related to large eruptions, further analysis is essential.
In the inter-event time distribution as a function of the amplitude (Figure 8) there appears to be a bimodal event distribution. This observation is unfortunately based on only a small number of events, which could potentially affect the significance of the finding. The two dominant recurrence times seem to be 100 min and 140 days. This long-term periodicity was already documented in volcanic activity. For instance, a study by Qu et al. (2011) suggests the presence of multiple oscillations (10–100 years). Also, similar patterns were observed by Srivastava et al. (2021) in a two-to-three-year periodicity in large earthquakes. However, the analysis for Whakaari relies solely on data from one station, and more research and data are necessary to gain more robust insights.
Our selection of volcanoes was primarily guided by data availability, which resulted in a focus on volcanoes associated with convergence/subduction tectonic regimes. However, it would be important to consider volcanoes located in divergent plate boundaries or intraplate volcanoes as well. Future studies could aim to incorporate different types of volcanoes. Further, this study was primarily focused on open-conduit volcanoes. However, closed-vent volcanoes with regular seismic activity could be considered for analysis in a similar way. AWESAM does not differentiate between event types and we expect that it could detect events from closed systems in the same way. Therefore, comparing open and closed systems could yield additional insights and reveal possible differences. Also, this work does not consider the impact of different types of volcanic activity (e.g., phreatic and magmatic eruptions). However, we plan to address this aspect in future research.
6 Conclusion
The comparison of the seismo-volcanic event catalogs from four volcanoes (Stromboli, Mount Etna, Yasur, and Whakaari) facilitates some interesting conclusions about their volcanic activity. Using the same tool for all volcanoes enables a meaningful comparison. All four volcanoes, despite their different type and frequency of events, show similar characteristics. For example, the amplitude-frequency relation, the inter-event time distributions and the amplitude distributions show similar trends.
We have confirmed the change in slope for Stromboli in the amplitude-frequency relation (Figure 5A), a phenomenon previously observed in another study (Fenner et al., 2022). This implies that there are an unusually high number of very high-amplitude events. With an increased number of events now, the result holds more statistical significance. With this analysis, it is further possible to determine the average recurrence time of events with specific amplitudes for each volcano.
Additionally, we examined the double paroxysm in 2019 at Stromboli. It appears that there was a higher occurrence of HF events before the paroxysms, while LP events were more prominent after the paroxysms.
In conclusion, the event-detection methodology presented can be applied to volcano monitoring. It offers the possibility to quickly identify and analyze relevant events, particularly when multiple stations are available for catalog consolidation in near real-time. The analysis of inter-event times and amplitude statistics offers the detection and characterization of volcanic unrest phases, similar to RSAM analysis (Endo and Murray, 1991), and can provide enhanced constraints for early warning systems.
Data availability statement
The raw data supporting the conclusion of this article will be made available by the authors, without undue reservation.
Author contributions
DF, GR, PL, and NS contributed to the conception and design of the study. DF created and analyzed the catalogs. PL implemented the classification of events. DF wrote the first draft of the manuscript. GR and NS wrote sections of the manuscript. All authors contributed to the article and approved the submitted version.
Funding
This research is supported by the “KI-Nachwuchswissenschaf-tlerinnen”—Grant SAI 01IS20059 by the Bundesministerium für Bildung und Forschung—BMBF. Calculations were performed at the Frankfurt Institute for Advanced Studies’ GPU cluster, funded by the BMBF for the project Seismologie und Artifizielle Intelligenz (SAI).
Acknowledgments
We thank David Dempsey (University of Canterbury) for suggesting to use AWESAM for data from Whakaari. We thank Jonas Köhler, Megha Chakraborty, Dr. Wei Li, Dr. Claudia Quinteros Cartaya, and Johannes Faber for their helpful discussions. DF thanks Dr. Horst Stöcker for his support for this research. We would like to thank the reviewers for their valuable suggestions that helped to improve the manuscript.
Conflict of interest
The authors declare that the research was conducted in the absence of any commercial or financial relationships that could be construed as a potential conflict of interest.
Publisher’s note
All claims expressed in this article are solely those of the authors and do not necessarily represent those of their affiliated organizations, or those of the publisher, the editors and the reviewers. Any product that may be evaluated in this article, or claim that may be made by its manufacturer, is not guaranteed or endorsed by the publisher.
Supplementary material
The Supplementary Material for this article can be found online at: https://www.frontiersin.org/articles/10.3389/feart.2023.1228103/full#supplementary-material
References
Andronico, D., Del Bello, E., D’Oriano, C., Landi, P., Pardini, F., Scarlato, P., et al. (2021). Uncovering the eruptive patterns of the 2019 double paroxysm eruption crisis of Stromboli volcano. Nat. Commun. 12, 4213. doi:10.1038/s41467-021-24420-1
Ardid Segura, A., Dempsey, D., Caudron, C., and Cronin, S. (2022). Seismic precursors to the Whakaari 2019 phreatic eruption are transferable to other eruptions and volcanoes. Nat. Commun. 13, 2002. doi:10.1038/s41467-022-29681-y
Bevilacqua, A., Bertagnini, A., Pompilio, M., Landi, P., Del Carlo, P., Roberto, A., et al. (2020). Major explosions and paroxysms at Stromboli (Italy): a new historical catalog and temporal models of occurrence with uncertainty quantification. Sci. Rep. 10, 17357. doi:10.1038/s41598-020-74301-8
Bisson, M., Spinetti, C., Andronico, D., Palaseanu-Lovejoy, M., Fabrizia Buongiorno, M., Alexandrov, O., et al. (2021). Ten years of volcanic activity at Mt Etna: high-resolution mapping and accurate quantification of the morphological changes by Pleiades and Lidar data. Int. J. Appl. Earth Observation Geoinformation 102, 102369. doi:10.1016/j.jag.2021.102369
Burton, M., Hayer, C., Miller, C., and Christenson, B. (2021). Insights into the 9 december 2019 eruption of Whakaari/White Island from analysis of TROPOMI SO2 imagery. Sci. Adv. 7, eabg1218. doi:10.1126/sciadv.abg1218
Buurman, H., and West, M. (2010). “Seismic precursors to volcanic explosions during the 2006 eruption of Augustine volcano,” in The 2006 eruption of Augustine Volcano (Alaska, 1769.
Canário, J. P., de Mello, R. F., Curilem, M., Huenupan, F., and Rios, R. A. (2020). Llaima volcano dataset: in-depth comparison of deep artificial neural network architectures on seismic events classification. Data Brief 30, 105627. doi:10.1016/j.dib.2020.105627
Cauchie, L., Saccorotti, G., and Bean, C. J. (2015). Amplitude and recurrence time analysis of LP activity at Mount Etna, Italy. J. Geophys. Res. Solid Earth 120, 6474–6486. doi:10.1002/2015JB011897
Dempsey, D., Cronin, S., Mei, S., and Kempa-Liehr, A. (2020). Automatic precursor recognition and real-time forecasting of sudden explosive volcanic eruptions at Whakaari, New Zealand. Nat. Commun. 11, 3562. doi:10.1038/s41467-020-17375-2
Endo, E. T., and Murray, T. (1991). Real-time seismic amplitude measurement (rsam): a volcano monitoring and prediction tool. Bull. Volcanol. 53, 533–545. doi:10.1007/bf00298154
Fenner, D., Rümpker, G., Li, W., Chakraborty, M., Faber, J., Köhler, J., et al. (2022). Automated seismo-volcanic event detection applied to Stromboli (Italy). Front. Earth Sci. 10. doi:10.3389/feart.2022.809037
Giudicepietro, F., López, C., Macedonio, G., Alparone, S., Bianco, F., Calvari, S., et al. (2020). Geophysical precursors of the July-August 2019 paroxysmal eruptive phase and their implications for Stromboli volcano (Italy) monitoring. Sci. Rep. 10, 10296. doi:10.1038/s41598-020-67220-1
GNS Science (2021). GeoNet Aotearoa New Zealand seismic digital waveform dataset. doi:10.21420/G19Y-9D40
Istituto Nazionale di Geofisica e Vulcanologia (2005). Rete sismica Nazionale (RSN). doi:10.13127/SD/X0FXNH7QFY
Kilgour, G., Kennedy, B., Scott, B., Christenson, B., Jolly, A., Asher, C., et al. (2021). Whakaari/white island: a review of New Zealand’s most active volcano. N. Z. J. Geol. Geophys. 64, 273–295. doi:10.1080/00288306.2021.1918186
Langer, H., Falsaperla, S., Messina, A., Spampinato, S., and Behncke, B. (2011). Detecting imminent eruptive activity at Mt Etna, Italy, in 2007–2008 through pattern classification of volcanic tremor data. J. Volcanol. Geotherm. Res. 200, 1–17. doi:10.1016/j.jvolgeores.2010.11.019
Laumann, P., Srivastava, N., Li, W., and Ruempker, G. (2023). Volcano-seismic event classification using wavelet scattering transforms. Vienna, Austria: EGU General Assembly 2023. 24–28 Apr 2023, EGU23-17117. doi:10.5194/egusphere-egu23-17117
Lehr, J., and Rabbel, W. (2021). Magnitude and interevent time statistics of Strombolian activity of Villarrica volcano and inference regarding the flow regime. J. Geophys. Res. Solid Earth 126. doi:10.1029/2021JB-021658
Mallat, S. (2012). Group invariant scattering. Commun. Pure Appl. Math. 65, 1331–1398. doi:10.1002/cpa.21413
Marchetti, E., Ripepe, M., Delle Donne, D., Genco, R., Fizola, A., and Garaebiti, E. (2013). Blast waves from violent explosive activity at Yasur volcano, Vanuatu. Geophys. Res. Lett. 40, 5838–5843. doi:10.1002/2013GL-057900
Nabyl, A., Dorel, J., and Lardy, M. (1997). A comparative study of low-frequency seismic signals recorded at Stromboli volcano, Italy, and at Yasur volcano, Vanuatu. N. Z. J. Geol. Geophys. 40, 549–558. doi:10.1080/00288306.1997.9514783
Nishimura, T., Iguchi, M., Mohammad, H., Aoyama, H., Yamada, T., Ripepe, M., et al. (2016). Magnitude-frequency distribution of volcanic explosion earthquakes. Earth Planets Space 68, 125. doi:10.1186/s40623-016-0505-2
Pelletier, B., Metaxian, J.-P., and Battaglia, J.RESIF (2011). ARC Vanuatu temporay experiment (resif-sismob). doi:10.15778/RESIF.ZO2008
Qu, W., Huang, F., du, L., Zhao, J., Deng, S., and Cao, Y. (2011). The periodicity of volcano activity and its reflection in some climate factors. Chin. J. Geophys. 54, 135–149. doi:10.1002/cjg2.1595
Srivastava, N., El Sayed, O., Chakraborty, M., Köhler, J., Steinheimer, J., Faber, J., et al. (2021). Sunda-arc seismicity: Continuing increase of high-magnitude earthquakes since 2004.
van der Maaten, L., and Hinton, G. (2008). Viualizing data using t-sne. J. Mach. Learn. Res. 9, 2579–2605.
Wassermann, J. (2012). Volcano seismology. New Man. Seismol. Observatory Pract. 2. doi:10.2312/GFZ.NMSOP-2_ch13
Woitischek, J., Woods, A. W., Edmonds, M., Oppenheimer, C., Aiuppa, A., Pering, T. D., et al. (2020). Strombolian eruptions and dynamics of magma degassing at Yasur volcano (Vanuatu). J. Volcanol. Geotherm. Res. 398, 106869. doi:10.1016/j.jvolgeores.2020.106869
Keywords: inter-event time, amplitude statistics, AWESAM, seismo-volcanic events, event classification
Citation: Fenner D, Rümpker G, Laumann P and Srivastava N (2023) Amplitude and inter-event time statistics for the island volcanoes Stromboli, Mount Etna, Yasur, and Whakaari. Front. Earth Sci. 11:1228103. doi: 10.3389/feart.2023.1228103
Received: 24 May 2023; Accepted: 31 July 2023;
Published: 11 August 2023.
Edited by:
Adriano Pimentel, Universidade dos Açores, PortugalReviewed by:
Carmen Del Fresno, Instituto Geográfico Nacional, SpainNuno Afonso Dias, Lisbon Higher Institute of Engineering (ISEL), Portugal
Copyright © 2023 Fenner, Rümpker, Laumann and Srivastava. This is an open-access article distributed under the terms of the Creative Commons Attribution License (CC BY). The use, distribution or reproduction in other forums is permitted, provided the original author(s) and the copyright owner(s) are credited and that the original publication in this journal is cited, in accordance with accepted academic practice. No use, distribution or reproduction is permitted which does not comply with these terms.
*Correspondence: Nishtha Srivastava, c3JpdmFzdGF2YUBmaWFzLnVuaS1mcmFua2Z1cnQuZGU=
 Darius Fenner
 Georg Rümpker
 Patrick Laumann1,3
 Nishtha Srivastava