- 1College of Earth Sciences, Chengdu University of Technology, Chengdu, Sichuan, China
- 2Sichuan Nuclear Industry Geological Bureau 281 Brigade, Chengdu, Sichuan, China
- 3Tibet Jinhai Mineral Resources Development Co., Ltd., Chengdu, Sichuan, China
- 4Sichuan Xing ye Geotechnical Engineering Detecting Co., Ltd., Chengdu, Sichuan, China
Introduction: The Zhangjiapingzi gold deposit, located at the western margin of the Yangtze Craton and controlled by the Jinhe-Chenghai deep fault, is a newly discovered super-large gold deposit in the Danba-Mianning metallogenic belt. The gold ore bodies are hosted in the Middle Triassic (T2) altered dolomite (Dm), and have two types of mineralization: altered rock type and quartz vein type. Previous studies on this deposit are rare, especially on the ore-fluid characteristics, which limit the understanding on the ore genesis.
Methods: This study focused on fluid inclusions in quartz from altered rocks, and used microthermometry and laser Raman spectroscopy to investigate the properties and sources of ore-forming fluids, and to determine the ore genetic type.
Results and discussion: The results show that the fluid inclusions are mainly CO2-H2O-NaCl inclusions, with medium temperature (220–300°C), low salinity (<10%), medium-low density (0.79–1.01 g/cm3) and high contents of CO2 and CH4, resembling typical orogenic gold ore fluids. We suggest that the Zhangjiapingzi is best classified as orogenic type, and our findings provide new insights into the fluid origin and metallogenesis of orogenic gold deposits in the Danba-Mianning metallogenic belt.
1 Introduction
The morphology, composition, temperature-pressure conditions and trace element contents of fluid inclusions can reflect the characteristics and evolution processes of ore-forming fluids. By analyzing the fluid inclusion assemblages and compositions, the ore-fluid formation, migration and evolution can be effectively reconstructed (Wilkinson, 2001; Sun et al, 2018).
The Zhangjiapingzi gold deposit is located at the western margin of the Yangtze block, in the south of the Songpan-Ganzi orogenic belt, and in the Danba-Mianning gold belt (Figure 1) (Bao, 2016). According to the latest exploration results, the Zhangjiapingzi gold deposit has a proven gold resource of about 120 tons, and is the only super-large gold deposit in the gold belt, with a maximum grade of 36.68 g/t and an average grade of 2.03 g/t. The strata exposed in the mining area are Middle Triassic (T2) medium-low grade metamorphosed greenschist belt and altered dolomite, and the ore bodies are mainly hosted in altered dolomite (Dm).
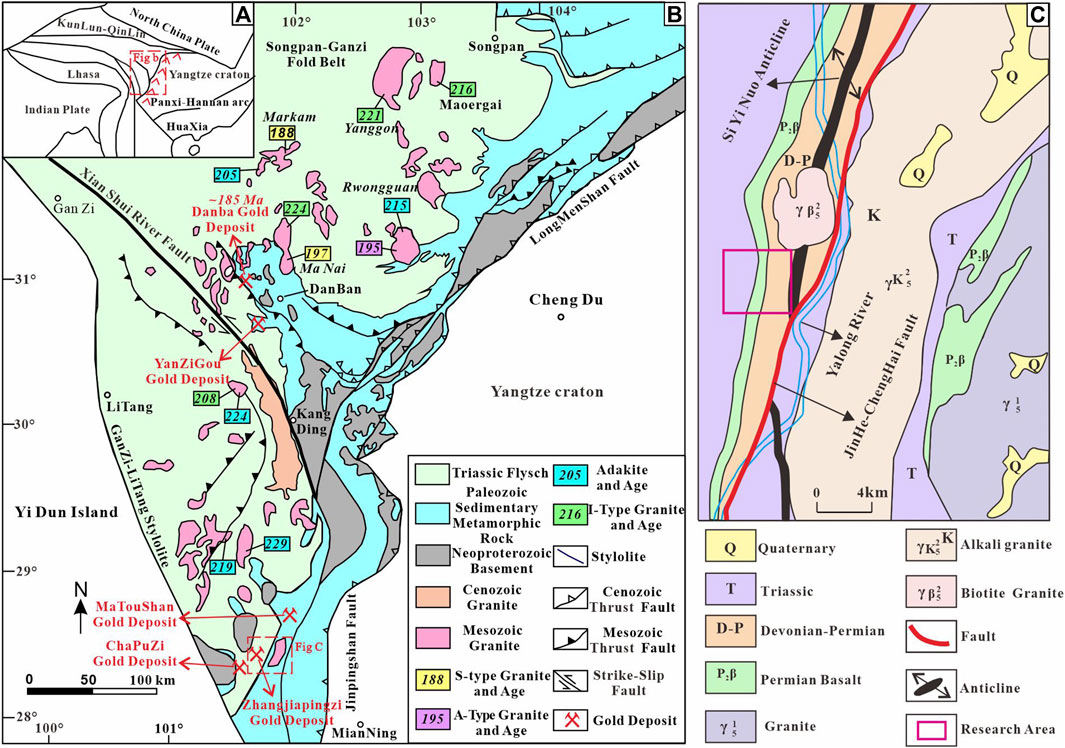
FIGURE 1. Tectonic map of the Zhangjiapingzi gold deposit [(A,B) modified from Zhao (2019); (C) modified from Luo et al. (2013), respectively].
The previous studies on the geological characteristics, wall rock alteration, prospecting direction and other basic geological characteristics of this deposit have been carried out (Lan, 2013; Luo et al, 2013; Yang et al, 2015; Bao, 2016; Xin et al, 2016; Zhou et al, 2016; Wang et al, 2019), and the fluid inclusion characteristics and stable isotope characteristics of this deposit have been preliminarily revealed (Bao, 2016). These characteristics indicate that the ore-forming fluid may be a mixture of metamorphic water and fluids of other sources. The gold ore-forming material may have derived from the mantle. The ore-forming temperature was estimated at 87–442.1°C, and mineralization in the Danba-Mianning gold belt was interpreted to have occurred in the Himalayan (Cenozoic) period. However, the ore genesis has been variably interpreted to be epithermal (Bao, 2016; Xin et al, 2016), or orogenic (Zhao, 2019) style. The fluid inclusion characteristics of epithermal deposit and orogenic type gold deposits are significantly different (Groves et al, 1998; Kerrich et al, 2000; Chen, 2006; Chen et al, 2007): epithermal mineralization has mainly gas-liquid water inclusions, low temperature and low salinity ore-forming fluids, which were mainly sourced from magmatic water and meteoric water (lack CO2-rich fluids); orogenic-type gold mineralization has mainly CO2-H2O fluid inclusions and gas-liquid water inclusions. The ore-forming fluids are CO2-rich, 200–700°C, and are sourced mainly from metamorphic water. Fluid inclusion studies on the Zhangjiapingzi gold deposit are rare. Therefore, we use fluid inclusion microthermometry and laser Raman spectroscopy to analyze the fluid inclusions in the Zhangjiapingzi gold deposit. This helps to further investigate the ore-forming fluid characteristics and evolution patterns, and to determine the deposit genetic type.
2 Geological background
The Zhangjiapingzi gold deposit is located at the Danba-Mianning gold belt at the junction of the southwest margin of the Yangtze block and the Songpan-Ganzi orogenic belt. The region has undergone multiple magmatic-hydrothermal and tectono-thermal events. In the region, the Zhangjiapingzi, Chapuzi, and Jinpingshan gold deposits were formed in the Himalayan (Cenozoic) orogenic event (Bao, 2016), and their spatial distribution is mainly controlled by fault structures and alteration zones. Regionally, gold-rich strata were composed of the Indosinian (Triassic) marine mafic volcanics. In the late Yanshanian (Late Jurassic-Cretaceous) period, plate tectonics and crustal uplift have folded and faulted the regional sequences, forming a 2 km-wide shear zone west of the Jinhe-Chenghai deep fault. The intrusion of granite porphyry and quartz veins occurred in the late Yanshanian to Himalayan period, accompanied by upwelling of metal (incl. gold)-rich mantle-derived fluid, forming the gold orebodies in favorable structural positions. The ages of other gold (e.g., the Chapuzi, Daping, Suoluogou) and REE (e.g., Maoniuping) deposits in the region are of 36 to 28 Ma (Yang, 2000; Yang et al, 2000; Bao, 2016; Fu et al, 2019; Zhang et al, 2021), which coincided with in the late collision period and were older than the gold mineralization at Zhangjiapingzi (24 Ma) (Bao, 2016). The Zhangjiapingzi deposit is larger than the other deposits in the district, and its formation was coeval with the regional tectonic transition from late collisional orogeny, through intracontinental transpression to post-collision crustal extension and rifting (Hou et al, 2006a; Hou et al, 2006b).
Exposed stratigraphy at Zhangjiapingzi consists of Middle Triassic (T2) weakly metamorphosed greenstone belts and metasomatized dolomite (ore host) (Figure 2). Local structures are dominated by a series of NNE-trending compressional faults. The orebodies are deformed by shear zones, F1 fault and their secondary structures. There are a total of 97 orebodies, including five major ones. No. 60 Orebody is a major orebody, which is 780 m-long, 0.84–22.29 m-thick, with an average grade of 1.53 g/t. The metallic mineral assemblage includes pyrite, tetrahedrite, galena, and native gold (Figure 3), whilst non-metallic minerals include mainly calcite and quartz. Microscopic observations show that the gold occurs mainly as visible native gold particles in pyrite or along pyrite fractures (Figure 4). The ores are mainly euhedral-subhedral granular in texture (Figure 5), and are mainly disseminated, veinlet-disseminated, and stockwork (Figure 6). Wallrock alterations include chlorite, carbonate, pyrite, silicic, and sericite. The mineralization comprises three stages (Bao, 2016): (I) early-ore dolomite-pyrite-quartz (II) main-ore pyrite-tetrahedrite-quartz, and (III) late-ore quartz-pyrite-dolomite.
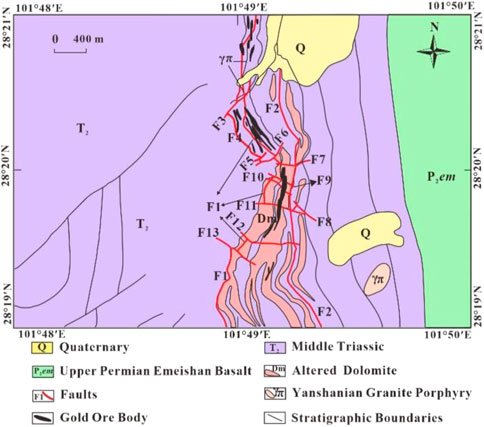
FIGURE 2. Geological map of Zhangjiapingzi gold deposit. [Modified from Xin et al. (2016)].
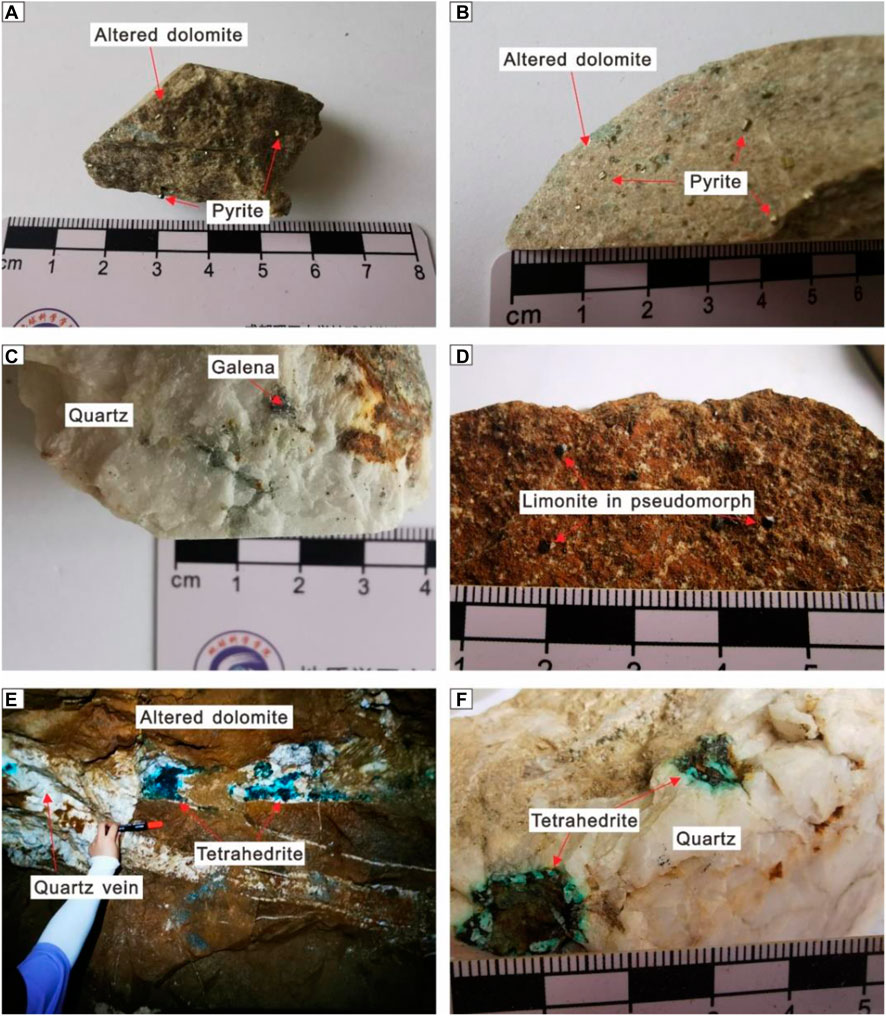
FIGURE 3. Field and hand-specimen photos of the Zhangjiapingzi gold ore: (A) pyrite; (B) cubic pyrite; (C) galena; (D) pseudomorphic goethite; (E) patchy tetrahedrite in quartz vein; (F) patchy tetrahedrite.
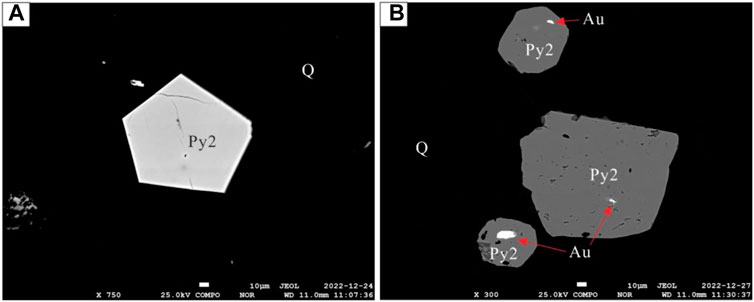
FIGURE 4. Backscattered electron image of pyrite from Zhangjiapingzi gold deposit. Py2- Stage II pyrite; Q-quartz; Au- gold.
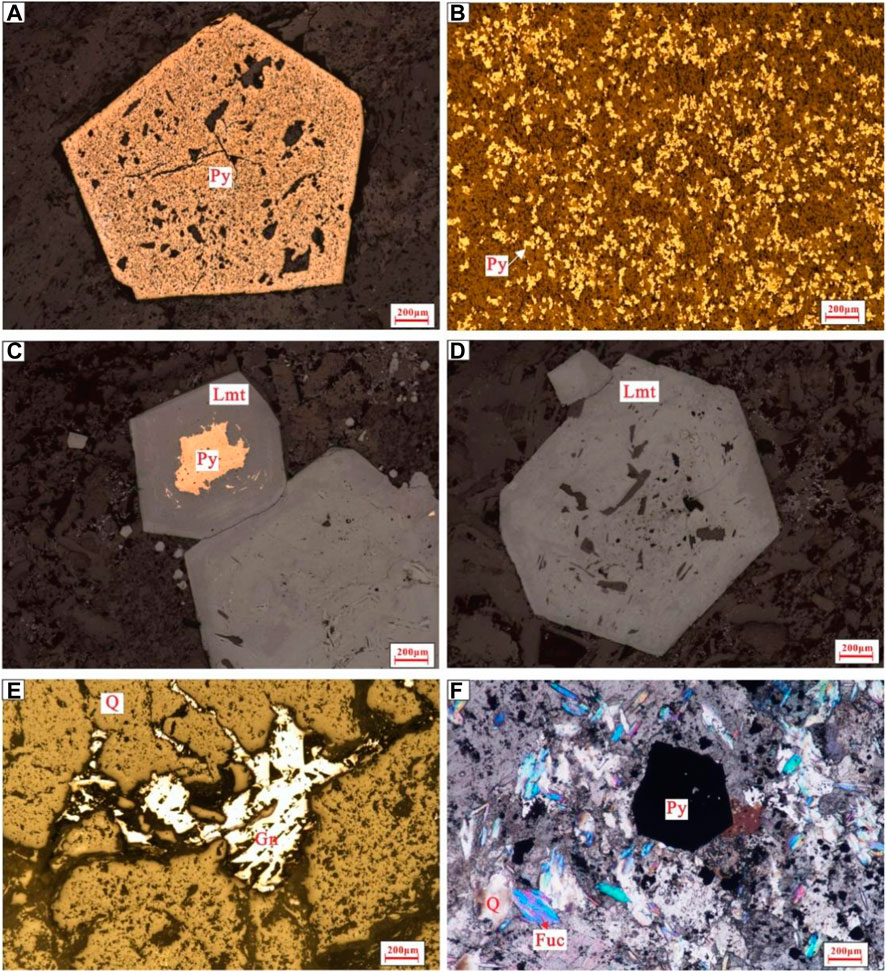
FIGURE 5. Photomicrographs of the Zhangjiapingzi gold ore textures: (A) euhedral granular; (B) subhedral granular; (C) replacement residual; (D) replacement pseudomorph; (E) stellar texture; (F) schistose texture. Py-pyrite; Lmt-limonite; Gn-galena; Q-quartz; Fuc- Fuchsite.
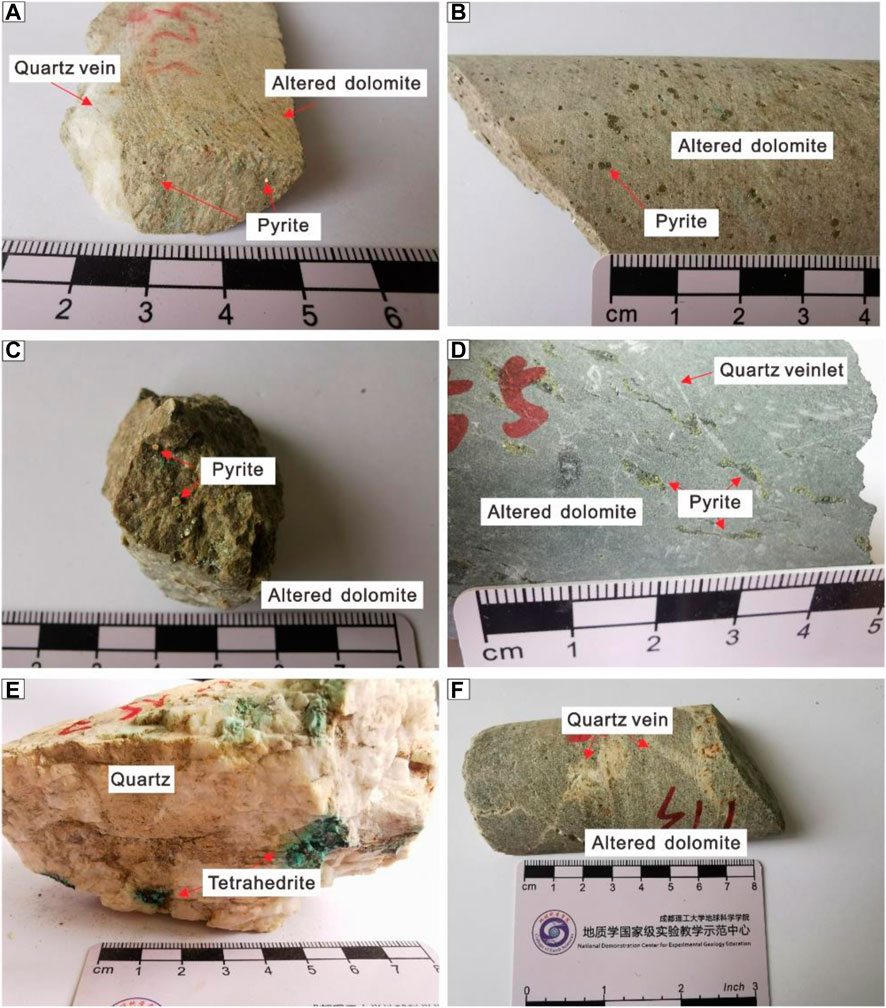
FIGURE 6. Photos of the Zhangjiapingzi gold ore: (A) sparsely disseminated texture; (B,C) densely disseminated texture; (D) veinlet texture; (E) massive texture; (F) brecciated texture.
3 Samples and analytical methods
In this study, we collected from the middle section of No. 60 Orebody in southern Zhangjiapingzi, including from surficial exploration trench and drill holes ZKS1601, ZKS3406, and ZK3608. Representative samples were selected for fluid inclusion microthermometric and laser Raman.
Preparation of petrographic polished thin sections and fluid inclusion sections was performed at the Nanjing Hongchuang Geological Exploration Technology Services Co. Ltd. The homogenization and freeze-thaw experiments for the fluid inclusion microthermometry were conducted at the Fluid Inclusion Laboratory of the Chengdu University of Technology and the State Key Laboratory of Mineral Deposit Geochemistry, Chinese Academy of Sciences. The LINKAM THMSG600 Heating and Freezing Stage was used for the experiments, whilst the HokieFlincs2012 and HokieFlincs2018 Excel spreadsheets were used to calculate parameters such as fluid salinity and density (Matthew et al, 2012; Matthew, 2018).
The analysis was carried out at the State Key Laboratory of Ore Deposit Geochemistry (SKLODG), using a HR Evolution laser Raman spectrometer with a microscope equipped with a 20 × objective (NA 0.25). The spot diameter is ∼2 μm. A backscattering geometry was used in the 100–1,600 cm-1 range, using a 600 L mm-1 grating. The Raman spectra were acquired by a 532 nm laser, with a power of ∼100 mW, and two consecutive acquisitions (20 s each) were used.
4 Results
4.1 Types and characteristics of fluid inclusions
The fluid inclusions in this study can be classified into primary, secondary, and pseudo-secondary. Primary fluid inclusions (size: 5–25 μm) are usually found in mineral grains or along the crystal growth direction. Secondary fluid inclusions (size: 1–6 μm) are distributed along the mineral crystal fractures. Pseudo-secondary fluid inclusions (size: <5 μm) are mainly present in mineral crystals in a banded distribution or overlap with primary fluid inclusions. Our analysis is focused on primary fluid inclusions. According to the classification criteria of fluid inclusions at room temperature and the phase changes during the heating-freezing process (Roedder, 1984; Lu et al, 2004), we divide the primary fluid inclusions in Stage I to III quartz into four types: L-type, LV-type, C-type, and CO2-type. The characteristics of each fluid inclusion type are described as follows:
L-type: At room temperature, they occur as pure liquid-phase and are colorless transparent (Figure 7A). This inclusion type is common in quartz but rare in calcite, and is usually elongated.
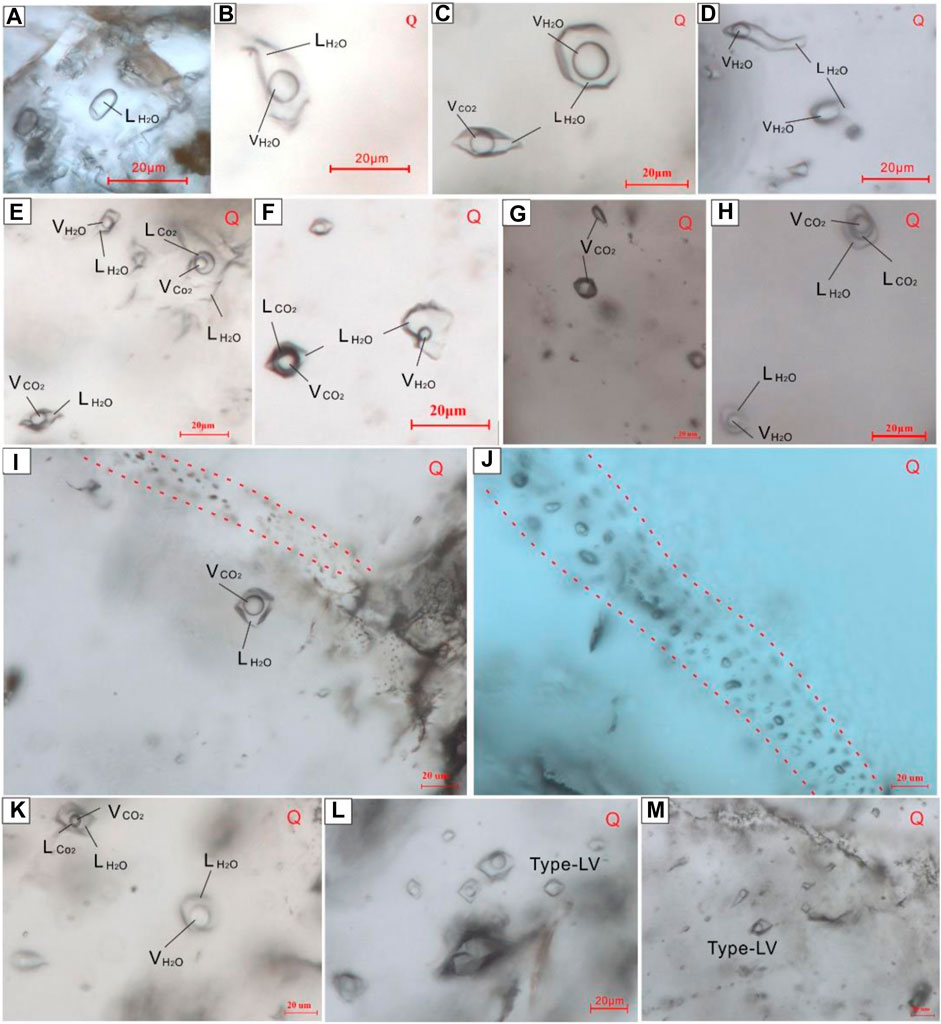
FIGURE 7. Microphotographs of fluid inclusions in the Zhangjiapingzi gold deposit: (A) L-type; (B) LV2-type; (C) LV2- and C1-type; (D) LV1- and LV2-type; (E) LV2-, C1-, and C2-type; (F) LV1- and C2-type; (G) Type D; (H) LV2- and C2-type; (I) Secondary fluid inclusions developed along crystal fractures; (J) Pseudo-secondary fluid inclusions along quartz growth zones; (K) LV2- and C2-type; (L,M) LV-type.
LV-type: they consist of both liquid and vapor phases and are widely distributed in both quartz and calcite (Figures 7B–F, H, K–M). According to the volume percentage of the vapor and liquid phases in the inclusion, they can be further divided into the liquid-rich (LV1-type) and vapor-rich (LV2-type) subtypes. At room temperature, LV1-type inclusions are composed of gas and saline phases, with the latter accounting for >50% of the total volume of the inclusion. The inclusion size varies greatly (diameter: 10–20 μm), whereas the gas-liquid ratio variation is relatively narrow. These inclusions are often elliptical, elongated, quadrangular, or irregular (Figures 7D, F). During the heating, the gas bubble volume gradually decreased and finally homogenized with the liquid phase. In a few cases, the gas bubble volume increased with increasing temperature, and finally homogenized with the gas phase. Some larger inclusions show “necking” phenomenon (Figure 7D). LV2-type inclusions are more common than LV1-type inclusions and they commonly coexist. They are composed of gas and saline phase at room temperature, with the former occupying >50% of the total volume. The inclusion size varies greatly (diameter: 15–20 μm, up to ∼30 μm). They are often negative crystal or elliptical in shape (Figures 7A–F, H). During the heating, the gas bubble gradually increased and finally homogenized with the gas phase (Figures 7L, M).
C-type: They are well-developed in stage I and II (but not stage III) quartz. The H2O liquid phase is mostly colorless and transparent, while the CO2 phase is mostly gray-black. C-type inclusions account for ∼25% of the total number of fluid inclusions. These inclusions can be of two-phase (C1-type) or three-phase (C2-type) at room temperature. C1-type contains liquid water and gaseous CO2, and liquid CO2 appears at ca. 5–20°C (Figures 7C, I). C1-type can be further classified into H2O-rich (C1a-type) and CO2-rich (C1b-type), according to its proportion of CO2: C1a-type (size: 5–18 μm) is mostly quadrangular or elliptical, while C1b-type (size: 8–15 μm) homogenized mostly into liquid (minor into gas) when heated, with negative crystal or irregular shapes. C2-type (size: 8–24 μm) contains gaseous CO2, liquid CO2, and liquid H2O (Figures 7E, F, H, K). These inclusions are mostly elliptical, elongated or irregular, and homogenized into gas when heated.
CO2-type: At room temperature, these inclusions comprise pure liquid. They are grayish-black and negatively crystal-shaped (Figure 7G), and are mostly hosted in quartz and largely absent in calcite.
4.2 Laser Raman spectroscopy of fluid inclusions
In this study, laser Raman spectroscopic analysis was performed on all L-, LV-, C-, and CO2-type fluid inclusions from quartz, with the results shown in Figure 8. For gas-liquid two-phase fluid inclusions, the characteristic peaks appearing before 1,000 cm-1 in Raman shifts are generally affected by the host mineral quartz or the outer wall of the fluid inclusion, and thus they are not further discussed here. The results show that the liquid phase component is mainly CO2 (characteristic peaks at 1,282–1,387 cm-1) and the gas phase component is mainly CH4 (characteristic peaks at 2915 cm-1).
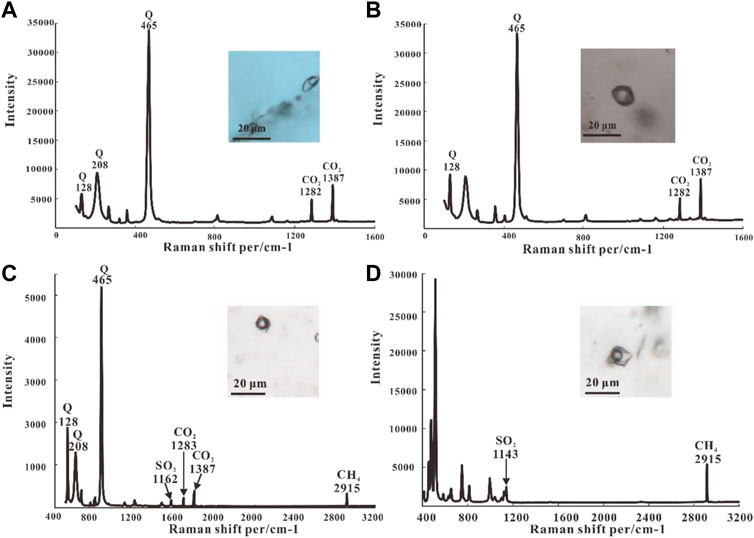
FIGURE 8. Laser Raman spectra of fluid inclusions from the Zhangjiapingzi gold ore (A,D) C1-type; (C) C2-type; (B) CO2-type.
4.3 Fluid inclusion microthermometry
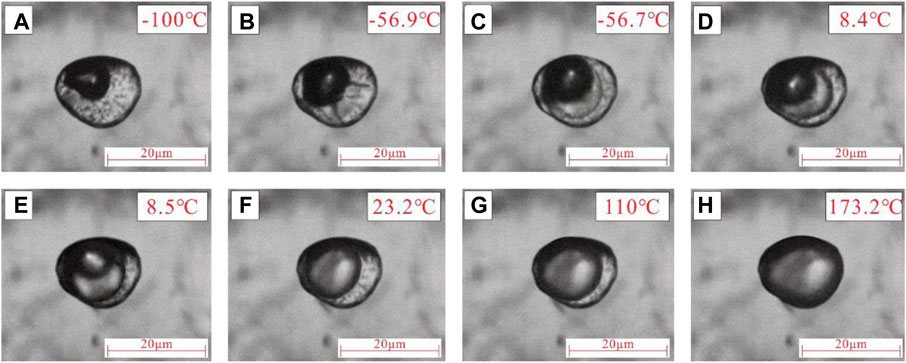
In this study, microthermometric measurements were conducted on seven well-preserved fluid inclusion (LV- and C-type) samples, yielding a total of 168 data points. The fluid inclusions analyzed were selected based on micro-petrographic observations (Figure 9).
A: C2-type fluid inclusion at −100°C; B: Solid-state CO2 is still visible at −56.9°C; C: Solid CO2 melts at −56.7°C, which is the initial melting temperature; D: At 8.4°C, the daughter mineral is not completely dissolved, and the gaseous-liquid CO2 boundary becomes blurred; E: At 8.5°C, the daughter mineral disappears, and the gaseous-liquid CO2 boundary becomes clear, and the gaseous CO2 becomes a complete bubble, Consistent with room temperature state; F: At 23.2°C, the C2-type inclusion homogenized partially to gaseous phase; G: At 110°C, the gaseous CO2 expands gradually; H: At 173.2°C, C2-type inclusion homogenized completely to gaseous phase.
From Table 1, it is shown that the homogenization temperatures of LV-type fluid inclusions vary greatly from 185.2 to 380.6°C. Stage I LV-type fluid inclusions have homogenization temperatures of 285.2–380.6°C (avg. 349.8°C) and ice melting temperatures of −5.7 to −0.1°C (avg. −3.1°C), whilst stage II LV-type inclusions have homogenization temperatures of 232.1–351.3°C (avg. 276.1°C) and ice melting temperatures of −13.8 to −0.1°C (avg. −3.1°C). Stage III LV-type inclusions have homogenization temperatures of 185.2–237.3°C (avg. 213.2°C) and ice melting temperatures of −5.6 to −0.3°C (avg. −2.5°C). Accordingly, mineralization temperatures at Zhangjiapingzi are mainly 320 and 380°C in stage I, 240–300°C in stage II, and 220 and 240°C in stage III (Figure 10).
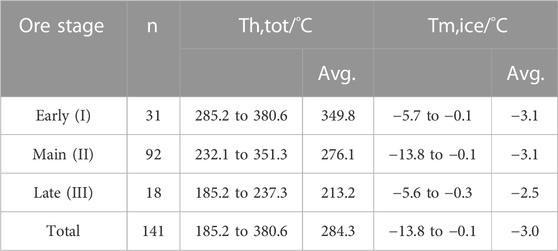
TABLE 1. Microthermometric data statistics of LV-type fluid inclusions from the Zhangjiapingzi gold deposit.
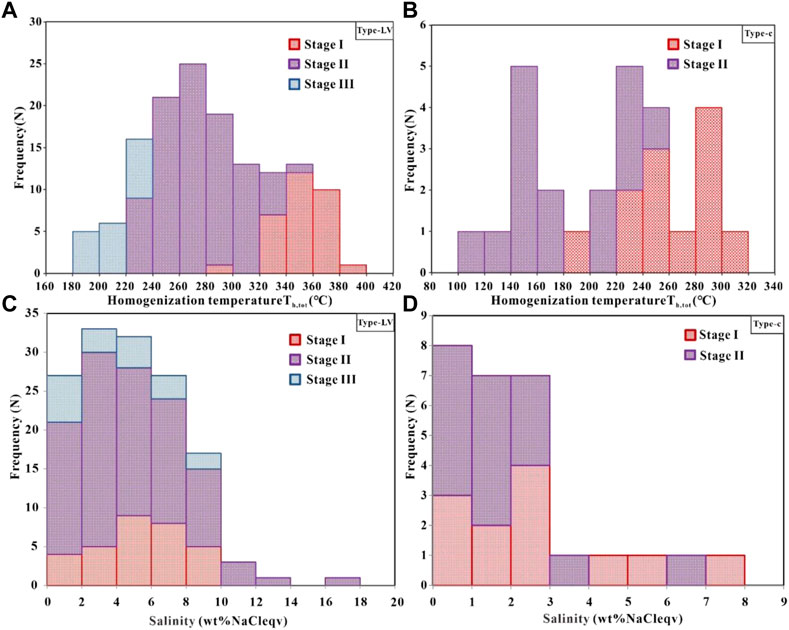
FIGURE 10. Homogenization temperature (A,B) and salinity (C,D) histograms of fluid inclusions from the Zhangjiapingzi gold deposit.
The vast majority of C-type fluid inclusions would burst or leak when the temperature exceeds 190°C during the heating process. Moreover, the larger the inclusion volume, the easier it is to burst. This is why only a small number of C-type inclusions could yield complete homogenization temperature in this study (Table 2).
From Table 2, it is shown that the initial melting temperatures of stage I C-type fluid inclusions are −57.8 to −55.8°C (mean −56.6°C). The daughter minerals disappeared at 6.1–9.8°C (mean 8.7°C). Partial homogenization temperatures are 18.4–29.8°C (mean 25.4°C), whilst total homogenization temperatures are 196.7–317.6°C (mean 265.3°C). In stage II, the initial melting temperatures of C-type inclusions are −57.5 to −56.1°C (mean −56.6°C). The daughter minerals disappeared at 6.7–9.7°C (mean 9.1°C). Partial homogenization temperatures are 20.1–23.2°C (mean 21.6°C), whilst the total homogenization temperatures are 119.8–253.2°C (mean 180.0°C). From Figure 10, it is shown that the mineralization temperatures at Zhangjiapingzi are concentrated around 240–300°C in stage I, and 140–160°C and 220–260°C in stage II.
4.4 Fluid salinity and density
The salinity and density for LV-type inclusions were calculated using the HokieFlincs2012Excel spreadsheet (Matthew et al, 2012), while those of C-type inclusions were calculated using the HokieFlincs2018Excel spreadsheet (Matthew, 2018).
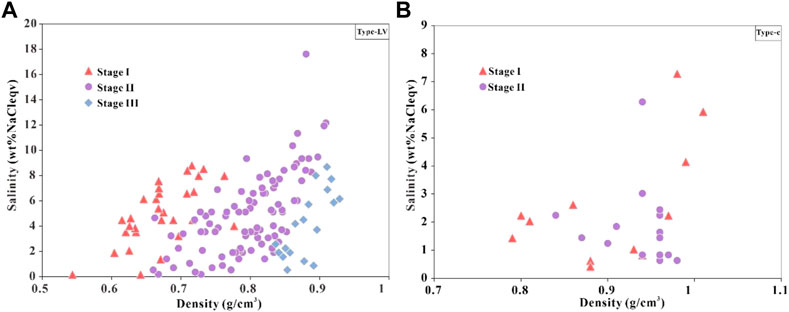
In stage I, the calculated salinity of LV-type and C-type fluid inclusions is of 0.18%–8.81% (avg. 5.02%) and 0.42%–7.29% (avg. 2.57%), respectively. The calculated fluid density of LV-type and C-type inclusions is of 0.54–0.78 g/cm3 (avg. 0.67 g/cm3) and 0.79–1.01 g/cm3 (avg. 0.90 g/cm3), respectively. In stage II, LV-type and C-type inclusions have salinity of 0.18%–17.61% (avg. 4.94%) and 0.63%–6.28% (avg. 1.84%), respectively, and density of 0.66–0.91 (avg. 0.80 g/cm3) and, 0.87–0.98 g/cm3 (avg. 0.94 g/cm3). In stage III, LV-type inclusions have salinity of 0.53%–8.68% (avg. 4.12%), and density of 0.84–0.93 g/cm3 (avg. 0.88 g/cm3) (Table 3).

TABLE 3. Salinity and density statistics of fluid inclusions (FI) in the Zhangjiapingzi gold deposit.
Petrographic observations indicate that LV-type and C-type inclusions coexist in quartz veins. LV1-type inclusions homogenized to the liquid phase, while some LV2-type inclusions homogenized to the gas phase. There are also some high-salinity LV1-type and C-type inclusions, indicating fluid boiling during mineralization. Figures 10C, D shows that the fluid salinity decreases from the early to late stage, whilst Figure 11 shows that the fluid salinity and density are correlated positively. Throughout the mineralization, the density increases and the salinity decreases gradually. The overall fluid salinity and density are below 10% and 0.79–1.01 g/cm3, indicating that the Zhangjiapingzi gold ore fluids are of low salinity and medium-low density.
4.5 Mineralization pressure estimation
Fluid inclusion pressure estimation has always been challenging, and the estimated mineralization pressure usually refers to the trapping pressure of fluid inclusions. The homogenization pressure of fluid inclusions can be obtained based on their homogenization temperature, but the trapping pressure needs to be corrected. In nature, the most common ore-forming fluid system is the NaCl-H2O system, which exists in almost any type of deposits. The Zhangjiapingzi gold ore-forming fluids belong to the H2O-NaCl-CO2 system, and thus different formulas are needed to calculate the pressure.
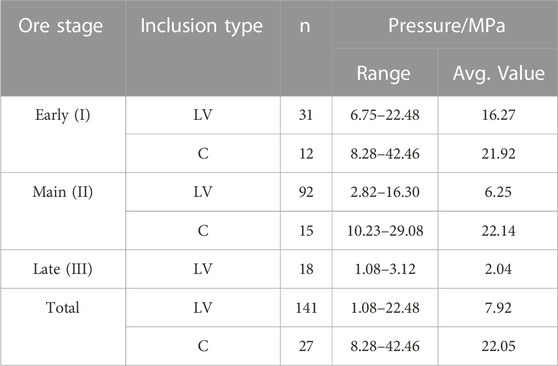
Matthew (2018) proposed a new pressure calculation method for the NaCl-H2O fluid system, which is adopted here for LV-type inclusions. Meanwhile, pressure calculation of C-type inclusions used the formula for the H2O-NaCl-CO2 system (Pudack et al, 2009; Matthew et al, 2012). The calculation results are shown in Table 4.
In stage I, the estimated pressure of LV-type and C-type fluid inclusions is of 6.75–22.48 MPa (avg. 16.27 MPa) and 8.28%–42.46% (avg. 21.92%), respectively. In stage II, the estimated pressure of LV-type and C-type inclusions is of 2.82–16.30 MPa (avg. 6.25 MPa) and 10.23–29.08 MPa (avg. 22.14 MPa), respectively. In stage III, the estimated pressure of LV-type inclusions is 1.08–3.12 MPa (avg. 2.04 MPa). Estimated pressure of the Zhangjiapingzi gold mineralization ranges from 1.08 to 42.46 MPa. As shown in Figure 12, the pressure of quartz fluid inclusions decreases from the early to the late stage, except for some outliers.
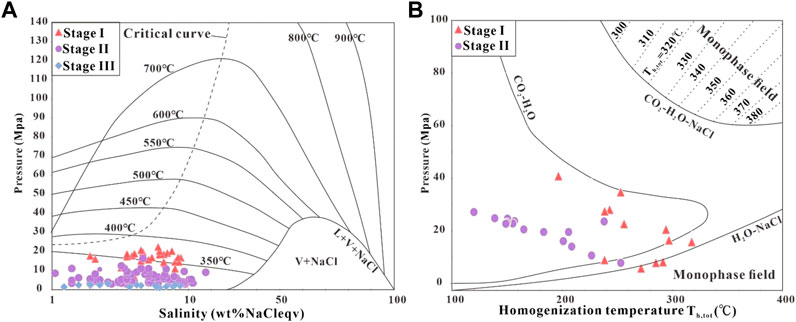
FIGURE 12. (A) Salinity-pressure plots for LV-type fluid inclusions; (B) pressure-homogenization temperature plot for C-type fluid inclusions in the Zhangjiapingzi gold deposit. Base map is adapted from references (Yang et al, 2009; Sourirajan et al, 1962; Bodnar et al, 1962; Ulrich et al, 1962) (A) and (Diamond et al, 2003; Li, 2021) (B).
5 Discussion
5.1 Characteristics of ore-forming fluids
Primary fluid inclusions preserve the features and origin of ore-forming fluids, which are crucial for the understanding of the ore genesis (Hou et al, 2006a; Hu et al, 2014). Based on microthermometry and petrographic observations, the fluid inclusions from Zhangjiapingzi gold deposit are dominated by CO2-H2O-NaCl inclusions. Our microthermometric analysis indicates that the main ore stage fluid inclusions range from 220 to 300°C, with low salinities (<10%) and density (0.79–1.01 g/cm3). Laser Raman analysis reveals that the inclusions are CO2-rich, suggesting that the ore-forming fluid was of medium-temperature, low-salinity, medium-low-density, and CO2- and CH4-rich. Previous studies have shown that most of the H-O isotope data fall within the metamorphic water field (Figure 13), and the C-O data imply that the carbon of the ore-forming fluid was originated from the mantle (Figure 14). This indicates that the Zhangjiapingzi gold deposit has similar carbon (δC13 = −7.40 to −3.44‰), oxygen (δO18H2O = 4.4‰–6.7‰) and sulfur (δ34S = 3‰–7‰) isotope compositions (Table 5) to those of typical mantle-derived metamorphic-hydrothermal fluids (Luo et al, 2013; Xin et al, 2016; Xu et al, 2019; Li, 2001; Li et al, 2007; Li et al, 2005).
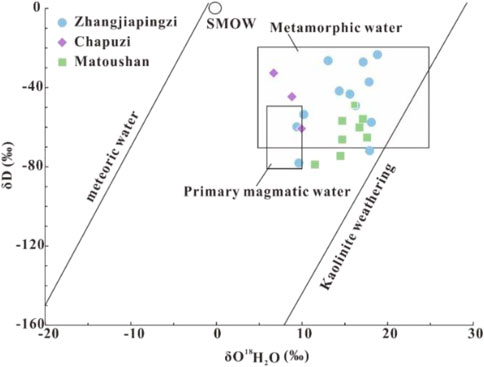
FIGURE 13. Fluid inclusion δD-δO18H2O diagram of gold deposits in the Danba-Mianning gold metallogenic belt. Base map is adapted from references (Taylor, 1974; Rollison et al, 2000).
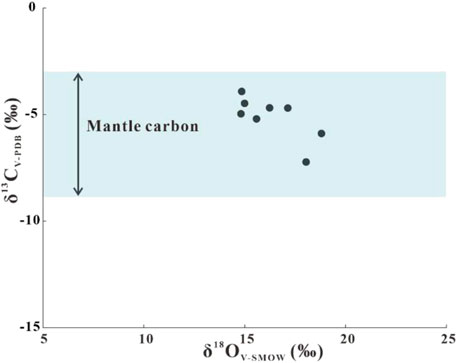
FIGURE 14. δ13CV-PDB vs δ18OV-SMOW diagram for the Zhangjiapingzi gold deposit. Base map is adapted from references (Luo et al, 2013; Xin et al, 2016).

TABLE 5. Carbon-hydrogen-oxygen isotope compositions of different gold deposits in the Danba-Mianning gold ore belt.
Generally, water-rock interaction, fluid mixing and CO2 degassing are common mechanisms for hydrothermal ore deposition (Zheng, 1990; Zhang, 1997). Previous studies have demonstrated (Zheng et al, 1993) that C and O isotopic compositions are negatively correlated when the fluids are affected by CO2 degassing or fluid-wallrock interaction, and such negative correlation is found in our data. However, a simple fluid-wallrock interaction cannot explain the wide δ13CV-PDB range (−7.40 to −3.44) observed in the Zhangjiapingzi samples (Table 5). This implies that water-rock interaction alone is insufficient to account for metal precipitation. Pressure drop (e.g., boiling) is a key process for CO2 degassing. We found that coexisting fluid inclusions with different types and gas-liquid ratios have similar total homogenization temperatures (within the same field of view).
Figure 15 shows that although the homogenization temperature variation is minor, their salinities vary widely. Some main-ore stage fluid inclusions have high salinities (max 17.61%), while some have low salinities (min 0.18%), implying fluid boiling. Table 4 shows that from the early to late mineralization stages, LV-type inclusions indicate a gradual decrease of ore-forming pressure (from 22.48 to 1.08 Mpa). During CO2 degassing of the ore-forming fluids, metallic minerals precipitated as the fluid degassed CO2 and its pH increased. The H-O isotope data plot within the metamorphic water field (Figure 13), with minor contribution from the mantle-derived magmatic water. This suggests that the ore-forming fluids may have involved a mixture of metamorphic and magmatic fluids, although fluid mixing alone cannot account for all the ore precipitation.
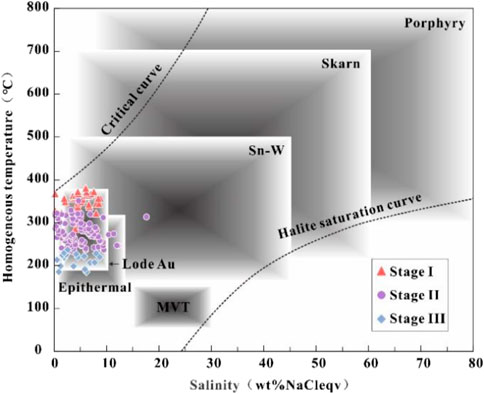
FIGURE 15. Salinity vs homogenization temperature plot of fluid inclusions from the Zhangjiapingzi gold deposit. Base map is adapted from reference (Rollison et al, 2000).
5.2 Gold metallogeny at zhangjiapingzi
Based on previous studies (Lan, 2013; Luo et al, 2013; Yang et al, 2015; Bao, 2016; Xin et al, 2016; Zhou et al, 2016; Wang et al, 2019) (Table 6), a comparison of Zhangjiapingzi gold deposit with epithermal and orogenic types reveals that Zhangjiapingzi gold deposit matches with orogenic features in terms of regional tectonic setting, orebody features, ore types, wallrock alteration, and the ore-forming fluid features and sources (Groves et al, 1998; Kerrich et al, 2000; Chen, 2006; Chen et al, 2007; Cline, 2018; Deng et al, 2020; Wang et al, 2022). The H isotope composition (δD) of Zhangjiapingzi gold deposit ranges from −78.06 to −23.35‰ (Table 5), which is consistent with those of typical orogenic gold deposits (δD = −80 to −20‰) (Ohmoto, 1997), further supporting that the Zhangjiapingzi is orogenic type.
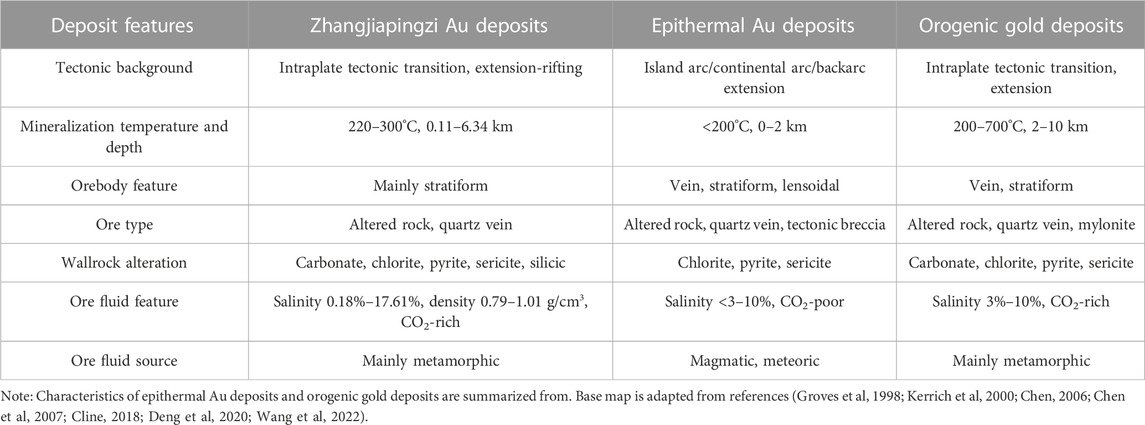
TABLE 6. Comparison of geological characteristics between Zhangjiapingzi gold deposit and epithermal and orogenic gold deposits.
The Zhangjiapingzi gold deposit is situated in the Danba-Mianning gold metallogenic belt, which borders the southwest margin of Yangtze block and Songpan-Ganzi orogenic belt. This area underwent the Yanshanian and Himalayan orogenic events, leading to the development and modification of shear (and alteration) zones that controlled the gold transport and concentration (Bao et al, 2016). The regional orogeny may have also provided the ore-forming materials, fluids and structures for gold mineralization. Within the Zhangjiapingzi mining area, the F1 fault (Figure 2) and its associated structures and alteration zones are the main ore-hosting sites, as these structures created favorable conditions for gold deposition. Based on our petrographic and Raman spectroscopic analyses of fluid inclusions, the ore-forming fluid was likely of medium-temperature (220–300°C), low-salinity (<10%), medium-low-density (0.79–1.01 g/cm3), and CO2- and CH4-rich, resembling orogenic-type ore-forming fluid and suggesting an orogenic origin for this deposit.
6 Conclusion
Based on microthermometry and petrographic observations, the fluid inclusions from Zhangjiapingzi gold deposit are dominated by CO2-H2O-NaCl inclusions. The microthermometric data of fluid inclusions from the main mineralization stage range from 220 to 300°C, with low salinities (<10%) and densities (0.79–1.01 g/cm3). The ore-forming fluid exhibits medium-temperature, low-salinity, medium-low-density, CO2- and CH4-rich features, which match with the ore-forming fluid features of orogenic gold deposits, suggesting an orogenic origin for this deposit.
Data availability statement
The original contributions presented in the study are included in the article/Supplementary Material, further inquiries can be directed to the corresponding author.
Author contributions
Writing—original draft preparation, JZ and BY; methodology, WW; Writing-review and editing, LZ; Resources, CL; supervision, HY; Data curation, HJ; All authors contributed to the article and approved the submitted version.
Funding
State Key Laboratory of Ore Deposit Geochemistry of China: SKLODG grant #202007.
Acknowledgments
The authors would like to thank the staffs from the State Key Laboratory of Deposit Geochemistry of the Institute of Geochemistry (Guiyang) for helping with the laboratory analyses and their insightful suggestions.
Conflict of interest
Author HY is employed by the company Tibet Jinhai Mineral Resources Development Co., Ltd. and Author HJ is employed by the company Sichuan Xing ye Geotechnical Engineering Detecting Co., Ltd.
The remaining authors declare that the research was conducted in the absence of any commercial or financial relationships that could be construed as a potential conflict of interest.
Publisher’s note
All claims expressed in this article are solely those of the authors and do not necessarily represent those of their affiliated organizations, or those of the publisher, the editors and the reviewers. Any product that may be evaluated in this article, or claim that may be made by its manufacturer, is not guaranteed or endorsed by the publisher.
Supplementary material
The Supplementary Material for this article can be found online at: https://www.frontiersin.org/articles/10.3389/feart.2023.1228019/full#supplementary-material
References
Bao, X. Q. (2016). Study on enrichment regularities of mineralization and the ore-forming mechanism of the Zhangjiapingzi gold deposit. Lanzhou, China: Northwest Normal University.
Cline, J. S. (2018). “Nevada's carlin-type gold deposits: What we've learned during the past 10 to 15 years,” in Diversity in calin-style gold deposits, reviews in economic geology. Editor J. L. Muntean (Colorado, United States: Society of Economic Geologists), 20, 7–37.
Chen, Y. J. (2006). Orogenic deposit, metallogenic model and metallogenic potential. Geol. China (in Chin. 33 (06), 1181–1196.
Chen, Y. J., Ni, P., Fan, H. R., Pirajno, F., Lai, Y., Su, W. C., et al. (2007). Chemical composition of fluid inclusions of the Sawayardun gold deposit, Xinjiang: Implications for orogenesis and prediction. Acta Petrol. Sin. (09), 2189–2197.
Deng, J., Yang, L., Groves, D. I., Zhang, L., Qiu, K. F., Wang, Q. F., et al. (2020). An integrated mineral system model for the gold deposits of the giant Jiaodong province, eastern China. Earth-Sci. Rev. 208, 103274. doi:10.1016/j.earscirev.2020.103274
Diamond, L. W., and Nikolay, N. A. (2003). Solubility of CO2 in water from -1.5 to 100 °C and from 0.1 to 100 MPa: Evaluation of literature data and thermodynamic modelling. Fluid Phase Equilibria 208 (1), 265–290. doi:10.1016/s0378-3812(03)00041-4
Fu, H. B., Liu, Y., Zheng, X., Jia, Y. H., and Ding, Y. (2019). Geochronology, geochemistry and metallogenic characteristics of Muluozhai deposit in southwestern Sichuan province. Mineral. Depos. Geol. 38 (03), 491–508.
Groves, D. I., Goldfarb, R. J., Gebre-Mariam, M., Hagemann, S. G., and Robert, F. (1998). Orogenic gold deposits: A proposed classification in the context of their crustal distribution and relationship to other gold deposit types. Ore Geol. Rev. 13, 7–27. doi:10.1016/s0169-1368(97)00012-7
Hou, Z. Q., Pan, G. T., Wang, A. J., Mo, X. X., Tian, S. H., Sun, X. M., et al. (2006a). Metallogenesis in Tibetan collisional orogenic belt: II. Mineralization in late-collisional transformation setting. Ore deposits (05), 521–543.
Hou, Z. Q., Qu, X. M., Yang, Z. S., Meng, X. J., Yang, Z. M., Zheng, M. P., et al. (2006b). Metallogenesis in Tibetan collisional orogenic belt: III. Mineralization in post-collisional extension setting. Ore Deposits (06), 629–651.
Hu, R. Z., Wen, H. J., Su, W. C., Zhao, C. M., Wang, D. H., and Zheng, Y. F. (2014). Some research advances in geochemistry of ore deposits in the last decade. Bull. Mineral. Petrol. Geochem. 33 (2), 127–144. doi:10.3969/j.issn.1007-2802.2014.02.016
Kerrich, R., Goldfarb, R. J., Groves, D. I., Garwin, S., and Jia, Y. (2000). The characteristics, origins and geodynamic settings of supergiant gold metallogenic provinces. Sci. China Ser. D 43, 1–68. 1-409. doi:10.1007/bf02911933
Li, B., Huang, Z. L., Xu, C., and Qi, L. (2007). Preliminary geochemical study of carbonatite PGE in the Coronation rare earth deposit, Sichuan. Mineral. J. (3), 423–429.
Li, S. (2001). The source beds and mineralization model for the gold deposits in the Jinpingshan area, Sichuan. Sediment. Tethys Geol. 21 (3), 48–59.
Li, X. F., Mao, J. W., Liu, Y. M., Xu, Q. H., and Zhu, H. P. (2005). The Miansawa gold deposit at the eastern margin of the Tibetan Plateau: fluid inclusion, stable isotopic and noble gas isotopic data and their metallogenic implications. Acta Petrol. Sin. 21 (1), 189–200.
Li, Z. (2021). Discussion on the characteristics of ore-forming fluids and genesis of Hadamengou gold deposit in Inner Mongolia. Beijing, China: China University of Geosciences.
Lu, H. Z., Fan, H. R., Ni, P., Hu, F. F., and Wang, K. Y. (2004). Fluid inclusions. Beijing, China: Science Press, 1–487.
Luo, G. X., and Tan, X. Q. (2013). Exploration on the source of ore-forming material and the direction of ore search in Zhangjiapingzi gold deposit. Sichuan Geol. J. 33, 7–12. S1.
Matthew, S. M. (2018). Fluid inclusions in the system H2O-NaCl-CO2: An algorithm to determine composition, density and isochore. Chem. Geol. 498, 31–44. doi:10.1016/j.chemgeo.2018.08.022
Matthew, S. M., Pilar, L. S., and Bodnar, R. J. (2012). HOKIEFLINCS_H2O-NaCl: A microsoft Excel spreadsheet for interpreting microthermometric data from fluid inclusions based on the pvtx properties of H2O-NaCl. Comput. Geosciences 49, 334–337. doi:10.1016/j.cageo.2012.01.022
Ohmoto, H. (1997). “Goldhaber M B. Sulfur and carbon isotopes,” in Geochemistry of hydrothermal ore deposits. Editor H. L. Barners (New York, United States: Wiley Interscience), 509–567.
Perea, J. A. L., Perea, D. E., and Sans, J. A. (2020). Atom probe tomography for isotopic analysis: development of the 34S/32S system in sulfides. Ultramicroscopy 216, 113102.
Pudack, C., Halter, W. E., Heinrich, C. A., and Pettke, T. (2009). Evolution of magmatic vapor to gold-rich epithermal liquid: The porphyry to epithermal transition at nevados de Famatina, northwest Argentina. Econ. Geol. 104 (4), 449–477. doi:10.2113/gsecongeo.104.4.449
Rollison, H. R., Yang, X. M., Yang, X. Y., and Chen, S. X. (2000). Translated. Rock geochemistry. Hefei, China: University of Science and Technology of China Press, 40–83. Distribution in the Kongyu-Huili gold belt, western Sichuan[J] Gold Geology (4(3):28-30.
Sourirajan, S., and Kennedy, G. C. (1962). The system H2O-NaCl at elevated temperatures and pressures. Am. Fluid inclusions J. Sci. 260 (2), 115–141. doi:10.2475/ajs.260.2.115
Sun, W. L., Peng, S. X., Bai, J. K., Wang, Y., Zhang, Y., Li, J., et al. (2018). Fluid inclusion characteristics and geochronology of the Wulunbulake copper deposit in Xinjiang. Earth Sci. 43 (12), 4475–4489. doi:10.3799/dqkx.2018.166
Taylor, H. P. (1974). The application of oxygen and hydrogen isotope studies to problems of hydrothermal alteration and ore deposition. Econ. Geol. 69, 843–883. doi:10.2113/gsecongeo.69.6.843
Ulrich, T., Gunther, D., and Heinrich, C. A. (2002). The evolution of a porphyry Cu-Au deposit, based on LA-ICP-MS analysis of fluid inclusions: Bajo de la Alumbrera, Argentina. Econ. Geol. 97 (8), 1889–1920. doi:10.2113/gsecongeo.97.8.1889
Wang, H., Lan, T. G., Fan, H. R., Hu, F. F., Yang, K. F., Zhang, W., et al. (2022). Fluid origin and critical ore-forming processes for the giant gold mineralization in the Jiaodong Peninsula, China: Constraints from in situ elemental and oxygen isotopic compositions of quartz and LA-ICP-MS analysis of fluid inclusions. Chem. Geol. 608, 121027. doi:10.1016/j.chemgeo.2022.121027
Wang, X. W. (2019). Occurrence characteristics of gold in zhangjiapingzi gold deposit, mianning county. Mineral. Resour., 1002–5065.
Wilkinson, J. J. (2001). Fluid inclusions in hydrothermal ore deposits. Lithos 55 (1-4), 229–272. doi:10.1016/s0024-4937(00)00047-5
Xin, C. L., Bao, X. Q., and An, G. B. (2016). Geological characteristics and metallogenesis of Zhangjiapingzi gold deposit in Sichuan Province. J. Lanzhou Univ. (from Zhouran Science Edition) 52 (06), 713–721.
Xu, M. R. (2019). Deposit geology, fluid inclusion characteristics and ore genesis of the Matoushan Cu-Au deposit in Mianning, Southwestern Sichuan Province. Lanzhou, China: Northwest Normal University.
Yang, H. C., and Xu, L. (2015). Fluid inclusion characteristics and carbon oxygen isotope characteristics of zhangjiapingzi gold deposit. Henan Science and Technology 9 (17), 135–137 +144. doi:10.3390/min9110677
Yang, Z. M., and Hou, Z. Q. (2009). Genesis of giant porphyry Cu deposit at qulong, tibet: Constraints from fluid inclusions and H-O isotopes. Acta Geologica Sinica 83 (12), 1838–1859.
Yang, Z. X., Anthony, E. W., and Pu, G. P. (2000). Geological features of maoninuping REE deposit, sichuan. Mineral Rocks 20 (2), 28–34. doi:10.19719/j.cnki.1001-6872.2000.02.007
Yao, D. S., Yao, W. Z., and Li, C. Y. (2002). Geological map of sichuan province and chongqing municipality. Sichuan, China: Sichuan Geology and Mineral Bureau.
Zhang, D. H. (1997). Overview of research depositional mechanisms in Ore-forming fluids. Geological Bulletin 26 (12), 1509–1518.
Zhang, W. L., Xi, X. Y., Yu, X. H., You, S. S., Feng, B. G., Li, Z. J., et al. (2021). Discussion on the Genesis of the Suoluogou gold deposit, muli, sichuan province: Constraints from geochronology, and S and Pb isotopes. Geochemistry 50 (05), 442–462.
Zhao, H. S. (2019). Genetic mechanism of danba-mianning orogenic gold belt on western margin of Yangtze Craton. Beijing, China: China University of Geosciences.
Zheng, Y. F. (1990). Carbon-oxygen isotopic covariation in hydrothermal calcite during degassing of CO2. Mineralium Deposita 25, 246–250. doi:10.1007/bf00198993
Zheng, Y. F., and Hoefs, J. (1993). Carbon and oxygen isotopic covariations in hydrothermal calcites. Mineralium Deposita 28 (2), 79–89. doi:10.1007/bf00196332
Keywords: Zhangjiapingzi, fluid inclusions, ore-forming fluids, orogenic gold deposits, Mianning
Citation: Yan B, Zhu L, Zhang J, Lai C, Yan H, Wei WF and Jiang H (2023) Fluid evolution and metallogenesis of the Zhangjiapingzi gold deposit in mianning, Sichuan province: constraints from fluid inclusion studies. Front. Earth Sci. 11:1228019. doi: 10.3389/feart.2023.1228019
Received: 24 May 2023; Accepted: 15 June 2023;
Published: 03 July 2023.
Edited by:
Kit Lai, Fortescue Metals Group, AustraliaReviewed by:
Tingguang Lan, Chinese Academy of Sciences (CAS), ChinaJing-Jing Zhu, Chinese Academy of Sciences (CAS), China
Copyright © 2023 Yan, Zhu, Zhang, Lai, Yan, Wei and Jiang. This is an open-access article distributed under the terms of the Creative Commons Attribution License (CC BY). The use, distribution or reproduction in other forums is permitted, provided the original author(s) and the copyright owner(s) are credited and that the original publication in this journal is cited, in accordance with accepted academic practice. No use, distribution or reproduction is permitted which does not comply with these terms.
*Correspondence: Liye Zhu, eGlhY2h1Y2h1bm1vQHN0dS5jZHV0LmVkdS5jbg==
 Bing Yan1
 Liye Zhu