
94% of researchers rate our articles as excellent or good
Learn more about the work of our research integrity team to safeguard the quality of each article we publish.
Find out more
ORIGINAL RESEARCH article
Front. Earth Sci. , 03 August 2023
Sec. Volcanology
Volume 11 - 2023 | https://doi.org/10.3389/feart.2023.1204832
This article is part of the Research Topic Applications of Machine Learning in Volcanology View all 9 articles
Introduction: Developing reliable seismic catalogs for volcanoes is essential for investigating underlying volcanic structures. However, owing to the complexity and heterogeneity of volcanic environments, seismic signals are strongly affected by seismic attenuation, which modifies the seismic waveforms and their spectral content observed at different seismic stations. As a consequence, the ability to properly discriminate incoming information is compromised. To address this issue, multi-station operational frameworks that allow unequivocal real-time management of large volumes of volcano seismic data are needed.
Methods: In this study, we developed a multi-station volcano tectonic earthquake monitoring approach based on transfer learning techniques. We applied two machine learning systems—a recurrent neural network based on long short-term memory cells (RNN–LSTM) and a temporal convolutional network (TCN)—both trained with a master dataset and catalogue belonging to Deception Island volcano (Antarctica), as blind-recognizers to a new volcanic environment (Mount Bezymianny, Kamchatka; 6 months of data collected from June to December 2017, including periods of quiescence and eruption).
Results and discussion: When the systems were re-trained under a multi correlation-based approach (i.e., only seismic traces detected at the same time at different seismic stations were selected), the performances of the systems improved substantially. We found that the RNN-based system offered the most reliable recognition by excluding low confidence detections for seismic traces (i.e., those that were only partially similar to those of the baseline). In contrast, the TCN-based network was capable of detecting a greater number of events; however, many of those events were only partially similar to the master events of the baseline. Together, these two approaches offer complementary tools for volcano monitoring. Moreover, we found that our approach had a number of advantages over the classical short time average over long time-average (STA/LTA) algorithm. In particular, the systems automatically detect VTs in a seismic trace without searching for optimal parameter settings, which makes it a portable, scalable, and economical tool with relatively low computational cost. Moreover, besides obtaining a preliminary seismic catalog, it offers information on the confidence of the detected events. Finally, our approach provides a useful tentative label for subsequent analysis carried out by a human operator. Ultimately, this study contributes a new framework for rapid and easy volcano monitoring based on temporal changes in monitored seismic signals.
Active volcanoes are often monitored by different ground and space-based instruments, which provide essential data for understanding the volcanic system, quantifying impacts, mitigating risk, and contributing to the preparedness of governments and society as a whole (Barsotti et al., 2020; Barsotti et al., 2023). However, identifying transitions in volcanic state is complex and involves the study of various physics processes. Given the large volumes of data now available from permanent monitoring seismic networks, volcanic seismology plays a critical role in volcano monitoring.
Volcanic dynamics generate an exchange of energy with the surrounding medium that propagates in the form of elastic or seismic waves. Owing to the complexity of volcanic processes, these seismic waves can have varying characteristics in both the time and frequency domains (Ibáñez et al., 2000). Identifying and characterizing these signals with the aim of associating them with internal dynamic processes is a key scientific challenge. Accurate recognition (identification and classification) is the basis for developing eruption forecasting based on precursors (Sparks et al., 2012; McNutt et al., 2015; Machacca et al., 2023), and is critical for improving knowledge of volcanic dynamics. Signals are generally classified based on the source model built to explain them. Low frequency signals (LF), such as so-called long period (LP) events and some types of volcanic tremor (TR), are associated with fluid dynamics. However, the most common type of seismic signal recorded in many volcanic environments is volcano tectonic (VT) earthquakes (Chouet, 2003). VT earthquakes are the consequence of stress-induced fluid dynamics inside the volcano (Roman and Cashman, 2006). In general, the source mechanisms of VT events can be described using classical approaches in seismology (Aki and Richards, 2002). However, as indicated by (Chouet and Matoza, 2013), owing to the involvement of fluids, this task is very complex in many volcanic environments. VTs are commonly considered to be potential precursors (McNutt and Roman, 2015), and so new methodologies and advances, including the use of artificial intelligence (AI), are increasingly being used to improve their recognition.
A key aspect of VT seismicity is that it contains much more information than that presented in each waveform. Recent studies have performed source modeling analysis (Sigmundsson et al., 2018; Sigmundsson et al., 2022; Cubuk-Sabuncu et al., 2021), focal mechanisms analysis, and 4D tomography showing the temporal evolution of volcanic structures in (Abacha et al., 2023). (Díaz-Moreno et al., 2015) used spatial and temporal analyses of VT foci evolution; for example, in their study, VTs generated during magma injection were assumed to reflect the effect of hydraulic fracturing, highlighting areas of the crust where stress was propagating as a consequence of magma migration. Seismic tomography allows us to reconstruct the internal structure of a volcano and infer the physical and dynamic characteristics of the volcanic system by studying the travel times of the first arrivals of VT waves (i.e., tomography of velocity (D’Auria et al., 2022), or by studying their loss of energy (i.e., attenuation tomography (Prudencio et al., 2013; Castro-Melgar et al., 2021) showed that volcanic structures are highly attenuating, which causes the waveform of the recorded signals to undergo strong changes, including loss of a large part of their spectral component, especially in the high frequency range. Similarly, (Titos et al., 2018), showed that VT earthquakes can be confused as LP-type events at a certain distance, which has consequences for the interpretation of internal dynamics of the volcanic system. However, these approaches all require data from large numbers of reliable earthquakes. Therefore, developing effective approaches that allow real-time management of large volumes of seismic data has become an important challenge.
Recent advances in machine learning (ML) have encouraged the development of advanced automatic data processing and analysis pipelines. Typically, new automatic approaches are built by learning from large seismic catalogues. These data-driven systems have proven to be very efficient tools in an ever-changing and streaming data environment; however, they have remarkably poor learning and adaptability outcomes owing to the incompleteness of many seismic catalogues. Nonetheless, building complete and reliable catalogues is technically challenging owing to the high cost of data-labelling. This issue has grown in importance in light of recent work, since catalogue-based learning can introduce bias when constructing predictive monitoring tools.
In this study, we developed a new automatic multi-station system for exclusively recognizing and labelling VT earthquakes. As discussed, owing to attenuation, many LP events annotated in seismic catalogues could actually be highly attenuated VT earthquakes. Therefore, we employed a multi-station process to improve the identification of VTs. To control for bias derived from seismic catalogue incompleteness, we employed transfer learning techniques (Weiss et al., 2016), which are helpful in domain-adaption problems, where the objective is to develop a monitoring system focused on available domain-specific data (Anantrasirichai et al., 2018; Titos et al., 2018; Bueno et al., 2019; Titos et al., 2019; Lapins et al., 2021; Jozinović et al., 2022). In contrast, our new monitoring system does not require prior domain-specific knowledge. Assuming a scenario in which there is no previous information related to the seismic dynamics of the volcano, instead of building a system from scratch (which would require an expensive data-labelling process), we used a recurrent neural network based on long short-term memory cells (RNN–LSTM) and a temporal convolutional network (TCN) (Titos et al., 2018; Titos et al., 2022) trained with a master catalogue belonging to Deception Island volcano (Antarctica) as a baseline. These models were then used as blind-recognizers for a different volcanic environment, that of Mount Bezymianny (Kamchatka). When these systems were re-trained under a multi correlation-based approach, where only reliable seismic traces identified at the same time at different seismic stations were selected and manually labeled, the performance of the systems improved substantially, resulting in a remarkable capability of confidently recognizing seismic traces. In summary, our approach provides a rapid and easy-to-use framework for real-time monitoring of temporal changes in seismic signals at any volcano.
In this study, we developed a new real-time multi-station seismic monitoring system for volcanoes without any prior knowledge within a transfer learning framework. Although some classical ML techniques such as Markov models have been used in sequence modeling tasks, neural networks (NN), including both RNN and TCN architectures (LeCun et al., 2015; Lea et al., 2016), have optimal temporal modeling capabilities. By generating a spatio-temporal sequence of hierarchical features, both architectures have been applied in complex and emerging geosciences research fields, including seismo-volcanic monitoring (Titos et al., 2018; Bueno et al., 2021), climate change (Yan et al., 2020), remote sensing (Račič et al., 2020), and human activities recognition (Nair et al., 2018). Accordingly, in this work, an RNN based on long short-term memory cells (RNN–LSTM) and a TCN (Titos et al., 2018; Titos et al., 2022) trained with a master catalogue belonging to Deception Island volcano (Antarctica) were proposed as a baseline. These were then used as a blind-recognizer for the data from a different volcanic environment, Mount Bezymianny (Kamchatka). The master database belonging to Deception Island volcano is unbalanced; however, it has been thoroughly reviewed by experts on the volcano. According to (Titos et al., 2018), the Deception Island dataset is composed of five seismic categories: background noise (BGN), tremor (TR), hybrid (HYB), VTs, and LPs; Table 1 summarizes the performances of the two approaches (RNN–LSTM and TCN) using the master catalog, based on the percentage of events correctly recognized.
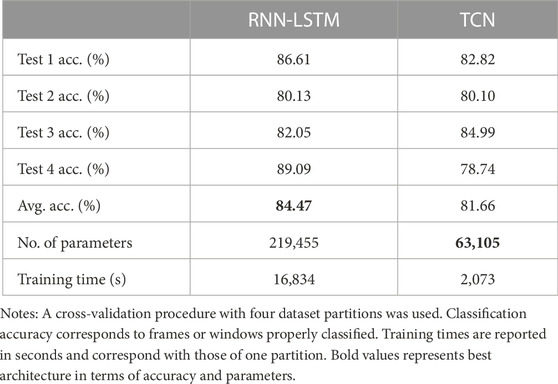
TABLE 1. Classification accuracy (acc. %), number of parameters tuned, and training times for optimal configurations of the recurrent neural network based on long short-term memory cells (RNN–LSTM) and temporal convolutional network (TCN) architectures using the master catalogue (Deception Island volcano, Antarctica).
Then, assuming a scenario in which the monitoring agency does not have any previous information related to the seismic dynamics of a volcano, a new monitoring tool was obtained as follow (see Figure 1):
1. Data parameterization: Raw streaming data belonging to each seismic station within the new volcanic environment were parameterized following the parameterization scheme of (Titos et al., 2018) to obtain the baseline systems.
2. Preliminary seismic catalog: By utilizing parameterized streaming traces as inputs, the pre-trained system generates a preliminary seismic catalog that consists of identified events along with their respective timing and probabilities assigned to each event class. It is important to note that when applying transfer learning without any domain-adaptation process, the seismic categories detected in a new volcanic environment will correspond to the seismic categories used in the master catalogue. Therefore, since the parameterization scheme adopted here was based on the spectral content of the seismic traces, events completely different from those described in the master catalog were categorized into these classes, based on their spectral similarity.
3. Probabilistic event detection: Using the preliminary seismic catalog, a probabilistic event selection process was used to obtain a new dataset from which to re-train or adapt the pre-trained system (RNN-LSTM or TCN) for the new volcanic environment. This process involved five steps:
• The seismic station detecting the largest number of events was selected as the reference station (RS).
•For each detected event at the RS, the confidence of the detection was analysed using a probabilistic event detection matrix with per-class probabilities output by the softmax layer (this layer is useful in multiclass classification problems as it converts the output values of the neural network into probabilities to each possible class). We assumed that low per-class probabilities reflect a change in the description of the analysed information. Therefore, only reliable events (those whose per-class probabilities were greater than a given threshold) were selected.
•For each previously selected event, a multi correlation-based approach was applied to identify if they could be detected at the same time at different seismic stations. If the same event was reliably detected (per-class probabilities greater than a given threshold) at the same time at least two seismic stations, it was included as a training instance.
•Once the new training set was created, all instances were manually analyzed and newly labeled by experts in order to refine the bounding of the events.
•Finally, the pre-trained systems were re-trained using the new dataset and labels.
4. The final stage comprised further iterations of the probabilistic event detection (see point 3 above) in order to reach an optimal level of performance.
The pipeline used for this study is suitable for application to other baseline systems and parameterization schemes.
Bezymianny volcano (55.6°N, 160.3°E) is an explosive basaltic–andesitic stratovolcano belonging to the Klyuchevskaya (KVG) volcanic group on the Kamchatka Peninsula, Russia. It is located in the central depression of Kamchatka (CKD), which covers
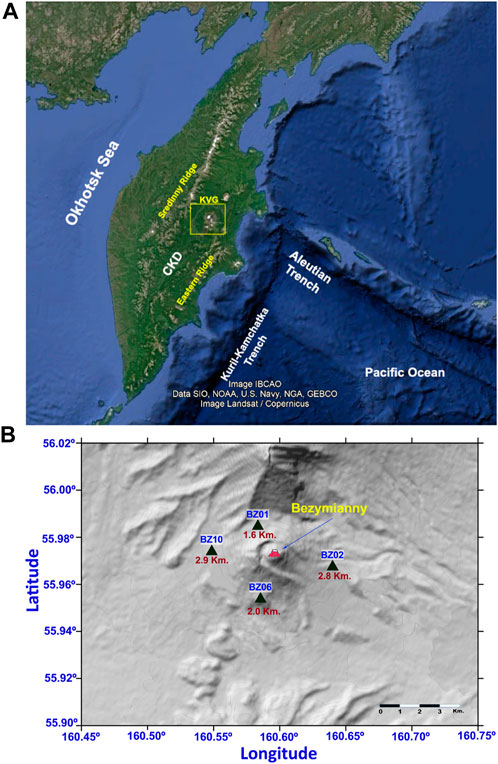
FIGURE 2. (A) Geological framework of Bezymianny volcano and (B) seismic station locations used in this study. Figure obtained and modifies from Google Earth resources.
The seismic data used in this study were collected by a temporary network composed of 10 seismic stations, installed during the 2017–2018 period (Koulakov et al., 2021). However, only data corresponding to four stations (Figure 2B) were selected. Criteria for selecting the seismic stations were motivated by both the availability and quality (signal-to-noise ratio) of the data. In addition, to further determine the reliability of the monitoring system proposed, two additional eruptive phases (a pre-eruptive stage characterized by little activity and a syn-eruptive stage with tens of thousands of events) containing 6 months of seismic data from June to December 2017 were also selected.
In this study, we analyzed results for four seismic stations over a 6 month period. However, to facilitate discussion of the results, here, we focus on VTs detected during 3 months of data, —August, October, and December 2017—which correspond to quiescent, pre-eruptive, and syn-eruptive phases, respectively.
Figure 3A summarizes the VTs detected by the pre-trained RNN–LSTM system before and after re-training using the new (Bezymianny volcano) dataset. Contrary to expectations, the number of VTs detected at some stations using the RNN–LSTM remained constant or decreased after being re-trained. Figures 4, 5 show comparisons of the monthly per-station cumulative distribution function (CDF) before and after the re-training process, representing the probabilities and normalized cumulative sums of events predicted as VTs. Before re-training, while a high number of events were detected, the confidence of such detections was low. More specifically, in August 2017 (Figure 4A), almost 70% of the events detected had probabilities of between 35% and 55%; in October and December 2017 (Figures 4B, C), except at station BZ06 (where 50% of the events detected had probabilities of
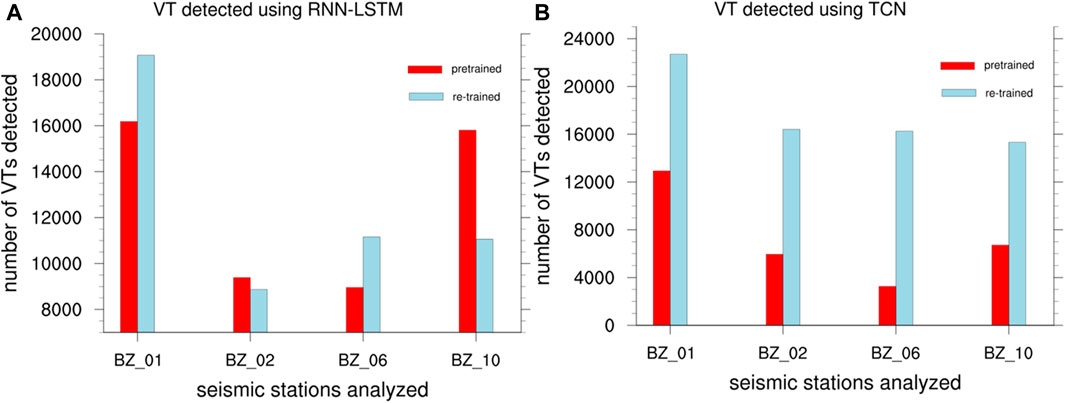
FIGURE 3. Total number of volcano tectonic (VT) earthquakes detected by (A) a recurrent neural network based on long short-term memory cells (RNN–LSTM) and (B) a temporal convolutional network (TCN) before and after the re-training process.
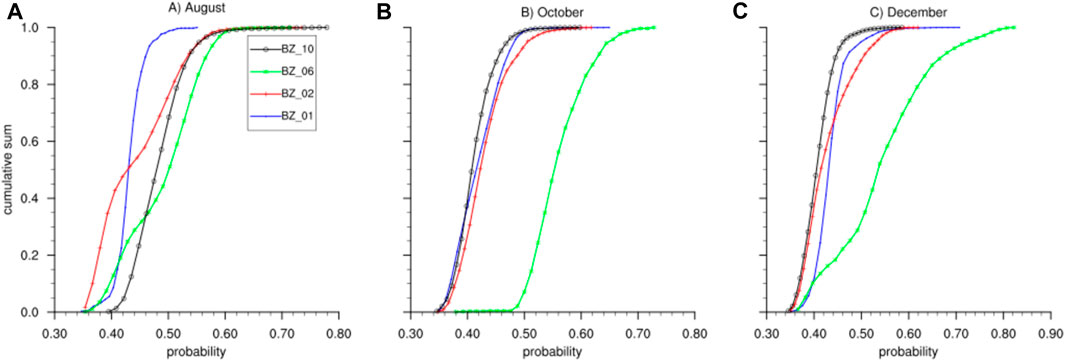
FIGURE 4. Monthly per-station cumulative distribution function (CDF) for the recurrent neural network based on long short-term memory cells (RNN–LSTM) before re-training. The x-axis represents the probabilities assigned by the models to those events detected as volcano tectonic (VT) earthquakes; the y-axis represents the normalized cumulative sum of events predicted within that class. (A) August 2017. (B) October 2017. (C) December 2017.
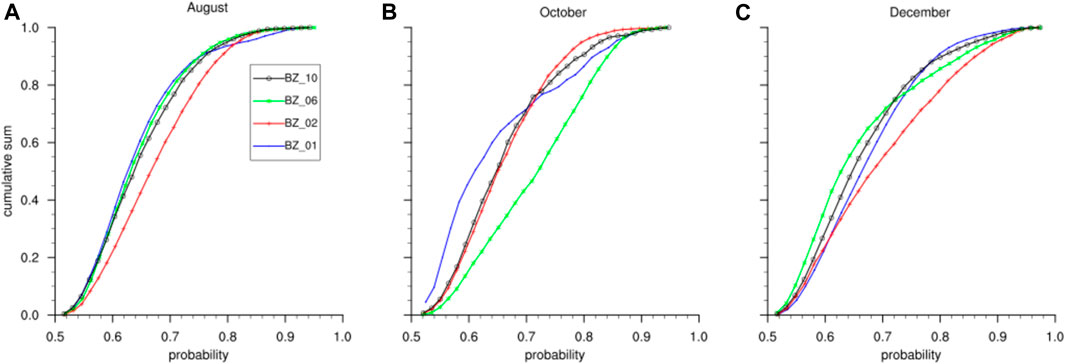
FIGURE 5. Monthly per-station cumulative distribution function (CDF) for the recurrent neural network based on long short-term memory cells (RNN–LSTM) after re-training. The x-axis represents the probabilities assigned by the models to those events detected as volcano tectonic (VT) earthquakes; the y-axis represents the normalized cumulative sum of events predicted within that class. (A) August 2017. (B) October 2017. (C) December 2017.
Figure 3B summarizes the VTs detected by the pre-trained TCN system before and after re-training using the new (Bezymianny volcano) dataset. Figures 6, 7 show comparisons of the monthly per-station CDF before and after the re-training process. In contrast to the RNN–LSTM, the TCN architecture saw an increase in the total number of earthquakes detected after being re-trained but a significant decrease in the confidence of the recognitions. Before re-training, 90% of events were detected with probabilities of
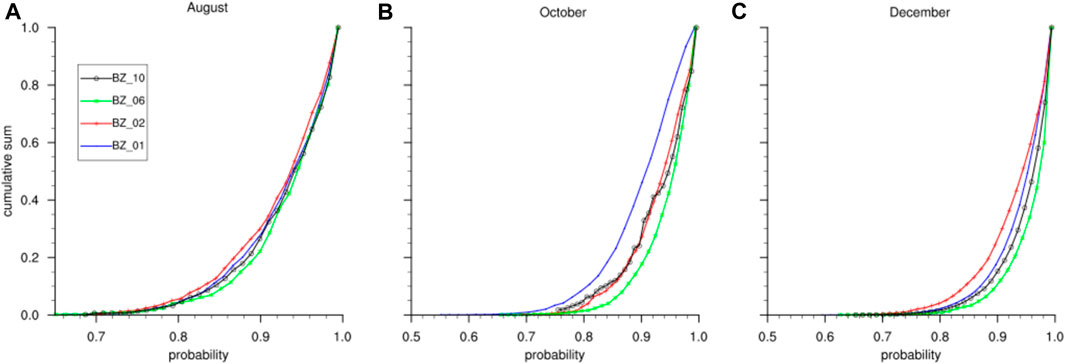
FIGURE 6. Monthly per-station cumulative distribution function (CDF) for the temporal convolutional network (TCN) before re-training. The x-axis represents the probabilities assigned by the models to those events detected as volcano tectonic (VT) earthquakes; the y-axis represents the normalized cumulative sum of events predicted within that class. (A) August 2017. (B) October 2017. (C) December 2017.
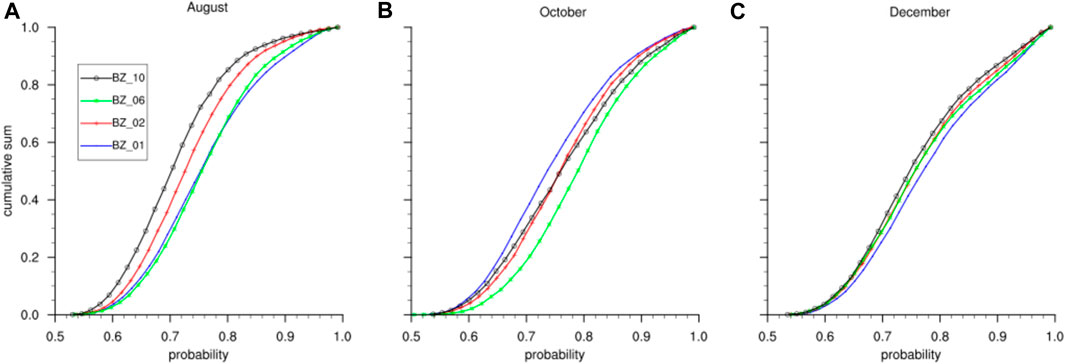
FIGURE 7. Monthly per-station cumulative distribution function (CDF) for the temporal convolutional network (TCN) after pre-training. The x-axis represents the probabilities assigned by the models to those events detected as volcano tectonic (VT) earthquakes; the y-axis represents the normalized cumulative sum of events predicted within that class. (A) August 2017. (B) October 2017. (C) December 2017.
To determine the robustness of our system, we compared our results before and after re-training to those of a classical approach, the short time average over long time-average (STA/LTA) trigger algorithm (Trnkoczy, 2009). We selected a single day on which several hundred earthquakes occurred and analyzed the results on an hourly timescale. Given that the TCN always detected a greater number of events than the RNN–LSTM, we assumed that the VTs detected by the RNN–LSTM were a subset of those detected by the TCN and selected only those events for analysis. On the chosen day, the RNN–LSTM did not recognize any VTs before it was re-trained; after re-training, all of the VTs recognized had previously been categorized as TR events.
Figure 8 presents an overview of the STA/LTA triggering thresholds. For proper operation of the STA/LTA algorithm, four parameters should be tuned: the short window length (STA), long window length (LTA), activation threshold level, and deactivation threshold level. The STA/LTA trigger parameter settings are always a tradeoff among sensitivity and specificity. While sensitivity may also include a tolerable number of false triggers, specificity correctly detects only particular instances, therefore decreasing the number of detections. Considering that the algorithm computes the average absolute amplitude of a seismic signal in two consecutive moving-time windows, only events exceeding pre-set values describing the triggering thresholds of both STA and LTA were identified. Figure 9 compares the number of VTs detected hourly during 14 August 2017, by the STA/LTA trigger algorithm and re-trained RNN-LSTM architecture; overall, the results show that the RNN–LSTM recognized a higher number of VTs than the STA/LTA algorithm (782 vs. 648).
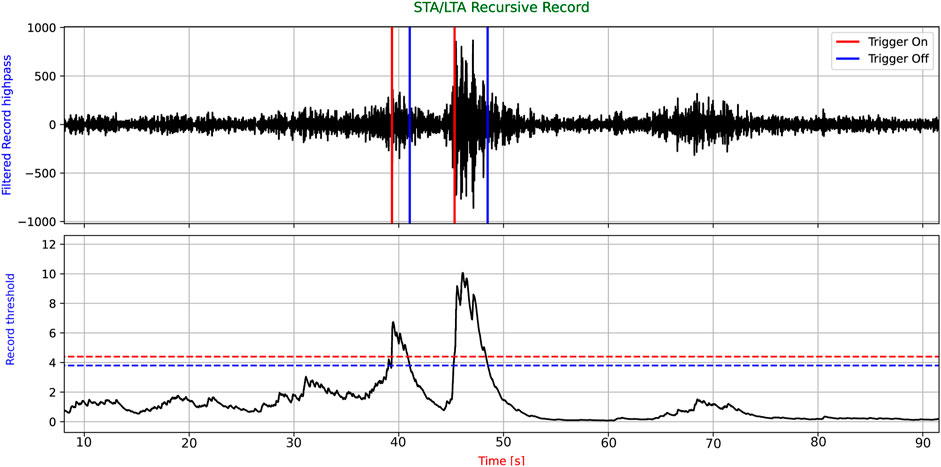
FIGURE 8. Overview of short time average over long time-average (STA/LTA) triggering thresholds in this work.
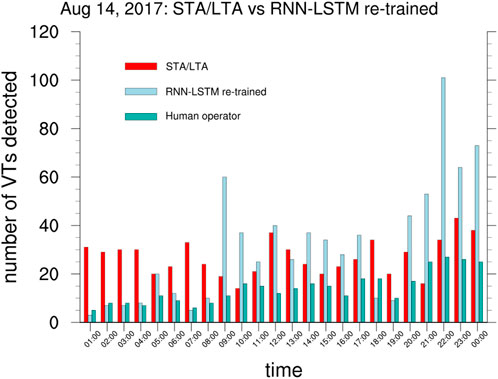
FIGURE 9. Number of volcano tectonic (VT) earthquakes detected hourly on 14 August 2017 using the short time average over long time-average (STA/LTA) trigger algorithm and the re-trained recurrent neural network based on long short-term memory cells (RNN–LSTM). Results obtained by both architectures have been compared with human operator criteria
The noticeable difference in the performance of the system after re-training can be explained from a geophysical perspective. First, owing to the noisy content registered in the new volcanic environment, it is possible that many of the events detected before the re-training were low probability VTs (or mis-recognized VT) corresponding to seismic traces characterized by high frequencies and variable length. Since the system fitting approach is a density estimation problem and such seismic traces partially match observed VT features in the master catalog (Deception Island), the estimated probability density function and its parameters cannot explain the underlying distribution of the new input data; as such, it assigns a low probability. Figure 10A provides a clear overview of this issue, in which a seismic trace partially matches with source earthquakes with a low probability (52%).
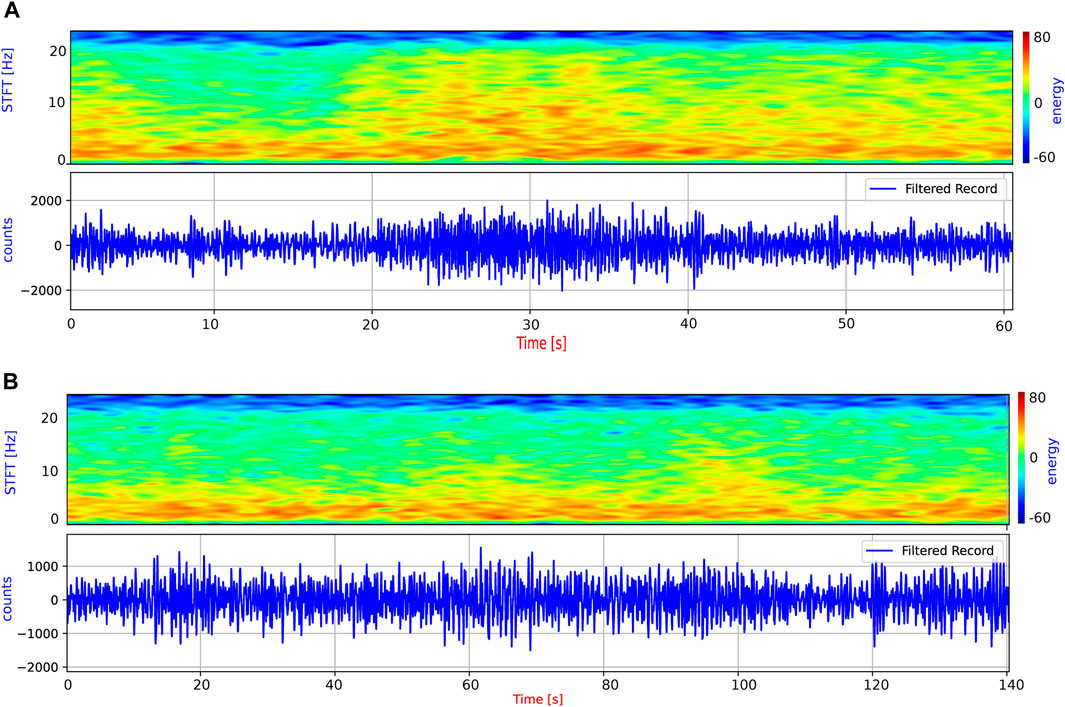
FIGURE 10. Recognition analysis before and after re-training of the recurrent neural network based on long short-term memory cells (RNN–LSTM). Before re-training, the system labeled seismic traces partially matching with volcano tectonic (VT) earthquakes as VTs with low probability. After re-training, only high confidence VTs were detected and labeled; low probability events were categorized as undefined events. (A) Example of a low probability (52%) VT earthquake detected before re-training. (B) Example of a low probability VT earthquake (60%) labeled as ‘undefined’ after re-training. With the purpose of enhancing visualization, the raw seismic signals were subjected to a filtering process, limiting the frequency range between 1 and 20 Hz.
Second, many of the VTs detected after re-training were originally recognized as TR, which can be explained by the differences between the learned representation at source and target underlying distributions. Figure 11 shows the spectrograms and power spectral densities (PSD) of VTs from Bezymianny volcano and Deception Island, and a TR from Deception Island. The figure shows very similar spectral energy distributions. The beginning of the Deception Island TR (Figure 11B) has a short and overlapped package of high frequency waves (up to 20 Hz). These high frequency signals are associated with the explosive step of pressure in the source region when LP events are generated near the seismic station (no visible exponential decay in frequency is observed) and with small earthquakes. At Bezymianny volcano, many VTs have a higher energy component at low frequencies (Figure 11C); therefore, as our parameterization scheme performs energy analysis by frequency bands that are more sensitive in lower frequencies, the pre-trained system failed to recognizing these energetic low frequency VT events. After re-training, the global number of recognized VTs was similar, but confidence of the detections was much higher.
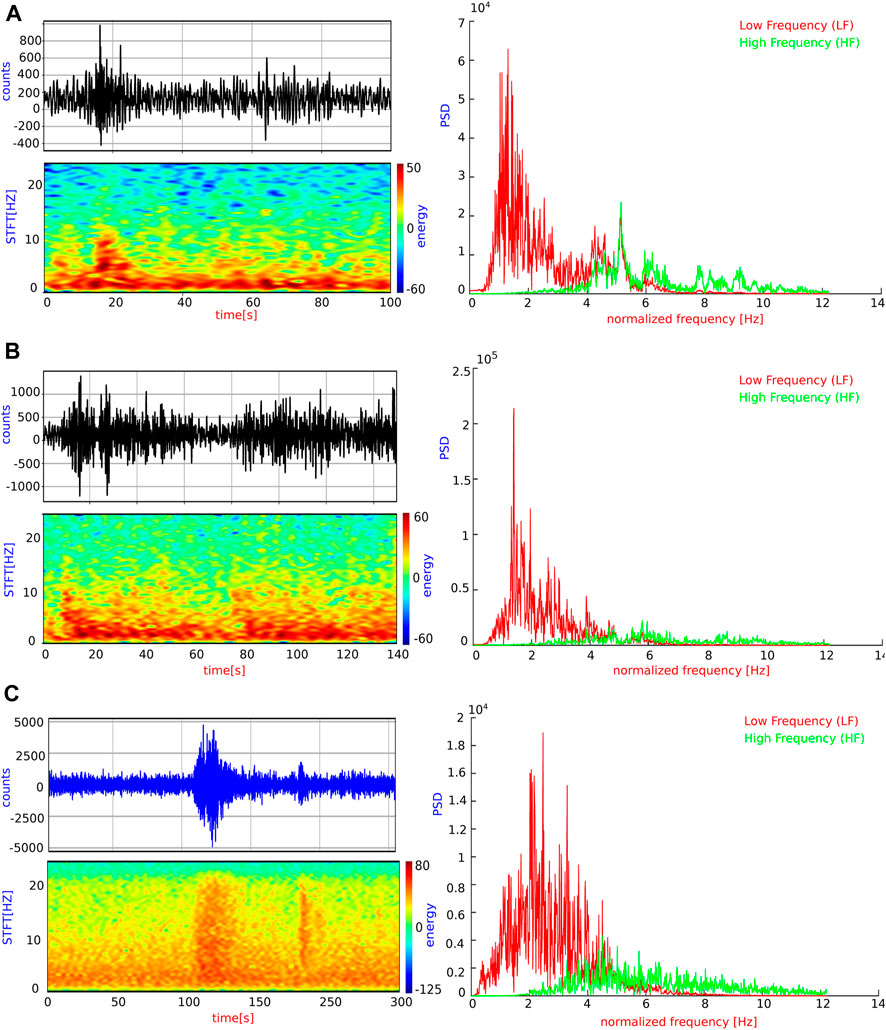
FIGURE 11. Spectrograms and power spectral densities (PSD) of different events belonging to Bezymianny volcano and Deception Island. (A) Volcano tectonic (VT) earthquake from Deception Island. (B) Volcanic tremor (TR) event from Deception Island. (C) VT from Bezymianny volcano.
In summary, the system (i.e., the probability distribution and associated parameters) is fixed to maximize a likelihood function that best explains the joint probability distribution of the new volcanic dynamics (in this case, Bezymianny volcano). As a result, following re-training, only confident VTs were detected and labeled. Those previously mis-recognized as TR were now confidently detected, while those events with low probabilities (
The noticeable difference in the performance of the system after re-training can be explained by the greater specialization ability of TCN compared with RNN–LSTM owing to the multi-resolution dilated skip connections between layers and deeper hierarchical features. The new Bezymianny volcanic dynamics often exhibit consecutive seismic events that bear partial resemblance to earthquakes occurring closely together in a short timeframe. Before retraining, the system could avoid recognizing such new volcanic dynamics based on high frequencies and short length as isolated events. Therefore, when such concatenated events were detected, focusing only on those volcanic dynamics that were similar to the master catalog, the system considered them all as a whole, not as isolated events (Figure 12A).
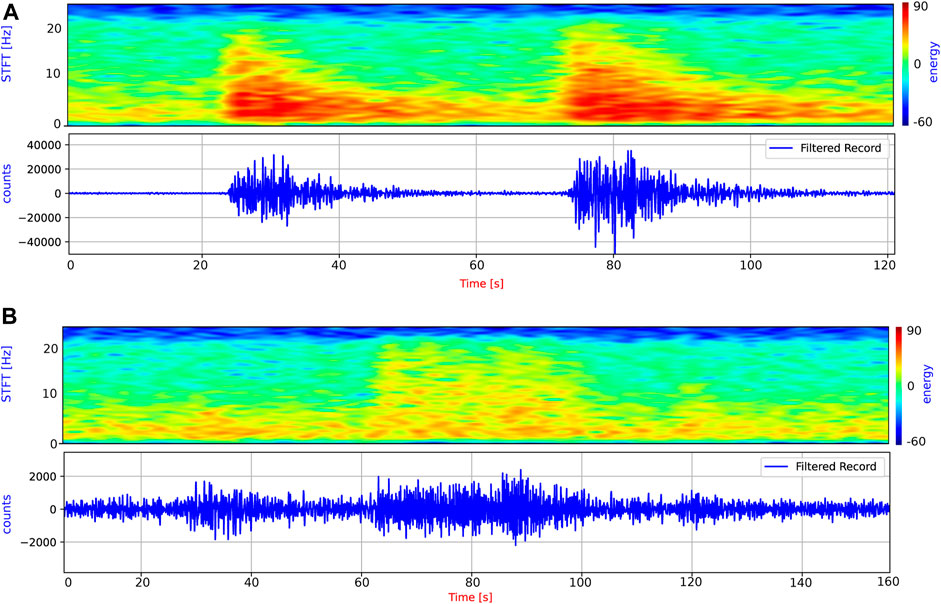
FIGURE 12. Recognition analysis before and after re-training of the temporal convolutional network (TCN). Before re-training, the system labeled seismic traces partially matching with volcano tectonic (VT) earthquakes as VTs with high probability; low probability events were marked as ‘undefined’. After re-training, all seismic traces having high frequencies and variable length were detected as VTs; however, only clear VT earthquakes were detected with high probability. (A) Example of a high probability VT earthquake (99%) detected before retraining, in which several earthquakes occurring closely together in a short timeframe have been classified as a single event following the volcanic dynamics to the master catalog. Since the system does not detect background noise windows between the two earthquakes due to the multi-resolution dilated skip connections between layers, it labels the two earthquakes as one. (B) Example of a low probability (70%) VT earthquake detected after re-training. With the purpose of enhancing visualization, the raw seismic signals were subjected to a filtering process, limiting the frequency range between 1 and 20 Hz.
In summary, before re-training, the system labeled seismic traces partially matching with earthquakes as high probability VTs, while low probability events were labeled as ‘undefined’. After re-training, all seismic traces with high frequencies and variable length were detected as VTs, decreasing the number of undefined events. However, only clear VTs were detected with high probability. Figure 12B shows an example of a detected low probability (70%) VT. Before re-training, this seismic trace was labeled as ‘undefined’ with a high probability of assignment to VT (
However, in some time slots, STA/LTA detected a greater number of events. These results may be explained by the nature of the STA/LTA algorithm, its trigger parameter settings, and the grammar imposed on the proposed models, which was responsible for improving the interpretability of the models based on geophysical knowledge of the volcano (Titos et al., 2018).
Since there was no previous information related to the seismic catalog, the STA/LTA triggering thresholds were fixed so that the system was more sensitive than specific. The goal was to obtain as much information as possible, and all energy changes, even small ones, were detected. This scenario resulted in a tolerable number of false triggers. In contrast, the RNN–LSTM (and TCN) system imposed the use of grammar (a set of rules) based on geophysical knowledge of Deception Island volcano to improve interpretability. The average duration of seismic events belonging to the master dataset (Deception Island) in combination with the per-class probabilities output by the models in the new volcanic environment allowed us to check that the predictions were consistent with the expected lengths of events. Since no information was provided on the average duration of the seismic-volcanic events of the new volcanic environment, the grammar only recognized those events that, on average, had durations that were greater than or similar to those described in the master dataset. Events whose durations were less than the average duration of events in the master database, even if recognized with high per-class probabilities, were labeled as background noise or unknown events.
For the time slots in which STA/LTA detected a greater number of VT events compared with RNN–LSTM, many of the events recognized by the STA/LTA model corresponded to short duration energy changes (Figure 13). In contrast, the RNN–LSTM model discarded these events (i.e., labeled them as background noise when the output VT per-class probabilities were low and as unknown events when the output per-class probabilities were high) since the durations were shorter than the average duration of VT earthquakes at Deception Island.
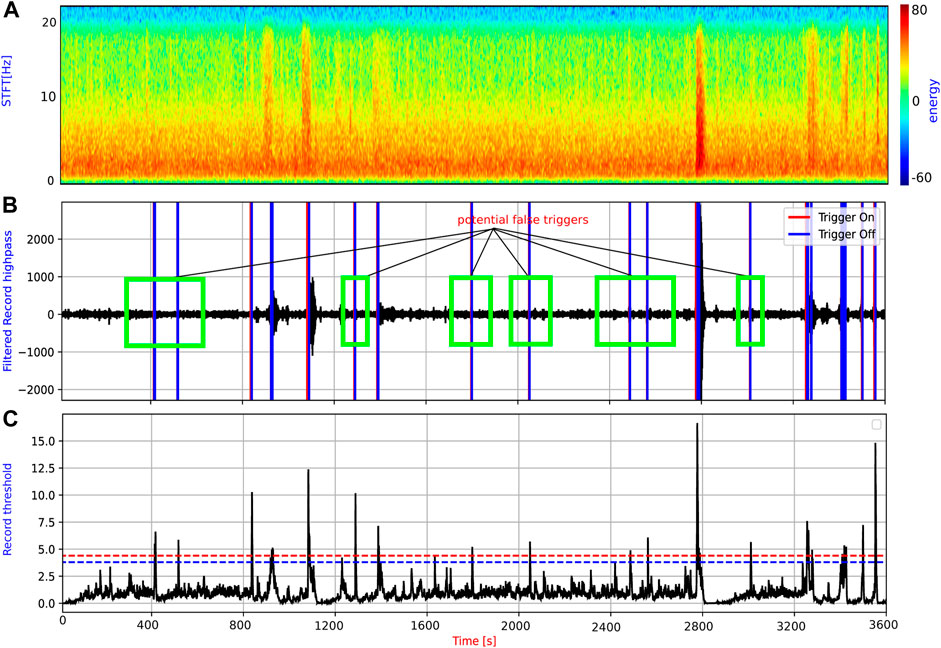
FIGURE 13. Potential false triggers corresponding to short duration energy changes recognized by the short time average over long time-average (STA/LTA) model. (A) Spectrogram of the seismic signal selected. (B) High pass filtered seismogram. (C) short time average over long time-average (STA/LTA) triggering results. Owing to lack of prior knowledge, the recurrent neural network based on long short-term memory cells (RNN–LSTM) model discounted these events as volcano tectonic (VT) earthquakes, since the duration was shorter than the average duration of VT earthquakes in the Deception Island catalog. With the purpose of enhancing visualization, the raw seismic signals were subjected to a filtering process, limiting the frequency range between 1 and 20 Hz.
For the time slots in which STA/LTA detected a lower number of VT events compared with the re-trained RNN–LSTM, a possible explanation is the behavior of the STA/LTA algorithm in a seismic swarm state. Seismic swarms, which are a common volcanic phenomenon, involve a sequence of seismic events that occur within a relatively short period of time within a very local area. Given that the STA/LTA algorithm computes an average absolute amplitude of the seismic signal in two consecutive moving-time windows, when a low energy event occurs immediately after a high energy event, the averaging process masks the occurrence of the least energetic one, decreasing the number of recognized events (Figure 14). In contrast, as the RNN–LSTM analyzes signals based on spectral features, it has the ability to analyze a concatenated occurrence of events, such as that observed during a seismic swarm.
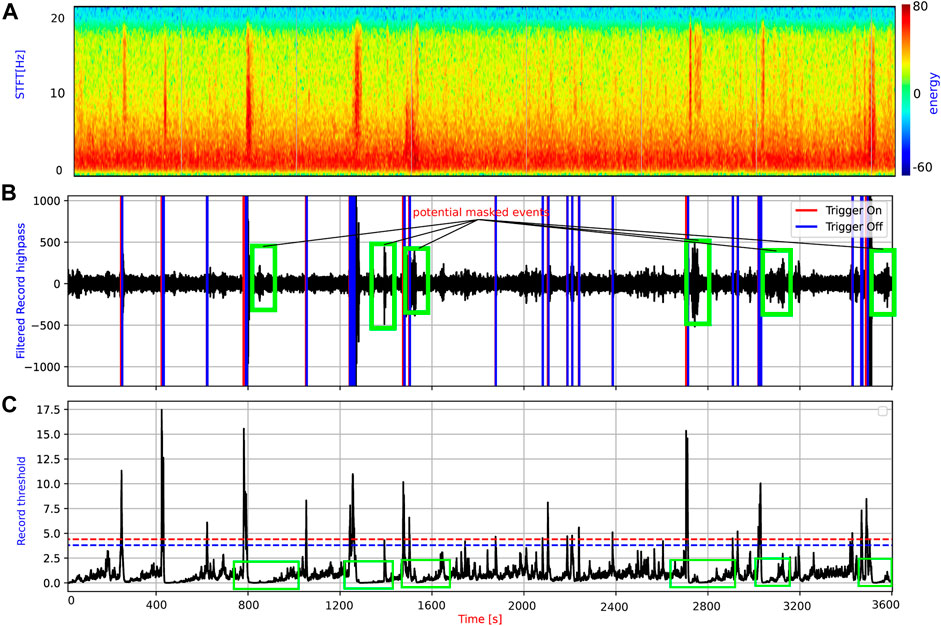
FIGURE 14. Potential masked events, for which the short time average over long time-average (STA/LTA) algorithm computed the average absolute amplitude of a seismic signal from two consecutive moving-time windows containing a low energy event immediately following a very high energy event. The average energy masks the occurrence of the low energy event, decreasing the number of recognized events. (A) Spectrogram of the seismic signal selected. (B) High pass filtered seismogram. (C) short time average over long time-average (STA/LTA) triggering results. With the purpose of enhancing visualization, the raw seismic signals were subjected to a filtering process, limiting the frequency range between 1 and 20 Hz.
Based on our results, once it has been re-trained and the average duration of the seismic-volcanic events has been fixed, our RNN–LSTM has a number of advantages over STA/LTA. In particular, the system will automatically detect VTs present in the seismic trace without searching for optimal parameter settings, which makes it a portable, scalable, and economical tool with relatively low computational cost. Another important advantage is that, besides obtaining a preliminary seismic catalog (composed of several types of events), it offers information on the confidence of the recognition. Importantly, for multi-station seismic networks, these probabilities will serve to obtain more reliable seismic catalogs. The recognition of an event characterized by high frequencies at one station provides an indisputable condition to obtain a reliable label at another station where the event has been attenuated or is virtually unrecognizable. An example of this scenario is shown in Figure 15, in which one earthquake is included in the new seismic catalog by both techniques (STA/LTA and RNN-LSTM), while an attenuated one, in addition to presenting difficulty during detection using classical techniques owing to threshold adjustment, could only be considered as an earthquake using our multi-station analysis. Finally, our approach provides a very useful tentative label for subsequent analysis carried out by a human operator.
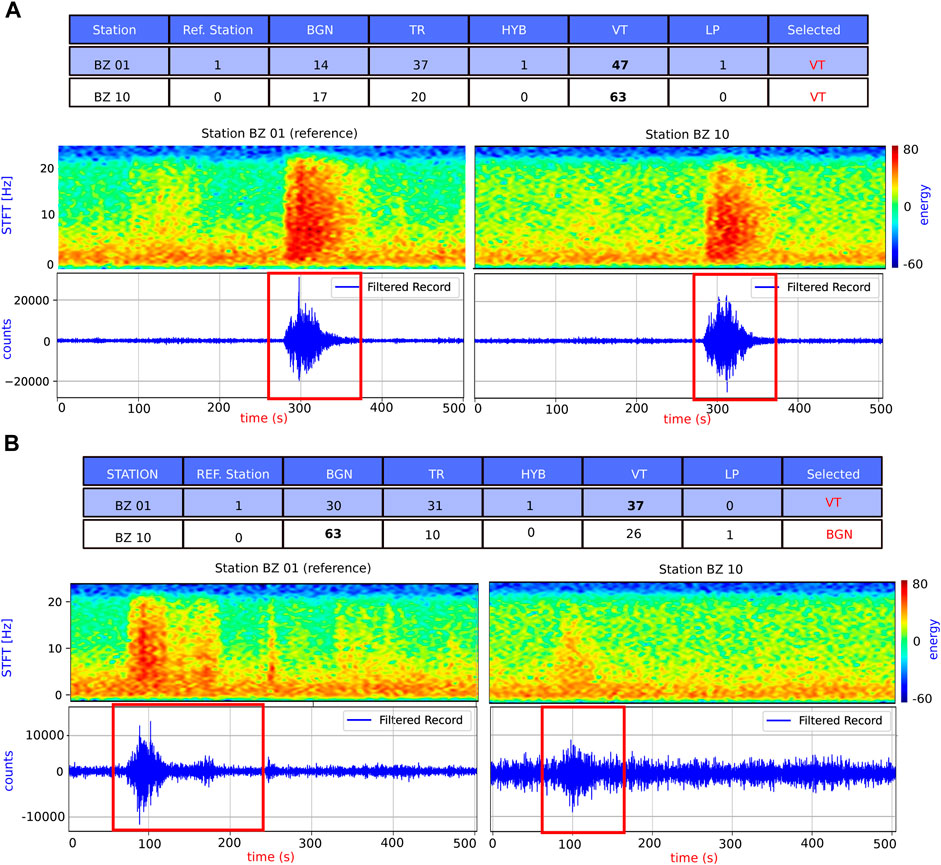
FIGURE 15. Robustness of the obtained seismic catalogs based on per-class probabilities output by the models. (A) Example of an earthquake recognized as a volcano tectonic (VT) earthquake with relatively high probability from at least two different seismic stations. (B) Example of an attenuated earthquake recognized as a VT, noise, or undefined event depending on the seismic station. With the purpose of enhancing visualization, the raw seismic signals were subjected to a filtering process, limiting the frequency range between 1 and 20 Hz.
This study provides a comprehensive analysis of how to build a multi-station seismo-volcanic monitoring system based on transfer learning techniques. We evaluated the ability of several operational systems trained using a master seismic catalogue (from Deception Island volcano) to adapt to a new volcanic environment (Bezymianny volcano), without prior domain-specific knowledge.
Our results are significant in at least two major respects. First, transfer learning is shown to offer a robust, effective, and rapid alternative when developing volcano-seismic event monitoring systems in volcanic environments without any previous knowledge or seismic catalogue. Second, depending on the architecture used as a baseline, the final behavior of the system (and consequently the results obtained) can be different. We found that RNN-based systems offer the most reliable recognition by excluding low confidence detections for seismic traces that are only partially similar to those of the baseline. In contrast, TCN-based networks are capable of detecting a greater number of events; however, many of those events are only partially similar to the master events of the baseline (i.e., the confidence of detections is low). Considering these findings and drawing upon our experience as a guiding factor, we can firmly conclude that among the overall count of events identified as earthquakes, those exhibiting a membership probability surpassing 80% after retraining, can be considered accurately classified. Together, these two approaches offer complementary tools for volcano monitoring, and volcanological observatories should choose the approach that best meets their needs; that is, RNN–LSTM for fine-grained seismic catalogs and TCN for coarse-grained seismic catalogs.
Finally, our study provides a basis for more sophisticated weakly supervised models that could be useful in developing universal monitoring tools able to work accurately across different volcanic systems, even when faced with scenarios without prior domain-specific knowledge.
Publicly available datasets were analyzed in this study. This data can be found here: The datasets analyzed for this study can be found online at ZENODO (https://doi.org/10.5281/zenodo.7755506). The open source code developed in this work can be downloaded at Github (https://github.com/mmtitos/Multi-station-volcano-tectonic-earthquakes-monitoring-based-on-transfer-learning.git).
Conceptualization: MT, CB, JI. Methodology: MT, CB, LG, PR, JI. Software: MT, LG, CB. Writing—original draft: MT, CB, JI. Writing—review and editing: MT, CB. Funding: CB, JI. All authors contributed to the article and approved the submitted version.
This study was partially supported by the Spanish FEMALE (PID 2019-106260GB-I00) and PROOF-FOREVER (EUR2022.134044) projects. This work has been partially supported by the project EUR 2022-134044 founded by MCIN/AEI/10.13039/501100011033 in the framework PROYECTOS “EUROPA EXCELENCIA” 2022, CORRESPONDIENTES AL PROGRAMA ESTATAL PARA AFRONTAR LAS PRIORIDADES DE NUESTRO ENTORNO, SUBPROGRAMA ESTATAL DE INTERNACIONALIZACIÓN, DEL PLAN ESTATAL DE INVESTIGACIÓN CIENTÍFICA, TÉCNICA Y DE INNOVACIÓN PARA EL PERIODO 2021-2023, EN EL MARCO DEL PLAN DE RECUPERACIÓN TRANSFORMACIÓN Y RESILIENCIAthe. English language editing was performed by Tornillo Scientific.
The authors declare that the research was conducted in the absence of any commercial or financial relationships that could be construed as a potential conflict of interest.
The author CB declared that they were an editorial board member of Frontiers, at the time of submission. This had no impact on the peer review process and the final decision.
All claims expressed in this article are solely those of the authors and do not necessarily represent those of their affiliated organizations, or those of the publisher, the editors and the reviewers. Any product that may be evaluated in this article, or claim that may be made by its manufacturer, is not guaranteed or endorsed by the publisher.
Abacha, I., Bendjama, H., Boulahia, O., Yelles-Chaouche, A., Roubeche, K., Rahmani, S. T.-E., et al. (2023). Fluid-driven processes triggering the 2010 beni-ilmane earthquake sequence (Algeria): Evidence from local earthquake tomography and 4d vp/vs models. J. Seismol. 27, 77–94. doi:10.1007/s10950-022-10130-8
Anantrasirichai, N., Biggs, J., Albino, F., Hill, P., and Bull, D. (2018). Application of machine learning to classification of volcanic deformation in routinely generated insar data. J. Geophys. Res. Solid Earth 123, 6592–6606. doi:10.1029/2018jb015911
Barsotti, S., Oddsson, B., Gudmundsson, M., Pfeffer, M., Parks, M., Ófeigsson, B., et al. (2020). Operational response and hazards assessment during the 2014–2015 volcanic crisis at bárðarbunga volcano and associated eruption at holuhraun, Iceland. J. Volcanol. Geotherm. Res. 390, 106753. doi:10.1016/j.jvolgeores.2019.106753
Barsotti, S., Parks, M. M., Pfeffer, M. A., Óladóttir, B. A., Barnie, T., Titos, M. M., et al. (2023). The eruption in fagradalsfjall (2021, Iceland): How the operational monitoring and the volcanic hazard assessment contributed to its safe access. Nat. Hazards 116, 3063–3092. doi:10.1007/s11069-022-05798-7
Bueno, A., Benitez, C., De Angelis, S., Moreno, A. D., and Ibanez, J. M. (2019). Volcano-seismic transfer learning and uncertainty quantification with bayesian neural networks. IEEE Trans. Geoscience Remote Sens. 58, 892–902. doi:10.1109/tgrs.2019.2941494
Bueno, A., Titos, M., Benítez, C., and Ibáñez, J. M. (2021). Continuous active learning for seismo-volcanic monitoring. IEEE Geoscience Remote Sens. Lett. 19, 1–5. doi:10.1109/lgrs.2021.3121611
Castro-Melgar, I., Prudencio, J., Del Pezzo, E., Giampiccolo, E., and Ibanez, J. M. (2021). Shallow magma storage beneath mt. etna: Evidence from new attenuation tomography and existing velocity models. J. Geophys. Res. Solid Earth 126, e2021JB022094. doi:10.1029/2021JB022094
Chouet, B. A., and Matoza, R. S. (2013). A multi-decadal view of seismic methods for detecting precursors of magma movement and eruption. J. Volcanol. Geotherm. Res. 252, 108–175. doi:10.1016/j.jvolgeores.2012.11.013
Cubuk-Sabuncu, Y., Jónsdóttir, K., Caudron, C., Lecocq, T., Parks, M. M., Geirsson, H., et al. (2021). Temporal seismic velocity changes during the 2020 rapid inflation at mt. Þorbjörn-svartsengi, Iceland, using seismic ambient noise. Geophys. Res. Lett. 48, e2020GL092265. doi:10.1029/2020gl092265
D’Auria, L., Koulakov, I., Prudencio, J., Cabrera-Pérez, I., Ibáñez, J. M., Barrancos, J., et al. (2022). Rapid magma ascent beneath la palma revealed by seismic tomography. Sci. Rep. 12, 17654. doi:10.1038/s41598-022-21818-9
Díaz-Moreno, A., Ibáñez, J., De Angelis, S., García-Yeguas, A., Prudencio, J., Morales, J., et al. (2015). Seismic hydraulic fracture migration originated by successive deep magma pulses: The 2011–2013 seismic series associated to the volcanic activity of el hierro island. J. Geophys. Res. Solid Earth 120, 7749–7770. doi:10.1002/2015jb012249
Girina, O., Loupian, E., Melnikov, D., Manevich, A., Sorokin, A., Kramareva, L., et al. (2018). Bezymianny volcano eruption on december 20, 2017. Mod. Probl. Remote Sens. Earth Space 15, 88–99. doi:10.21046/2070-7401-2018-15-3-88-99
Ibáñez, J. M., Pezzo, E. D., Almendros, J., La Rocca, M., Alguacil, G., Ortiz, R., et al. (2000). Seismovolcanic signals at deception island volcano, Antarctica: Wave field analysis and source modeling. J. Geophys. Res. Solid Earth 105, 13905–13931. doi:10.1029/2000jb900013
Jozinović, D., Lomax, A., Štajduhar, I., and Michelini, A. (2022). Transfer learning: Improving neural network based prediction of earthquake ground shaking for an area with insufficient training data. Geophys. J. Int. 229, 704–718. doi:10.1093/gji/ggab488
Koulakov, I., Plechov, P., Mania, R., Walter, T. R., Smirnov, S. Z., Abkadyrov, I., et al. (2021). Anatomy of the bezymianny volcano merely before an explosive eruption on 20 12 2017. Sci. Rep. 11, 1–12. doi:10.1038/s41598-021-81498-9
Lapins, S., Goitom, B., Kendall, J.-M., Werner, M. J., Cashman, K. V., and Hammond, J. O. (2021). A little data goes a long way: Automating seismic phase arrival picking at nabro volcano with transfer learning. J. Geophys. Res. Solid Earth 126, e2021JB021910. doi:10.1029/2021jb021910
Lea, C., Vidal, R., Reiter, A., and Hager, G. D. (2016). “Temporal convolutional networks: A unified approach to action segmentation,” in Computer vision–ECCV 2016 workshops (Amsterdam, Netherlands: Springer), 47–54. October 8-10 and 15-16, 2016, Proceedings, Part III 14.
LeCun, Y., Bengio, Y., and Hinton, G. (2015). Deep learning. nature 521, 436–444. doi:10.1038/nature14539
Machacca, R., Lesage, P., Tavera, H., Pesicek, J., Caudron, C., Torres, J., et al. (2023). The 2013–2020 seismic activity at sabancaya volcano (Peru): Long lasting unrest and eruption. J. Volcanol. Geotherm. Res. 435, 107767. doi:10.1016/j.jvolgeores.2023.107767
McGimsey, R. G., Neal, C. A., Girina, O. A., Chibisova, M., and Rybin, A. V. (2014). 2009 volcanic activity in Alaska, kamchatka, and the kurile islands—summary of events and response of the Alaska volcano observatory.
McNutt, S. R., and Roman, D. C. (2015). “Volcanic seismicity,” in The encyclopedia of volcanoes (Elsevier), 1011–1034.
McNutt, S. R., Thompson, G., Johnson, J., De Angelis, S., and Fee, D. (2015). “Seismic and infrasonic monitoring,” in The encyclopedia of volcanoes (Elsevier), 1071–1099.
Nair, N., Thomas, C., and Jayagopi, D. B. (2018). “Human activity recognition using temporal convolutional network,” in Proceedings of the 5th international workshop on sensor-based activity recognition and interaction (New York, NY, USA: Association for Computing Machinery). iWOAR ’18. doi:10.1145/3266157.3266221
Neal, C., Girina, O., Senyukov, S., Rybin, A., Osiensky, J., Izbekov, P., et al. (2009). Russian eruption warning systems for aviation. Nat. hazards 51, 245–262. doi:10.1007/s11069-009-9347-6
Prudencio, J., Ibánez, J. M., García-Yeguas, A., Del Pezzo, E., and Posadas, A. M. (2013). Spatial distribution of intrinsic and scattering seismic attenuation in active volcanic islands–ii: Deception island images. Geophys. J. Int. 195, 1957–1969. doi:10.1093/gji/ggt360
Račič, M., Oštir, K., Peressutti, D., Zupanc, A., and Čehovin Zajc, L. (2020). “Application of temporal convolutional neural network for the classification of crops on sentinel-2 time series,” in Isprs - international Archives of the photogrammetry, remote Sensing and spatial information sciences XLIII-B2-2020, 1337–1342. doi:10.5194/isprs-archives-XLIII-B2-2020-1337-2020
Roman, D. C., and Cashman, K. V. (2006). The origin of volcano-tectonic earthquake swarms. Geology 34, 457–460. doi:10.1130/g22269.1
Sigmundsson, F., Parks, M., Pedersen, R., Jónsdóttir, K., Ófeigsson, B. G., Grapenthin, R., et al. (2018). “Magma movements in volcanic plumbing systems and their associated ground deformation and seismic patterns,” in Volcanic and igneous plumbing systems (Elsevier), 285–322.
Sigmundsson, F., Parks, M., Hooper, A., Geirsson, H., Vogfjörd, K. S., Drouin, V., et al. (2022). Deformation and seismicity decline before the 2021 fagradalsfjall eruption. Nature 609, 523–528. doi:10.1038/s41586-022-05083-4
Sparks, R., Biggs, J., and Neuberg, J. (2012). Monitoring volcanoes. Science 335, 1310–1311. doi:10.1126/science.1219485
Titos, M., Bueno, A., García, L., Benítez, M. C., and Ibañez, J. (2018). Detection and classification of continuous volcano-seismic signals with recurrent neural networks. IEEE Trans. Geoscience Remote Sens. 57, 1936–1948. doi:10.1109/tgrs.2018.2870202
Titos, M., Bueno, A., García, L., Benitez, C., and Segura, J. C. (2019). Classification of isolated volcano-seismic events based on inductive transfer learning. IEEE Geoscience Remote Sens. Lett. 17, 869–873. doi:10.1109/lgrs.2019.2931063
Titos, M., García, L., Kowsari, M., and Benítez, C. (2022). Toward knowledge extraction in classification of volcano-seismic events: Visualizing hidden states in recurrent neural networks. IEEE J. Sel. Top. Appl. Earth Observations Remote Sens. 15, 2311–2325. doi:10.1109/jstars.2022.3155967
Trnkoczy, A. (2009). “Understanding and parameter setting of sta/lta trigger algorithm,” in New manual of seismological observatory practice (NMSOP) (Deutsches GeoForschungsZentrum GFZ), 1–20.
Van Manen, S., Dehn, J., and Blake, S. (2010). Satellite thermal observations of the bezymianny lava dome 1993–2008: Precursory activity, large explosions, and dome growth. J. Geophys. Res. Solid Earth 115, B08205. doi:10.1029/2009jb006966
Weiss, K., Khoshgoftaar, T. M., and Wang, D. (2016). A survey of transfer learning. J. Big data 3, 9–40. doi:10.1186/s40537-016-0043-6
Keywords: automatic volcanic monitoring, real-time monitoring, artificial intelligence, transfer learning, recurrent neural networks, temporal convolutional networks
Citation: Titos M, Gutiérrez L, Benítez C, Rey Devesa P, Koulakov I and Ibáñez JM (2023) Multi-station volcano tectonic earthquake monitoring based on transfer learning. Front. Earth Sci. 11:1204832. doi: 10.3389/feart.2023.1204832
Received: 12 April 2023; Accepted: 20 July 2023;
Published: 03 August 2023.
Edited by:
Georg Rümpker, Goethe University Frankfurt, GermanyReviewed by:
Matthew Haney, Alaska Volcano Observatory (AVO), United StatesCopyright © 2023 Titos, Gutiérrez, Benítez, Rey Devesa, Koulakov and Ibáñez. This is an open-access article distributed under the terms of the Creative Commons Attribution License (CC BY). The use, distribution or reproduction in other forums is permitted, provided the original author(s) and the copyright owner(s) are credited and that the original publication in this journal is cited, in accordance with accepted academic practice. No use, distribution or reproduction is permitted which does not comply with these terms.
*Correspondence: Manuel Titos, bW10aXRvc0B1Z3IuZXM=
Disclaimer: All claims expressed in this article are solely those of the authors and do not necessarily represent those of their affiliated organizations, or those of the publisher, the editors and the reviewers. Any product that may be evaluated in this article or claim that may be made by its manufacturer is not guaranteed or endorsed by the publisher.
Research integrity at Frontiers

Learn more about the work of our research integrity team to safeguard the quality of each article we publish.