 Fuying Zhu
 Jian Yang2,3
95% of researchers rate our articles as excellent or good
Learn more about the work of our research integrity team to safeguard the quality of each article we publish.
Find out more
ORIGINAL RESEARCH article
Front. Earth Sci. , 11 April 2023
Sec. Environmental Informatics and Remote Sensing
Volume 11 - 2023 | https://doi.org/10.3389/feart.2023.1095754
This article is part of the Research Topic Near-Earth Electromagnetic Environment and Natural Hazards Disturbances: Volume II View all 5 articles
The global ionosphere map (GIM) total electron content (TEC) data are extensively employed to statistically study the seismic ionospheric disturbance characteristics. Due to the limitation of spatial coverage of ground-based GNSS receivers, in many regions, the GIM TEC results are obtained by interpolation or extrapolation, and therefore the actual accuracy is different. In this paper, based on the CMONOC GNSS data, a high-precision regional ionospheric map (RIM) model over China is established, and the assessment and analysis of the post-processed IGS GIM over China are conducted. Statistical results show that the average RMS of IGS GIM over China is less than 2 TECu. The comparison of the TEC values calculated by the GIM with the RIM shows that the two models give similar results. The Bias and STD of the difference over most of China is less than 2 TECu except in some low latitude areas. Meanwhile, the correlation between GIM and RIM is better in the daytime than at night, and it is not affected by space electromagnetic disturbance. The assessment results of accuracy in this paper are only applicable to the China region, and the accuracy of other regions needs to be further assessed.
The Global Navigation Satellite System (GNSS) has been used as a valuable tool to monitor and estimate ionospheric total electron contents (TECs) (Sardon et al., 1994; Mannucci et al., 1998; Jin et al., 2004; Davies et al., 2016). And analyze the response of the ionospheric to seismic activity (Fujiwara et al., 2004; Liu et al., 2004; Pulinets et al., 2004; Afraimovich et al., 2008; Liu et al., 2009; Zhao et al., 2010; Heki, 2011; Jin et al., 2015). Since 1998, the International GNSS Service (IGS) has established the Ionosphere Working Group (IWG) (Schaer et al., 1999; Hernández-Pajares et al., 2009) to calculate and model the global ionospheric VTEC data through the data of global satellite observation stations and release the Global Ionosphere Map (GIM) to global users. The IGS GIM, as an important part of GNSS precision products released by IGS, plays an important role in space physics research and satellite navigation applications. In recent years, the IGS GIM become a superset of data to study seismic ionospheric TEC disturbances and a large number of researchers utilize the IGS GIM to conduct studies on ionospheric spatiotemporal variation or earthquake-related ionospheric disturbances (Guo et al., 2005; Le et al., 2011; Zhao et al., 2016; Thomas et al., 2017; Zhu et al., 2018). The analysis of seismic ionospheric disturbance provided a new breakthrough for the study of earthquake monitoring and prediction (Pulinets et al., 2004; Jin et al., 2015).
China is considered to be one of the countries with the most seismic activities and a dense and continuous GNSS network, the China Crustal Movement Observation Network (CMONOC), has been established, which provides a good condition for the study of ionospheric in China (Cai et al., 2014; Zhe et al., 2017). Considering sharing, coverage, and continuity of the IGS GIMs, the GIMs have been widely used in a large number of seismic studies. The global ionospheric grid products are released by IGS through ftp://ccids.gsfc.nas.gov/gnss/products/ionex/ and modeled based on IGS GNSS data, its accuracy depends on the proximity of available GNSS tracking receivers. In addition, some factors such as magnetic storms, solar activities, and local time can also influence the accuracy to a certain extent (Afraimovich and Astafyeva, 2008; Liu et al., 2017). The overall accuracy of the GIM is ∼2–8 TECu (1 TECu=1016 el/m2) (Hernández-Pajares et al., 2009; Roma-Dollase et al., 2018). For the China region, only 3 IGS stations are used and most of the TEC map over China is based on interpolation or extrapolation. Although the GIM offered by different Ionosphere Associate Analysis Centers (IAAC) was frequently assessed and analyzed by some scientists (Lanyi et al., 1988; Xiang et al., 2015; Li et al., 2017; Roma-Dollase et al., 2018; Chen et al., 2019; Zhang and Zhao, 2019; Zhang et al., 2022), and recently a study on accuracy evaluation of global VTEC maps using a simulation technique was conducted (Lin et al., 2022). However, most of the previous studies have focused on accuracy analysis and comparison of different ionospheric models or products from different research institutions worldwide, the actual accuracy of GIM over China region is still not statistically analyzed.
In this paper, in order to examine the actual accuracy of the IGS GIMs over China, we first established high-precision regional ionospheric maps (RIMs) over the China region, and then conducted the assessment and analysis study by investigating and comparing the IGS GIMs with RIMs. In addition, we also evaluated their correlation them during geomagnetic disturbances.
In this paper, the GNSS data used to calculate TEC over China was provided by the CMONOC, which includes more than 260 continuous GNSS stations and 3 IGS stations. The distribution of these GNSS stations is illustrated in Figure 1, the red pentacles denote the IGS stations. The GIMs are computed based on the IGS network where more than 2,000 ground-based GNSS receivers are distributed worldwide (Schaer et al., 1999; Hernández-Pajares et al., 2009). The IGS has ensured open access, high-quality GNSS data products since 1994 and the GIMs data can be retrieved from the IGS website through the link (https://igs.org/). There are twelve analysis centers that generate and deliver long-term GIMs. Different agencies may use different reference frames and techniques to estimate VTEC and differential code biases (DCB). After computation, three validation centers (JPL, ESA, and UPC) combine them into a common IGS GIM, which has a temporal resolution of 2 h and a spatial resolution of 5.0° × 2.5° in geographic longitude and geographic latitude. More details about the IGS GIM algorithm can be found in related papers (Feltens and Roth, 1998; Hernández-Pajares et al., 2009).
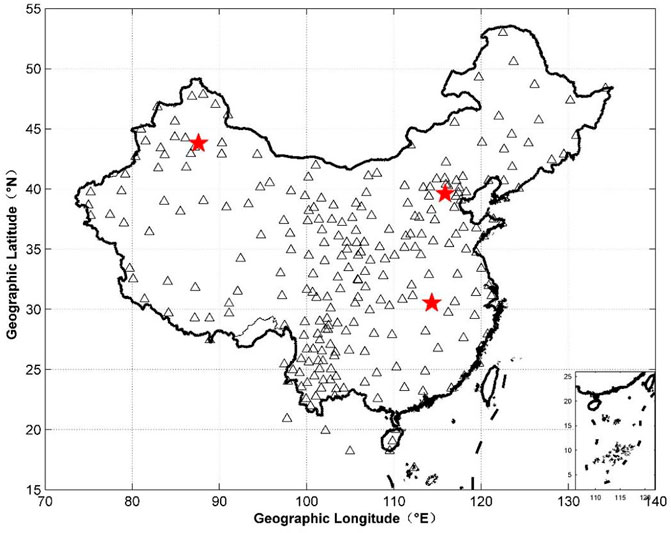
FIGURE 1. The distribution of 260 continuous GNSS stations (triangles) and 3 IGS GNSS stations (red pentacles) in China.
GNSS has been widely employed to monitor variations in the Earth’s ionosphere by estimating total electron content (TEC) using dual-frequency observations (Mannucci et al., 1998; Schaer, 1999; Jin et al., 2004; Davies and Hartmann, 2016). In this study, we first modeled the RIM VTEC two-dimensional ionospheric maps over the China area. The RIM model in China can be expressed by the Spherical Harmonics as:
Where
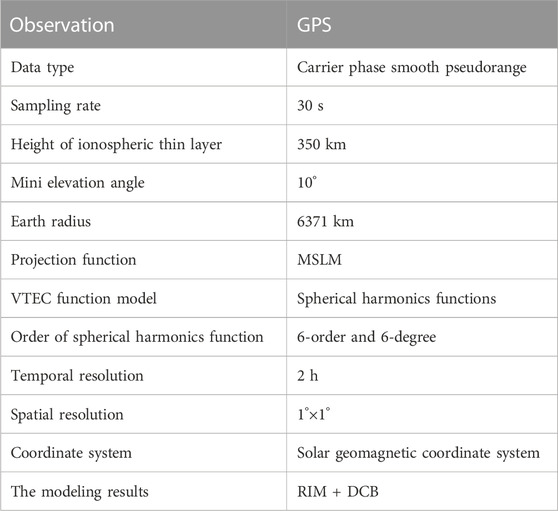
TABLE 1. RIM modeling parameter.
Based on the above parameter model, we obtained the ionospheric VTEC maps over the China region (15°–55°N, 70°–140°E), which have a 1 h temporal resolution and a spatial resolution of 1° × 1° in longitude and latitude. As an example, Figure 2 illustrates the spatial distribution of the TEC and RMS of the RIM at 0600 UT on 23 October 2021. It can be clearly seen that the ionospheric TEC RMS over China region is within 1 TECu, and its accuracy gradually decreases from the middle to the north and south sides, which should be related to the spatial distribution of GNSS stations. Especially in the northern border area, the worst accuracy is about 1.4TECu, which is consistent with previous research results (Zhang and Zhao, 2019). At the same time, we also compared the calculated GNSS DCB with the final results of IGS, and the results are shown in Figure 3. The mean value of the difference between them is 0.028 ns, and the maximum deviation is 0.5 ns, which verifies that the RIM model we have established is reliable.
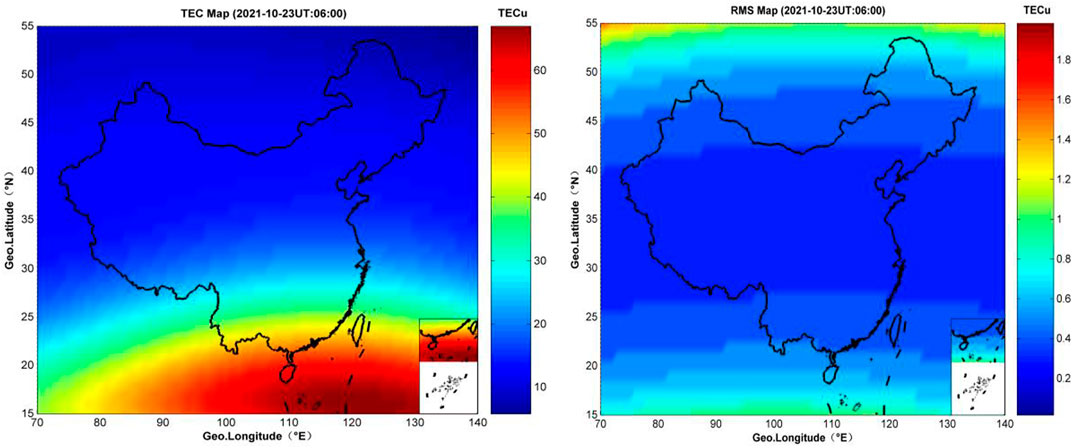
FIGURE 2. The spatial distribution of the TEC and RMS of the RIM (2021-10-23 UT0600), the x-axis and y-axis represent geographic longitude and latitude, respectively, and the color scale indicates the magnitude of TEC and RMS in TECu.
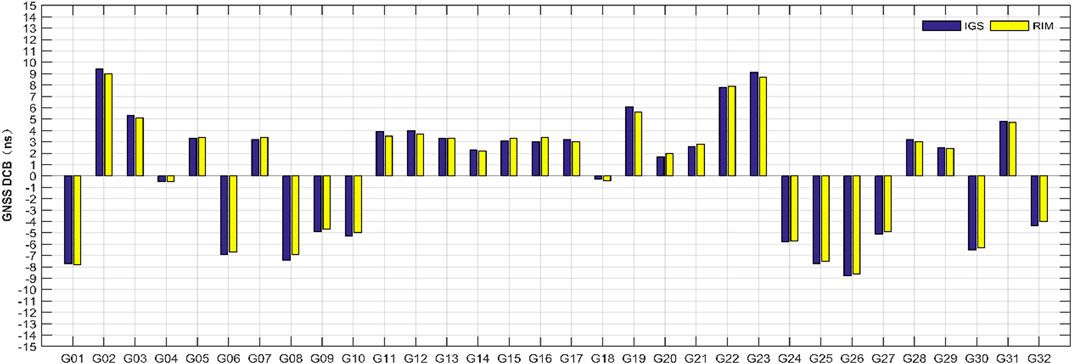
FIGURE 3. GPS satellite DCB values based on the RIM model and from IGS.
The observation period selected for accuracy assessment in this paper is from 1 September to 30 December 2021. Considering that the ionospheric TEC cannot define an accurate truth value, we consider the RIM results calculated based on the dense COMONOC data as a reference. When assessing the accuracy of GIM, it is generally necessary to check its internal coincidence accuracy and actual accuracy at the same time (Chen et al., 2019; Zhang and Zhao, 2019; Zhang et al., 2022). In order to clearly demonstrate the spatial-temporal distribution of the IGS GIM accuracy, we first statistically study the internal coincidence accuracy of GIM by calculating the root mean square (RMS) of the GIM over China, where RMS can be expressed as follows:
where N is the epoch number,
Firstly, we investigated the spatial-temporal characteristics of the GIM RMS over the China area. For the GIM, the RMS values can be obtained in the GIM files. The scope of our investigation is 15–50°N and 70–140°E. We utilize the RMS values of each grid point at different times from 1 September to 30 November 2021 and then calculate its average. Figure 4 shows the spatial distribution of the average RMS of the IGS GIM. It can be clearly seen that the spatial distribution of RMS values at different times is very similar. The RMS value of most areas is ∼2 TECu except for low latitude areas, which is consistent with the previously published conclusion (Zhang and Zhao, 2019). Larger RMS values occur in low-latitude areas outside China’s borders (See Figures 4A–L) and the RMS value in the surrounding area of the three IGS stations is relatively small, this is because the VTEC value of the area far from the IGS station is obtained based on interpolation or extrapolation, as the distance from the puncture point increases, its accuracy will inevitably decline.
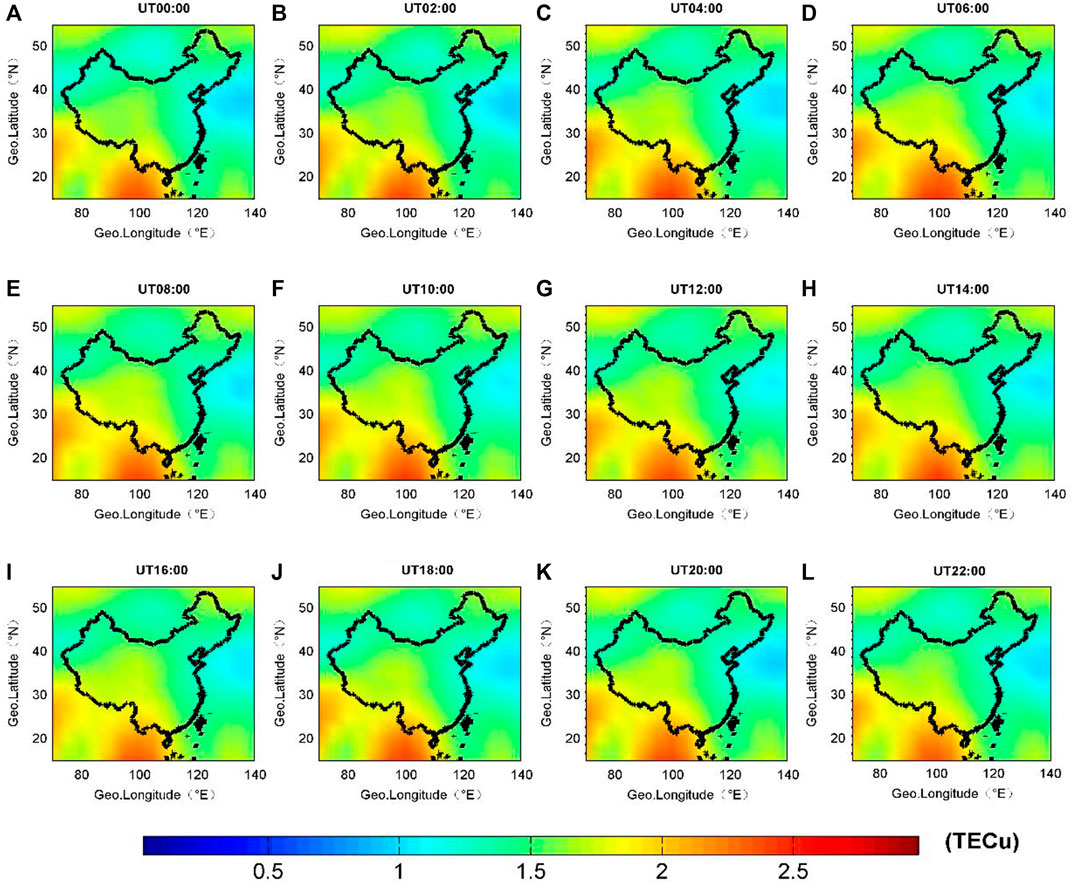
FIGURE 4. The spatial distribution of the RMS of the IGS GIM. In each panel, the x-axis and y-axis represent geographic longitude and latitude, respectively, and the color scale indicates the magnitude of TEC in TECu.
As we all know, RMS only represents the internal coincidence accuracy of the IGS GIM. In order to effectively assess the true accuracy, we compared IGS GIM with high-precision RIM, and statistically analyzed the average value of Bias at each grid point at each time, as shown in Figures 5A–L. The spatial distribution of ionospheric bias is similar to RMS. That is the average Bias value of most China areas is within 2.5TECu except for some areas. During the daytime, the maximum deviation of GIM appears in the low latitude area near the border of China, and it is distributed in bands (Figures 5C–G). At night, especially at UT1800-UT2000, the maximum bias of GIM appears around 55° N at the northernmost end (See Figures 5J, K), which is also in a zonal distribution.
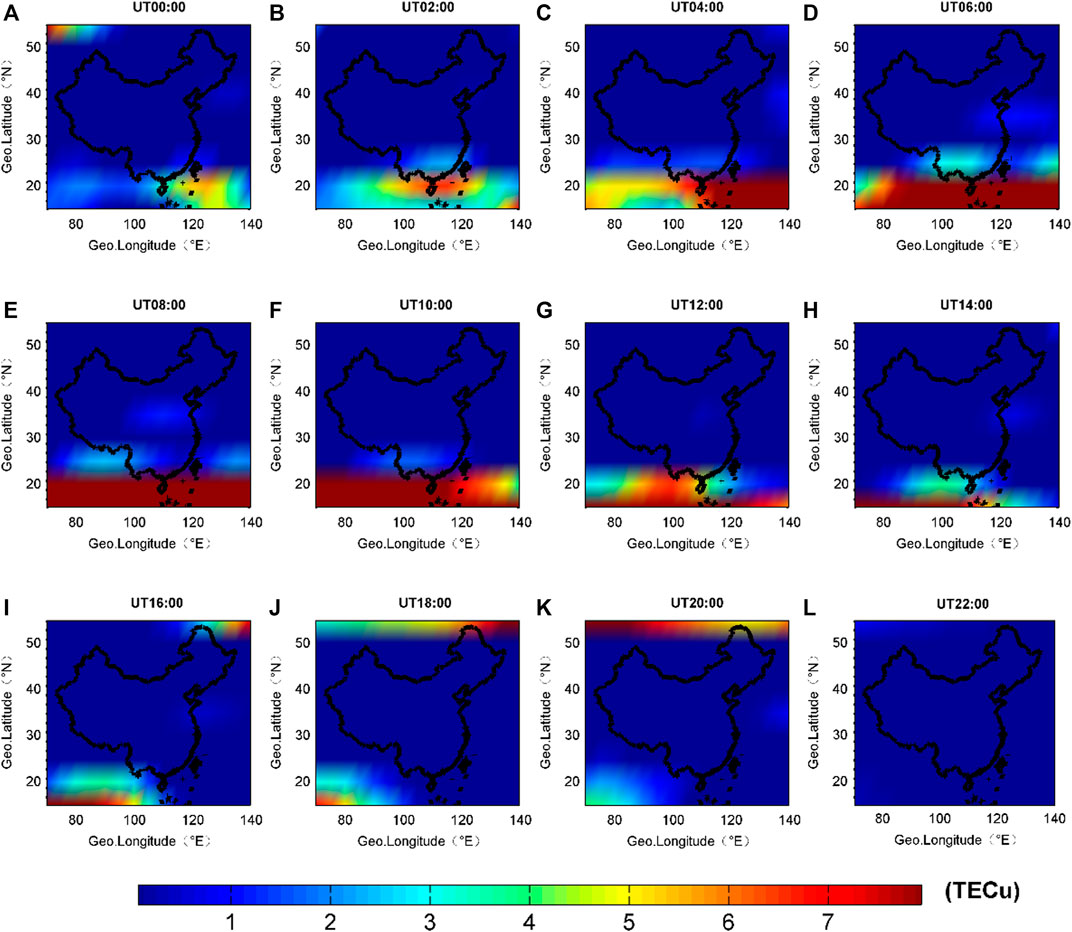
FIGURE 5. The spatial distribution average bias of the difference between IGS GIM and RIM, the x-axis and y-axis denote geographic longitude and geographic latitude, respectively. The color scale indicates the magnitude of TEC in TECu.
Figure 6 illustrates the spatial distribution of GIM STD compared with the RIM. From Figures 6A–L, one can see that the spatial distribution of the average STD is very similar to the spatial distribution characteristics of the average RMS, in other words, the GIM STD of the whole inland region of China is better than 2 TECu. However, the STD value is the largest outside the border region of China, especially in the low-latitude region (See Figures 6E–G). In view of this, the results of pre-seismic ionospheric disturbances found in low-latitude areas in previous studies may need further verification and discussion. Considering that there is almost no GPS observation in the low latitude area, the RIM accuracy of the solution will also be reduced. In addition, the ionospheric activity in the low latitude area is more active, so the accuracy in the low latitude area does not necessarily reflect the actual level of GIM. Therefore, the accuracy level of GIM over China’s interior in this paper is more practical.
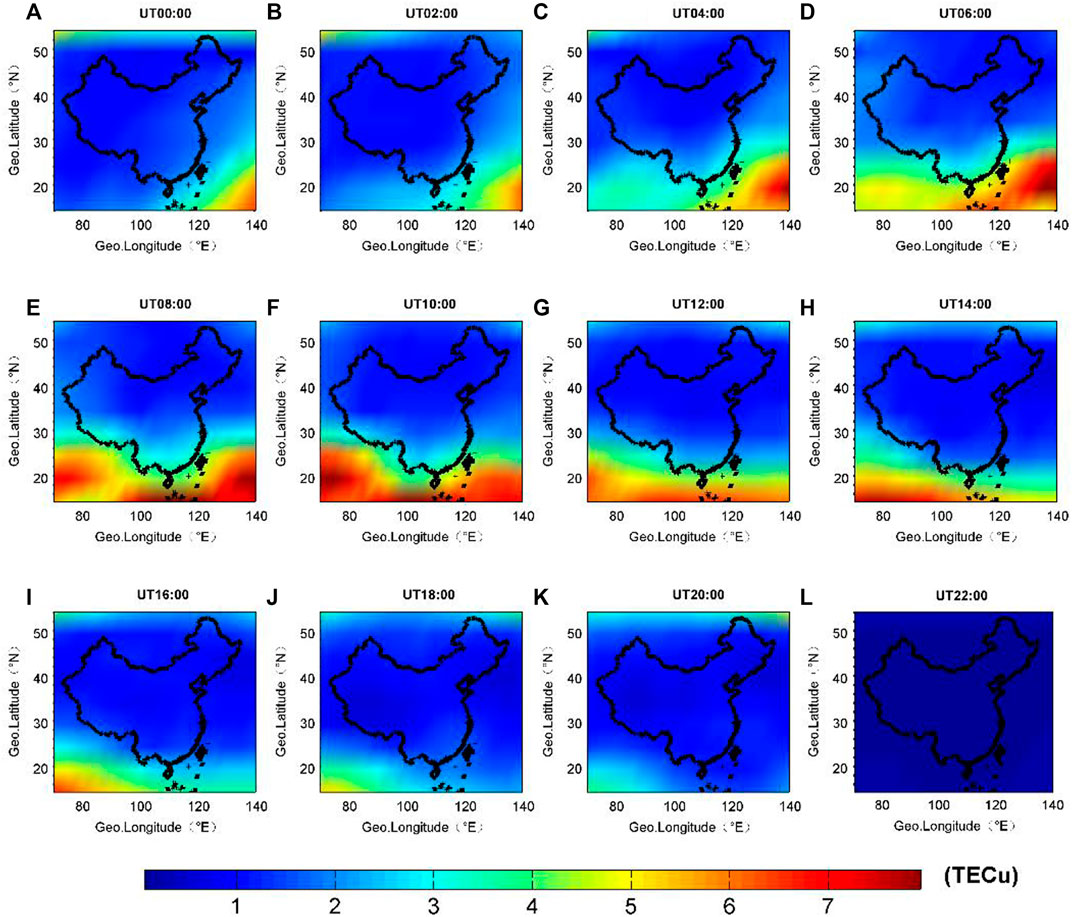
FIGURE 6. The spatial distribution of average STD of IGS GIM compared with RIM, the x-axis and y-axis denote geographic longitude and geographic latitude, respectively. The color scale indicates the magnitude of TEC in TECu.
Finally, in order to investigate whether the accuracy of the IGS GIMs is related to geomagnetic disturbances or not, we also investigated the distribution of correlation coefficients at several points during a geomagnetic disturbance in detail, the coordinates of these investigated five points are (110°E, 10°N), (110°E, 20°N), (110°E, 30°N), (110°E, 40°N), and (110°E, 50°N). It is well known that the accuracy of GIM varies with latitude: In this paper, we statistically investigate the mean value of the correlation coefficient of five points at different latitudes of daytime and nighttime, and finally, the time series of their correlation coefficients are statistically compared. Figure 7 gives the variations of the correlation coefficient and geomagnetic Dst, Kp index from 1 September to 30 November 2021. From Figure 7, we can clearly see that there were significant magnetic disturbances in the space environment on 18 September, 12 October, and 4 November. However, the correlation coefficient does not change significantly at the above time. This means that the accuracy level of GIM is independent of spatial electromagnetic disturbance. At the same time, we also found that the correlation between the GIM and RIM was significantly higher during the daytime than at nighttime.
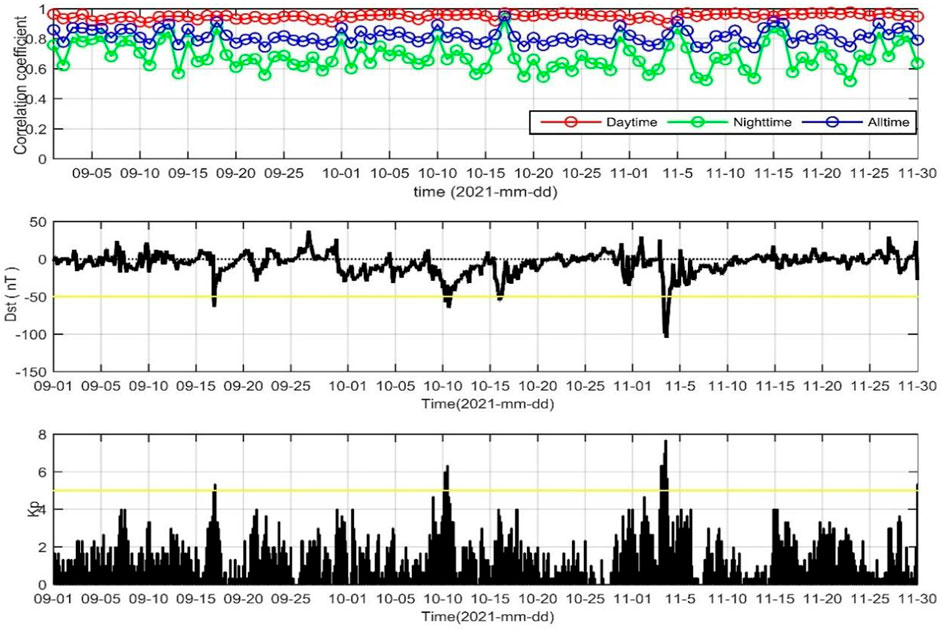
FIGURE 7. The variations of correlation coefficient and geomagnetic index Dst, Kp from 1 September to 30 November 2021.
Considering the IGS GIMs are interpolated in both space and time and the used GNSS receiver is very sparse in the China region, we checked and assessed the actual accuracy of the IGS GIM over the China region. With the increasing number of global GNSS continuous observation stations, the precision and reliability of IGS GIM are getting higher and higher. Although the IGS GIM calculation only uses three GNSS observation data in the China region, the GIM TEC results over China are generally reliable, but in some low latitude regions, the difference is relatively larger. That is because, on the one hand, the external low-latitude regions in China lack any observation data, and the accuracy of ionospheric RIM calculated in this area is not high. On the other hand, near the equator, the ionosphere changes are more responsible. If only the inland areas of China are investigated, the actual accuracy of GIM will be much higher. Therefore, we suggest that the accuracy level of GIM TEC may be further improved by adding more station observations to areas with sparse observation data.
This paper presents a statistical work to assess and analyze the IGS GIM over the China region. High-precision RIMs are calculated based on the dense COMONC GNSS observation and used as reference values. The major findings presented herein are summarized as follows: the accuracy of the IGS GIM over the China area is investigated and compared. The Bias and STD of the difference between the GIM and the RIM over China are less than 2 TECu except for some low latitude areas. Meanwhile, the correlation between GIM and RIM is better in the daytime than at night, and it is not affected by space electromagnetic disturbance. The results in this paper support the precision description given by IGS and verify the accuracy of GIM, which maybe have important reference significance for the application of GIMs over China.
This paper mainly only gives some statistical results about China regions which confirmed partly the actual accuracy of the IGS GIM, however, it does not represent the actual accuracy of other regions in the world. In order to better study the temporal and spatial variation characteristics of the ionosphere, it is necessary to conduct a more comprehensive and detailed assessment and analysis of the GIM in the future.
The dataset supporting the conclusion of this article will be made available by the authors upon request, without undue reservation.
FZ conceptualized the research, conducted analysis, and drafted the manuscript. JY processed the GNSS data, YQ contributed to language editing and gave valuable comments on the manuscript, and XL reviewed the manuscript. All authors read and critically reviewed the manuscript for publication.
This research work was partially supported by APSCO Earthquake Research Project Phase II: Integrating Satellite and Ground Observations for Earthquake Signatures and Precursors (WX0519502) and the National Key R&D Program of China (2018YFC1503502).
The GNSS data were provided by the CMONOC, Ap index and F107 index were taken from the National Geophysical Data Center Web site.
The authors declare that the research was conducted in the absence of any commercial or financial relationships that could be construed as a potential conflict of interest.
The reviewer YL declared a shared affiliation with the author FZ to the handling editor at the time of review.
All claims expressed in this article are solely those of the authors and do not necessarily represent those of their affiliated organizations, or those of the publisher, the editors and the reviewers. Any product that may be evaluated in this article, or claim that may be made by its manufacturer, is not guaranteed or endorsed by the publisher.
Afraimovich, E. L., and Astafyeva, E. I. (2008). TEC anomalies-local TEC changes prior to earthquakes or TEC response to solar and geomagnetic activity changes? Earth, Planets Space 60 (9), 961–966. doi:10.1186/bf03352851
Cai, H., Sun, H. R., and Li, Z. S. (2014). Real-time ionospheric TEC monitoring based on CMONOC and its application. Earthquake 34 (1), 41–48.
Chen, P., Liu, H., Ma, Y., and Zheng, N. (2019). Accuracy and consistency of different global ionospheric maps released by IGS ionosphere associate analysis centers. Adv. Space Res. 65 (1), 163–174. doi:10.1016/j.asr.2019.09.042
Davies, K., and Hartmann, G. K. (2016). Studying the ionosphere with the global positioning system. Radio Sci. 32 (4), 1695–1703. doi:10.1029/97rs00451
Feltens, J., and Schaer, S. (1998). “IGS products for the ionosphere, IGS position paper,” in Proceedings of the IGS analysis centers workshop (Darmstadt, Germany: ESOC), 9, 225–232.
Fujiwara, H., Kamogawa, M., Ikeda, M., Liu, J. Y., Sakata, H., Chen, Y. I., et al. (2004). Atmospheric anomalies observed during earthquake occurrences. Geophys. Res. Lett. 31 (17), L17110. doi:10.1029/2004gl019865
Guo, J, M., and Lin, H. (2005). Investigation of ionosphere TEC distribution in China region by GIM model. Geo Spatial Inf. Sci. 8 (3), 197–200. doi:10.1007/bf02826820
Heki, K. (2011). Ionospheric electron enhancement preceding the 2011 Tohoku-Oki earthquake. Geophys. Res. Lett. 38 (17312), 1–5. doi:10.1029/2011gl047908
Hernández-Pajares, M., Juan, J. M., SanzOrus, J. R., Garcia-Rigo, A., Feltens, J., Komjathy, A., et al. (2009). The IGS VTEC maps: A reliable source of ionospheric information since 1998. J. Geodesy 83 (3-4), 263–275. doi:10.1007/s00190-008-0266-1
Jin, S. G., Wang, J., Zhang, H., and Zhu, W. (2004). Real-time monitoring and prediction of the total ionospheric electron content by means of GPS observations. Chin. Astron. Astrophys. 28, 331–337.
Jin, S., Occhipinti, G., and Jin, R. (2015). Gnss ionospheric seismology: Recent observation evidences and characteristics. Earth Sci. Rev. 147, 54–64. doi:10.1016/j.earscirev.2015.05.003
Lanyi, G. E., and Roth, T. A. (1988). A comparison of mapped and measured total ionospheric electron content using global positioning system and beacon satellite observations. Radio Sci. 23 (4), 483–492. doi:10.1029/rs023i004p00483
Le, H., Liu, J. Y., and Liu, L. (2011). A statistical analysis of ionospheric anomalies before 736 M6.0+ earthquakes during 2002-2010. J. Geophys. Res. 116, A02303. doi:10.1029/2010ja015781
Li, Z. S., Wang, N. B., Li, M., Zhou, K., and Yuan, H. (2017). Evaluation and analysis of the global ionospheric tec map in the frame of international GNSS services. Chin. J. Geophys. 60 (10), 3718–3729.
Lin, J., Li, X., Gu, S., Lou, Y., and Yun, Q. (2022). Spatiotemporal accuracy evaluation and errors analysis of global VTEC maps using a simulation technique. GPS Solutions 27 (1), 6. doi:10.1007/s10291-022-01343-y
Liu, J. B., Hernandez-Pajares, M., Liang, X. L., An, J. C., Wang, Z. M., Chen, R. Z., et al. (2017). Temporal and spatial variations of global ionospheric total electron content under various solar conditions. J. Geodesy 91 (5), 485–502. doi:10.1007/s00190-016-0977-7
Liu, J. Y., Chen, Y. I., Chen, C. H., Liu, C. Y., Chen, C. Y., Nishihashi, M., et al. (2009). Seismoionospheric GPS total electron content anomalies observed before the 12 May 2008 Mw7.9 Wechuan earthquake. J. Geophys. Res. 114 (A4), A04320.
Liu, J. Y., Chuo, Y. J., Shan, S. J., Tsai, Y. B., Chen, Y. I., Pulinets, S. A., et al. (2004). Pre-earthquake ionospheric anomalies registered by continuous GPS TEC measurements. Ann. Geophys. 22 (5), 1585–1593. doi:10.5194/angeo-22-1585-2004
Mannucci, A. J., Wilson, B. D., Yuan, D. N., Ho, C. H., Lindqwister, U. J., and Runge, T. F. (1998). A global mapping technique for GPS-derived ionospheric total electron content measurements. GPS-derived Ionos. total electron content Meas. 33 (3), 565–582. doi:10.1029/97rs02707
Pulinets, S. A. (2004). Ionospheric precursors of earthquakes: Recent advances in theory and practical applications. Terr. Atmos. Ocean. Sci. 15 (3), 413–436. doi:10.3319/tao.2004.15.3.413(ep)
Roma-Dollase, D., Hernandez-Pajares, M., Krankowski, A., Andrzej, K., Ghoddousi-Fard, R., et al. (2018). Consistency of seven different GNSS global ionospheric mapping techniques during one solar cycle. J. Geodesy 92 (6), 691–706. doi:10.1007/s00190-017-1088-9
Sardon, E., Rius, A., and Zarraoa, N. (1994). Estimation of the transmitter and receiver differential biases and the ionospheric total electron content from Global Positioning System observations. Radio Sci. 29 (3), 577–586.
Schaer, S. (1999). Mapping and predicting the earth’s ionosphere using the global positioning system. Geod.-Geophys. Arb. Schweiz 59, 205.
Thomas, J., Huard, J., and Masci, F. (2017). A statistical study of global ionospheric map total electron content changes prior to occurrences of M≥6.0 earthquakes during 2000–2014. J. Geophys. Res. 122 (2), 2151–2161. doi:10.1002/2016ja023652
Xiang, Y., Yuan, Y. B., Li, Z. S., and &Wang, N. B. (2015). Analysis and validation of different global ionospheric maps (GIMs) over China. Adv. Space Res. 55 (1), 199–210. doi:10.1016/j.asr.2014.09.008
Zhang, Q., and Zhao, Q. L. (2019). Evaluation and analysis of the global ionosphere maps from wuhan university IGS ionosphere associate analysis center. Chin. J. Geophys. 62 (12), 4493–4505.
Zhang, Y., Wang, N. B., Li, Z. S., Liu, A., and Li, A. (2022). Accuracy analysis of real-time global ionospheric maps from CAS, CNES, NRCan and UPC. J. Geodesy Geodyn. 42 (10), 1095–1100.
Zhao, B. Q., Wang, M., Yu, T., Xu, G. R., Wan, W. X., and Liu, L. B. (2010). Ionospheric total electron content variations prior to the 2008 Wenchuan Earthquake. Int. J. Remote Sens. 31 (13), 3545–3557. doi:10.1080/01431161003727622
Zhao, L., Zhou, Y., and Xue, W. (2016). Temporal and spatial variation and perturbation analysis for China with GIM and IRI2012 model. Prog. Geophys. (in Chinese) 31 (5), 2048–2055.
Zhe, Y., Song, S., Jiao, W., Chen, G., Xue, J., Zhou, W., et al. (2017). Ionospheric tomography based on gnss observations of the CMONOC: Performance in the topside ionosphere. GPS Solutions 21 (2), 363–375. doi:10.1007/s10291-016-0526-0
Keywords: GIM (global ionospheric map), CMONOC, RIM, China, accuracy
Citation: Zhu F, Yang J, Qing Y and Li X (2023) Assessment and analysis of the global ionosphere maps over China based on CMONOC GNSS data. Front. Earth Sci. 11:1095754. doi: 10.3389/feart.2023.1095754
Received: 11 November 2022; Accepted: 31 March 2023;
Published: 11 April 2023.
Edited by:
Lin Jian, Ministry of Emergency Management, ChinaReviewed by:
Yidong Lou, Wuhan University, ChinaCopyright © 2023 Zhu, Yang, Qing and Li. This is an open-access article distributed under the terms of the Creative Commons Attribution License (CC BY). The use, distribution or reproduction in other forums is permitted, provided the original author(s) and the copyright owner(s) are credited and that the original publication in this journal is cited, in accordance with accepted academic practice. No use, distribution or reproduction is permitted which does not comply with these terms.
*Correspondence: Fuying Zhu, Znl6aHUwMjdAZm94bWFpbC5jb20=
Disclaimer: All claims expressed in this article are solely those of the authors and do not necessarily represent those of their affiliated organizations, or those of the publisher, the editors and the reviewers. Any product that may be evaluated in this article or claim that may be made by its manufacturer is not guaranteed or endorsed by the publisher.
Research integrity at Frontiers
Learn more about the work of our research integrity team to safeguard the quality of each article we publish.