 Zhiming Bai
- 1State Key Laboratory of Lithospheric Evolution, Institute of Geology and Geophysics, Chinese Academy of Sciences, Beijing, China
- 2National Key Laboratory of Ecological Security and Resource Utilization in Arid Areas, Xinjiang Institute of Ecology and Geography, Chinese Academy of Sciences, Urumqi, China
- 3Physics of the Earth, Sciences B, University of Zaragoza, Zaragoza, Spain
Altaids in the Central Asian Orogenic Belt (CAOB) is one of the world’s largest orogenic belts containing mineral deposits. Together with the Junggar terrain they open an important window to study the Paleozoic tectonic evolution of the CAOB. In this paper, we analyze a 637-km-long wide-angle refraction/reflection seismic profile across the Altai-Eastern Tianshan orogenic belt in the southern Altaids, conducted in September 2018 using 10 large explosive charges fired in drilled holes. We use a traveltime inversion method to reconstruct the lithospheric P-wave velocity structure along the profile. The lithosphere is composed of a 43-55-km-thick crust, a ∼10-km-thick crust-mantle transition layer beneath the Altai Mountain, and a ∼25-km-thick layer of lithospheric mantle. The results clearly reveal: a prominent Moho uplift beneath the Yemaquan Island Arc, two major crustal-scale low-velocity anomalies (LVAs) beneath the Yemaquan Arc and Bogda Mountain, and three high-velocity anomalies (HVAs) near the surface around the Kalatongke, Yemaquan and Kalatage mining areas. We hypothesize that the subduction of the Paleo-Asian Ocean occurred with strong mantle upwelling. We suggest that continued compression of the Paleo-Asian Ocean causes the delamination of lithosphere, as well as asthenospheric material upwelling and magma underplating into the crust. Consistently, Paleozoic mafic-ultramafic rocks and mantle-derived minerals related to gold, copper and nickel deposits, are widely extended in the area. Our results show that the P-wave velocity-depth curves for deeper depths (>30 km) in the southern Altai and Junggar Basin are close to those of the continental arcs and global continent average. Despite powerful Paleozoic subduction activity, orogeny and volcanism strongly modified the lower crust in the region, part of ancient continental crust was still preserved below the southern Altai and Junggar Basin. In addition, the upper part (depth 5–30 km) of the velocity-depth curve for the Junggar Basin is close to that of the Costa Rica volcanic front and the British Columbia accreted terrain, suggesting that Paleozoic orogenic activity has intensively reconstructed the upper-middle crust beneath the Junggar Basin.
Highlights
Crustal structure across the Altai-Eastern Tianshan orogenic belt with a 637-km-long wide-angle seismic profile
Prominent HVAs around the Kalatongke, Yemaquan and Kalatage mining areas.
Apparent LVAs related to the subduction of the Paleo-Asian Oceanic plate.
Signifcant Moho uplift and a crust-mantle transition layer beneath the Altai Mountain due to mantle upwelling.
Upper-middle crustal property of Junggar Basin similar to the Costa Rica volcanic front and the British Columbia accreted terrain.
Introduction
Altaids is part of the central Asian orogenic belt, which is found among the large cratons in Eastern Europe (Poland), Siberia, North China, and Tarim. It is the largest continental metallogenic domain in the world (Xiao et al., 2015; Xiao et al., 2018). This region experienced the Precambrian mantle plume explosion, Paleo-Asian Ocean closure, multi-oceanic basin, multiple subduction and complex multidirectional convergent accretion orogenic process during the Paleozoic. All these processes gave rise to a series of tectonic and thermal events, including subduction and magma accretion, and produced world-class gold, copper and other mineral resources. Hence, the investigation of the physical structure, geodynamics and metallogeny of the central Asian orogenic belt has become an attractive Frontier topic in the field of geosciences.
North Xinjiang in western China has undergone strong plate accretion, orogenic processes and magma events in the Paleozoic due to which ophiolite suites, mafic and ultramafic rocks and multi-type metal deposits were produced, including the Kalatongke copper-nickel mine and the Dunbastao gold deposit along the Erqis fault, the Cu-Au metallogenic systems represented by the Qingshuiquan, Shuangquan and Nanmingshui ore deposits (of orogenic, porphyry and epithermal hydrothermal type, respectively) along the Kalamaili fault, and the Kalatage porphyry copper-gold deposit near the southern margin of the Altai-Eastern Tianshan traverse. However, there is still a lack of knowledge and lively controversy regarding the tectonic evolution and metallogeny process in the southern Altaids.
First, despite some geological evidence has shown that the late Paleozoic ultramafic rocks and widely developed Cu-Ni, Ti-Fe and Cr-Fe deposits in the Altai-Eastern Tianshan are closely related to mantle-derived magma (e.g., Mao et al., 2006; Dong et al., 2009; Qian et al., 2011; Wang et al., 2013), the properties of the crustal material and the structural characteristics beneath different blocks need further investigation. For example, whether or not there was a preserved mafic component or special structure related to the Paleozoic subduction or orogenic process in the crust remains an interesting question that limits the discussion of metallogenic mechanism and regional geodynamics.
Based on active seismic source data acquired along the Altai-Altyn geological section, Wang et al. (2003) and Wang et al. (2004) obtained the seismic velocity structure and Poisson’s ratio of the crust. Their results show that the crustal thickness is about 50 km for most segments of the profile, although it increases up to 56 km in southern Altai Mountain and decreases up to 46 km in the Junggar Basin; they also revealed some local high-velocity anomalies (HVAs) with Vp greater than 7.0 km/s and high Poisson’s ratio of 0.26–0.28 below the Altai Mountain and Junggar Basin. A basic composition was suggested for the upper-middle crust and mafic granulite for the lower crust. Nevertheless, due to several drawbacks, such as a fairly large firing spacing of 63–125 km, a receiver spacing of 2–4 km, and an incomplete observation system, the zones of interest, such as orogenic belts, main sutures and the typical areas of mineral concentration were not sufficiently illuminated, so the fine-scale velocity structure of the region and the Paleozoic tectonics and metallogenic mechanism were not fully determined.
Second, the existence of an ancient basement is still a matter of discussion. For example, it was believed that Altaids had a Precambrian basement in the past (17-8 Ga or later), which was supported by the Sm-Nd age and the Nd isotopic pattern age (Hu et al., 2000; Hu et al., 2000; Fang et al., 2002). However, some studies based on the average zircon age of gneiss have questioned whether there is an ancient basement in the Altai orogen (e.g., Long et al., 2008; Sun et al., 2008). Nd isotope mapping shows that the central part of the deep crust in the Altai orogenic belt is old and the southern margin is new; there is an ancient basement in the lower part of the central block; most of the crustal growth below the Altai Mountains is in a horizontal direction (Wang et al., 2010; Wang et al., 2020). Faced with this scenario, geophysical evidence is still lacking.
The Junggar Basin has experienced multiple periods of north-south compression, basin-forming evolution and tectonic deformation since the Paleozoic (He et al., 2005). Wu. (1986) suggested that the basement of the Junggar Basin was composed of Cambrian-Carboniferous oceanic basins, intra-oceanic island arcs, and micro-continent blocks. Some studies (e.g., Li et al., 2000; Qu et al., 2008) inferred that the eastern Junggar Basin has late Pre-Ordovician continental crustal basement, and Qu et al. (2008) even point out that the basement layer is continental crust characterized by a “double basement.” However, based on the results of isotopic and geochemical research, other authors (e.g., Hu et al., 2000; Wang et al., 2019) inferred that the basement layer of Junggar Basin is formed by oceanic crust, and that it may be the trace of a residual oceanic basin with a crust younger than the Altai and Tianshan Mountains. Despite this, mapping results of the Altai‒East Junggar‒East Tianshan regional isotope corridor show that the East Junggar granites have high εNd(t) (+8‒+1) and low TDM (0.7-0.5 Ga) values, which implies that it is young material from the mantle; the deep material mainly has a relatively new (juvenile crust) structural composition (Hf model age is 0.67–0.20 Ga), and the Junggar orogen belt is dominated by vertical growth (Wang et al., 2020).
Against this background, in September 2018, we conducted a 637-km-long wide angle, deep seismic sounding (DSS) experiment across the Altai-Eastern Tianshan traverse to acquire field wide-angle seismic data. The goal was to reconstruct the crust-upper mantle structure, understand the Palaeozoic accretion and mountain building process in the frame of the ancient Asian Ocean plates, and explore the potential tectonic mechanism for mineral deposits in the area. With the collected seismic data, we adopted the traveltime inversion method Rayinvr (Zelt and Smith, 1992; Zelt and White, 1995) to reconstruct the lithospheric structure of the region more clearly, and finally acquired its seismic properties related to the Paleozoic subduction and block collage activities in the region.
Junggar geological setting
The north-south Altai-Eastern Tianshan profile is located on the eastern margin of the Junggar terrane. It starts at the Altai Mountains and passes through Altaids, Ulungur depression, Yemaquan Arc, eastern uplift of the Junggar Basin, Bogda Mountain, Turpan-Hami Basin and the Dananhu-Tousuquan Arc near the Kanggur suture zone (Figure 1).
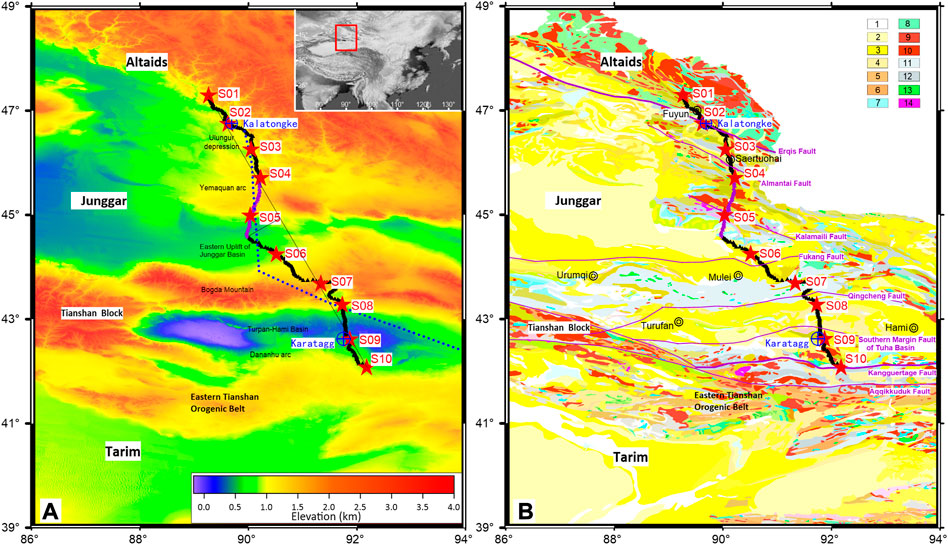
FIGURE 1. The topography (A) and geological setting (B) of Altai-Tianshan DSS profile. Black triangles: EPS-type digital seismographs; purple triangles: PDS-2 type digital seismographs; red stars: shot point locations (S01-S10). The blue dashed line in Panel A denotes the location of old DSS line given by Wang et al. (2003) in this region. The lithology in Panel B: 1) Quaternary Holocene alluvial deposits. 2) Upper Pleistocene and Holocene weathered sedimentary. 3) Upper Pleistocene and Holocene water sedimentary. 4) Tertiary sedimentary. 5) Lower Proterozoic. 6) Middle Proterozoic. 7) Mesozoic. 8) Paleozoic. 9) Devonian-Permian granites and granodiorites. (10) Proterozoic granites and granodiorites. (11) Middle Carboniferous sedimentary and volcanic rocks. (12) Early Carboniferous andesites and basalts; (13) Gabbro and diabase. (14) Peridotite and diabase peridotite.
The Altai Mountains show many geological records related to Paleozoic ridge subduction, such as adakites, niobium-rich basalts, boehmites, peridotites, A-type granites, bimodal volcanic rocks, ophiolite in back-arc basin, Alaska-type basic-ultrabasic complex, metamorphic belts, acid dyke swarm, etc. Xiao et al. (2019) pointed out that the main body of the Altai magmatic arc is formed by the subduction and accretion of the Paleo-Asian Ocean during the Paleozoic.
The Ulungur depression is near the south of Altai Mountains and has a Carboniferous basement layer, and also an upper Triassic, Jurassic and Cretaceous sedimentary layer (Zhu, 2009; Chen et al., 2010), where rich oil-gas resources were explored in the last 10 years. The Erqis ophiolite belt and the Almantai ophiolite belt are located on its north and south sides, respectively (Figure 1). The Yemaquan Arc between the Almantai and Kalamaili ophiolite belts is a part of the eastern Junggar orogenic belt whose folded basement is a volcanic marble basin.
The Junggar Basin has a Cambrian-Carboniferous basement layer consisting of an ocean basin, island arc and microcontinents (Wu, 1986; Bian et al., 2010). From Carboniferous to Cenozoic time, it has experienced multistage tectonic superposition and developed rich oil and gas resources (Zheng et al., 2018).
Bogda Mountain in the southern half of the reference profile has a mid-height mountain and low-hill topography that has been strongly eroded and cut; its main body is composed of a series of Carboniferous marine volcanic-sedimentary rocks coming from small-scale granites, diorites, potash feldspar granites and gabbro-diabase (Gu et al., 2001), although its two sides are Permian conglomerate, sandstone, siltstone and basalts (Su et al., 2005).
The Turpan-Hami Basin on the south side of Bogda Mountain (Figure 1) is a continental intermountain basin formed by the Indochina-Yanshanian movement and especially by the northward extrusion of the Indian Plate since the Miocene (Yu and Fu, 1993). Here the basement is composed of Devonian, Carboniferous, and Lower Permian marine intermediate bases, intermediate acid volcanic rocks, volcanic tuffaceous sandstones, mudstones, limestones and Variccian acid magmatic rocks.
The Dananhu-Tousuquan Island Arc at the southernmost end of the profile is part of the eastern Tianshan orogenic belt, and the adjacent Kanggurtag (Figure 1) belt is thought to preserve clear evidence of the subduction of the Paleo-Asian oceanic plate and the arc-continent collision. The Paleozoic strata developed in this belt are composed of basic igneous rocks, acid igneous rocks, volcanic sedimentary rocks, clastic rocks and limestones (Xu et al., 2005). The intrusive rocks are mainly composed by granite, granodiorite, monzogranite, etc. The basic-ultrabasic complexes, whose ages range from the Middle Ordovician (Xiao et al., 2004) to the Permian (Li et al., 2006; Wang et al., 2019), are extensively exposed here.
Data
Seismic data acquisition
The seismic experiment was carried out in September-October 2018. The 637-km-long wide-angle reflection/refraction profile, with an azimuth near N30W, was deployed from the Altai Mountain to the eastern Tianshan orogenic belt (Figure 1).
Several holes were drilled and explosive charges were fired under the control of the Geophysical Exploration Centre of the China Earthquake Administration, which was in charge of acquiring seismic data. Field operations were carried out using a dense coverage observation system consisting of 10 shots that were recorded by 595 three-component digital seismographs spaced ∼1 km apart. Charges of 2–3 tons of explosive were fired at shot points spaced at 54–89 km. The locations of the shot points from S01 to S10, their respective altitudes and the triggered charges are given in Table 1.
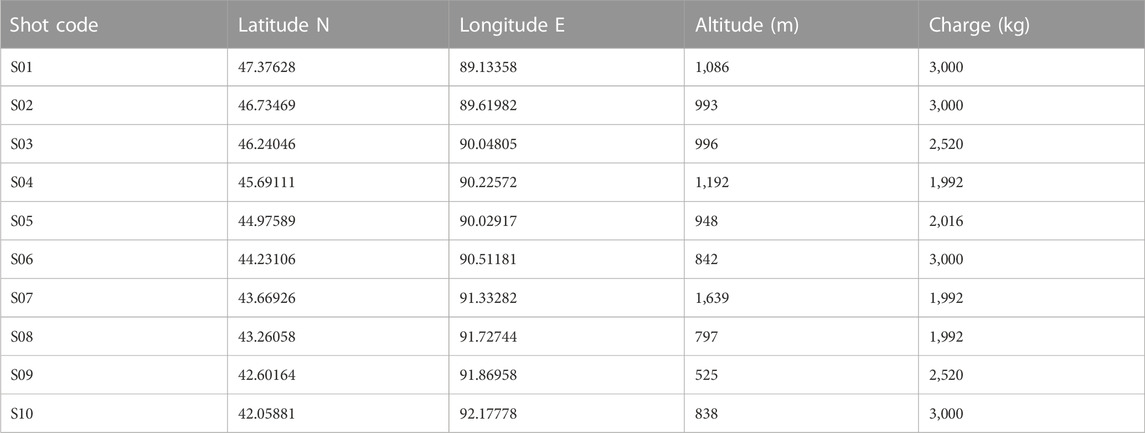
TABLE 1. Shot point locations and respective shot charges.
The 5-minute-long seismic signals recorded by digital seismographs were initially sampled at 200 Hz, and then band-pass filtered within the 1–10 Hz frequency band for P-waves. Besides this, to make the seismic reflections more clear to identify, we firstly normalized the records, then enlarged the signal by multiplying the signal-to-noise ratio (SNR) and constant 2.5 so as to make the reflections to be confidently picked, where SNR=Amp/(Amp+Amp0), Amp is the average amplitude within short time-window (0.4 s) around each time-point, and the Amp0 is the minimum average amplitude within 0.4 s before this time-point. All common shot gathers are plotted on a reduced time scale by velocity of 6.0 km/s (Figure 2).
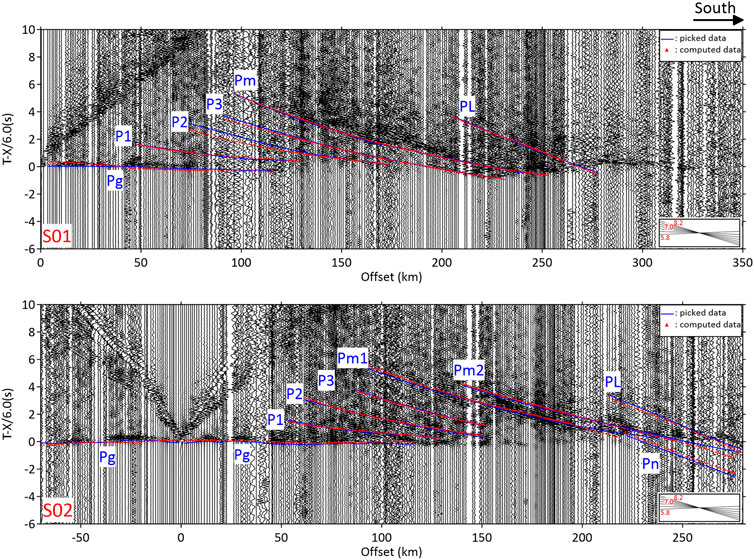
FIGURE 2. Shot gathers for shot S01 and S02. The other gathers for shots S03-S10 has been included in the suppmentary files. Shot numbers locate at the lower left corner of each graph, and the time axis were reduced at a velocity of 6.0 km/s. Picked traveltime data are drawn as blue lines, while final velocity model traveltimes are drawn as red triangles. Moreover, the slope of the lines at the lower right corner indicates the apparent velocities of the first arrival phase Pg and Pn, which were labeled as red digits in the diagrams.
The other gathers for shots S03-S10 has been included in the Supplementary Files. Shot numbers locate at the lower left corner of each graph, and the time axis were reduced at a velocity of 6.0 km/s. Picked traveltime data are drawn as blue lines, while final velocity model traveltimes are drawn as red triangles. Moreover, the slope of the lines at the lower right corner indicates the apparent velocities of the first arrival phase Pg and Pn, which were labeled as red digits in the diagrams.
To apply a 2-D modeling approach for this crooked shot-receiver array, the shot locations are projected perpendicularly onto the line between shots S01 and S10 while maintaining the true source-receiver offsets for subsequent modeling, however this crooked profile indicates the out-of-plane sampling and averaging of structure by the final 2-D model.
Seismic phases on the record sections
Based on the 10 shots fired and the seismic gathers we pick 7,991 travel time data, which can be classified into eight groups: first arrivals of Pg waves, intracrustal reflections P1, P2, P3, Moho reflections Pm1 and Pm2, PL reflections from the bottom of the lithosphere, and first arrivals of the refracted Pn phase along the top of the upper mantle.
The first Pg arrivals can be generally observed at offsets of up to 90–130 km with an apparent P-wave velocity of 5.81–6.38 km/s (Figure 3). The Pg traveltimes at some places are obliviously delayed, which include the south to shots S03, S05, S07, S08 and the north to shot S09. These delayed data agree with a surface depression or sedimentary basins, such as the Ulungur depression, Junggar Basin and Turpan-Hami Basin (Tuha basin). Secondly, the Pg traveltime curves of south branch for shots S02 and S04, and north branch for shots S05, S07 and S10 (Figure 2), show an apparently high P-wave velocity of 6.2–6.4 km/s, which means high velocity anomalies (HVAs) in the shallow crust beneath the Yemaquan Arc, Bogda Mountain, Dananhu Arc, and around the Kalatongke and Kalatage mining areas. Moreover, some Pg traveltime curves (south branch for shots S01 and S09) extend as a horizontal line, which indicates that the apparent P-wave velocity is nearly 6.0 km/s.
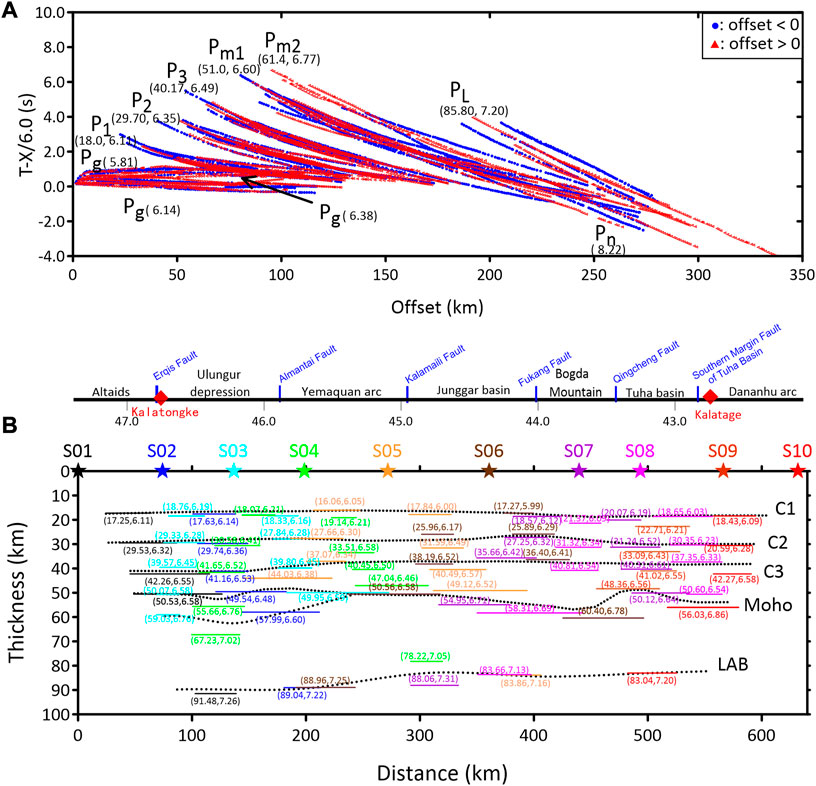
FIGURE 3. (A) Traveltime-offset curves on a reduced time scale by velocity of 6.0 km/s. In parentheses: reflection depths and P-wave velocities deduced from the seismic phases previously identified on each record section. Both the observed data (blue dotted lines) and the calculated data from the final velocity model (red triangles) have also been included for further comparison. (B) Spatial distribution of back-projected velocities, depths and possible reflections (dotted lines) based on the X2-T2 method. Top: structures and faults traversed by the profile; red diamonds mark the location of the Kalatongke and Kalatage mineral deposits to the north and south of the profile, respectively.
The intracrustal reflections P1, P2, P3 come from the interfaces C1, C2, and C3, respectively, at average depths of 18.0, 29.7 and 40.17 km, and reveal average velocities of 6.11, 6.35 and 6.49 km/s (Figures 2, 3) computed from the well-known
The Moho reflection Pm1 extends over a offset of 90–280 km with strong apparent amplitude and reveals a P-wave velocity of 6.60 km/s and an approximate crustal thickness of 51.0 km (Figures 2, 3). The Pm1 phases clearly arrive earlier at offsets of around 135 km and 200 km, as can be seen for the southern branch for S03 and the northern branch for S05, respectively, indicating that Moho uplift likely exists beneath the Yemaquan Arc.
The reflection Pm2 from the bottom of crust beneath the Altai Mountain appears clearly identified at an offset range of 100–270 km, such as the south branch for S02 and the north branch for S03 and S04, suggesting an average crustal thickness of 61.4 km and a velocity of 6.77 km/s (Figures 2, 3). The apparent high P-wave velocity of 6.77 km/s suggests that a transition layer between the crust and the mantle probably exists below Altai Mountain.
The southern records for shots S02, S03, S04 and the northern records for shots S06 and S07 show a clear Pn phase whose average apparent P-wave velocity varies from 7.8 km/s to 8.4 km/s (Figures 2, 3). The reflected phase PL is identified on the southern records for shots S01, S02, S04, S05 and on the northern records for shots S06, S07, S08 and S10. This event covers an offset from ∼200 km to ∼300 km and indicates an average lithospheric thickness of 85.8 km and a velocity of 7.20 km/s.
To display all the above data together, in Figure 3A we show in parentheses depths and seismic velocities deduced from the identified seismic phases on each record section, and in Figure 3B the spatial distribution of velocities and depths together with possible reflection limits based on previously calculated back-projected locations (dotted lines), which were determined using the
Methods
Forward and inverse modeling
To model the seismic events described above, we constructed an initial 2-D model using a combination of forward modeling of amplitudes and traveltimes by trial-and-error (Cerveny et al., 1977; Cerveny and Psencik, 1984), and then inverting the structure of the lithosphere using the ray inversion method (Zelt and Smith, 1992; Zelt and White, 1995; Zhang et al., 2013).
The 2-D ray-tracing equations are a pair of first-order ordinary differential equations that can be written in two ways (Cerveny et al., 1977; Cerveny and Psencik, 1984; Xu et al., 2014):
or
with initial conditions
The variable
Assuming that the traveltime inversion is a linear problem around a starting model, its equation is expressed as:
where A is the matrix of partial derivatives of the traveltime with respect to the model parameters, Δm is the perturbation vector of the model parameters (velocity or interface depth), and Δt is the traveltime residual vector. Based on a layered structure model, Zelt and Smith (1992) proposed a ray inversion method to simultaneously invert two-dimensional velocities and interface structures using damped least squares. The final damped least squares solution for traveltime inversion is:
and the model resolution matrix is given by such formula:
Here A is the matrix of partial derivatives of the travel time with respect to the model parameters; D is the global damping factor, whose value determines the resolution of the model and the trade-off between stability and the magnitude of the parameter perturbation; Ct and Cm are the estimated diagonal data matrix and diagonal model covariance matrix, respectively. The diagonal elements of the resolution matrix R range between zero and one and indicate the degree of averaging or linear dependence of the true model as represented by the inverted model (Zelt and Smith, 1992).
The Pg and P1 traveltime data were used to invert the shallow structure of the upper crust above the C1 interface (∼0–18.0 km depth), Next, we fix this shallow crustal structure and invert the velocity structure of the layer between the C1 and C2 interfaces (∼18.0–29.7 km depth) using P2 data. Similarly, we repeat this procedure to invert the velocity structure of the layer between the C2 and C3 interfaces using P3 data, the layer between C3 and the Moho using Pm1 data, the crust-mantle transition layer beneath Altai Mountain from Pm2 data, and finally the top mantle layer from data Pn and PL data. In the practice of the progressive construction layer by layer, we first inverted its average velocity and bottom depth, and then we inverted for its lateral variations in velocities and boundary depth. With this top-down approach, the structure of the lithosphere was finally constructed.
Based on the described method, we repeated forward and inverse modelling until an acceptable fit to observed traveltimes was obtained, thus yielding the final velocity model. The observed and calculated traveltimes for all shot gathers are plotted in Figure 3A, where the observed data are drawn as blue dotted lines and the calculated final velocity model data are dotted as red triangles.
Table 2 contains the number of selected data for each seismic phase identified, used for inversion, and also the results of the travel time fit in terms of root mean square (RMS) error and the corresponding chi-squared value χ2 (Zelt and Smith, 1992; Zelt and White, 1995). To complement and traveltime modeling, amplitudes were calculated using dynamic ray tracing (Cerveny and Psencik, 1984). We’ve also computed the ray-path coverage and synthetic seismogram for each shot to check the reliability of our final velocity model and reproduce previous seismic events such as Pg, Pn and other reflections.
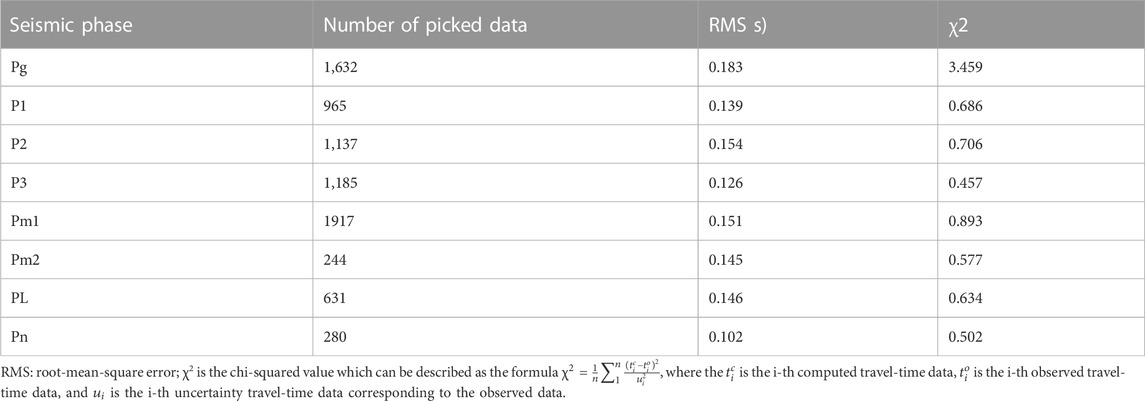
TABLE 2. Ray tracing details for individual seismic phases.
Reliability tests
To verify the lateral resolution of the preferred model, we carried out a test similar to the classical checkerboard test, whose procedure was described by Zhang et al. (2011). We first add ±0.3 km/s alternating velocity perturbations to each velocity node and ±1.0 km depth perturbations (Figure 4B) to each depth node of the initial crustal velocity model (Figure 4A); then we computed the synthetic traveltime data for each phase; finally we inverted the velocity and depth perturbations to then obtain the parameter perturbations of the last computed model by subtracting the starting model (Figure 4C).
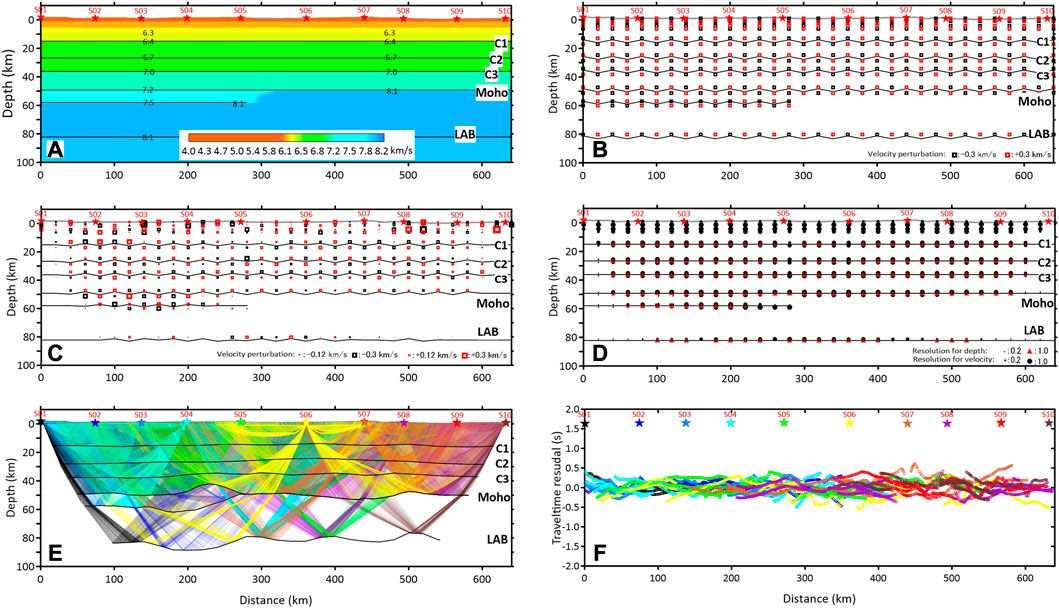
FIGURE 4. Reliability assessment of the final seismic velocity model. (A): the initial homogenious velocity model; (B). the velocity and depth perturbation model, for which the positive and negative velocity perturbation of 0.3 km/s are alternatively added to the velocity nodes on the initial model, and meanwhile the depth perturbation of 1.0 km are alternatively added to the depth nodes on the initial model; (C). the recovered velocity and depth perturbation model; (D). the diagonal elements of resolution matrix for the depth and velocity nodes, where the red triangle indicate the element for depth node, while the black dot indicate the element for velocity node; (E). the ray-path coverage for different shot points; (F). the time-residuals for different shot points.
Besides this, to assess the reliability of the inverted two variables on the final velocity model, we illustrated the diagonal elements of resolution matrix R (Formula 5) in Figure 4D, on which the elements for velocity nodes were drawn in black circles and those for depth nodes were drawn in red triangles; the closer the resolution value is to 1.0, the more reliable the final parameter acquired at a particular location. As can be seen, most of the lithospheric structure investigated by the reference DSS profile shows high resolution values close to 1.0.
Therefore we successfully recovered the checkerboard pattern over the entire illuminated area of the lithosphere, although the perturbation amplitudes were somewhat reduced. The structures within the central part of the profile and below Altai Mountain appear to be well recovered and thus more reliable.
The reliability of the final velocity model also depends on the distance between shots, the interval between receivers, and the number of data collected for each phase. The illumination of the lithosphere by ray coverage along the wide-angle seismic profile is shown in Figure 4E; this illustration confirms that most of the profile is covered by a dense seismic ray network and indicates that both the final inverted velocities and the depths at their correspondent positions are successfully illuminated. Finally, the travel-time resudal for each shot gather are plotted in Figure 4F. It has a minor average residual of 0.152 s and shows that generally there exist a good match between the computed and observed data, suggesting that our final model based on the travel-time fit has been satisfactorily resolved.
Results
The reconstructed P-wave velocity lithospheric structure below the reference profile is shown in Figure 5. The information is completed with the age profile of the study region (Figure 5A) according to the Nd isotopic model (TDM) (Wang et al., 2020). The results show a 43-55-km-thick crust, a 25 km-thick upper mantle layer, and ∼10-km-thick crust-mantle transition layer beneath southern Altai (Figure 5B). This model reveals: 1). A prominent Moho uplift beneath the Yemaquan Arc; 2). Two crustal-scale major LVAs beneath the Almantai suture and Bogda Mountain; and 3). Three shallow HVAs (P velocity of about 6.3 km/s) distributed around the Kalatongke, Yemaquan and Kalatage mining areas, respectively.
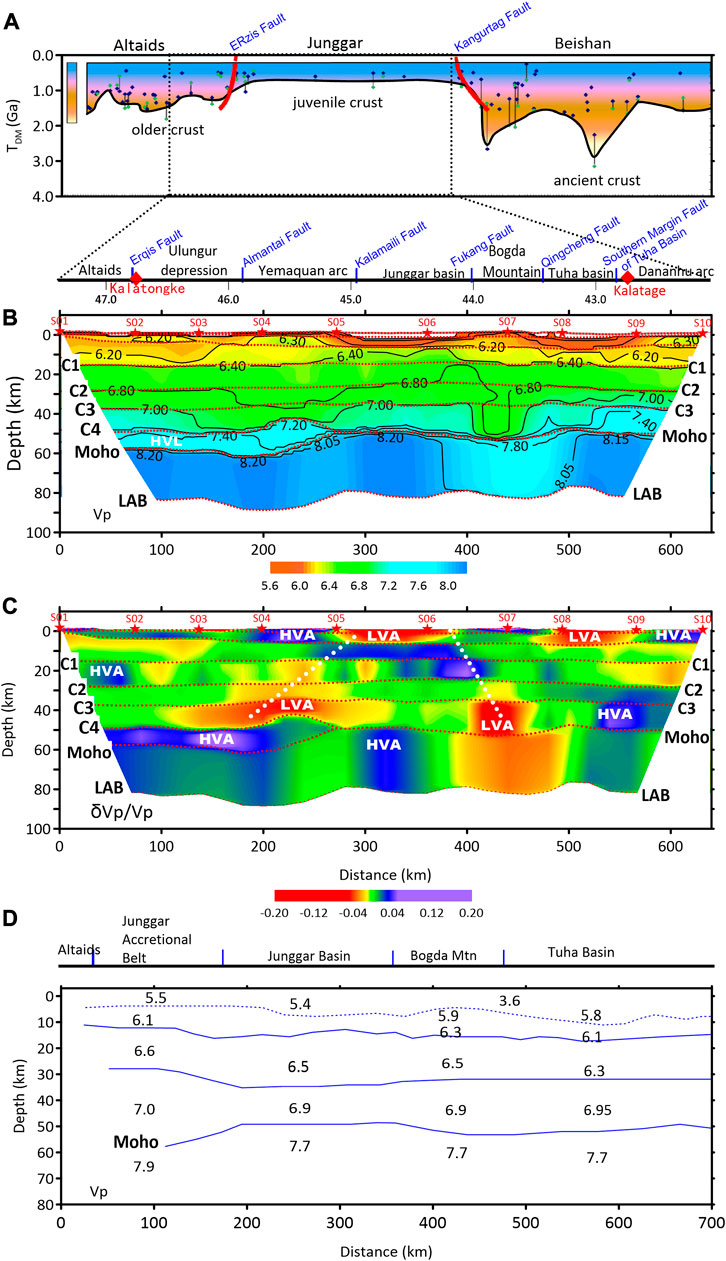
FIGURE 5. Reconstructed P-wave velocity model and comparison with other models. (A) Nd isotopic model age (TDM) profile along the study region (revised from Wang et al., 2020). (B) Final reconstructed P-wave velocity model (velocity values in km/s). (C) Velocity perturbation percentage of the final model once subtracted and then divided by the average Vp velocity of the same velocity layer. The white dashed lines denote possible Paleozoic subduction. (D) For comparison purposes, this plot includes the neighboring crustal P-wave velocity structure provided by Wang et al. (2003). Structures and faults traversed by the profile are indicated on top of the plots; red diamonds mark the location of the Kalatongke and Kalatage mineral deposits to the north and south of the profile, respectively.
As mentioned above, the Altai-Alkin crustal velocity profile was also constructed based on DSS data (Wang et al., 2003). It shows an average crustal thickness of about 50 km, and also that the southern Altai Mountain has the thickest crust with a thickness of 56 km, followed by Bogda Mountain with a crustal thickness of 54 (Figure 5D). As a whole, our final P-velocity model (Figure 5B) agrees with these characteristics: for example, the average depth of the Moho is 51 km; Southern Altai Mountain and Bogda Mountain have thicker crust with a thickness of 51 and 55 km, respectively; the Junggar Basin and the Yemaquan Arc have thinner crust with a thickness of 49 and 43 km, respectively, and the Moho boundaries have similar geometry. However, compared to the model given by Wang et al. (2003), ours provides a high-resolution P-velocity structure: a crust-mantle transition layer with an high-velocity anomaly (HVA), a ∼25 km thick lithosphere below the Moho, a significant Moho uplift below the Yemaquan Arc, and a prominent low-velocity anomaly (LVA) of depth 15–50 km below the upper crust of Bogda Mountain. The Moho uplift revealed by our model around latitude 45.5ºN (Figure 5B), below the Yemaquan Arc, is a clear feature recently verified by Liu et al. (2014) and Yang et al. (2022) from receiver functions, when describing the geometry of the crustal interface based on dense short-period seismic data.
The LAB depth of ∼77–90 km generally agrees with the LAB depth of ∼70–100 km in the region obtained by An and Shi. (2006) and depth of ∼50–110 km given by Pasyanos et al. (2011) (Litho1.0 model). The significant HVA in the top mantle below the Junggar Basin (Figure 5B) has also been detected by full-wave ambient noise tomography by Lü et al. (2019), showing the Junggar high velocity zone in slices at depths of 42 and 60 km.
Besides this, two prominent LVAs at depth of ∼20–40 km were also detected on both sides of the Junggar Basin by ambient seismic noise tomography (Kong et al., 2021): the northern mid-lower crustal LVA shows that it subducts northward beneath the Altaids, while the southern one subducts southward beneath the Bogda Mountain. Our final model (Figure 5B) supports these two different LVAs whose shapes fully agree with our results.
Discussion
Main characteristics of the lithosphere structure by blocks
Southern Altaids
To show at a glance the main features of the lithospheric structure along the Altai-Tianshan profile, in Figure 6 we show both the average Vp and the thickness of crust and lithosphere based on the final P-wave velocity model, while in Figure 7 we include the velocity-depth curves extracted for each of the blocks crossed by the reference profile for comparison with the curves deduced for other regions.
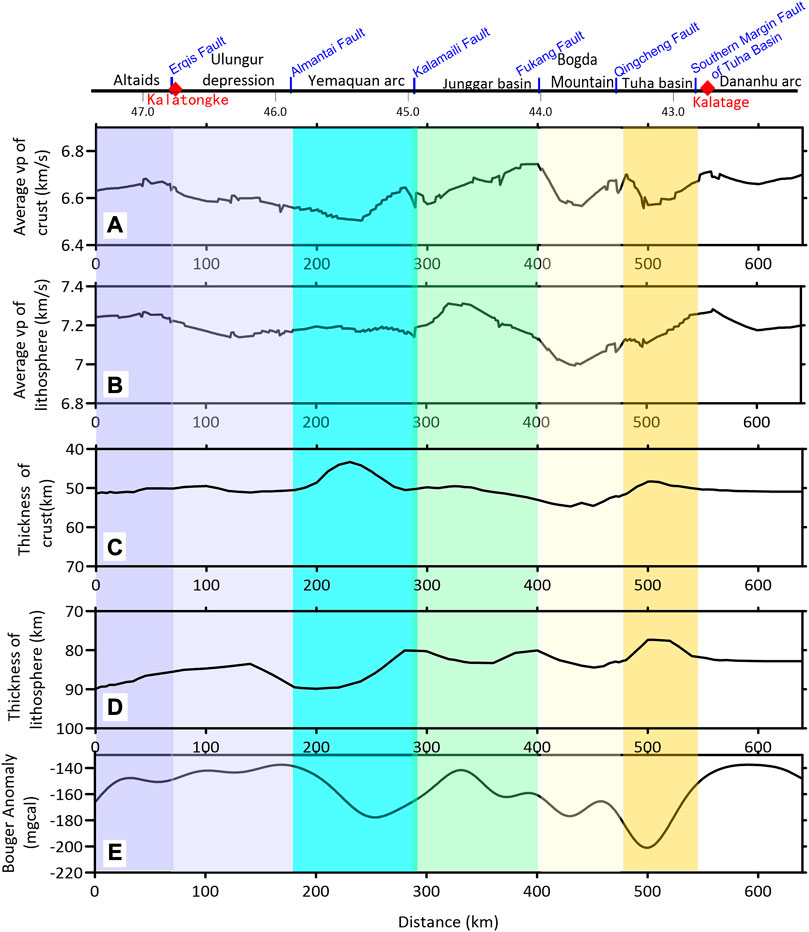
FIGURE 6. Physical parameters for different blocks (highlighted by vertical color bands) based on the final P-wave velocity model. (A) Average Vp of the crust. (B) Average Vp of the lithosphere. (C) Thickness of the crust. (D) Thickness of the lithosphere. (E) Bouguer gravity anomalies along this profile (extracted from the XGM2019 gravity field model obtained by the Technical University of Munich in 2019). Top: structures and faults traversed by the reference profile; red diamonds mark the location of the Kalatongke and Kalatage mineral deposits to the north and south of the profile, respectively.
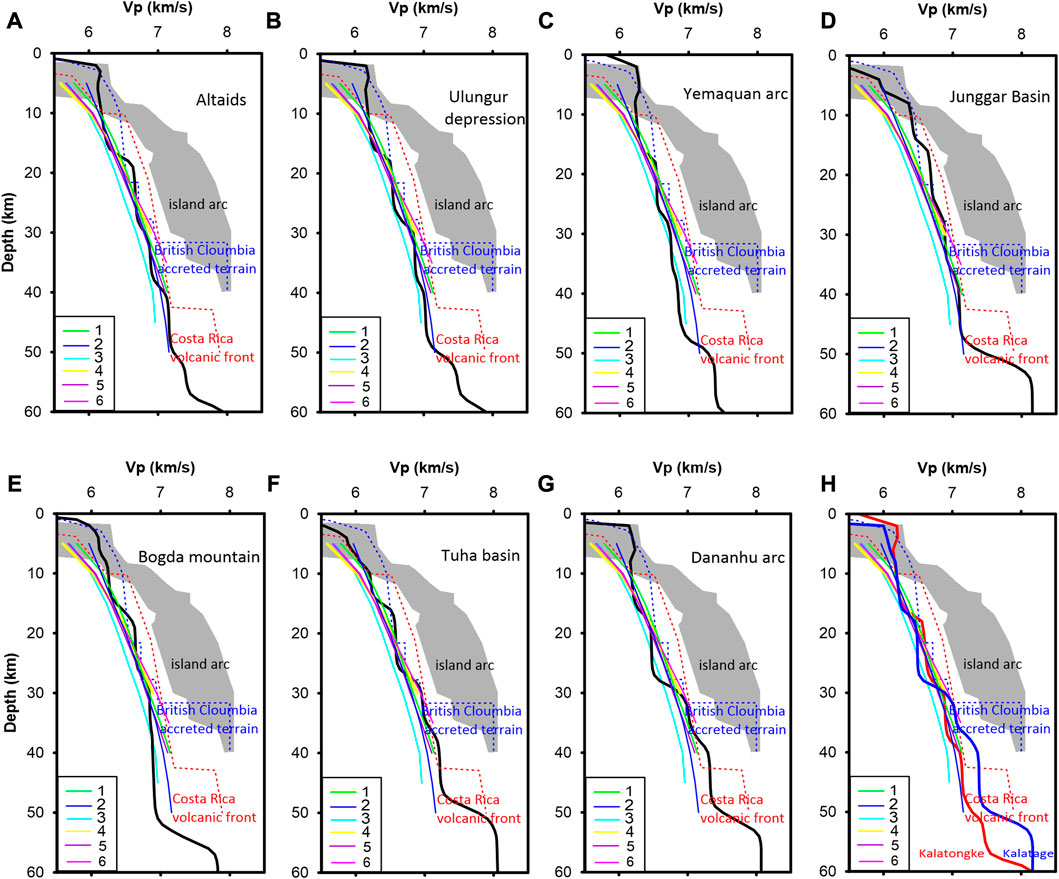
FIGURE 7. (A−G) P-wave velocity curves versus depth for each of the distinct blocks crossed by the reference profile (thick black lines) compared to the curves deduced for other regions. (H) Same for Kalatongke (thick red line) and Kalatage (thick blue line) mining areas. Velocity-depth curves for other tectonic provinces (Christensen and Mooney, 1995): 1, continental arcs; 2, global average for continent; 3, orogens; 4, extended crust; 5, shields and platforms; 6, rifts. The grey shaded area represents the range of velocities inferred in island arcs from wide-angle seismic surveys (Calvert, 2011).
Our model reveals a deeper LAB below the southern Altaids (Figure 6D), a crust-mantle transition layer (∼50–60 km) with high Vp values of 7.2–7.4 km/s, and also two apparent HVAs located within the middle-crust and the top mantle (Figures 5B, C). The velocity-depth curve for this region (Figure 7A) also shows high Vp values for the crust (6.65 km/s) and the rest of the lithosphere (7.25 km/s). All of this evidence is consistent with mantle-derived rocks and minerals, such as the alkaline iron-rich high titanium basalt series related to ilmenite deposits, the tholeiitic basalt–calc-alkaline series related to copper-ickel deposits, and the ophiolite type rocks with rich Mg and poor Fe characteristic related to chromite deposits (Wang et al., 2013).
He et al. (1994) proposed that Altaids contains a continental margin from the late Precambrian to the early Paleozoic, and that subduction of oceanic crust could have occurred in the Paleozoic (Windley et al., 2002; Xiao et al. al., 2004). The mid-lower part (depth >10 km) of the average Vp curve (Figure 7A) is close to that of the continental arcs and global continent average (Christensen and Mooney, 1995). This suggests that, despite the strong Paleozoic subduction and orogenic process, it still retains traces of the ancient components of the pre-Early Paleozoic continental crust, confirming that it is a Japanese-type arc (Xiao et al., 2015; Xiao et al., 2018).
The slab window caused by the subduction of mid-ocean ridges was used to explain the origin of adakite, Nb-rich basalt, high-Mg andesite and Devonian high-grade metamorphic complexes around southern Altai (Zhao et al., 2006; Windley et al., 2007; Sun et al., 2008; Shen et al., 2010; Xiao et al., 2018), and it is believed that there were two oceanic ridge subductions in the late Paleozoic in the southern margin of Altai. Also, there are orogenic gold deposits such as the Kalatongke, Tokuzibayi and Donbastau copper-nickel deposits in the Erqis shear zone in the southern margin of Altai. Chronological studies (e.g., Han et al., 2007; Li et al., 2007) show that the above deposits were formed in the Carboniferous-Permian. The ore magma originated from the upper mantle and is the product of upward intrusion or tectonic-magmatic-fluid activity of mafic magma in a post-collisional extensional environment.
Ulungur depression
The Ulungur Depression is the northeastern part of the Junggar Basin (Figure 1), which is a late Paleozoic-Mesozoic and Cenozoic multi-cycle superimposed basin, with rich oil and gas resources (Zhu, 2009; Chen et al., 2010). Our velocity model (Figures 5B, C) shows that two LVAs exist within the shallow and lower crust. The former corresponds to the thick sedimentary layer of this place. The latter could be interpreted to mean that the top mantle is quite hot and that there is probably a strong thermal interaction across the Moho boundary, which could be related to the high heat flow observed in the Ulungur depression (Jiang et al., 2019) compared to other values of the eastern Junggar area.
Figure 6 shows relatively low average Vp values for the crust (6.59 km/s) and lithosphere (7.16 km/s), respectively. The velocity-depth curve for this region (Figure 7B) also shows that the Vp value of the deepest part of this block (depth>25 km) is clearly less than that of the global continent average (Christensen and Mooney, 1995), and it is also close to the curve of orogens.
Yemaquan Arc
The Yemaquan Arc is located between the Almantai and Kalamaili ophiolite belts and is a part of the eastern Junggar orogenic belt (Figure 1). The folded basement of the Yemaquan continental block is a flysch volcanic basin, and its southern continental margin volcanic arc is covered with Devonian acid volcanic and pyroclastic rocks, neritic terrigenous clastic rocks from the late Early Devonian to the Early Carboniferous, and post-collisional alkaline granite bedrock (Li et al., 1990).
This arc is located in the larger Kalamaili area, where gold deposits represented by the Jinshuiquan, Shuangquan, Nanmingshui and Sujiquandong deposits are developed, forming a set of metallogenic gold systems related to the late Paleozoic collisional orogeny.
Han et al. (2006) showed that the Kalamaili granite belt is a huge NW-trending batholith, which is caused by magmatic events in the post-collision extensional environment of late Paleozoic 330–280 Ma. Zhang et al. (2015) believed that the Late Carboniferous–Permian post-collisional tectonics dominated the major metallogenic systems in this area. These authors proposed that extensional strike-slip structure produced by continental lithospheric delamination and asthenospheric mantle upwelling, crust-mantle magma interaction, and mixed-fluid action is the geodynamic mechanism of metal mineralization in the Karamaili area.
Our model clearly shows that a LVA exists within the middle-lower crust (Figure 5B and especially Figure 5C). This can be attributed to marine sediments or rocks brought to this depth due to Paleozoic subduction. Our model also reveals two apparent HVAs, one shallow near the surface and the another one within the upper mantle (Figure 5C), and a significant Moho uplift (Figure 6C). Based on above geological evidences, we suggest that the LVA, HVAs and Moho uplift of this area could be correlate with Paleozoic post-collision delamination after subduction in this region, and moreover these evidences were probably preserved in the lithosphere due to the lack of strong tectonics during the Mesozoic-Cenozoic period.
Above disclosed clear Moho uplift matches with the imaging results given by Yang et al. (2022), and this block has thinnest crust with a minimum thickness of ∼43.0 km (Figure 6C), a thicker lithosphere with a maximum thickness of up to 90.0 km (Figure 6D), while it has the lowest local Bouger anomaly value of −178 mgcal (Figure 6E). This low gravity anomaly agrees with the apparent LVA within the middle-lower crust (Figure 5C), and the low average Vp value of the crust whose minimum is only 6.5 km/s (Figure 6A). The corresponding velocity-depth curve (Figure 7C) shows that the Vp value for the deeper part of this block (depth>25 km) is clearly similar to that of the orogens curve, suggesting a powerful Paleozoic subduction and orogeny around this area.
Junggar basin
This area has a high average Vp value for the lithosphere, whose maximum reaches 7.30 km/s (Figure 6B), and a high local Bouguer anomaly value whose maximum is −142 mgcal (Figure 6E). Our velocity model shows that, except for the LVA corresponding to the surface sedimentary cover, there are two HVAs below the surface LVA and within the upper mantle (Figures 5B, C).
The upper segment of the Junggar Basin velocity curve (depth <30 km) is similar to those of the Costa Rican volcanic front (Gazel et al., 2015) and the British Columbia accreted terrain (Morozov et al., 1998), while the deeper part (depth >30 km) of the velocity curve is close to those of the continental arcs or global continental average (green and blue curves in Figure 7D). This implicates that the shallow structure of the ancient continental crust below the Junggar Basin has been modified enormously due to the strong Paleozoic subduction and orogeny in this area.
Bogda Mountain
Previous studies (Guo et al., 2003; Zhang et al., 2015) have revealed that Bogda Mountain has successively experienced the back-arc basin splitting in the Early Carboniferous, subduction during the Late Carboniferous, with extension in the Early Permian (Xiao et al., 2004), until reaching stability in the Middle-Late Permian and finally reactivating due to the long-range effect of the India-Tibet collision since the Neogene.
Our velocity model shows that although there is a HVA near the surface, a significant LVA is found within the middle-lower crust and uppermost mantle (Figures 5B, C). This LVA is consistent with the velocity pattern provided by Kong et al. (2021), both of which support the idea that the Paleo-Asian Ocean had subducted southward below the Bogda block (Xiao et al., 2004; 2018; Li et al., 2022). Likewise, this block shows a local low average Vp velocity of 6.57 km/s for the crust (Figure 6A) together with the lowest velocity of 7.0 km/s for the mantle Figure 6B). Furthermore, the upper segment (10–30 km) of the velocity-depth curve is similar to that of a continental arc, while the velocity for the deeper segment (depth >30 km) is clearly less than that of the rifts and orogens (Figure 7E). We suppose it indicates that the original deep structure of the lithosphere has been completely modified since the Paleozoic.
Turpan-Hami basin
The Turpan-Hami Basin southeast of Bogda Mountains (Figure 1) is a continental intermountain basin formed by Mesozoic-Cenozoic tectonic movements, especially the northward extrusion of the Indian Plate since the Miocene. It began to be formed from the Late Permian, and experienced complicated stages of tectonic evolution, such as marginal fault depression, fault-depression transition, expansion depression, etc., which caused it to develop thick sedimentary strata (Yu and Fu, 1993).
Our velocity model shows that in addition to a prominent LVA in the shallow crust, corresponding to a thick sedimentary layer whose maximum thickness reaches 8.0 km, there are also two apparent HVAs within the lower crust and the upper mantle (Figure 5C). This block is characterized by having the minimum value of the Bouger anomaly of −202 mgal (Figure 6E), average Vp velocity of 6.56 km/s for the crust (Figure 6A), crustal thickness of 48.4 km (Figure 6C) and lithospheric thickness of 77.5 km (Figure 6D). The upper segment (5–30 km) of the velocity-depth curve is similar to that of the continental arcs, while the velocity at deeper depth (>30 km) is close to that of the Costa Rica volcanic front (Figure 7F). Therefore, we deduce that the powerful orogeny and volcanism caused by the subduction of the Tianshan Paleozoic Ocean slab completely modified the original middle-lower crust in this basin.
Dananhu Arc
The Dananhu Arc is a part of the East Tianshan orogenic belt (Figure 1). It is located tectonically at the intersection of the Siberian plate, the Junggar terrane and the Tarim Basin (Windley et al., 1990; Xiao et al., 2004; Li et al., 2006), so it is an important window to study the convergence of ancient plates and the accretion of crustal collages. A series of igneous rocks, intrusive rocks and basic-ultrabasic complexes are widely developed in this island-arc belt, whose ages start from the Middle Ordovician (Xiao et al., 2004) and last until around the Permian (Li et al., 2006; Wang et al., 2019). Studies have shown that during the evolution of this block, it has experienced multiple stages of plate tectonic activity, such as plate subduction and collision, plate convergence-extension, and crustal ocean-land transition (Qin et al., 2002; Qin et al., 20011; Chen et al., 2016).
Our velocity model (Figure 5C) shows HVAs near the surface (depth <7.0 km) and in the middle-lower crust (depth >29.0 km) that can be correlated with the southern Kangurge structural belt, along of which there is ophiolite of the Cambrian-Silurian (416–494 Ma) widely exposed (Li et al., 2020). We assume that these HVAs suggest the strong orogeny and volcanism due to the northward subduction of the Paleozoic Tianshan Ocean slab.
This block has the maximum value of the Bouger anomaly of −137 mgcal (Figure 6E) and high average Vp velocity values of 6.69 km/s (Figure 6A) and 7.22 km/s (Figure 6B) for the crust and lithosphere, respectively. The middle segment (10–31.5 km) of the velocity-depth curve is close to that of the continental arcs or rifts, while the Vp value at deeper depth (>31.5 km) is much greater than that of the Costa Rica volcanic front (Figure 7G). These results support the idea that mantle-derived magma was powerfully introduced into the shallow crust and lower crust due to the Paleozoic subduction and inter-slab collage around the eastern Tianshan area.
On the tectonic evolution
The formation of Altaids is the product of the long-term subduction of the Paleo-Asian Ocean through a complex process dating back to ∼1.0 Ga (Khain et al., 2002) and that continued until ∼250 Ma (Windley et al., 2007; Xiao et al., 2018). Figure 5A illustrates the Nd isotopic model age (TDM) profile along the study region (revised from Wang et al., 2020), which shows that although most blocks have developed a juvenile crust whose age is generally less than 500 Ma, the southern Altai has preserved the oldest crust. This is consistent with the respective velocity-depth curves (Figure 7), which shows that the deeper part velocity-depth curve (depth >25 km) is close to that of the global average of continent (in blue). On the other hand, those depart part curves (depth >25 km and in black) of the blocks Yemaquan arc, Bogda Mountain, Tuha basin and Dananhu arc are far from the blue curve, and it suggests the mid-lower crust within these younger blocks has been modified enormously due to the Paleozoic crust-mantle interaction related to subduction and orogeny.
Altaids has a complex paleogeography with multiple islands and seas (Hsü et al., 1991; Xiao et al., 2008; Pan et al., 2009); its western segment is a multi-oceanic basin, multiple subduction zone, complex multidirectional accretionary orogeny (Xiao et al., 2008), and large-scale oroclinal bending during accretionary orogeny (Sengör et al., 1993; van der Voo, 2004; Xiao et al., 2015; 2018).
According to recent results given by Yang et al. (2022), a large number of Paleo-Asian oceanic basins may be trapped during supercontinent formation, and hence make up a large proportion of the juvenile continental crust. They proposed that when the Tarim collage joined the amalgamating Kazakhstan and Tuva-Mongol oroclines in the late Permian-middle Triassic, the Junggar ocean have been protected by both the curvilinear oroclinal belt of the Kazakhstan orocline and the rectilinear lines of the northern Tarim (Xiao et al., 2015; Xiao et al., 2018), thus the remnant ocean basins in eastern and western Junggar were preserved in the complicated multiple convergence process (Yang et al., 2022).
Figure 5C shows that beneath the Yemaquan Arc, ocean slabs subducted northward of the Paleo-Asian Ocean were preserved within the lower crust, which is consistent with the results given by Yang et al. (2022); while another southward subducted ocean slab locates beneath Bogda Mountain, according to the geological results given by Xiao el a. (2004) and Li et al. (2022). Moreover, we have found significant Moho uplift beneath the Yemaquan Arc (Figure 6C), which could be attributed to uplift of mantle material from the depths due to Paleozoic subduction or delamination.
Implications for the metallogenic mechanism
Orogenic deposits exist along the Erqis shear belt on the southern margin of the Altai (Figure 1, north segment of the profile), such as the Kalatongke copper-nickel deposit and the Tokuzibayi and Donbastao gold deposits. The early Permian Kalatongke copper-nickel sulfide deposit (around the shot point S02, Figure 1) is the largest copper-nickel mine in Xinjiang, and its mineralization is related to mafic-ultramafic rocks. Previous petrological and geochemical studies (Wang et al., 2000; Han et al., 2006; Han et al., 2011; Li et al., 2007) revealed that the cited deposits were formed in the Carboniferous-Permian and that the ore-forming magma originated from the upper mantle due to ascending intrusion of mafic magma or magmatic-tectonic fluid activity in a post-collision extensional environment.
Our velocity model shows an HVA in the middle crust between 20 and 30 km depth, a crust-mantle transition layer, and another HVA in the top mantle (Figure 5C). Also, the Vp value from 7.1 to 7.6 km/s corresponding to the deepest section (depth >40 km) of the velocity-depth curve (thick red line in Figure 7H) is greater than the global average for the continent (thin blue line in Figure 7H). These geophysical data support the earlier mantle-derived metallogenic mechanism, and we hypothesize that the strong convergence and continued northward compression of the Paleoasiatic oceanic plate caused delamination of the lithosphere in this region, leading to upwelling of mantle material from of the asthenosphere and subsequent intrusion into the lower crust and thus forming the crust-mantle transition zone. Hence, ore-bearing magma and hydrothermal fluid outcropped along deep faults and fissures to eventually form widespread copper and nickel deposits on the surface.
In the eastern Tianshan area of Xinjiang (Figure 1, south end of the profile), a large number of Permian mafic-ultramafic plutons developed, forming multiple magmatic copper-nickel sulfide deposits and vanadium-titanium magnetite deposits (Mao et al., 2006). Previous studies (Mao et al., 2010; Lü et al., 2019; Zhou et al., 2019) revealed that a series of mafic intrusions (Early Permian) originated in the mantle environment in the Kalatage mining area near the shot point S09 (Figure 1), and also in the Red Sea massive Cu-Zn deposit (Early Devonian) and the Yawan copper-nickel sulphide deposit (Early Permian). It is speculated that deep crustal faults and fractures provided the magma upwelling channel.
The Vp value corresponding to the deepest section (depth >30 km) of the velocity-depth curve for the Kalatage mineral area (thick blue line in Figure 7H) is clearly higher than any other for continental arcs, rifts and Costa Rica volcanic front. Considering the HVAs near the surface and in the lower crust and top mantle (Figure 5C), and the aforementioned ore-forming mechanism for the Kalatage area (Xiao et al., 2004; Li et al., 2006; Mao et al., 2010; Lü et al., 2019; Zhou et al., 2019), we understand that the original deep crust and top mantle undergone a strong modification due to the northward subduction of the Paleozoic Tianshan Ocean slab and the associated orogenic process. In the course of this process, mantle-derived magma and mineral-bearing hydrothermal fluids emerged along deep faults and fractures and then formed mineral deposits around the eastern Tianshan area, such as the Kalatage and Huangshan-Jingerquan copper-nickel mine.
Conclusion
In this study, we analyze a 637-km-long wide-angle refraction/reflection seismic profile deployed at the Altai-Eastern Tianshan orogenic belt, southern Altaids, in 2018. Based on the reconstructed lithospheric P-wave velocity structure, we draw the following conclusions.
1) The main structural features of the regional lithosphere are a 43-55-km-thick normal crust, a ∼10 km-thick crust-mantle transition layer beneath the Altai Mountain, and a ∼25 km-thick layer of lithospheric mantle.
2) Clearly identified features include: a prominent Moho uplift below the Yemaquan Island Arc, two major crustal-scale low-velocity anomalies below Yemaquan and Bogda Mountain, and three high-velocity surface anomalies around the Kalatongke, Yemaquan and Kalatage mining areas. Combining these features with complementary geological information, we conclude that subduction of Paleo-Asian Ocean plate, strong mantle upwelling and a powerful orogeny occurred within the explored area in the southern Altaids.
3) High-velocity anomalies in the upper crust and the crust-mantle transition layer imply that magma coming from the deep mantle may be a key factor for regional mineralization around the Central Asian Orogenic Belt, such as the Kalatongke copper-nickel sulfide deposit on the Erqis suture, and the Cu-Zn and copper-nickel sulfide deposits of Kalatage area near the Konggurtage suture. Continued compression of the Paleo-Asian Oceanic plate during the post-collision period may be the cause of widespread and intense tectonic activity, such as lithospheric thickening and delamination, most likely leading to asthenospheric material upwelling and mantle magma underplating into the crust. Hence, the presence of mafic-ultramafic rocks and mantle-derived minerals such as gold, copper and nickel, which are widely distributed in the region.
4) Our results show that the velocity-depth curves for the deeper crust (depth >30 km) in the southern Altaids and Junggar Basin are similar to those of the continental arcs and global continent average, while the curves for the other blocks in the region, such as Yemaquan Arc, Bogda Mountain, Tuha Basin and Dananhu Arc, keep great dissimilarity with them. This indicates that despite powerful Paleozoic subduction activity, orogeny and volcanism have strongly modified the lower crust in the region, although part of the ancient continental crust was still preserved beneath southern Altaids and Junggar Basin. Moreover, the upper part (depth 5–30 km) of the velocity-depth curve for the Junggar Basin is close to that of the Costa Rica volcanic front, suggesting that Paleozoic orogenic activity has intensely rebuilt the upper-middle crust below the Junggar Basin.
Data availability statement
The raw data supporting the conclusion of this article will be made available by the authors, without undue reservation.
Author contributions
ZB organized the field project, proposed the viewpoint, acquired seismic data, implemented the algorithm, performed data processing, and analyzed the results. LZ and WX were responsible for proposing the point of view, discussing the results and the conclusions. TX was responsible for data processing, analysis of results and graphic illustrations. JB contributed to the analysis and interpretation of the results, as well as to the writing of much of the manuscript.
Funding
This work was supported by the National Nature Sciences Foundation of China (42130807, 41888101), the National Key Research and Development Project of China (2017YFC0601206), and the K.C. Wong Education Foundation (GJTD-2019-04).
Acknowledgments
We would like to thank the Geophysical Exploration Centre of the China Earthquake Administration, for their efforts in hole-drilling, source triggering, and in the acquisition of field seismic data. We appreciate the guidance, suggestions and discussions with Profs. Laicheng Miao and Xiaobo Tian from the Institute of Geology and Geophysics of the Chinese Academy of Sciences. We are especially grateful to Prof. C.A. Zelt for providing us with the inversion software package used in this study. We would like to thank two reviewers for their insightful criticisms and helpful comments and suggestions that have helped us substantially improve the presentation of this study.
Conflict of interest
The authors declare that the research was conducted in the absence of any commercial or financial relationships that could be construed as a potential conflict of interest.
Publisher’s note
All claims expressed in this article are solely those of the authors and do not necessarily represent those of their affiliated organizations, or those of the publisher, the editors and the reviewers. Any product that may be evaluated in this article, or claim that may be made by its manufacturer, is not guaranteed or endorsed by the publisher.
Supplementary material
The Supplementary Material for this article can be found online at: https://www.frontiersin.org/articles/10.3389/feart.2023.1078434/full#supplementary-material
SUPPLEMENTARY FIGURE S1 | Shot gathers S03-S06, the diagrams also displayed the vertical component of seismic records, which were also reduced with the velocity 6.0 km/s.
SUPPLEMENTARY FIGURE S2 | Shot gathers S07-S10, the diagrams also displayed the vertical component of seismic records, which were also reduced with the velocity 6.0 km/s.
SUPPLEMENTARY FIGURE S3 | Ray coverage of the DSS profile for all shots.
SUPPLEMENTARY FIGURE S4 | Computed synthetic seismograms based on the final velocity model for all shots.
References
An, M. J., and Shi, Y. L. (2006). Lithospheric thickness of the Chinese continent. Phys. Earth Planet. Interiors 159, 257–266. doi:10.1016/j.pepi.2006.08.002
Bamford, D. (1978). Interpratation of wide-angle reflection travel-time in tealistic crust-mantle structures. J. Geophys. 44, 219–230.
Bian, W. H., Hornung, J., Liu, Z., Wang, P., and Hinderer, M. (2010). Sedimentary and palaeoenvironmental evolution of the Junggar Basin, Xinjiang, Northwest China. Palaeobiodiversity and Palaeoenvironments 90 (3), 175–186. doi:10.1007/s12549-010-0038-9
Calvert, A. J. (2011). “The seismic structure of island arc crust,” in arc-continent collision. Frontiers in Earth Sciences. Editors D. Brown, and P. D. Ryan (Berlin: Springer-Verlag), 87–119.
Cerveny, V., Molotkov, I., and Psencik, I. (1977). Ray method in seismology. Prague, Czechoslovakia: University of Karlova.
Cerveny, V., and Psencik, I. (1984). SEIS83-Numerical modeling of seismic wave fields in 2-D laterally varying layered structures by the ray method, in E. R. Engdahl Documentation of Earthquake Algorithms. 36–40. Boulder, Colorado: World Data Cent. A for Solid Earth Geophys, Rep. SE-35.
Chen, X. J., Zhang, K., and Zhou, J. (2016). Geochronology and geochemistry characteristics of the early Permian monzogranite and dioritic enclaves of east Tianshan and their tectonic implications. Acta Geol. Sin. 90 (9), 2334–2354.
Chen, Z. K., Xie, G. J., and Zhang, F. S. (2010). Petroleum geologic characteristics and exploration strategy in Wulungu depression of Junggar Basin. Xinjiang Geol. 28 (1), 61–64. doi:10.3724/SP.J.1077.2010.01195
Christensen, N. I., and Mooney, W. D. (1995). Seismic velocity structure and composition of the continental crust: A global view. J. Geophys. Res. 100, 9761–9788. doi:10.1029/95jb00259
Dong, L. H., Xu, X. W., Qu, X., and Li, G. M. (2009). Tectonic setting and formation mechanism of the circum-Junggar porphyritic copper deposit belts. Acta Petrol. Sin. 25 (4), 713–737.
Fang, T. H., Wang, J. B., Zhang, J. H., and Ding, R. F. (2002). Proterozoic basaltic magma intrusion event in the Altay. Xinjiang Chin. Geol. 29 (1), 48–54. doi:10.3969/j.issn.1000-3657.2002.01.009
Gazel, E., Hayes, J. L., Hoernle, K., Kelemen, P., Everson, E., Holbrook, W. S., et al. (2015). Continental crust generated in oceanic arcs. Nat. Geosci. 8, 321–327. doi:10.1038/ngeo2392
Gu, L. X., Hu, S. X., Yu, C. S., Wu, C. Z., and Zhengfu, Yan Z. F. (2001). Initiation and evolution of the Bogda subduction-torn-type rift. Acta Petrol. Sin. 17 (4), 585–597. doi:10.3321/j.issn:1000-0569.2001.04.009
Guo, L. Z., Zhu, W. B., Ma, R. S., Sun, Y., and Wang, F. (2003). Discussion on the structural coupling. Geotect. Metallogenia 27 (3), 197–205. doi:10.1016/S0955-2219(02)00073-0
Han, B. F., He, G. Q., Wang, X. C., and Guo, Z. J. (2011). Late carboniferous collision between the Tarim and Kazakhstan–yili terranes in the Western segment of the south tian Shan orogen, central asia, and implications for the northern Xinjiang, Western China. Earth-Science Rev. 109, 74–93. doi:10.1016/j.earscirev.2011.09.001
Han, B. F., Ji, J. Q., Song, B., Chen, L. H., and Zhang, L. (2006a). Late Paleozoic vertical growth of continental crust around the Junggar Basin, Xinjiang, China (Part I): Timing of post-collisional plutonsim. Acta petrol. Sin. 22 (5), 1077–1086. doi:10.3321/j.issn:1000-0569.2006.05.003
Han, C. M., Xiao, W. J., Zhao, G. C., Mao, J. W., Li, S. Z., Yan, Z., et al. (2006b). Major types, characteristics and geodynamic mechanism of Upper Paleozoic copper deposits in northern Xinjiang, northwestern China. Ore Geol. Rev. 28, 308–328. doi:10.1016/j.oregeorev.2005.04.002
Han, C. M., Xiao, W. J., Zhao, G. C., Qu, W. J., and Du, A. D. (2007). Re-Os dating of the Kalatongke Cu-Ni deposit, Altay Shan, NW China, and resulting geodynamic implications. Ore Geol. Rev. 32, 452–468. doi:10.1016/j.oregeorev.2006.11.004
He, D. F., Zhai, G. M., and Kuang, J. (2005). Distribution and tectonic features of paleo-uplifts in the Junggar. Basin,Chinese J. Geol. 40 (2), 248–261. doi:10.3321/j.issn:0563-5020.2005.02.009
He, G. Q., Li, M. S., Liu, D. Q., Tang, Y. L., and Zhou, R. H. (1994). Paleozoic crustal evolution and mineralization in Xinjiang of China. Urumuqi:Xinjiang: People’s Publishing House, 1–437.
Hsü, K. J., Wang, Q. C., Li, J. L., and Hao, J. (1991). Geologic evolution of the neimonides: A working hypothesis. Eclogae Geol. Helvetiae 84, 1–35.
Hu, A. Q., Jahn, B., Zhang, G. X., and Zhang, Q. (2000). Crustal evolution and phanerozoic crustal growth in northern Xinjiang: Nd isotopic evidence. Part I. Isotopic characterization of basement rocks. Tectonophysics 328 (1/2), 15–51. doi:10.1016/s0040-1951(00)00176-1
Jiang, G. Z., Hu, S. B., Shi, Y. Z., Zhang, C., Wang, Z. T., and Hu, D. (2019). Terrestrial heat flow of continental China: Updated dataset and tectonic implications. Tectonophysics 753, 36–48. doi:10.1016/j.tecto.2019.01.006
Khain, E. V., Bibikova, E. V., Kröner, A., Zhuravlev, D. Z., Sklyarov, E. V., Fedotova, A. A., et al. (2002). The most ancient ophiolite of the central asian fold belt: U–Pb and Pb–Pb zircon ages for the dunzhugur complex, eastern sayan, Siberia, and geodynamic implications. Earth Planet. Sci. Lett. 19, 311–325. doi:10.1016/s0012-821x(02)00587-3
Kong, X. Y., Wu, J. P., and Liu, J. (2021). S-Wave velocity structure inversed by ambient noise tomography in Xinjiang tien Shan and its surrounding areas. Earthq. Res. China 16, 43–58. doi:10.3969/j.issn.1001-4683.2021.01.005
Li, G. M., Shen, Y. C., Liu, T. B., Shen, P., and Zhou, N. W. (2007). Metallogenic evolution of tuokuzibayi gold deposit in southern altay, north Xinjiang: Evidence from characteristics of quartz vein systems, isotopic geochemistry and Ar-Ar chronology. Mineral. Deposits 26 (1), 15–32. doi:10.1007/s11434-007-0015-5
Li, H. D., Zhou, J. B., Li, G. Y., Wang, B., Chen, Z., and Wang, H. Y. (2022). Nature and evolution of the south tianshan mountains—beishan mountains-solonker-changchun suture. Geol. Rev. 68 (3), 797–816. doi:10.16509/j.georeview.2022.02.061
Li, J. Y., He, G. Q., Xu, X., Li, H. Q., Sun, G. H., Yang, T. N., et al. (2006). Crustal tectonic framework of northern Xinjiang and adjacent regions and its formation. Acta Geol. Sin. 80 (1), 148–167.
Li, J. Y., Xiao, X. C., and Chen, W. (2000). Late Ordovician continental basement of the eastern Junggar Basin in Xinjiang, NW China: Evidence from the Laojunmiao metamorphic complex on the northeast basin margin. Regional Geol. China 19 (3), 297–302.
Li, J. Y., Xiao, X. C., Tang, Y. C., Zhao, M., and Feng, Y. M. (1990). Main characteristics of late paleozoic plate tectonics in the southern part of east Junggar, Xinjiang. Geol. Rev. 36 (4), 305–316. doi:10.16509/j.georeview.1990.04.003
Li, Z. P., Wu, L., and Yan, L. L. (2020). Spatial and temporal distribution of ophiolites and regional tectonic evolution in Northwest China. Geol. Bull. China 39 (6), 783–817.
Liu, W. X., Liu, G. Z., Zhou, G., Zhang, H. M., Xu, H. L., and Wang, H. C. (2014). Joint inversion of receiver function and surface wave dispersion for crust and upper mantle S-wave velocity structure beneath the Tianshan and its adjacent region. Acta Seismol. Sin. 36 (1), 20–31. doi:10.3969/j.issn.0253-3782.2014.01.002
Long, X. P., Sun, M., Yuan, C., Xiao, W. J., and Cai, K. (2008). Early Paleozoic sedimentary record of the Chinese Altai: Implications for its tectonic evolution. Early Paleoz. Sediment. Rec. Chin. Altai Implic. its Tect. Evol. Sediment. Geol. 208, 88–100. doi:10.1016/j.sedgeo.2008.05.002
Lü, X. Q., Mao, Q. G., Sun, L. Y., Chen, L. L., Guo, N. X., and Liang, K. R. (2019a). Discovery of the yueyawan Cu-Ni deposit, eastern tianshan, NW China and its geological implications. Mineral exploration. Mineral. Explor. 10 (3), 547–554. doi:10.3969/j.issn.1674-7801.2019.03.018
Lü, Z., Gao, H., Lei, J., Yang, X., Rathnayaka, S., and Li, C. (2019b). Crustal and upper mantle structure of the TienShan orogenic belt from full-wave ambient noise tomography. J. Geophys. Res. Solid Earth 124, 3987–4000. doi:10.1029/2019JB017387
Mao, J. W., Franco, P., Zhang, Z. H., Chai, F. M., Yang, J. M., Wu, H., et al. (2006). Late variscan post-collisional Cu- Ni sulfide deposits in East Tianshan and altay in China: Principal characteristics and possible relationship with mantle plume. Acta Geol. Sin. 80 (7), 925–942. doi:10.1016/S1001-8042(06)60011-0
Mao, Q. G., Fang, T. H., Wang, J. B., Wang, S. L., and Wang, N. (2010). The geochronology studies of the early Paleozoic Honghai massive sulfide deposits and its geological significance, Kalatage belt in Eastern Tianshan Mountain, Xinjiang, Northwest China. Acta Petrol. Sin. 26 (10), 3017–3026.
Morozov, I. B., Smithson, S. B., Hollister, L. S., and Diebold, J. B. (1998). Wide-angle seismic imaging across accreted terranes, southeastern Alaska and Western British Columbia. Tectonophysics 299 (4), 281–296. doi:10.1016/s0040-1951(98)00208-x
Pan, G. T., Xiao, Q. H., Lu, S. N., Deng, J. F., Feng, Y. M., Zhang, K. X., et al. (2009). Subdivision of tectonic units in China. Geol. China 36 (1), 1–28.
Pasyanos, M. E., Masters, T. G., Laske, G., and Ma, Z. (2014). LITHO1.0: An updated crust and lithospheric model of the Earth. J. Geophys. Res. Solid Earth 119, 2153–2173. doi:10.1002/2013JB010626
Qian, H., Jiang, M., Xiao, W. J., Zhao, D. P., Wang, Y., Zhang, L. S., et al. (2011). Seismic tomography of Tianshan-Junggar region and its lithospheric structure,Acta. Seismol. Sin. 33 (3), 327–341. doi:10.3969/j.issn.0253-3782.2011.03.006
Qin, K. Z., Fang, T. H., Wang, S. L., Zhu, B. Q., Feng, Y. M., Yu, H. F., et al. (2002). Plate tectonics division, evolution and metallogenic settings in eastern Tianshan Mountains, Northwest China. Xinjiang Geol. 20 (4), 302–308. doi:10.3969/j.issn.1000-8845.2002.04.002
Qin, K. Z., Su, B. X., Sakyi, P. A., Tang, D. M., Li, X. H., Sun, H., et al. (2011). SIMS zircon U–Pb geochronology and Sr–Nd isotopes of Ni–Cu-bearing mafic–ultramafic intrusions in eastern tianshan and beishan in correlation with flood basalts in Tarim Basin (NW China): Constraints on a ca. 280 Ma mantle plume. Am. J. Sci. 311, 237–260. doi:10.2475/03.2011.03
Qu, G. S., Ma, Z. J., Shao, X. Z., and Zhang, X. K. (2008). Basements and crust structures in Junggar Basin. Xinjiang Pet. Geol. 29 (6), 669–674.
Sengör, A. M. C., Natal’in, B. A., and Burtman, V. S. (1993). Evolution of the Altaid tectonic collage and Palaeozoic crustal growth in Eurasia. Nature 364, 299–307. doi:10.1038/364299a0
Shen, X. M., Zhang, H. X., and Ma, L. (2010). Ridge subduction and the possible evidences in Chinese Altay, Xinjiang. Geotect. Metallogenia 34 (2), 181–195. doi:10.1017/S0004972710001772
Su, L. S., Zhu, W. B., Wang, B., Faure, M., Charvet, J., and Cluzel, D. (2005). The post-collision intracontinental rifting and olistostrome on the southern slope of Boda Mountains, Xing jiang. Acta Petrol. Sin. 21 (1), 25–36. doi:10.1196/annals.1298.024
Sun, M., Yuan, C., Xiao, W. J., Long, X. P., Xia, X. P., Zhao, G. C., et al. (2008). Zircon U–Pb and Hf isotopic study of gneissic rocks from the Chinese Altai: Progressive accretionary history in the early to middle Palaeozoic:Progressive accretionary history in the early to middle. Palaeoz. Chem. Geol. 247, 352–383. doi:10.1016/j.chemgeo.2007.10.026
van der Voo, R. (2004). Paleomagnetism, oroclines, and growth of the continental crust. GSA Today 14, 4–9. doi:10.1130/1052-5173(2004)014<4:poagot>2.0.co;2
Wang, D. H., Chen, Y. C., Xu, Z. G., and Lin, W. W. (2000). Cu-Ni-(PGE) sulfide metallogenic series in north Xinjiang. Mineral. Deposits 19 (2), 147–155. doi:10.3969/j.issn.0258-7106.2000.02.006
Wang, G. C., Zhang, M., Feng, J. L., Liao, Q. An. M. J., Zhang, X. H., Kang, L., et al. (2019a). New understanding of the tectonic framework and evolution during the neoproterozoic- paleozoic era in the East Tianshan mountains. J. Geomechanics 25 (5), 798–819. doi:10.2090/j.ssn.1006-6616.2019.25.05.066
Wang, T., Huang, H., Song, P., Wu, H. H., Zhang, J. J., Tong, Y., et al. (2020). Studies of crustal growth and deep lithospheric architecture and new issues:exemplified by the central asian orogenic belt (northern Xinjiang). Earth Sci. 45 (7), 2326–2344. doi:10.3799/dqkx.2020.172
Wang, T., Tong, Y., Li, S., Zhang, J. J., Shi, X. J., Li, J. Y., et al. (2010). Spatial and temporal variations of granitoids in the altay orogen and their implications for tectonic setting and crustal growth: Perspectives from Chinese altay. Acta Petrologica Mineralogica 29 (6), 595–618. doi:10.3969/j.issn.1000-6524.2010.06.002
Wang, W., Meng, Y., Wang, K., Su, X. H., Yu, J. Y., Lü, S., et al. (2019b). Zircon U-Pb ages, geochemical characteristics and petrogenesis of ringed pluton in the Hancaohu area, eastern Tianshan Mountains of Xinjiang. Geol. Bull. China 38 (5), 777–789.
Wang, Y. W., Wang, J. B., Li, D. D., Long, L. L., Tang, P. Z., Shi, Y., et al. (2013). Types, temporal-spatial distribution and metallogenic lineage of ore deposits related to mantle-derived magma in northern Xinjiang. Mineral. Deposits 32 (2), 223–243. doi:10.3969/j.issn.0258-7106.2013.02.001
Wang, Y. X., Mooney, W. D., Yuan, X., and Coleman, R. G. (2003). The crustal structure from the Altai Mountains to the Altyn Tagh fault, northwest China. J. Geophys. Res. 108 (B6), 552. doi:10.1029/2001JB000552
Wang, Y. X., Han, G. H., Jiang, M., Mooney, W. D., and Coleman, R. G. (2004). Crustal structure along the geosciences transect from Altay to Altun Tagh. Chinese Journal of Geophysics 47 (2), 240–249. doi:10.3321/j.issn:0001-5733.2004.02.010
Windley, B. F., Alexeiev, D., Xiao, W., Kröner, A., and Badarch, G. (2007). Tectonic models for accretion of the Central Asian orogenic belt. J. Geol. Soc. 164, 31–47. doi:10.1144/0016-76492006-022
Windley, B. F., Allen, M. B., Zhang, C., Zhao, Z. Y., and Wang, G. R. (1990). Paleozoic accretion and Cenozoic redeformation of the Chinese Tien Shan range, central Asia. Geology 18, 128–131. doi:10.1130/0091-7613(1990)018<0128:paacro>2.3.co;2
Windley, B. F., Kroner, A., Guo, J., Qu, G., Li, Y., and Zhang, C. (2002). Neoproterozoic to paleozoic geology of the Altai orogen, NW China: New zircon age data and tectonic evolution. J. Geol. 110, 719–737. doi:10.1086/342866
Xiao, W. J., Han, C., Yuan, C., Sun, M., Lin, S., Chen, H., et al. (2008). Middle cambrian to permian subduction-related accretionary orogenesis of northern Xinjiang, NW China: Implications for the tectonic evolution of central asia. J. Asian Earth Sci. 32, 102–117. doi:10.1016/j.jseaes.2007.10.008
Xiao, W. J., Song, D., Windley, B. F., Li, J., Han, C., Wan, B., et al. (2019). Accretionary processes and metallogenesis of the central asian orogenic belt: Advances and perspectives. Sci. China Earth Sci. 63, 329–361. doi:10.1007/s11430-019-9524-6
Xiao, W. J., Windley, B. F., Sun, S., Li, J., Huang, B., Han, C., et al. (2015). A tale of amalgamation of three Permo-Triassic collage systems in Central Asia: Oroclines, sutures, and terminal accretion. Ann. Rev. Earth Planet Sci. 43, 477–507. doi:10.1146/annurev-earth-060614-105254
Xiao, W. J., Windley, B. F., Han, C., Liu, W., Wan, B., Zhang, J., et al. (2018). Late Paleozoic to early Triassic multiple roll-back and oroclinal bending of the Mongolia collage in Central Asia. Earth-Science Rev. 186, 94–128. doi:10.1016/j.earscirev.2017.09.020
Xiao, W. J., Zhang, L. C., Qin, K. Z., Sun, S., and Li, J. L. (2004). Paleozoic accretionary and collisional tectonics of the eastern tianshan (China): Implications for the continental growth of central asia. Am. J. Sci. 304, 370–395. doi:10.2475/ajs.304.4.370
Xu, X. Y., Ma, Z. P., Xia, Z. C., Xia, L. Q., Li, X. M., and Wang, L. S. (2005). Discussion of the sources and characteristics on Sr, Nd, Pb isotopes of the Carboniferous to Permian post-collision granites from Tianshan. Northwest. Geol. 38 (2), 1–17. doi:10.3969/j.issn.1009-6248.2005.02.001
Xu, T., Li, F., Wu, Z. B., Wu, C. L., Gao, E. G., Zhou, B., et al. (2014). A successive three-point perturbation method for fast ray tracing in complex 2D and 3D geological models. Tectonophysics 627, 72–81. doi:10.1016/j.tecto.2014.02.012
Yang, X. S., Tian, X. B., Windley, B. F., Zhao, L., Lu, Y., Yuan, H., et al. (2022). The role of multiple trapped oceanic basins in continental growth: Seismic evidence from the southern Altaids. Geophys. Res. Lett. 49, e2022GL098548. doi:10.1029/2022GL098548
Yu, R. L., and Fu, H. (1993). Formation, evolution of Turpan-Hami basin and its petroliferous prospective evaluation. Xinjiang Pet. Geol. 14 (3), 217–227.
Zelt, C. A., and Smith, R. B. (1992). Seismic traveltime inversion for 2-D crustal velocity structure. Geophys. J. Int. 108, 16–34. doi:10.1111/j.1365-246x.1992.tb00836.x
Zelt, C. A., and White, D. J. (1995). Crustal structure and tectonics of the southeastern Canadian Cordillera. J. Geophys. Res. 100, 24255–24273. doi:10.1029/95jb02632
Zhang, D., Lu, Y. M., Ge, L. S., Wang, Z. H., Li, B., Fan, J. J., et al. (2015a). Metallogenic systems of polymetallic gold and copper deposits and related metallogenic geodynamic model in Karamaili of eastern junggar, Xinjiang. Geol. Rev. 61 (4), 797–816. doi:10.16509/j.georeview.2015.04.008
Zhang, Y., Li, Z., Nie, F., Tian, X., and Shi, Y. (2015b). Age, provenance and tectonic evolution of Late Paleozoic strata in Bogda Mountain, Xinjiang: Evidence from detrital zircon U-Pb geochronology. Chin. J. Geol. 50, 155–181. doi:10.3969/j.issn.0563-5020.2015.01.010
Zhang, Z. J., Klemperer, S., Bai, Z. M., Chen, Y., and Teng, J. W. (2011). Crustal structure of the Paleozoic Kunlun orogeny from an active-source seismic profile between Moba and Guide in East Tibet, China. Gondwana Research 19, 994–1007.
Zhang, Z. J., Bai, Z. M., Klemperer, S. L., Tian, X. B., Xu, T., Chen, Y., et al. (2013). Crustal structure across northeastern Tibet from wide-angle seismic profiling: Constraints on the Caledonian Qilian orogeny and its reactivation. Tectonophysics 606, 140–159. doi:10.1016/j.tecto.2013.02.040
Zhao, Z. H., Guo, Z. J., and Han, B. F. (2006). Comparative study on of the permian basalt from the beishan area, eastern Xinjiang uygur autonomous region and gansu province, and its tectonic significance. Acta Petrol. Sin. 22, 1279–1293. doi:10.3321/j.issn:1000-0569.2006.05.018
Zheng, M. L., Tian, A., Yang, T., He, W., Chen, L., Wu, H., et al. (2018). Structural evolution and hydrocarbon accumulation in the eastern Junggar Basin. Oil Gas Geol. 39 (5), 907–917. doi:10.11743/ogg20180506
Zhou, G. C., Wang, Y. W., Shi, Y., Xie, H. J., Li, D. D., and Guo, B. R. (2019). Geochronology and geochemistry of mafic intrusions in the Kalatag area, eastern Tianshan. Acta Petrol. Sin. 35 (10), 3189–3212. doi:10.18654/1000-0569/2019.10.14
Keywords: wide-angle seismic profiling, P-wave velocity structure, magmatism and metallogenesis, east Altai-Tianshan traverse, central Asian orogenic belt
Citation: Bai Z, Zhao L, Xiao W, Xu T and Badal J (2023) P-wave velocity structure and implications for magmatism and metallogenesis in the southern Altaids: Constraint from wide-angle seismic data along the Altai-Eastern Tianshan traverse. Front. Earth Sci. 11:1078434. doi: 10.3389/feart.2023.1078434
Received: 24 October 2022; Accepted: 13 February 2023;
Published: 24 February 2023.
Edited by:
Chunquan Yu, Southern University of Science and Technology, ChinaReviewed by:
Hanchao Jian, Woods Hole Oceanographic Institution, United StatesTianze Liu, University of California, San Diego, United States
Copyright © 2023 Bai, Zhao, Xiao, Xu and Badal. This is an open-access article distributed under the terms of the Creative Commons Attribution License (CC BY). The use, distribution or reproduction in other forums is permitted, provided the original author(s) and the copyright owner(s) are credited and that the original publication in this journal is cited, in accordance with accepted academic practice. No use, distribution or reproduction is permitted which does not comply with these terms.
*Correspondence: Zhiming Bai, bbzzmm@mail.iggcas.ac.cn