 Zhanqing Yu
 Shizhong Ma1
- 1School of Earth Science, Northeast Petroleum University, Daqing, China
- 2Exploration and Development Research Institute of Daqing Oilfield Company Ltd., CNPC, Daqing, China
The prediction of total organic carbon (TOC) content and grading evaluation of shale formation are very much significant and essential for reservoir description of rolling exploration and development in the new shale exploration area (Shuangcheng) in Songliao basin, China. In order to improve exploration efficiency and obtain continuous TOC content curve of wells, the variable coefficient △logR technique was developed for TOC estimating which is based on the two of acoustic time difference and deep lateral resistivity logging curve and the variable scale coefficient (K) between them as well as another scale coefficient (A) between TOC and △logR. A prediction model of TOC was established for the well which TOC is measured by evaluation of side wall cores, then apply it to other wells to verify the reliability of the model. The application result of eleven exploration Wells in Shuangcheng area show that the TOC of shale is linearly correlated with △logR, and the maximum prediction accuracy k value varies with wells, so it is necessary to determine the undetermined coefficient k according to a single well, but the A value having no big change from one well to another in similar sedimentary facies and thermal evolution degree of shale. The average relative error of TOC between prediction model and core measurement is 10.6% which verifies the accuracy of this method. On this basis of TOC prediction, we establish shale grading evaluation criteria for the study area. In the establishment process, not only the relationship between TOC and S1, but also vitrinite reflectance (Ro) are considered. The shale in Shuangcheng area can be divided into three types (Class I: TOC > 3.5% and Ro > 0.9%; Class II: TOC 2%–3.5% and Ro > 0.9; Class III: TOC < 2% or Ro < 0.9%), and achieved shale classification on the well profile with TOC and Ro which are easy to predict and reliable. According to the relationship between the thickness of shale of disparate classes and the total thickness of shale in different zones, the thickness of shale of disparate classes in each well is predicted.
1 Introduction
Organic matter in shale is not only the parent material for directly generating oil and gas resources, but also an indicator of the quality of shale reservoirs and the design of pressure protocols (Passey et al., 2010; Sondergeld et al., 2010; Wang et al., 2015). So, the study of geochemical characteristics of organic matter present within the rock is required to delineate the potential unconventional targets within shales. In the current years, source rock and geochemical data are mainly exclusive datasets produced by internal and/or external laboratories (Aziz et al., 2020). Such data are quite expensive and time taking that are difficult to manage and investigate geographically or statistically (Evenick, 2020). Therefore, by using logging data in addition to identify and evaluate source rocks by experiment testing methods (such as the TOC analysis, rock pyrolysis, elemental analysis, chromatography-mass spectrometry analysis, etc.) to identify the distribution of hydrocarbon source rock and accurately predicate interval shale geochemistry index is necessary (Banerjee et al., 2000; Ghassal et al., 2018; Wang et al., 2018; Cai et al., 2019).
In recent years, some scholars have attempted to evaluate the oil-bearing property (chloroform bitumen A) and maturity of shale utilizing logging data (Liu et al., 2014; Zhao et al., 2018), but total organic carbon (TOC) is still the recognized geochemical index that can be accurately evaluated by logging data. TOC content is generally measured by traditional methods such as the evaluation of side wall cores and formation cuttings in a geochemical lab. Data obtained from these experimental techniques are not continuous and also a time-consuming process (Aziz et al., 2020). Therefore, many scholars tried to use different logging-based methods to predict continuous TOC content and improve exploration efficiency. The logging-based methods can be generally divided into three categories. The first category involves establishing a regression analysis model directly with logging curves and geochemical indices which may include one or several radioactive logs (GR,U), porosity logs (Δt, DEN, and CNL), and lateral resistivity logs (Schmoker, 1979; Fertl and Rieke, 1980; Schmoker, 1981; Schmoker and Hester, 1983; Mendelzon and Toksoz, 1985; Fertl and Chilingar, 1988; Zhu et al., 2003; Herron et al., 2011; Hu et al., 2011); The second category involves constructing new parameters that respond to the TOC content, such as the carborlog method (Carpentier et al., 1991), △logR technique (Passey et al., 1990) and several improved △logR models (Liu et al., 2011a; Liu et al., 2015; Hu et al., 2015; He et al., 2016; Zhao et al., 2017; Liu et al., 2019; Zhu et al., 2019); The third category involves predicting the TOC by artificial intelligence, such as neural network, support vector machine, Gaussian process regression and other non-linear methods (Kamali and Mirshady, 2004; Kadkhodaie et al., 2009; Khoshnoodkia et al., 2011; Tan et al., 2015; Shi et al., 2016; Kadkhodaie et al., 2017; Yu et al., 2017; Shalaby et al., 2019).
Field applications reveal that the multiple regression and machine learning methods can provide a high accuracy for training samples (Hu et al., 2011; Khoshnoodkia et al., 2011; Mahmoud et al., 2017; Yan et al., 2017; Shalaby et al., 2019). However, when the trained models were applied to new wells or new areas, their accuracy decreased because these methods have no theoretical basis and suffer from overftting (Passeyet al., 1990). On the contrary, the ΔlogR method is based on the petrophysical model derivation and includes fewer well logs (redundant information), and its TOC quantification performance is relatively good. Many scholars have focused on the improvement of the ΔlogR model to enhance its TOC prediction accuracy. In addition to replacing the level of organic metamorphism (LOM) using an easily accessible parameter (Tmax or Ro) (Wang et al., 2015), almost all of the modifcations have focused on how to overlay the sonic transit time and the resistivity logs. Liu et al. (2015), Liu et al. (2014) noted that using a fixed overlay-coefficient for all of the wells is not always appropriate, because the k value that minimizes the error of the TOC prediction may be different for different wells in different Basins. Hu et al. (2011) also noted that using a fixed overlay-coefficient may lead to large errors in shale formations with large lithology changes. Wang et al. (2015) calculated the overlay-coefficient from theoretical models, in which several key parameters must be determined from the rock minerals and a complex petrophysical model. Although such modifcations have different theoretical bases, their essence is to determine a proper method of overlaying the logging curves and producing a higher correlation between the‘ΔlogR’and the core TOC. However, the current methods of determining the overlay-coefficient based on the rock minerals, empirical parameters (sonic transit time of the rock minerals), and complex petrophysical calculations, which are even less accessible than the measured TOC, weaken the applicability or the accuracy of the ΔlogR model (including the modified ΔlogR models).
In this study, we improve the application and accuracy of △logR model related with conventional geochemical data to carry out the prediction of TOC and classification evaluation of shale. A simple and feasible method, the V-ΔlogR model is proposed based on three revisions to the
ΔlogR model. i.e., replacing the fixed overlay-coefficient with a variable one, removing the maturity, and replacing the baselines with a single one. Among these, a critical improvement is treating the overlay-coefficient (k) as a variable and determining it from the measured TOC values or from well logs. The application of our improved model in the Songliao basins indicates that the V-ΔlogR model can accurately predict the TOC of shale with large lithological and mature variations. Because it uses actual geological data to determine the overlay-coefficient in the model, the V-ΔlogR model offers more reliable results for test wells than other commonly used models (e.g., the modified Schomoker, multiple regression analysis, modified ΔlogR). The V-ΔlogR model eliminates the need for mineral and maturity data constraints and the overlay-coefficient can be determined using only the well logs, which significantly expands the applicability of the ΔlogR method.
2 Methodology
2.1 Background
Passey et al. (1990) proposed a method for calculating the TOC by overlaying a properly scaled porosity curve (generally the sonic transit time curve) over a resistivity curve and baselined them in clay-rich, organics-poor, and fine-grained rock intervals (Liu et al., 2020). The mathematical expressions that were used by Passey for the calculation of ΔlogR summarized in Eqs 1, 2 and widely used for evaluating the unconventional resources (Mahmoud et al., 2017).
Where ΔlogR is the curve separation measured in logarithmic resistivity cycles; R is the resistivity measured in Ω·m using the logging tool; Δt is the measured sonic transit time in μs/ft; and Rb is the resistivity corresponding to the Δtb value when the curves are baselined in non-source,clay-rich rocks. The LOM can be obtained from core sample analysis, such as the vitrinite refiectance or Tmax (Passeyet al., 1990).
The ΔlogR separation in the source rock and non-source rock intervals can be distinguished using the natural gamma-ray curve (Passeyet al., 1990). For clay-rich rocks, they proposed an empiricalequation for calculating the TOC from ΔlogR:
where TOC is the total organic carbon content measured in wt%; and LOM is the maturity.
2.2 V-△logR model
The V-△logR technique was proposed and improved by Liu et al. (2011b); Liu et al. (2014); Liu et al. (2019). This model includes three revisions to the ΔlogR model. 1) Replace the fixed overlay-coeffcient (0.02) with a variable one, and determine it according to the actual geological data (TOC and well logs). 2) Remove the maturity (LOM) from the model. 3) Determine the baseline from the ΔlogRV curve, instead of determining it from the sonic and resistivity curves.
Here, ΔlogRv is the curve separation measured in logarithmic resistivity cycles; R is the deep lateral resistivity (Ω·m); p is the sonic transit time, bulk density, or neutron log. k is a variable that ranges from 0 to 1; baseline is the baseline value of the ΔlogRv curve; b is the background value of the TOC content; and α is a coeffcient calculated using a mathematical tool.
2.2.1 A variable overlay-coeffcient
In the V-ΔlogR model, the overlay-coeffcient (k in Eq. 3) is a variable, which was determined according to the actual geological data. In this method, k is the logging response of the non-organic elements, which should be eliminated from the ΔlogR separation as the porosity and resistivity logs also respond to other non-organic elements, such as rock minerals, formation water salinity, and formation pressure (Wang et al., 2015; Zhu et al., 2019). Under geological conditions, non-organic elements can be very complex and may vary significantly from place to place. Thus, the value of k should also change with the geological conditions. Based on the above analysis, it can be concluded that a proper k value can remove the non-organic response in the ΔlogR separation. Due to the strong heterogeneity of hydrocarbon generation and expulsion process of source rocks, and the factors that interfere with TOC logging response under geological conditions are complex (including lithology, physical properties, fluid salinity, etc.), the K value that leads to the best TOC prediction effect often changes with different wells (Liu et al., 2015; Chen et al., 2017; Liu et al., 2019). For this reason, it is often necessary to determine k value based on a single well, rather than using a fixed k value uniformly for entire area of interest. In cases where TOC for core test is available, the coefficient k can be determined by an exhaustive method (based on core and logging) (Liu, 2011a; Liu et al., 2015). If measured TOC data cannot be obtained, the variable coefficient △LogR model provides a method to calculate TOC independently of measured TOC data. i.e., logR-AC (using only logging curves) intersection method (Liu et al., 2015; Liu et al., 2019). In this study, we first set the average value of acoustic logging curve and logarithmic resistivity curve as 2, then we determine k value with the exhaustive method or the “logR-Δt” crossplot method (see the example analysis below). Once the k value is determined, combining with the gamma-ray curve to distinguish the △logR of the shale and the non-shale section, we calculate △logRv according to Formula (3).
2.2.2 Removing maturity from the model
Passey et al. (1990) noted that ΔlogR is linearly related to the TOC content and is a function of maturity. However, our analysis indicates that maturity can be removed from the model. First, the increase in the resistivity response in mature and clay-rich continental shales is not signifcant (probably related to high clay contents, high bound water contents, and overpressure) (Liu et al., 2019). Second, it is cumbersome to determine the LOM of each depth point, and may be inaccurate in cases where test data is unavailable. Third, the 10 (2.297–0.1688 × LOM) term in Eq. 2 is approximately a fixed value if the LOM changes little throughout a well profile, and it can be replaced by a fixed value calibrated from the TOC measured from the core samples. In a case where the maturity flfluctuate significantly over a long profile, the profile can be divided into several subsections that each contain small maturity changes.
2.2.3 A single baseline
In the V-ΔLogR model, the baseline appears around the valley of the ΔLogRv curve and corresponds to the organic-lean and clay-rich intervals. This method is essentially consistent with Passey’s approach (Passeyet al., 1990), except that it avoids determining the baselines twice (i.e., for the porosity log and resistivity curve). Therefore, the baseline values are determined which are generally occur in fine-grained non-oil-producing zones according to the shape of △logR curve.
2.2.4 Coefficient α and b
The coefficients α and b are undetermined coefficients. Chen et al. (2017) pointed out that the coefficient α is related to the depositional environment of shale. When the maturity is basically the same, the α value of lacustrine shale is larger than that of delta front shale. Liu et al. (2019) proposed a prediction method for α in formation with strong sediment phase change, which can achieve the prediction of α value in the absence of experimental test TOC b corresponds to the background value of organic carbon content (△TOC) in the △log technique proposed by Passey. In this study, the α and b coefficients in Eq. 2 were determined by Linear regression analysis. In order to avoid the introduction of large systematic errors when applied to other wells, it is recommended that the value of b should not exceed the lower limit of the TOC of the source rock.
3 Application examples and discussions
3.1 Geologic setting and lithostratigraphy
The Songliao basin is located in the northeastern part of China (Figure 1A), and the Shuangcheng area is located in the eastern fault depression zone in the northern part of the Songliao Basin (Figure 1B). The study area described in terms of structural elements in the Shuangcheng sag which is sub-element within the Shuangcheng area. The strata with clastic rocks in the Shuangcheng sag include the Yingcheng Formation and the Denglouku Formation, The fourth member of the Yingcheng Formation develops black shale considered to be rich potential source rocks for hydrocarbons (Figure 2). Since 2017, a suite of organic-rich shale has been discovered in the southern sag of the Shuangcheng region (Huang et al., 2015; Yin et al., 2018). This set of shale has strong hydrocarbon-generating capacity, because it was discovered in the sandstone of the Denglouku Formation, and the shale is oil, and the natural productivity of a single well can reach up to 91 t/d, The shale rich in organic matter is developed in the fourth member of the Yingcheng Formation. The shale is deposited in the freshwater environment of continental semi-deep lake-deep lake, with a thickness of 20 m–120 m. Previously, this set of shale was mainly studied as a source rock, and it was not used as a shale oil exploration object until 2019.

FIGURE 1. Flowchart of calculating TOC content of shale by the V-△logR model.
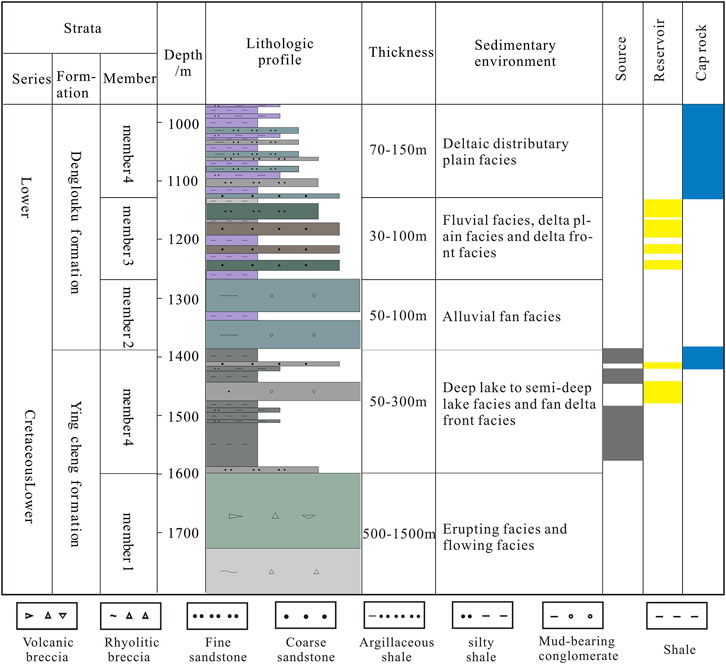
FIGURE 2. (A) Overview map showing the location (B) Stratigraphic map of the study area. (C) Locations of exploration wells included in the database.
3.2 Geochemical and well logging responses of shale
The total organic carbon, Rock eval pyrolysis and vitrinite reflectance (Ro) data involved in this study were collected from Key Research Laboratory on Tight Sandstone and Shale Oil Reservoir Forming. The data were obtained from core samples of 11 Wells in the Shuangcheng area which are used to determine the origin, content, and maturity level of the organic matter present in a shale. The depth of the data ranges from 1,241.00 m to 1796.35 m, and the well locations are shown in Figure 3C. In order to avoid the volatilization of light hydrocarbons in shale, Rock eval pyrolysis and TOC tests of core samples were carried out soon after drilling and coring. Analysis data from two typical exploration wells were shown on Supplementary Table S1. These data revealed that the TOC of shale in Shuangcheng area ranged from 0.78% to 6.38%, with an average of 2.86% (Figure 4A). S1 ranged from 0.05 mg/g-1.65 mg/g (average 0.58 mg/g), and S2 ranged from 0.36mg/g-16.36 mg/g (average 6.35 mg/g). The measured Ro is between 0.82% and 1.31%, indicating that shale has entered a mature evolution stage, and Ro increases regularly with the increase of depth (Figure 4C). Figure 5 shows geochemical analysis data and conventional logging curves of typical exploration wells in Shuangcheng area. Shale segments correspond to higher gamma values (typically greater than 140API), which can be used to distinguish shale from non-shale.

FIGURE 3. Generalized stratigraphic column for deep formation in the study area.
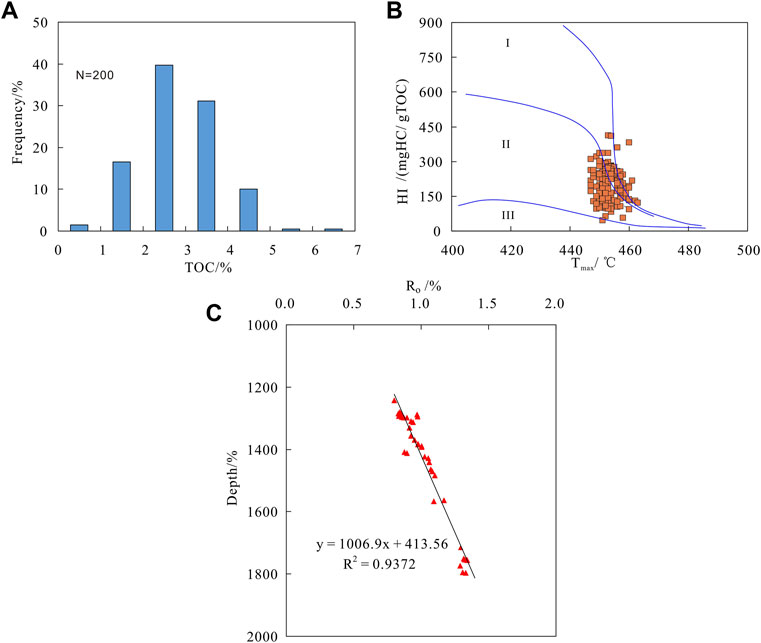
FIGURE 4. Geochemical characteristics of shale in the Yingcheng formation of the study area, (A) Histograph of TOC, (B) Crossplot showing Tmax versus HI plot used as a kerogen type and thermal maturity indicator , (C) The relationship between Ro and depth indicates that the shale is in the oil generation window.
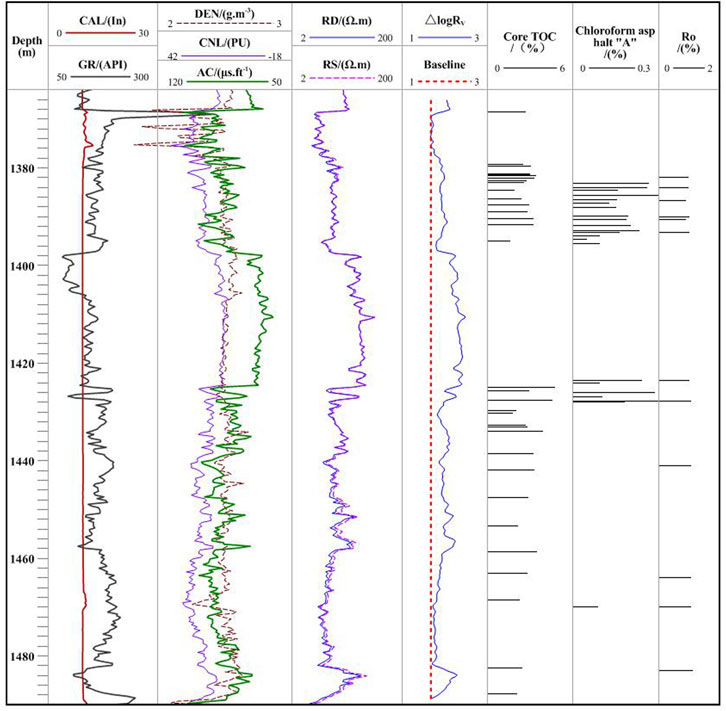
FIGURE 5. Organic heterogeneity and logging response of shales in the Yingcheng Formation of the study area.
The acoustic time of shale is relatively high, mainly between 70 μs/ft-100 μs/ft. The density of shale is mainly between 2.46 g/cm3 and 2.52 g/cm3, which is slightly less than that of sandstone. However, the density curve was greatly affected by hole collapse (e.g., 1,366 m–1378 m), so it was not used to predict the total organic carbon. The deep lateral resistivity of shale is lower than that of sandstone, but the resistivity of shale does not show the obvious positive anomaly as Marine shale, and even shows a slight negative anomaly, even when the shale is mature and contains liquid hydrocarbons (e.g., 1,460 m–1480 m chloroform bitumen A 0.049%–0.361%).
3.3 Establishment of the model
Two typical wells (well S59 and well S70) in the targeted area with core TOC measurements were randomly selected to establish and vertify the prediction model of TOC, and the remaining 9 wells were used for model validation. The key point to establish the model is to obtain the parameters of the V-ΔlogR methods described in process 3.3. Therefore, we determine the parameters in Eq. 3 of the V-ΔlogR model separately. Combined with the TOC evaluation standard of Lacustrine shale (SY/T 5735-1995), the value b should not exceed the lower limit of organic matter abundance of source rock (< 0.4%). As the value b has little influence on the prediction accuracy of TOC of shale. We mainly discuss the coefficients k, baseline and α in the V-ΔlogR model.
3.3.1 Determination of the optimal k value
Coefficient k was determined by exhaustive method (based on the core sample and logging data) and “logR-AC” intersection (using logging data only). Figures 6A, B are the crossplots of the coefficient R2 and k between the predicted TOC and core TOC determined by the exhaustive method proposed by Liu et al. (2015). The figure shows that as the k value increases, the determination coefficient R2 increases first and then decrease, so, this shows that there is an optimal K value which makes the predicted TOC agree with the core TOC best an optimal k value that gives the highest coincidence between predicted TOC and core TOC. The k value corresponding to the peak values of the determined coefficients R2 in Figures 6A, B are 0.65 and 0.12, respectively. The obvious difference between them indicates that it is necessary to determine the k value according to every single well in Shuangcheng area for accurate prediction of shale TOC; Figures 6C, D show the k predicted by “LogR-AC” intersection for S59 and S70 Wells. The data points in the figure are the acoustic time difference and log resistivity corresponding to the points near the baseline (baseline ± 20%; if there is a significant deviation from the trend, the point should be excluded). The lithology is no organic matter or low organic matter shale or silted shale. The slope of the fitting formula in Figures 6C, D (absolute value, negative sign indicates that a curve decreases as the other curve increases) is basically consistent with the k value corresponding to the peak value in Figures 6A, B, indicating that the k value predicted by “LogR-AC” intersection is reliable. Therefore, we applied this approach to all Wells in the targeted area and ultimately determined the optimal k value for each well, and the coefficient k predicted by LogR-AC intersection method for other wells is shown in Supplementary Table S2.
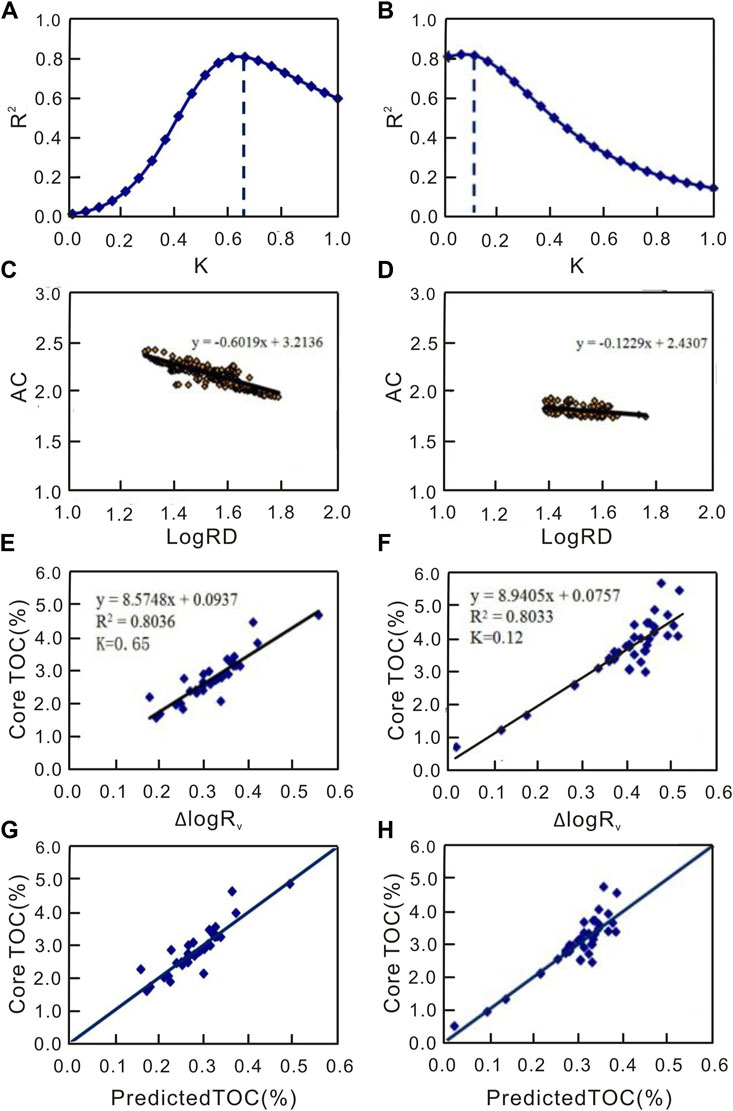
FIGURE 6. TOC prediction model and prediction results of typical exploration wells. (A) Determination coefficient (R2) between predicted TOC and core TOC and its variation with K for well S59. (B) Determination coefficient (R2) between predicted TOC and core TOC and its variation with K for well S70. (C) Crossplot of “LogRD-AC” of well S70, the absolute value of the slope of the crossplot is the prediction K. (D) Crossplot of “LogRD-AC” of well S59, the absolute value of the slope of the crossplot is the prediction K. (E) Crossplot of △LogRV and core TOC in S59 well. (F) Crossplot of △LogRV and core TOC in S70 well. (G) Crossplot of logging prediction TOC and core TOC in S59 well. (H) Crossplot of logging prediction TOC and core TOC in S70 well.
3.3.2 Determination of the baseline
Substitute the calculated k value into Eq. 3 to calculate the △logR value of each well, and then uses the morphology of △logRv curve to determine the baseline of the V-△logR. The thickness of the target layer is relatively thin (generally less than 200 m), lead to the fluctuation of the acoustic time difference and resistivity curve is not obvious, so the baseline value is relatively stable. Taking well S59 as an example, the baseline position corresponds to a small △logRv value, and the lithology is mainly low organic matter shale. The baseline value for well S59 was 1.63 (the red line 5 in Figure 5). Baseline values for other Wells are shown in Supplementary Table S2.
3.3.2 Determination of the coefficient α
The coefficient α is determined according to the least square method. Figures 6E, F show that the coefficients α obtained by least squares fitting method for S59 (K = 0.65) and S70 (K = 0.12) are 8.58 and 8.94, respectively. The shale of the 4th member of Yingcheng Formation was deposited in a relatively stable lacustrine environment, which may be the reason for the relatively close α value. Figures 5G, H show that the TOC calculated by the model is in good agreement with the TOC of the core.
3.4 Model verification
In the model validation process, coefficient A was calculated using the value of the adjacent well, while K was calculated using the logging curve of the well (Supplementary Table S2). The prediction model was applied to nine retention wells. The model of well S59 was applied to well Sx67, S71, and Sx74 in the same eastern slope zone. The prediction model established in S70 well in the western slope zone was applied to S66 well, S661 well, S68 well, S72 well, S76 well and S83 well, which also belong to the western slope zone. The cross plot of TOC calculated by V-△logR model and TOC predicted by core for all Wells in the study area shows that TOC calculated by model and TOC predicted by core are distributed around Y=X, with a determination coefficient of 0.83 and an average relative error of 11.06% (Figure 7).
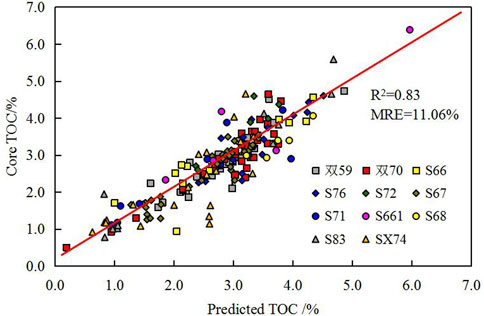
FIGURE 7. The relationship between core TOC and TOC predicted by V-△LogR model.
In Supplementary Table S2, the determination coefficients of the predicted TOC and core TOC of the single well model ranged from 0.57 to 0.93, and the relative average errors ranged from 7.13% to 25.31%. In addition to the S74 well prediction error is relatively large (R2 = 0.57 and MRE = 25.31%), the overall anastomosis effect is also good. In general, the established prediction model can accurately predict the TOC of surrounding wells, and the TOC of prediction model is consistent with the TOC of core in well profile.
3.5 Grading evaluation of shale
Shale grading evaluation usually considers reservoir oil-bearing property evaluation and recoverable factors (Lu et al., 2012). Since there is little difference in the content of mineral components in shales in the study area, this shale grading evaluation is mainly carried out based on the difference in oil content of shales. Rock pyrolysis index S1 represents the amount of hydrocarbons that have been generated and remain in the shale. Although S1 lacks heavy components and some light components are lost during sample collection, it is still one of the more intuitive and reliable indicators to characterize shale oil content (Lu et al., 2012; Li et al., 2015). Given the difficulty of accurately predicting S1 from well logging data, a feasible approach is to establish relationships with more readily available indicators (including TOC, organic matter type and Ro) that are closely related to S1, and then use these easily available indicators to characterize shale oil content and to carry out shale grading evaluation. For example, Lu et al. (2012) carried out shale grading evaluation through the relationship between TOC and S1.
The shale maturity parameter (Ro) was also used in grading evaluation in addition to the relationship between S1 and TOC. By discussing the relationship between S1 and TOC and Ro, shale in Yingcheng Formation can be divided into three categories. Type I (TOC > 3.5%, Ro > 0.9%) shale is characterized by a slight increase in S1 or a steady increase in TOC (Figure 8A), and most samples have high S1 values (Y is generally greater than 0.7 mg/g). Samples in this interval have high organic matter abundance and hydrocarbon generation ability. When TOC is greater than 3.5%, S1/TOC shows a downward trend (Figure 7B), indicating that the hydrocarbon generation content in these shale has exceeded the adsorption capacity, and the excess hydrocarbon is expelled (Li et al., 2019), which also indicates that the oil has relatively good mobility. In Figure 8A, some samples with TOC greater than 3.5% and still with low S1 values were expelled from type I shale. Because of their low maturity (Ro is typically less than 0.9%), they do not have sufficient hydrocarbon and have not yet reached the hydrocarbon expulsion threshold (Ro=0.9%) shown in Figures 8C, D. The S1 of type II shale (TOC between 2% and 3.5%) increases rapidly with the increase of TOC, indicating that the oil content (hydrocarbon generation capacity) of shale increases with the increase of TOC. Class II shale also include shale with TOC > 3.5 and Ro less than 0.9. The saturation degree of adsorbed hydrocarbon of type II shale should be lower than that of type I shale and the mobility should be lower than that of type I shale. The S1 of Class III (TOC < 2.0%) shale increases slowly with the increase of TOC, and shalewith different evolution degrees have lower S1 values, mainly because they have lower organic matter abundance and hydrocarbon generation capacity.
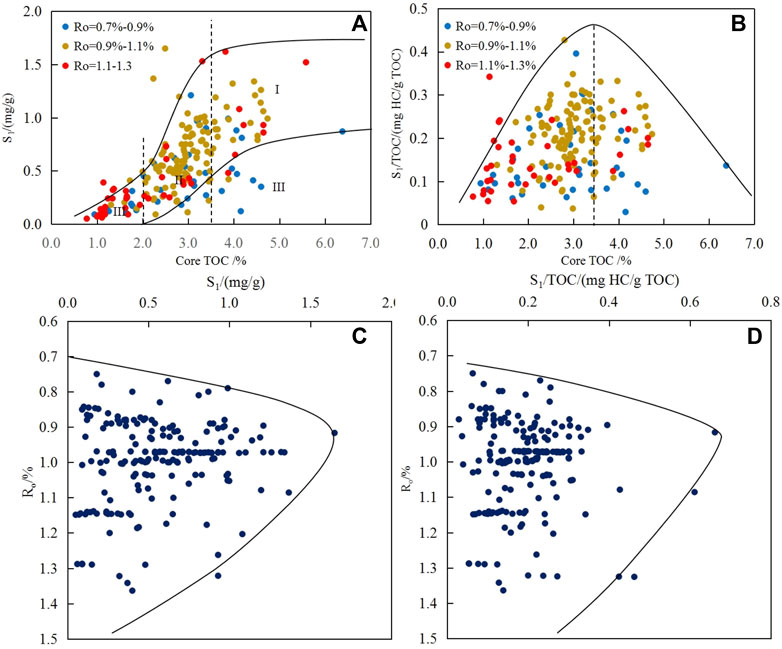
FIGURE 8. Grading evaluation of shale in the study area: (A) Crossplot of S1, TOC, Ro of samples of shale from the study area, indicting that S1 increases with the increase of TOC; (B) Crossplot of S1/TOC,TOC, Ro, S1/TOC decreases rapidly when TOC exceeds 3.5%, indicating that hydrocarbon expulsion has occurred; (C) The crossplot of S1 and Ro shows that the inflection point of S1 from increasing to decreasing indicates that the hydrocarbon expulsion threshold is Ro = 0.9%; (D) The crossplot of S1/TOC and Ro shows that the inflection point of S1/TOC from increasing to decreasing indicates that the hydrocarbon expulsion threshold is Ro = 0.9%.
3.6 Thickness distribution of shale
Based on the calculation of TOC of 11 wells in the study area, combined with the shale grading limits in Figure 7A, the distribution of different grades of shale is identified on the well profile, and the thickness is calculated. As shown in the typical interwell profile in Figure 9, the development frequency of type I shale is relatively low, and the top, middle and bottom of the fourth member of the Yingcheng Formation are all developed. The continuous thickness of single layer is generally no more than 5 m, and the thickness ratio revealed by drilling (cumulative thickness of type I shale/total thickness of shale) is generally 10%–20%. The thickness of class II shale monolayer is generally 10 m–20 m, and the cumulative thickness of a single well is 40%–60%. The monolayer thickness of shale of Class III is generally less than 5 m, and the cumulative thickness of a single well is generally 20%–30%.
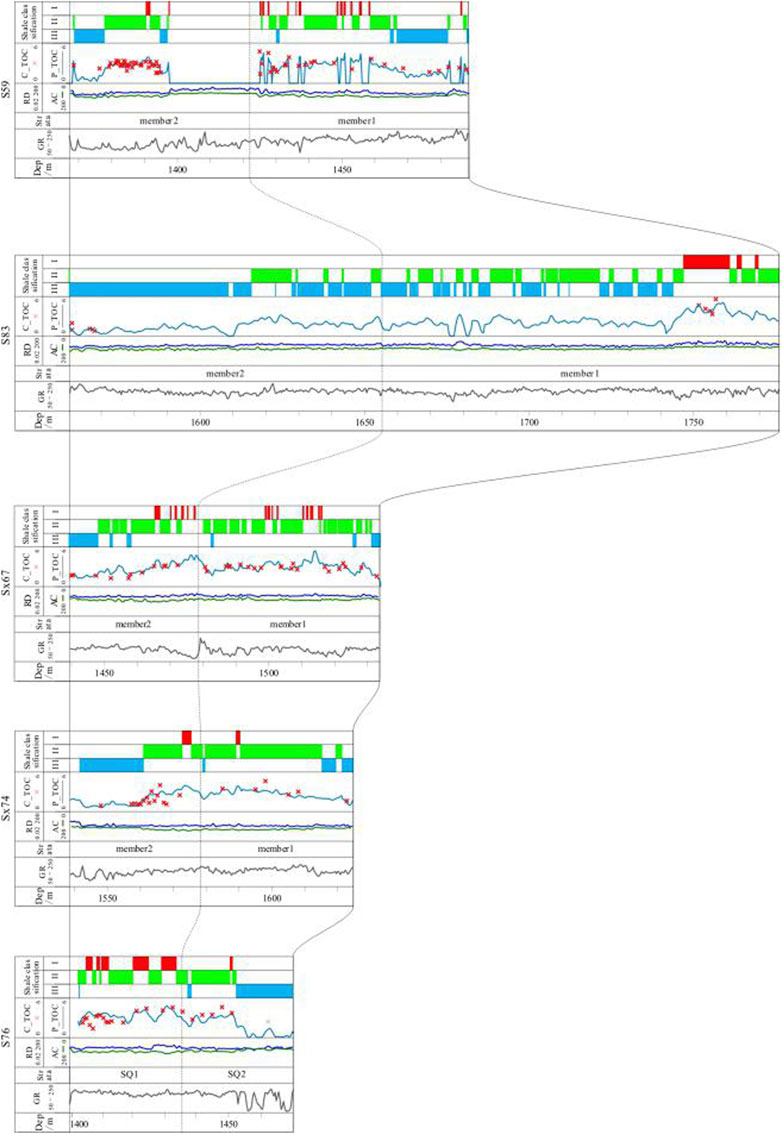
FIGURE 9. Comparison of TOC predicted by logging on well profile and TOC of core and the identification of different grades of shale.
By statistical analysis of the relationship between the thickness of different grades of shale and the total thickness of shale, we established a method conducive to predict the thickness of different grades of shale. As shown in Figure 10, the determination coefficient between the thickness of different grades of shale and the total shale thickness exceeds 0.91, indicating that the thickness of different grades of shale can be predicted by the total shale thickness. The quantitative relationship between the two was established based on the zonal zone. For areas lacking drilling, the thickness of shale in each grade was predicted based on the total shale thickness predicted by the combination of well vibration (Sun et al., 2019) (Figure 11). The results show that the thickness of class I shale is generally 5 m–15 m, class II shale is generally 20 m–80 m, and class III shale is generally 10 m–40 m.
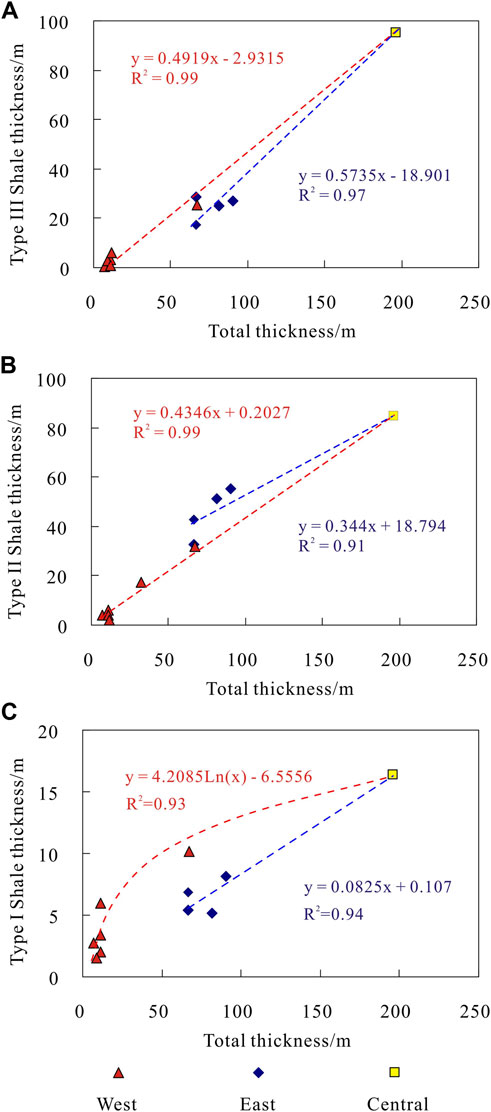
FIGURE 10. The prediction of thickness distribution of different grades of shale. (A) Relationship between the thickness of class III shale and the total thickness of shale; (B) Relationship between the thickness of class II shale and the total thickness of shale; (C) Relationship between the thickness of class I shale and the total thickness of shale.
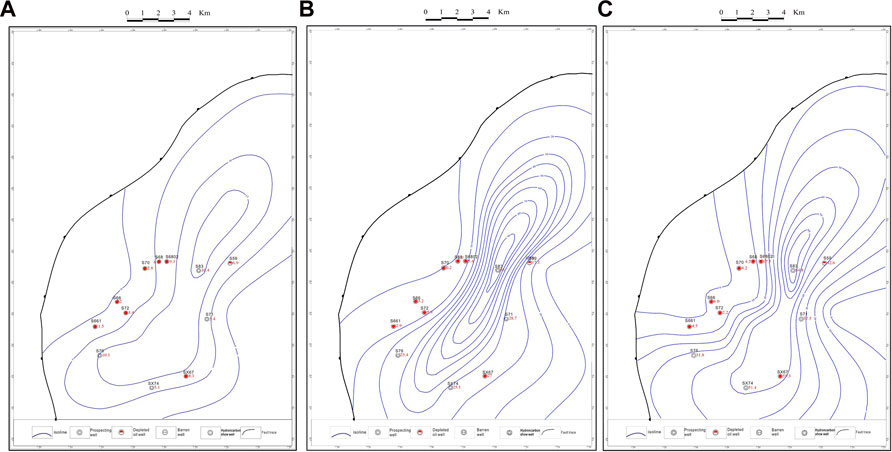
FIGURE 11. The thickness distribution of different grades of shale in Shuangcheng area. (A) Horizontal distribution of cumulative thickness of class III shale. (B) Horizontal distribution of cumulative thickness of class II shale. (C) Horizontal distribution of cumulative thickness of class I shale.
4 Conclusion
In this study, V-△logR method was applied to TOC prediction and grading evaluation of lacustrine shale in Shuangcheng area, Songliao Basin. The prediction model of total organic carbon (TOC) is established by using the acoustic and the deep lateral resistivity curve and the variable scaling coefficient (k) between them and another scaling coefficient (A) between TOC and △logR. Although the shale in Shuangcheng area is rich in organic matter and in the oil generation window exhibits high natural gamma and high acoustic time difference, however, it shows a unique logging response of medium to low resistivity. The application results show that it is necessary to determine the undetermined coefficient K for individual wells, even in the formation with stable sedimentary facies and low maturity fluctuations, because the value of K that achieves the highest TOC prediction accuracy varies significantly but the undetermined coefficient A varies little from well to well. According to the very close relationship between oil content (S1) and TOC and considering the degree of thermal evolution (Ro), shales in Shuangcheng area are divided into three categories. The TOC of well logging prediction provides a reliable basis for the evaluation of shale grading on well profile and the prediction of shale thickness distribution at each grade on the plane. The application results of 11 exploration wells in Shuangcheng area show that the variable coefficient △logR method can accurately predict TOC of lacustrine shale and guide shale grading evaluation.
Data availability statement
The original contributions presented in the study are included in the article/Supplementary Material, further inquiries can be directed to the corresponding author.
Author contributions
ZY: Design research ideas, application, and implementation. CL: Method improvement and optimization. SM: Comprehensive design and guidance.
Funding
This study was supported by the National Natural Science Foundation of China (Nos 41772131 and 41672130), the National Science and Technology Major Project (2017ZX05049005-005, 2016ZX05029002002, and 2016ZX05061), and the Fundamental Research Funds for the Central Universities (14CX02224A and 17CX02057).
Acknowledgments
The authors would like to thank the editors and reviewers for their valuable suggestions for this paper.
Conflict of interest
ZY was employed by Exploration and Development Research Institute of Daqing Oilfield Company Ltd.
The remaining authors declare that the research was conducted in the absence of any commercial or financial relationships that could be construed as a potential conflict of interest.
Publisher’s note
All claims expressed in this article are solely those of the authors and do not necessarily represent those of their affiliated organizations, or those of the publisher, the editors and the reviewers. Any product that may be evaluated in this article, or claim that may be made by its manufacturer, is not guaranteed or endorsed by the publisher.
Supplementary material
The Supplementary Material for this article can be found online at: https://www.frontiersin.org/articles/10.3389/feart.2023.1066155/full#supplementary-material
References
Aziz, H., Ehsan, M., Ali, A., Khan, H. K., and Khan, A. (2020). Hydrocarbon source rock evaluation and quantification of organic richness from correlation of well logs and geochemical data: A case study from the sembar formation, Southern Indus Basin, Pakistan. J. Nat. Gas Eng. 81, 103433.
Banerjee, A., Jha, M., Mittal, A. K., Thomas, N. J., and Misra, K. N. (2000). The effective source rocks in the north cambay basin, India. Mar. Petroleum Geol. 17 (10), 1111–1129.
Cai, L., Xiao, G., Guo, X., Wang, J., Wu, Z., and Li, B. (2019). Assessment of mesozoic and upper paleozoic source rocks in the south yellow sea basin based on the continuous borehole csdp-2. Mar. Petroleum Geol. 101, 30–42. doi:10.1016/j.marpetgeo.2018.11.028
Carpentier, B., Huc, A. Y., and Bessereau, G. (1991). Wireline logging and source rocks estimation of organic carbon by the Carbolog method. Log. Anal. 32 (3), 279–297.
Chen, H. F., Wang, F. Q., Min, W., and Yu, H. Y. (2017). TOC evaluation using variable-coefficient ΔlogR model. J. China Univ. Petroleum 41 (4), 54–64.
Fertl, W. H., and Chilingar, G. V. (1988). Total organic carbon content determined from well logs. Eval 3 (2), 407–419. doi:10.2118/15612-pa
Fertl, W. H., and Rieke, H. H. (1980). Gamma ray spectral evaluation techniques identify fractured shale reservoirs and source-rock characteristics. J. Pet. Technol. 32 (11), 2053–2062. doi:10.2118/8454-pa
Ghassal, B. I., Littke, R., Atfy, H. E., Sindern, S., Scholtysik, G., and Beialy, S. E. (2018). Source rock potential and depositional environment of upper cretaceous sedimentary rocks, abu gharadig basin, Western desert, Egypt: An integrated palynological, organic and inorganic geochemical study. Int. J. Coal Geol. 186, 14–40. doi:10.1016/j.coal.2017.11.018
He, J. H., Ding, W. L., Zhang, J. C., Li, A., Zhao, W., and Dai, P. (2016). Logging identification and characteristic analysis of marine–continental transitional organic-rich shale in the carboniferous-permian strata, bohai bay basin. Mar. Petroleum Geol. 70, 273–293. doi:10.1016/j.marpetgeo.2015.12.006
Herron, M., Grau, J., Herron, S., Kleinberg, R., Machlus, M., and Reeder, S. (2011). Total organic carbon and formation evaluation with wireline logs in the Green River Oil Shale. Plasma Phys. Control. Fusion 46 (3), 593–609. doi:10.2118/147184-MS
Hu, H. T., Liu, C., and Lu, S. F. (2015). The method and application of using generalized-ΔlgR technology to predict the organic carbon content of continental deep source rocks. Acta Geol. Sin. 89, 393–394. doi:10.1111/1755-6724.12306_14
Hu, H. T., Lu, S. F., Liu, C., Wang, W. M., Wang, M., Li, J. J., et al. (2011). Models for calculating organic carbon content from logging Information:comparison and analysis. Acta Sedimentol. Sin. 29, 1199–1207.
Huang, R., Wang, Y., Cheng, S., Liu, S., and Cheng, L. (2015). Selection of logging-based toc calculation methods for shale reservoirs: A case study of the jiaoshiba shale gas field in the sichuan basin. Nat. Gas. Ind. B 2, 155–161. doi:10.3787/j.issn.1000-0976.2014.12.003
Kadkhodaie, A., Bolandi, V., and Farzi, R. (2017). Analyzing organic richness of source rocks from well log data by using svm and ann classifiers: A case study from the kazhdumi formation, the Persian gulf basin, offshore Iran. J. Petroleum Sci. Eng. 151, 224–234. doi:10.1016/j.petrol.2017.01.003
Kadkhodaie, A., Rahimpour-Bonab, H., and Rezaee, M. (2009). A committee machine with intelligent systems for estimation of total organic carbon content from petrophysical data: An example from the kangan and dalan reservoirs in south pars gas field, Iran. Comput. Geosci. 35 (3), 459–474. doi:10.1016/j.cageo.2007.12.007
Kamali, M. R., and Mirshady, A. A. (2004). Total organic carbon content determined from well logs using ΔLogR and Neuro Fuzzy techniques. J. Petroleum Sci. Eng. 45, 141–148. doi:10.1016/j.petrol.2004.08.005
Khoshnoodkia, M., Mohseni, H., Rahmani, O., and Mohammadi, A. (2011). TOC determination of gadvan formation in south pars gas field: Using artificial intelligent systems and geochemical data. J. Pet. Sci. Eng. 78 (1), 119–130. doi:10.1016/j.petrol.2011.05.010
Li, J. J., Yan, X. T., Wang, W. W., Zhang, Y. N., Yin, J. X., Lu, S. F., et al. (2015). Key factors controlling the gas adsorption capacity of shale: A study based on parallel experiments. Appl. Geochem. 58, 88–96. doi:10.1016/j.apgeochem.2015.03.009
Li, Y., Zhang, J. l., Liu, Y., Shen, W. L., Chang, X. C., Sun, Z. Q., et al. (2019). Organic geochemistry, distribution and hydrocarbon potential of source rocks in the paleocene, lishui sag, east China sea shelf basin. Mar. Petroleum Geol. 107, 382–396. doi:10.1016/j.marpetgeo.2019.05.025
Liu, C. (2011a). Evaluating source rock using logging data—improvement and application. China: DaQing: Northeast Petroleum University.
Liu, C., Lu, S. F., Huang, W. B., and Wang, W. M. (2011b). Improvement of △logR and its application in source rocks evaluation. Petroleum Geol. Oilfield Dev. Daqing 30 (3), 27–31. doi:10.3969/J.ISSN.1000-3754.2011.03.006
Liu, C., Lu, S. F., and Xue, H. T. (2014). Variable-coefficient ΔlogR model and its application in shale organic evaluation. Prog. Geophys. 29, 312–317. doi:10.6038/pg20140144
Liu, C., Sun, L. D., Li, J., Lu, S., Tian, L., Liiu, P., et al. (2019). Evaluation of the TOC of source rocks in lacustrine basins using the variable-coefficient ΔLg R technique-A case study of the xujiaweizi fault depression in the Songliao Basin. Interpretation 7 (86), 1–24. doi:10.1190/INT-2018-0197.1
Liu, C., Sun, L. D., Lu, J. M., Sun, Y., Xu, Y., Lu, M. X., et al. (2020). Characteristics of the newly found oil-bearing sandstone in the Denglouku formation of the northern Songliao Basin, China. J. Petroleum Sci. Eng. 188, 106947–107014. doi:10.1016/j.petrol.2020.106947
Liu, C., Yin, C. H., and Lu, S. F. (2015). Predicting key parameters for variable-coefficient Δ lgR logging technique and its application in source rocks evaluation. Nat. Gas. Geosci. 26, 1295–1231. doi:10.11764/j.issn.1672-1926.2015.10.1925
Lu, S. F., Huang, W. B., Chen, F. W., Li, J. J., Wang, M., Xue, H. T., et al. (2012). Classification and evaluation criteria of shale oil and gas resources: Discussion and application. Petroleum Explor. Dev. 39 (2), 268–276. doi:10.1016/s1876-3804(12)60042-1
Mahmoud, A. A. A., Elkatatny, S., Mahmoud, M., Abouelresh, M., Abdulraheem, A., Ali, A., et al. (2017). Determination of the total organic carbon (TOC) based on conventional well logs using artifcial neural network. Int. J. Coal Geol. 179, 72–80.
Mendelzon, J. D., and Toksoz, M. N. (1985). “Source rock characterization using multivariate analysis of log data,” in SPWLA 26th Annual Logging Symposium, Louisiana, June 22-26.
Passey, Q., Creaney, S., Kulla, J., Moretti, F., and Stroud, J. (1990). A practical model for organic richness from porosity and resistivity logs. AAPG Bull. 74 (12), 1777–1794.
Passey, Q. R., Bohacs, K., Esch, W. L., Klimentidis, R., and Sinha, S. (2010). “From oil-prone source rock to gas-producing shale reservoir-geologic and petrophysical characterization of unconventional shale gas reservoirs,” in Society of petroleum engineers international oil and gas conference and exhibition in China (china: Onepetro).
Schmoker, J. W. (1979). Determination of organic content of appalachian devonian shales from formation-density logs: Geologic notes. AAPG Bull. 63 (9), 1504–1509.
Schmoker, J. W. (1981). Determination of organic matter content of Appalachian Devonian shale from gamma-ray logs. AAPG Bull. 65 (7), 1285–1298.
Schmoker, J. W., and Hester, T. C. (1983). Organic carbon in Bakken formation, United States portion of Williston basin. AAPG Bull. 67 (12), 2165–2174.
Shalaby, M. R., Jumat, N., Lai, D., and Malik, O. (2019). Integrated toc prediction and source rock characterization using machine learning, well logs and geochemical analysis: Case study from the jurassic source rocks in shams field, nw desert, Egypt. J. Petroleum Sci. Eng. 176, 369–380. doi:10.1016/j.petrol.2019.01.055
Shi, X., Wang, J., Liu, G., Yang, L., Ge, X., and Jiang, S. (2016). Application of extreme learning machine and neural networks in total organic carbon content prediction in organic shale with wire line logs. J. Nat. Gas Sci. Eng. 33, 687–702. doi:10.1016/j.jngse.2016.05.060
Sondergeld, C. H., Newsham, K. E., Comisky, J. T., Rice, M. C., and Rai, C. S. (2010). “Petrophysical considerations in evaluating and producing shale gas resources,” in SPE Unconventional Gas Conference, Pittsburgh, Pennsylvania, USA.
Sun, L. D., Yin, C. H., Liu, C., Zeng, H. S., Zhang, Y., Xu, Y., et al. (2019). Geological characteristics and exploration significance of high-quality source rocks in Yingcheng Formation,Songliao Basin. Acta Pet. Sin. 40, 1172–1179. doi:10.7623/syxb201910003
Tan, M., Song, X., Yang, X., and Wu, Q. (2015). Support-vector-regression machine technology for total organic carbon content prediction from wireline logs in organic shale: A comparative study. J. Nat. Gas. Sci. Eng. 26, 792–802. doi:10.1016/j.jngse.2015.07.008
Wang, G. C., Ju, Y. W., and Han, K. (2015). Early paleozoic shale properties and gas potential evaluation in xiuwu basin, Western lower yangtze platform. J. Nat. Gas Sci. Eng. 22, 489–497. doi:10.1016/j.jngse.2014.12.025
Wang, Z., Liu, G., Gao, P., Chen, W., Yang, Y., and Lei, Y. (2018). Geochemistry of source rocks and oil-source rock correlation in the hetaoyuan formation of the nanyang sag, nanxiang basin, eastern China. Geol. J. 53, 2334–2351. doi:10.1002/gj.3071
Yan, J. P., Liang, Q., Geng, B., Feng, C. Z., Kou, X. P., and Hu, Y. (2017). Log calculation method of geochemical parameters of lacustrine shale and its application: a case pf lower ES2 in Bonan subsag,Zhanghua sag. Lithol. Reserv. 29 (4), 108–116.
Yin, C. H., Sun, L. D., Liu, C., Zhang, Y., Sun, Y. H., and Li, G. W. (2018). Conditions and master controlling factors for the petroleum accumulation in shuangcheng area of Songliao basin. Petroleum Geol. Oilfield Dev. Daqing 37 (6), 1–5. doi:10.19597/J.ISSN.1000-3754.201809031
Yu, H. Y., Rezaee, R., Wang, Z. L., Han, T. C., Zhang, Y. H., Arif, M., et al. (2017). A new method for TOC estimation in tight shale gas reservoirs. Int. J. Coal Geol. 179, 269–277. doi:10.1016/j.coal.2017.06.011
Zhao, P. Q., Ma, H. L., Rasouli, V., Liu, W. H., Cai, J. C., and Huang, Z. H. (2017). An improved model for estimating the toc in shale formations. Mar. Petroleum Geol. 83, 174–183. doi:10.1016/j.marpetgeo.2017.03.018
Zhao, P. Q., Ostadhassan, M., Shen, B., Liu, W. H., Abarghani, A., Liu, K. Q., et al. (2018). Estimating thermal maturity of organic-rich shale from well logs: Case studies of two shale plays. Fuel 235, 1195–1206. doi:10.1016/j.fuel.2018.08.037
Zhu, G. Y., Jin, Q., and Zhang, L. Y. (2003). Using log information to Analyze the geochemical characteristics of source rocks in Jiyang Depression. Well Logging Technol. 27, 104–109. doi:10.3969/j.issn.1004-1338.2003.02.004
Keywords: logging, shale, TOC, the grading evaluation, Songliao Basin
Citation: Yu Z, Ma S and Liu C (2023) TOC prediction and grading evaluation based on variable coefficient △logR method and its application for unconventional exploration targets in Songliao Basin. Front. Earth Sci. 11:1066155. doi: 10.3389/feart.2023.1066155
Received: 10 October 2022; Accepted: 23 February 2023;
Published: 16 March 2023.
Edited by:
Tobias Mueller, Center for Scientific Research and Higher Education In Ensenada (CICESE), MexicoCopyright © 2023 Yu, Ma and Liu. This is an open-access article distributed under the terms of the Creative Commons Attribution License (CC BY). The use, distribution or reproduction in other forums is permitted, provided the original author(s) and the copyright owner(s) are credited and that the original publication in this journal is cited, in accordance with accepted academic practice. No use, distribution or reproduction is permitted which does not comply with these terms.
*Correspondence: Zhanqing Yu, eXV6aGFucWluZzE5ODYwQGhvdG1haWwuY29t