 Jing Liu
 Jianping Wu
 Lihua Fang
 Kai Chang2
 Ting Yang
- 1Insititute of Geophysics, Beijing, China
- 2National Institute of Natural Hazards, Beijing, China
- 3The 3rd Research Institute of CETC, Beijing, China
- 4New Engineering Industry College, Putian University, Putian, Fujian, China
- 5College of Information Engineering, Sanming University, Sanming, Fujian, China
The southeastern Tibetan Plateau, which includes the Tibetan Plateau, Yangtze Block, and Cathaysia Block, is geotectonically situated in the compound part of the Tethys-Himalayan tectonic domain and the Peninsular Pacific tectonic domain. It is one of the critical regions for studying the scientific problems of plateau material lateral escape, lithosphere deformation, geotectonic properties of blocks, and deep dynamics. In this study, we use ambient noise data recorded by 401 broadband stations to obtain high-resolution short-period (T = 4–32 s) Rayleigh wave azimuthally anisotropic phase velocity maps. These could provide fresh clues for an in-depth understanding of the crust-mantle velocity structure, deformation mechanism, and geotectonic evolution in the southeastern Tibetan Plateau. Within the Simao block, the strikes of the faults and the orientations of the principal compressive stress of the stress field both generally coincide with the fast-wave polarization direction (FPD). The FPD near the Lancangjiang fault zone in the west is in the NE-SW direction, near the Wuliangshan fault zone in the center is near the NS direction, and near the Red River fault zone in the east is the NW-SE direction. We estimate that the compressive stress in the southwest direction of the Tibetan Plateau material has a controlling effect on the crustal deformation of the Simao block, which is likewise blocked by the Lincang granite belt, resulting in strong tectonic deformation. The FPD of the crust in the middle Red River fault zone is NS direction, significantly different from the fault strike. Combining with the seismic activity and GPS results, the depth of 8 km below the surface of the middle Red River fault is completely locked, and we conclude that the anisotropy of the upper crust of the middle part of the Red River fault zone is related to the action of the regional tectonic stress field. Taking into account geochemical and thermochemical results, we speculate that the complex tectonic stress at the junction of the blocks leads to prominent regional characteristics of the FPDs of azimuthal anisotropy in the crust, suggesting that the Shizong-Mile fault zone may be the western boundary between the Yangtze block and the Cathaysia block.
1 Introduction
The southeastern Tibetan Plateau (TP) is the Frontier zone and the deep material escape zone for the NE collision and extrusion of the Indian plate and the Eurasian continent (Figure 1A). There are the Tengchong block (TCB), Baoshan block (BSB), Simao block (SMB), Chuanxibei block (CXB), Dianzhong block (DZB) and other tectonic units in the area. Since the Cenozoic, it has experienced intense tectonic deformation and frequent seismic activities (Su and Qin, 2001), making it an ideal place to study the interaction among blocks and deep tectonic deformation.
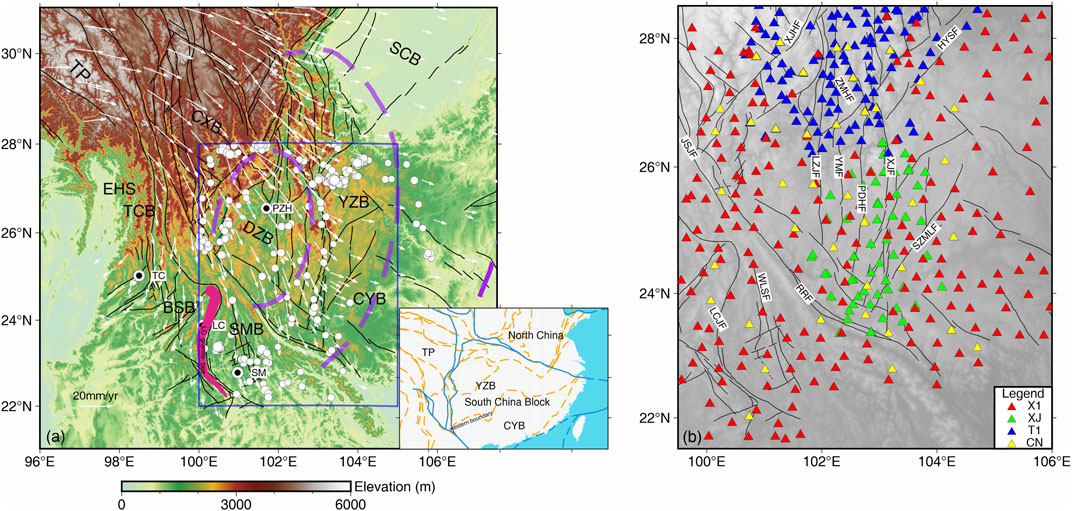
FIGURE 1. (A) Geological setting of the southeastern Tibetan Plateau. The blue rectangle marks the imaging domain in this study. The tectonic units in the southeastern Tibetan Plateau include the Tibetan Plateau (TP), Sichuan Block (SCB), Chuanxibei block (CXB), Dianzhong Block (DZB), Baoshan Block (BSB), Tengchong Block (TCB), eastern Himalayan syntaxis (EHS), Yangtze Block (YZB) and Cathaysian Block (CYB). The two subblocks around the DZB are the Chuanxibei block (CXB) and Simao Block (SMB). The black lines denote major faults. The dotted line inside the DZB demarcates the inner zone of the Emeishan large igneous province (ELIP), while the purple dotted line outside the DZB demarcates the intermediate zone of the ELIP. The white dots indicate the earthquake at the periods from June 2010 to July 2022 (download from https://earthquake.usgs.gov/earthquakes/search/). The white arrows denote the GPS velocity field (Zhao et al., 2015) of the SE Tibetan Plateau relative to the stable Eurasia. The rose-red band indicates the Lincang (LC) granite belt. The bottom-right inset highlights Main block boundary lines. (B) Distributions of the stations used in our tomography study. Red, green, blue and yellow triangles show the location of the ChinArray seismic network (ChinArray, 2006), Xiaojiang Array (Wu et al., 2013), Chuanxi Array (Liu et al., 2014) and permanent seismic stations in the southeastern Tibetan Plateau (Zheng et al., 2010), respectively. The abbreviations for which are as follows: ANHF: Anninghe Fault; ZMHF: Zemuhe Fault; XJF Xiaojiang Fault; XJHF: Xiaojinhe Fault; JSJF: Jinshajiang Fault; RRF: Red River Fault; LCJF: Lancangjiang Fault; SZMLF: Shizong-Mile Fault; WLSF: Wuliangshan Fault; LZJF: Lvzhijiang Fault; YMF: Yumen Fault; PDHF: Puduhe fault; HYSF: Huayingshan Fault. LC, PZH, TC and SM represent the cities of Lincang, Panzhihua, Tengchong and Simao, respectively.
Seismic anisotropy is one of the effective methods to study the deformation of the crust and upper mantle. The upper crustal anisotropy is related to the shape-preferred orientation of microstructures such as lamellae, joints, and fractures in the rock. Furthermore, the anisotropy of the mid-to-lower crust and upper mantle is related to the lattice-preferred orientation of anisotropic minerals such as amphibole, mica, and peridotite. We study seismic anisotropy to understand the relationship between medium and anisotropy, anisotropy and strain, and the relationship between strain and crustal movement. These help us infer the tectonic activities that might have operated in the past and those working at present. Some scholars have studied the SKS-wave splitting measurement in the southeastern TP and believe that, unlike the vertically coherent deformation of the crust and mantle inside the TP, the crust-mantle deformation in the southeastern TP is decoupled (Silver and Chan, 1991; Flesch et al., 2005; Lev et al., 2006; Chang et al., 2015; Huang et al., 2015). However, Wang et al. (2008) believed that the vertical coherent deformation model could also explain SKS-wave splitting measurements outside the TP. The anisotropy obtained by SKS-wave splitting measurement is the cumulative effect of the anisotropy on the path from the core-mantle boundary to the surface, which is difficult to determine the depth of the anisotropic layer. Chen et al. (2013) and Cai et al. (2016) speculated that the crust and upper mantle deformation in the southern study area decoupled. However, Pms anisotropy can only reveal the average anisotropy characteristic of the entire crust. Due to the dispersive properties of surface waves, surface waves of different periods are sensitive to structure information at different depths. Therefore, compared with SKS wave splitting and Pms anisotropy, surface wave azimuthal anisotropy can provide better constraints on the depth variation of anisotropy.
By using the seismic surface wave and ambient noise data, some researchers illustrate the azimuthal anisotropy of the TP and its vicinities (Yao et al., 2010; Lu et al., 2014; Wang et al., 2015; Liu et al., 2019; Liang et al., 2020; Zhu et al., 2021). These studies reveal the anisotropy on a large scale, i.e., mid-to-lower crust and upper mantle depth range, which provides essential evidence for the internal structure and deformation dynamic mechanism of the crust and upper mantle in the southeastern TP. However, there is still a debate about the interactions between the sub-blocks and their natural properties. For example, the SMB, located between the Red River Fault zone (RRF) and the Lancangjiang Fault zone (LCJF), is spread from NW to SE (Figure 1). It is adjacent to the Dianzhong block in the north and the Baoshan block in the west. Significant tectonic deformation has occurred since Cenozoic. Geological studies propose a variety of different structural deformation modes. It mainly includes the pushing out effect during lateral rotational extrusion of crustal blocks in the southeastern TP (Tanaka et al., 2008; Kondo et al., 2012; Tong et al., 2013); the extrusion effect of the thrust fault in Lincang (LC) granite foundation from west to east (Gao et al., 2015), and the blocking effect of Lincang granite foundation on the lateral clockwise rotational extrusion movement of SMB (Xu et al., 2017). The eastern boundary between the YZB and the CYB can be made with certainty (Zhang et al., 2005; Zhang et al., 2015; Guo et al., 2019; Ma et al., 2022), but the western border is more controversial (Zhu et al., 2019). The edge of the west is difficult to discern because of the lack of outcrops of the combined geological landmarks (ophiolites, island arc igneous rocks), the thick cover in the later period, and the multi-stage structure and magmatic intrusion. The one point of views is the Shizong-Mile fault (SZMLF, Figure 1B) (Dong et al., 2002; Guo et al., 2009).
In our study, we collect the continuous waveform data recording by dense seismic arrays of the permanent China National-backbone stations and mobile broadband stations (Figure1B). We adopt ambient noise tomography to acquire high-resolution Rayleigh wave phase velocity azimuthal anisotropy in this area. It provides new evidence for the tectonic evolution and dynamic process of the crust and upper mantle in the southeastern TP.
2 Data and methods
2.1 Data acquisition and processing
In this study, we collected the continuous waveform data recorded by three temporal seismic arrays: 195 stations of the ChinArray (X1) between October 2011 and October 2012, 114 stations of the Chuanxi array (CX) between October 2006 and July 2009 (Liu et al., 2014), and 50 stations of the Xiaojiang array (XJ) between January 2009 and December 2010 (Wu et al., 2013). In addition, we also use data recorded by 42 permanent stations of the Sichuan and Yunnan regional seismic networks for 1 year in 2009. There are 401 seismic stations in total in our study region. The average interstation space is about 30 km. The dense station distribution enhances the azimuthal coverage and path density, especially in DZB, compared with previous studies (e.g., Lu et al., 2014; Wang et al., 2015). Figure 1B shows the station distribution. Most stations are equipped with Guralp CMG-3ESPS seismometer (60s–50 Hz) and Reftek 130 digitizer.
The data processing technique for ambient noise tomography is currently in a relatively advanced stage. It mainly includes single station data preprocessing, empirical Green’s function extraction, phase velocity dispersion measurement, phase velocity tomography, and surface wave azimuthal anisotropy inversion. Empirical Green’s functions (EGFs) are derived from the cross-correlation functions between each station pair using the vertical component of continuous waveform following the method of Bensen et al. (2007) and Fang et al. (2009). Phase velocity dispersions from EGFs are measured using the far-field representation of the surface-wave Green’s function and image transformation technique following Yao et al. (2006). Figure 2 shows example of Z-Z cross-correlation functions (CCFs) between stations randomly selected from XJ array. The CCFs are filtered at 5–40 s period band. Figure 3 shows an example of the dispersion measurement of the phase velocity.
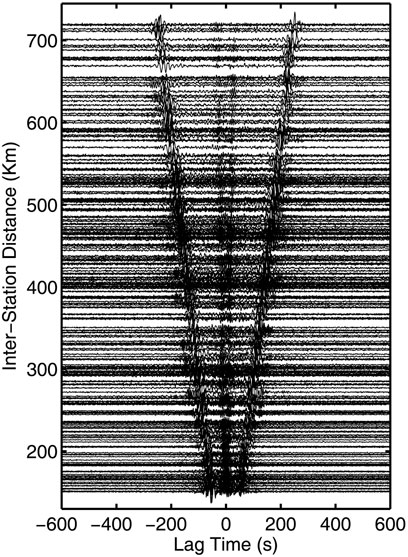
FIGURE 2. Example of Z-Z CCFs between stations randomly selected from XJ array. The CCFs are filtered at 5–40 s period band.
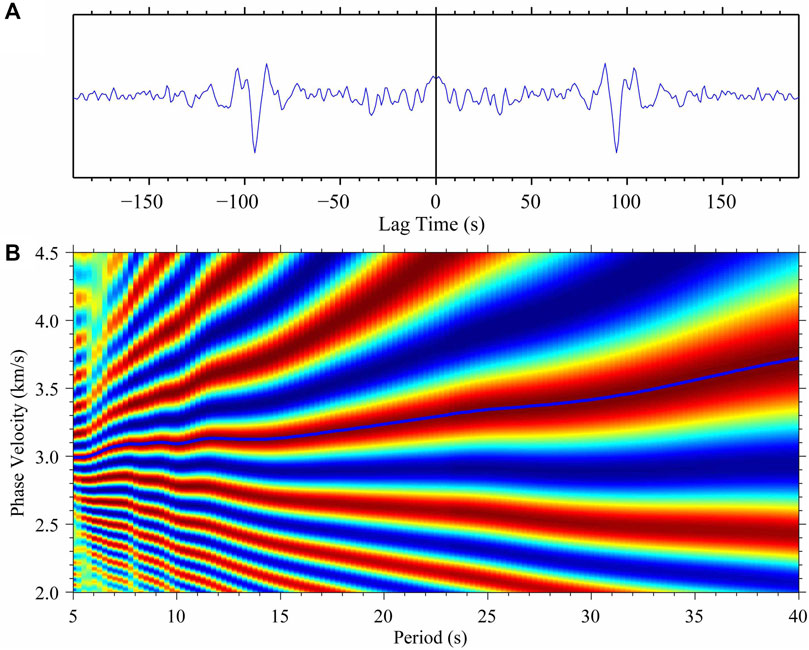
FIGURE 3. Example of dispersion measurement. (A) The 4-month cross-correlation obtained between stations XJ03 and XJ42 using vertical recordings. (B) FTAN diagram obtained after multiple filter analysis. The abscissa is represented with periods, and the ordinate is represented with phase velocity.
2.2 Surface wave tomography inversion
In the case of weak anisotropic medium and ignoring
Where
The inversion for
2.3 Resolution tests
The knowledge of the resolution is vital in the interpretation of the tomography results. Artificial values may be introduced in inversion due to insufficient data and poor ray path coverage. Following Simons (2002) and Yao et al. (2010), we performed checkerboard tests to assess the resolution of our model. We calculated the synthetic data from input models with a 1°×1° anisotropic pattern along with the fast azimuthal axis-oriented NE and NW, with 5% isotropic anomalies at each period (Figure 4A). We added the random error with a maximum of 1% to the synthetic data. We performed the inversion with the same parameters as for the actual data.
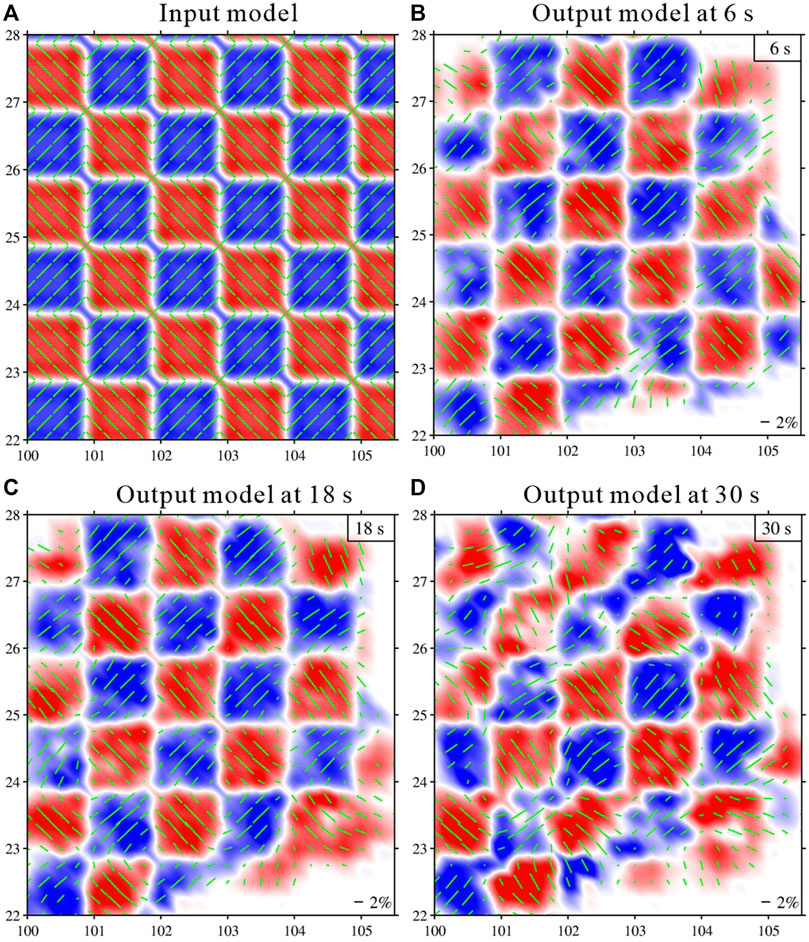
FIGURE 4. Checkerboard tests of azimuthal anisotropy with 1°×1° grid. (A) Input model; (B), (C), (D) are output model after inversion.
The checkerboard tests indicate that for the azimuthal anisotropy parameters, the 1°×1° patterns are well recovered throughout our study area (Figures 4B–D). The azimuthal anisotropy is not well recovered in the margin due to relatively poor azimuthal path coverage. Generally, checkerboard tests provide qualitative information about spatial resolution. However, we must remember that the checkerboard test differs from the inversion of actual data due to its inherent limitations, as pointed out by previous studies (e.g., Simons, 2002). For example, the limits of ray approximation, the horizontal smoothing imposed in the inversion, and the trade-off between lateral heterogeneities and anisotropy (Pandey et al., 2015).
Tarantola and Valette (1982) pointed out that calculating the posterior covariance operator of the model parameters after inversion can estimate the posterior error and resolution of the inversion parameters. If the posterior error is significantly smaller than the prior error, the inversion results are reliable, and the resolution is high. Conversely, when the posterior error is close to the prior error, it indicates that the data cannot resolve the parameter. Figure 5 shows the posterior error distribution of the anisotropic intensity after inversion. Its amplitude is much smaller than the prior error of the anisotropic intensity and the anisotropic intensity in the study area. Taking 10s as an example, in the central, the posterior errors of the anisotropic intensity Ac are all less than 0.3%. Therefore, the inversion results are reliable for regions with anisotropy strength greater than 2%.
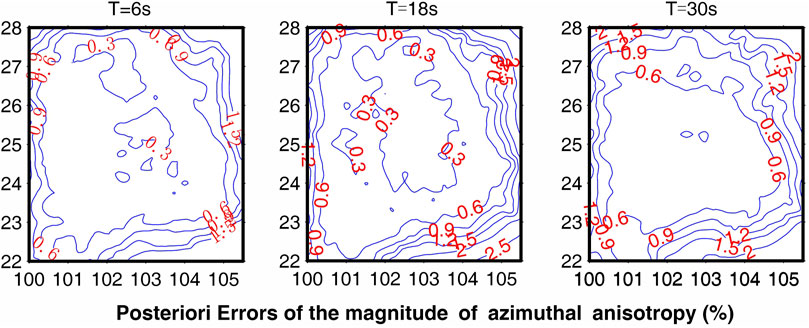
FIGURE 5. posterior errors (in percent) of (right) the magnitude of azimuthal anisotropy at T = 6, 10, and 20 s.
3 Results
The Rayleigh surface wave phase velocity and azimuthal anisotropy are obtained by inversion according to the mixed path dispersion curve. The different periods reflect the structural differences in different depth ranges. Compared with the S-wave velocity inverted by a single node, the reliability of the phase velocity at different periods is higher. We select six periods for discussion according to the phase velocity characteristics at each period. Figures 6A–F show isotropic phase velocity and azimuthal anisotropy maps at six periods. Moreover, the background is the absolute value of the isotropic phase velocity. The length and azimuth of the short black bars indicate the magnitude of the azimuthal anisotropy and the FPD, respectively.
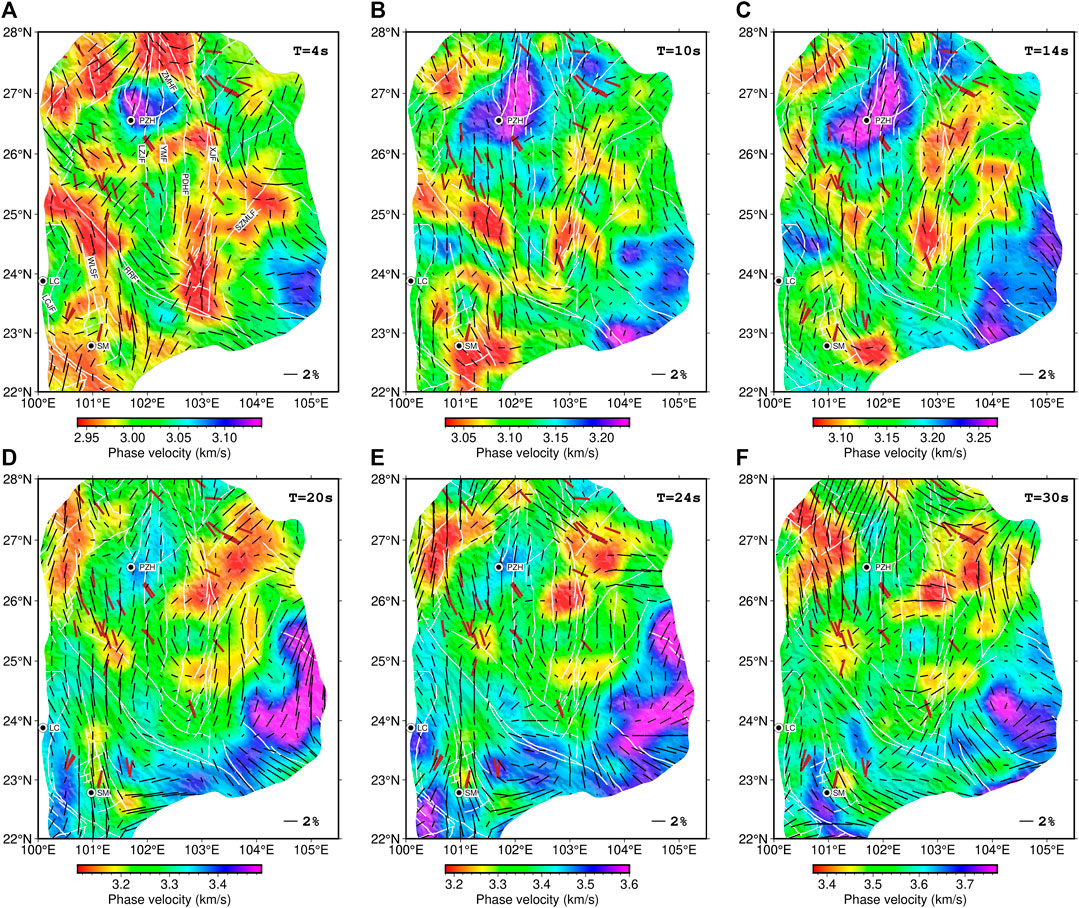
FIGURE 6. Variation of absolute Rayleigh phase velocities (color image) and azimuthal anisotropy (short black bars) in the crust and uppermost mantle beneath southeastern Tibetan Plateau at different periods (A-F). The color bars show the color scale of phase velocities (km/s). The short brown bars are the P-axis directions of the principal stress based on the focal mechanism solution (Ekström et al., 2012). The abbreviations of geological units are defined in the caption of Figure 1.
At short periods (4–10 s), the phase velocity mainly reflects the characteristics of the upper crustal structure. The phase velocity distribution is consistent with the surface geological structure. The SMB exhibits low velocity, associated with thick sedimentary layers in this area, consistent with the S-wave velocity results of Liu et al. (2019). There are high-velocity anomalies in the vicinity of Panzhihua (PZH) and the east of the Shizong-Mile fault (SZMLF) zone. An N-S-orientated high-velocity belt along the Lvzhijiang (LZJF) and Yimen faults (YMF) through the Red River Fault (RRF). The FPD of surface wave azimuthal anisotropy is nearly N-S direction in the Dianzhong block and SMB, which is consistent with the strike of the Xiaojiang fault (XJF). In the high-velocity body of PZH, the magnitude of azimuthal anisotropy is weak. The FPD to the east side of the XJF zone is NE. The FPD to the east of the SZMLF is NW-SE direction as a whole, which is significantly different from its adjacent areas.
At intermediate periods (14–20 s), the phase velocity mainly reflects the mid-crustal structure, and its sensitivity range is about 10–25 km. The area near PZH and east of the SZMLF still exhibits high-velocity anomalies. Still, the area of high-velocity anomalies near the PZH area has begun to decrease. After 20 s period, high-velocity anomalies began to appear on the west side of the SMB. The azimuthal anisotropic characteristics at intermediate periods are similar to the short periods. The FPDs to the northeastern SZMLF changed from NW-SE to N-S direction. Furthermore, the FPDs to the south of the eastern RRF zone are nearly E-W direction, and the magnitude of azimuthal anisotropy is relatively strong.
At long periods (>20 s), the phase velocity is sensitive to the structures in the mid-to-lower crust. For example, the SZMLF is the boundary between the YZB and CYB. The high-velocity anomaly on the east side is parallel to the strike of the SZMLF. As the period increases, the area of high-velocity anomalies near the PZH area continues to decrease. After 30 s period, this high-velocity anomaly almost disappeared. The azimuthal anisotropic characteristics seem to be those at 12–20 s periods. The FPDs in the DZB and SMB are still in a close N-S direction. After 24 s, the FPDs in the northern CYB changed from NW-SE and nearly NS to NE-SW. The FPDs to the south of the eastern RRF zone are still near the E-W direction.
4 Discussion
4.1 Crustal deformation mechanism of simao block and its surrounding areas
The SMB has frequent seismic activities, dominantly about magnitude 6.0, showing the characteristics of stronger and less large earthquakes. The present crustal deformation and intense earthquake activities in this area are closely related to the collision of the Indian plate and the Eurasian plate and the lateral extrusion of the TP. Therefore, understanding the velocity structure and anisotropy characteristics will help us further understand the dynamic relationship between the present crustal deformation process and the material extrusion in the southeastern TP.
The velocity anomaly in the SMB is heterogeneous. At 14–32 s periods, it is mainly sensitive to the S-wave velocity structure in the depth range of 20–45 km (Figure 7). The area near the Wuliangshan fault zone (WLSF) continues to exhibit low-velocity anomalies, and the other areas show relatively high-velocity anomalies relative to short periods. Regarding azimuthal anisotropy (Figures 8A, B), the FPDs in the SMB show noticeable regional variance. In the central, the FPDs are generally similar to the fault strikes and the orientation of the principal compressive stress (Sheng et al., 2022). Among them, the FPD near the LCJF in the west is NE-SW direction, the FPD near the WLSF zone in the middle is near the N-S direction, and the FPS near the RRF zone in the east is NW-SE direction. These phenomena are consistent with the phase velocity azimuthal anisotropy of Wang et al. (2015), the group velocity azimuthal anisotropy of Lu et al. (2014), and Pms anisotropy (Chen et al., 2013; Sun et al., 2015; Cai et al., 2016) (Figure 9B).
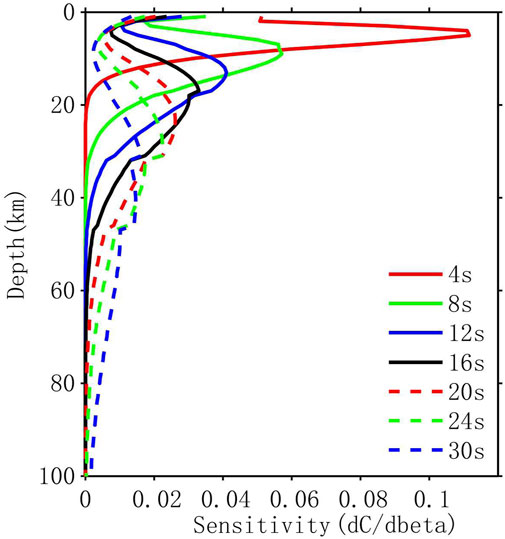
FIGURE 7. Sensitivity kernels of Rayleigh wave phase velocity at different periods.
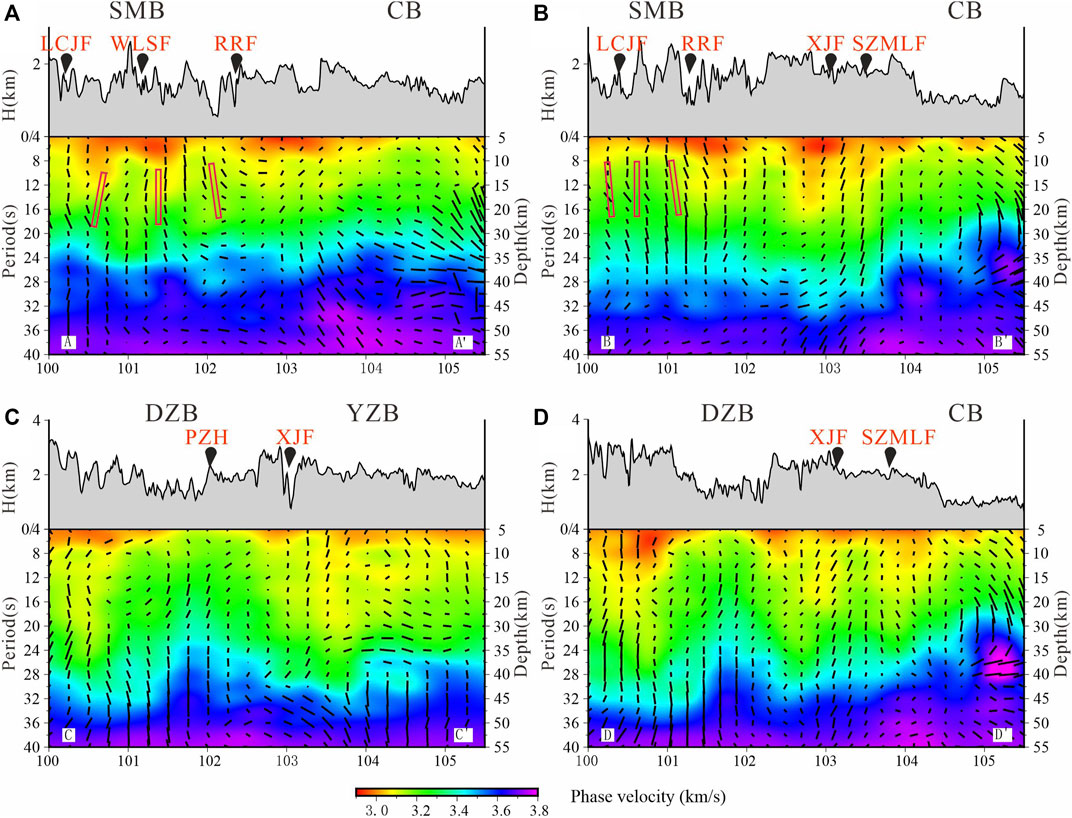
FIGURE 8. Absolute isotropic phase velocities across the four profiles shown in Figure 8D (black lines). The red bars indicate that the fast-wave polarization direction (FPD) of azimuthal anisotropy shows a regional variation. the FPD near the LCJF in the west is NE-SW direction, the FPD near the WLSF zone in the middle is near the N-S direction, and the FPS near the RRF zone in the east is NW-SE direction. The depth corresponding to each period is calculated in terms of the sensitive kernel in Figure 7. Topography is depicted above each profile as the black fonts and the red fonts above it, marking the location of major faults along each profile. The red bars denote the tendency of anisotropic direction. The abbreviations for fault names (red) are the same as in Figure 1. The tectonic units are shown as the black fonts on each topographic area.
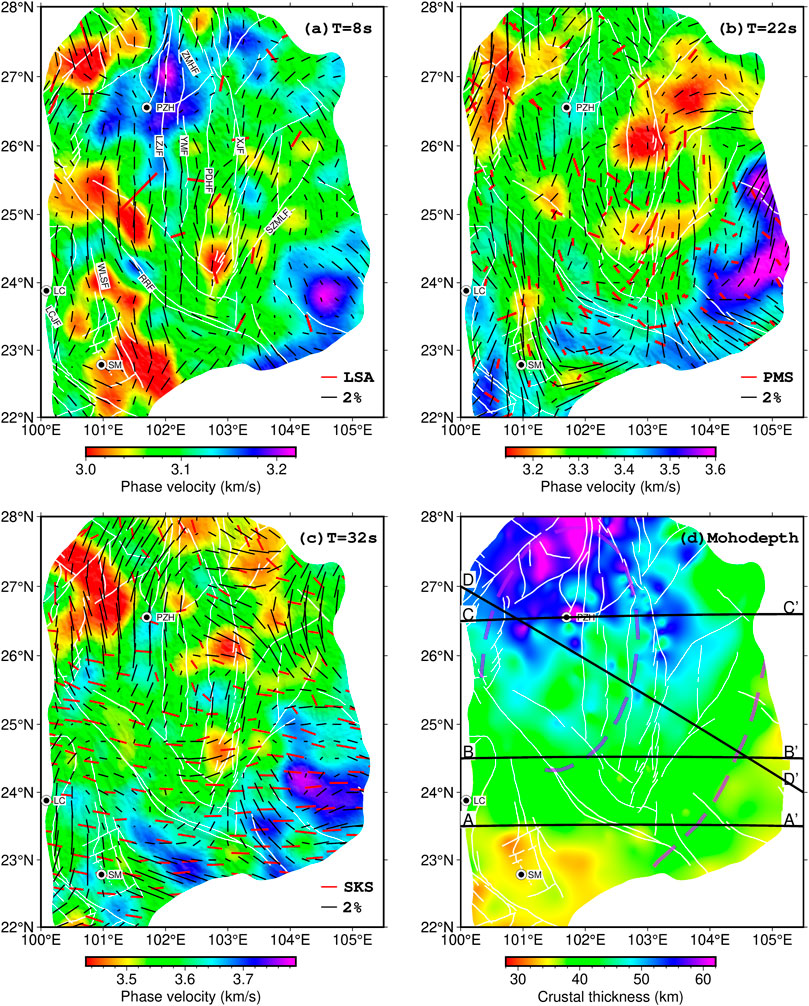
FIGURE 9. Comparison of the previous seismic anisotropy results and our azimuthal anisotropy at different periods. (A) Azimuthal anisotropy of Rayleigh wave at period 8 s vs. the Local Seismic Anisotropy (LSA) (Shi et al., 2009, 2012; Gao et al., 2012); (B) Azimuthal anisotropy of Rayleigh wave at period 22 s vs. the Pms phase splitting of receiver function (Sun et al., 2012; Chen et al., 2013; Cai et al., 2016); (C) Azimuthal anisotropy of Rayleigh wave at period 32 s vs. the SKS/SKKS phases splitting (Chang et al., 2015); (D) Distribution of Moho depth (Wang et al., 2017).The abbreviations of geological units are defined in the caption of Figure 1.
Previous studies have shown that the RRF experienced a left-lateral strike-slip movement at 32–17 Ma and transformed into a right-lateral strike-slip movement at about 5 Ma (Gilley et al., 2003). In contrast, the XJF zone started to experience an initial left-lateral strike-slip movement from the Middle Miocene to the Early Pliocene (about 17–5 Ma) (Roger et al., 1995). At this time, the Chuandian diamond block (including the CXB and DZB) began to rotate and extrude clockwise along the XJF. During this process, the Chuandian diamond block was bound to have a robust southward extrusion on the SMB. Since the Oligocene (37–21 Ma), the Lincang granite in the southern SMB has experienced a gradual uplift from south to north (Shi et al., 2006). Furthermore, with the obstruction of the Lincang granite belt, the crustal structure of the central SMB was deformed strongly, forming a northwardly protruding honeycomb-shaped structure.
Therefore, when subjected to compressive stress in the southwest direction of the Chuandian diamond block, the crust of the eastern SMB underwent shear deformation, forming crustal anisotropy parallel to the strike of the RRF. Meanwhile, the crust of the western SMB was blocked by the Lincang granite belt and strongly deformed, forming crustal anisotropy parallel to the strikes of the Lincang granite belt and the LCJF. Likewise, the central is in the transition zone of differential deformation on both sides, forming near N-S trending crustal anisotropy, which is almost consistent with the extensive development of folds and thrust structures in the Mesozoic-Cenozoic strata in the block (Guan et al., 2006).
The SMB has undergone 50°–70° clockwise rotational deformation under the combined action of the Chuandian diamond block since the Pliocene (Sato et al., 2007). The GPS velocity field shows that, relative to the South China block, the NNE pushing caused by the collision of the Indian plate and the Eurasian plate (Wang and Shen, 2020) and the gravitational potential energy generated by the plateau uplift resulted in the eastward extrusion of the TP (Li et al., 2021). After encountering the obstruction from the stable South China block, the TP material moved southeast and southward, causing the Chuandian diamond block to rotate clockwise around the eastern Himalayan tectonic knot. Therefore, we infer that the compressive stress in the southwest direction of the Chuandian diamond block has a controlling effect on the crustal deformation of the SMB, and the west of the block was blocked by the Lincang granite belt and experienced intense tectonic deformation (Figure 10).
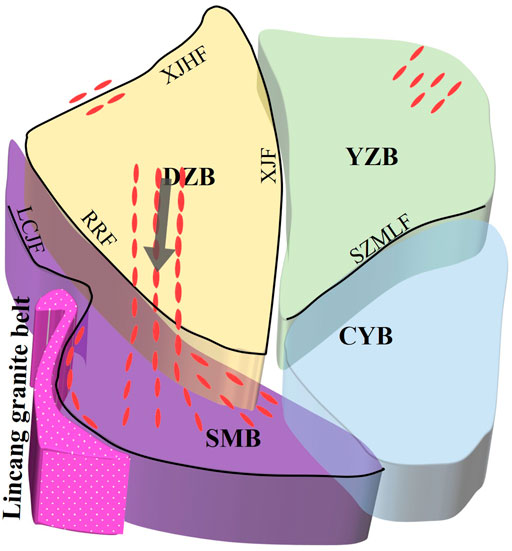
FIGURE 10. A cartoon summarizing the deformation pattern of the crust in the southeastern Tibetan Plateau. We estimate that the compressive stress in the southwest direction of the Tibetan Plateau material has a controlling effect on the crustal deformation of the Simao block, which likewise blocked by the Lincang granite belt, resulting in strong tectonic deformation. The anisotropy of the upper crust of the middle Red River fault zone is related to the regional tectonic stress field. And the Shizong-Mile fault zone may be the western boundary between the Yangtze block and the Cathaysia block. The red ellipses denote the FPD of the Rayleigh-wave phase velocity in the crust. The black arrow denotes the movement direction of the Dianzhong block relative to the South China block (Wang et al., 2020). The black lines denotes the faults.
In the middle RRF and its vicinity, the anisotropic FPD at 4–24 s periods (corresponding to the crustal depth range, Figure 7) is near the N-S direction (Figure 5), showing a large angle with the fault strike. The azimuthal anisotropy of the surface wave group velocity, Pms anisotropy, and S-wave azimuthal anisotropy (Figure 9B) also show almost the same characteristics (Lu et al., 2014; Cai et al., 2016; Liu et al., 2019). The RRF zone, as a critical plate boundary cutting the Moho surface (Wang et al., 2014), did not cause the FPD of the anisotropy in the crust to be parallel to the strike of the fault. The tectonic stress field obtained from the focal mechanism (Xu, 2001; Wu et al., 2004; Xu et al., 2016) and the GPS velocity field (Jin et al., 2019) show that the maximum principal stress in the vicinity of the middle RRF zone is in the near N-S direction, which is consistent with the FPD of azimuthal anisotropy (Figure 9A). The anisotropy of the upper crust is generally considered to be related to the shape preferred orientation of microstructures (Rabbel and Mooney, 1996; Crampin and Peacock, 2008). Secondly, fault zones may also affect it, but the influence is limited (Gao et al., 2011). The GPS velocity field (Figure 1A) and seismic activity suggest that the middle RRF zone is completely locked from the surface to 8 km depth (Zhao et al., 2015; Wang et al., 2022). We speculate that the anisotropic material in the upper crust of the middle RRF zone may not have a dominant arrangement along the fault strike but is related to the action of the regional tectonic stress field (Figure 10).
4.2 Constraints on the western boundary between Yangtze Block and Cathaysia Block
At 4–32 s periods, the Rayleigh surface wave phase velocities in the eastern and western sides of the SZMLF have noticeable velocity differences (Figures 8A, B, D), which correspond well with the S-wave and P-wave velocity variations (Wu et al., 2013; Yang et al., 2020). Unlike the velocities on the west side of the fault zone with the periods changing, the east side of the fault zone continues to show relatively high phase velocity anomalies. The apparent velocity differences may reflect the inhomogeneity of the crustal structures and lithologies on both sides. The receiver function showed the crustal thickness on both sides of the SZMLF differs up to 10 km (Wang et al., 2017) (Figure 8D). The geochemical study of the volcanic rocks in the northern SZMLF zone shows that it is mainly alkaline basalt, characterized by low TiO2 and high Al2O3, which is different from the Emeishan continental overflow basalt with high TiO2 and low Al2O3 characteristics (Dong et al., 2002). The Bouguer gravity anomaly and the equilibrium gravity anomaly along both sides of the SZMLF zone are high in the north and low in the south, which shows that the SZMLF is the block boundary separating the YZB and CYB with different crustal structures. In addition, the thermochemical states of the upper mantle in South China based on multi-observation probability inversion (Yang et al., 2021) show that in the lithospheric mantle, the average density in this region also takes the SZMLF zone as the western boundary to separate the YZB and CYB. Coupled with the complex tectonic stress at the junction of the blocks leading to prominent regional characteristics of the FPDs, we infer that the SZMLF zone may be the western boundary between the YZB and CYB in the crust (Figure 10).
The SCB located at the northwest of the YZB. In the northeastern study area, the crustal anisotropy of the southern SCB at 4–20 s periods is dominated by NE-SW and NEE-SWW trends (Figure 8C), which is consistent with the NE-SW trend of the surface eastern Sichuan fold belt (Li et al., 2014; Xiong et al., 2016). The shear wave splitting of local earthquakes (Tai et al., 2015), Pms anisotropy (Sun et al., 2012), and S-wave azimuthal anisotropy (Zhu et al., 2021) also show the same crustal anisotropy characteristics. Since the Cenozoic, the eastward compressive stress of the TP may have been transmitted to the eastern Sichuan fold belt through the hard SCB, leading to an uplift of the east Sichuan fold belt (1–2 mm/a) in this area (Shi et al., 2016; Yuan et al., 2018). We believe that the azimuthal anisotropy of the upper crust is related to the high-angle stratigraphic directional arrangement caused by the eastern Sichuan fold belt deformation, which can be considered as the response evidence for the eastward extrusion of the TP. At 22–34 s periods (Figures 9B, C), the FPD of the azimuthal anisotropy is mainly in the NW-SE direction, and the anisotropy amplitude is greater than 2%, basically consistent with the direction and magnitude of the SKS anisotropy (Liu et al., 2020). We deduce that the lithosphere has undergone significant deformation.
4.3 Crustal structure characteristics and deformation mechanism of the dianzhong block
At the period of 4–30 s, the area near PZH exhibits high phase velocity anomaly (Figure 8C), which is in good agreement with the characteristics of high Poisson’s ratio, high wave velocity, high resistivity, high density, positive magnetic anomaly, and low terrestrial heat flow (Chen et al., 2015; Wang et al., 2017; Wu et al., 2013; Cheng et al., 2017; Shen et al., 2015; Xu et al., 2015; Teng et al., 2019), all distributed in the inner core of the Emeishan large igneous rock province. Moreover, the FPDs in the vicinity of PZH have the characteristics of the NS direction at 4–30 s periods. Another notable feature is a large area of low-velocity anomalies near the Xiaojinhe fault (XJHF) zone in the north, which is consistent with the S-wave velocity obtained by Liu et al. (2014). The phase velocities are sensitive to the S-wave velocities of the mid-to-lower crust at 20–34 s periods (Figure 7). Within this period, the FPD near the northern XJHF zone gradually changed from NS to NE-SW direction, roughly parallel to the fault zone.
Geochemical and regional geological studies (Xu and Zhong, 2001) indicated that during the period of 263-251Ma in the Late Permian, a famous tectonic activity occurred in the western YZB, the magmatic activity of the Emeishan great igneous rock province (Xu and Chung, 2001), whose dynamic mechanism may be related to mantle plume activity. Both sources of intracrustal magmatic intrusions and eruptive basalts come from the deep mantle. According to the dome structure and basalt thickness, the active center of the mantle plume is located near PZH (Shen et al., 2007; Xu and Zhong, 2001). We speculate that the high-velocity anomaly in the crust may be formed by the cooling and crystallization of a large number of high-density basic and ultramafic rock intrusions under the PZH area during the uplifting process of the early mantle plume (Wu et al., 2013; Yang et al., 2014; Zheng et al., 2016).
The XJHF, as the western boundary of the Yangtze block, obliquely cuts the Chuandian diamond block into two sub-blocks in CXB and DZB (Xiang et al., 2002; Xu et al., 2003). The topographic differences between the two sides of the XJHF fault zone are significant. To the north of the fault zone, many peaks with altitudes of 4500–6500 m, and the average altitude exceeds 3500 m. While the average altitude to the south of the fault zone rapidly drops to about 2000 m.
Geological investigations have shown that differential movements on both sides of the fault zone are apparent. The horizontal slip rate values of the sub-block in CXB toward SE are 2 mm/a higher than those of the DZB. Since the Late Quaternary, the average differential upward and downward movement rates have reached 1.0–1.3 mm/a (He et al., 1993; Xu et al., 2003). Furthermore, there are also considerable differences in vertical movements observed by level (Liang et al., 2013). What causes the significant differential motion between the two sub-blocks within the Chandian diamond block? Seismic tomography results show (Liu et al., 2014; Wang et al., 2020) that there is a pronounced lower crustal flow in the CXB, and the flow direction is consistent with the extrusion direction of the block to the south. We suggest that the southward extrusion of the TP material is blocked by the hard intracrustal masses with PZH as the core, resulting in a rapid uplift of the northern topography.
5 Conclusion
We present an azimuthally anisotropic phase velocity model of the crust and uppermost mantle beneath the southeastern TP from surface wave dispersion. A summary of our major findings and the structural features revealed by the azimuthally anisotropic model is as follows.
1. The azimuthal anisotropy and phase velocity in the SMB show noticeable regional variance. Subject to compressive stress in the southwest direction of the Chuandian diamond block, the crust of the eastern SMB underwent shear deformation, forming crustal anisotropy parallel to the strike of the RRF. Meanwhile, the crust of the western Simao block was blocked by the Lincang granite belt and strongly deformed, forming crustal anisotropy parallel to the strikes of the Lincang granite belt and the LCJF. Likewise, the central is in the transition zone of differential deformation on both sides, forming near N-S trending crustal anisotropy, which is almost consistent with the extensive development of folds and thrust structures in the Mesozoic-Cenozoic strata in the block. We infer that the compressive stress in the southwest direction of the Chuandian diamond block has a controlling effect on the crustal deformation of the SMB, and the west was blocked by the Lincang granite belt and experienced strong tectonic deformation.
2. In the middle RRF and its vicinity, the anisotropic FPD at 4–24 s periods is near N—S direction, showing a large angle with the fault strike. The anisotropic material in the upper crust of the middle RRF zone may not have a dominant arrangement along the fault strike but is related to the action of the regional tectonic stress field.
3. At 4–32 s periods, the Rayleigh surface wave phase velocities in the eastern and western sides of the SZMLF have noticeable velocity differences, which correspond well with the S-wave and P-wave velocity variations. Coupled with the complex tectonic stress at the junction of the blocks leading to prominent regional characteristics of the FPDs, we infer that the SZMLF zone may be the western boundary between the Yangtze and Cathaysia blocks in the crust.
4. Azimuthal anisotropy and Rayleigh surface-wave phase velocity show a pronounced lower crustal flow in the Chuanxibei sub-block, and the flow direction is consistent with the extrusion direction of the block to the south. The southward extrusion of the Tibetan Plateau material is blocked by the hard intracrustal masses with Panzhihua as the core, resulting in a rapid uplift of the northern topography.
Data availability statement
Publicly available datasets were analyzed in this study. This data can be found here: the China Seismic Array Data Management Center at the Institute of Geophysics, China Earthquake Administration.
Author contributions
JL and LF designed the method and programmed the codes; all authors participated in writing, revising, and approving the final manuscript.
Funding
This work was supported by grants 42204070, U2039204 and U2139205 from the National Natural Science Foundation of China, 2021M702988 from the China Postdoctoral Science Foundation, and 2020-S-39 from guiding science and technology projects in Sanming City.
Acknowledgments
Thanks to the China Seismic Array Data Management Center at the Institute of Geophysics, China Earthquake Administration for preparing the waveform data. We are also grateful to the editor and two reviewers for their comments.
Conflict of interest
The authors declare that the research was conducted in the absence of any commercial or financial relationships that could be construed as a potential conflict of interest.
Publisher’s note
All claims expressed in this article are solely those of the authors and do not necessarily represent those of their affiliated organizations, or those of the publisher, the editors and the reviewers. Any product that may be evaluated in this article, or claim that may be made by its manufacturer, is not guaranteed or endorsed by the publisher.
References
Bensen, G. D., Ritzwoller, M. H., Barmin, M. P., Levshin, A. L., Lin, F., Moschetti, M. P., et al. (2007). Processing seismic ambient noise data to obtain reliable broad-band surface wave dispersion measurements. Geophys. J. Int. 169, 1239–1260. doi:10.1111/j.1365-246X.2007.03374.x
Cai, Y., Wu, J., Fang, L., Wang, W., and Yi, S. (2016). Crustal anisotropy and deformation of the southeastern margin of the Tibetan Plateau revealed by Pms splitting. J. Asian Earth Sci. 121, 120–126. doi:10.1016/j.jseaes.2016.02.005
Chang, L., Ding, Z., and Wang, C-Y. (2015). Upper mantle anisotropy beneath the southern segment of North-South tectonic belt, China. Chin. J. Geophys. (in Chinese) 58 (11), 4052–4067. doi:10.6038/cjg20151114
Chen, Y., Li, W., Yuan, X., Badal, J., and Teng, J. (2015). Tearing of the Indian lithospheric slab beneath southern Tibet revealed by SKS-wave splitting measurements. Earth Planet. Sci. Lett. 413, 13–24. doi:10.1016/j.epsl.2014.12.041
Chen, Y., Zhang, Z., Sun, C., and Badal, J. (2013). Crustal anisotropy from Moho converted Ps wave splitting analysis and geodynamic implications beneath the eastern margin of Tibet and surrounding regions. Gondwana Res 24, 946–957. doi:10.1016/j.gr.2012.04.003
Cheng, Y. Z., Tang, J., Cai, J. T., Chen, X. B., Dong, Z. Y., and Wang, L. B. (2017). Deep electrical structure beneath the Sichuan-Yunnan area in the eastern margin of the Tibetan plateau. Chinese Journal of Geophysics 60 (6), 2425–2441.
ChinArray (2008). China seismic array waveform data, China Earthquake Administration. doi:10.12001/ChinArray.Data
Crampin, S., and Peacock, S. (2008). A review of the current understanding of seismic shear-wave splitting in the Earth’s crust and common fallacies in interpretation. Wave Motion 45 (6), 675–722. doi:10.1016/j.wavemoti.2008.01.003
Dong, Y. P., Zhu, B. Q., Chang, X. Y., and Zhang, G. W. (2002). Geochemistry of the basalts from north of the shizong-mile belt, eastern yunnan province: Constraints on the tectonic framework of the south China continent. Acta Petrologica Sinica 18 (1), 37–46. doi:10.3321/j.issn:1000-0569.2002.01.005
Ekström, G., Nettles, M., and Dziewoński, A. M. (2012). The global CMT project 2004-2010: Centroid-moment tensors for 13,017 earthquakes. Phys. Earth Planet. Inter. 200-201, 1–9. doi:10.1016/j.pepi.2012.04.002
Fang, L., Wu, J., and Lu, Z. (2009). Rayleigh wave group velocity tomography from ambient seismic noise in North China. Chinese Journal of Geophysics 52 (3), 663–671. (in Chinese).
Flesch, L. M., Holt, W. E., Silver, P. G., Stephenson, M., Wang, C. Y., and Chan, W. W. (2005). Constraining the extent of crust-mantle coupling in central Asia using GPS, geologic, and shear wave splitting data. Earth Planet. Sci. Lett. 238, 248–268. doi:10.1016/j.epsl.2005.06.023
Gao, Y., Wu, J., Fukao, Y., Shi, Y., and Zhu, A. (2011). Shear wave splitting in the crust in North China: Stress, faults and tectonic implications. Geophys. J. Int. 187, 642–654. doi:10.1111/j.1365-246X.2011.05200.x
Gao, Y., Shi, Y., Wu, J., and Tai, L. (2012). Shear-wave splitting in the crust: Regional compressive stress from polarizations of fast shear-waves. Earthq. Sci. 25, 35–45. doi:10.1007/s11589-012-0829-3
Gao, L., Yang, Z., Tong, Y., Wang, H., and An, C. (2015). New paleomagnetic studies of cretaceous and Miocene rocks from jinggu, Western yunnan, China: Evidence for internal deformation of the lanping-simao terrane. J. Geodyn. 89, 39–59. doi:10.1016/j.jog.2015.06.004
Gilley, L., Harrison, T., Leloup, P., Ryerson, F., Lovera, O., and Wang, J. (2003). Direct dating of left-lateral deformation along the Red River shear zone, China and Vietnam. Journal of Geophysical Research Solid Earth 108 (B2). doi:10.1029/2001jb001726
Guan, Y., Wang, J., Li, P., Cao, D., and Liu, J. (2006). Characteristics of the middle axial tectonic belt in the Lanping-Simao basin, Western Yunnan, and its research significance. Geology in China 33 (4), 832–841. doi:10.3969/j.issn.1000-3657.2006.04.013
Guo, L., Liu, Y., Li, C., Xu, W., and Ye, L. (2009). SHRIMP zircon U–Pb geochronology and lithogeochemistry of Caledonian granites from the Laojunshan area, southeastern Yunnan province, China: Implications for the collision between the Yangtze and Cathaysia blocks. Geochemical Journal 43, 101–122. doi:10.2343/geochemj.1.0012
Guo, L., Gao, R., Shi, L., Huang, Z., and Ma, Y. (2019). Crustal thickness and Poisson’s ratios of South China revealed from joint inversion of receiver function and gravity data. Earth Planet. Sci. Lett. 510, 142–152. doi:10.1016/j.epsl.2018.12.039
He, H., Fang, Z., and Li, P. (1993). A preliminary approach to the fault activityof southern segment on xiaojiangwest branch fault. Journal of Seismological Research 16 (3), 291–298.
Huang, Z., Wang, L., Xu, M., Ding, Z., Wu, Y., Wang, P., et al. (2015). Teleseismic shear-wave splitting in SE Tibet: Insight into complex crust and upper-mantle deformation. Earth Planet. Sci. Lett. 432, 354–362. doi:10.1016/j.epsl.2015.10.027
Jin, H., Gao, Y., Su, X., and Fu, G. (2019). Contemporary crustal tectonic movement in the southern Sichuan-Yunnan block based on dense GPS observation data. Earth and Planetary Physics 3 (1), 53–61. doi:10.26464/epp2019006
Kondo, K., Mu, C., Yamamoto, T., Zaman, H., Miura, D., Yokoyama, M., et al. (2012). Oroclinal origin of the Simao arc in the Shan-Thai block inferred from the cretaceous palaeomagnetic data. Geophys. J. Int. 190, 201–216. doi:10.1111/j.1365-246X.2012.05467.x
Lev, E., Long, M. D., and van der Hilst, R. D. (2006). Seismic anisotropy in Eastern Tibet from shear wave splitting reveals changes in lithospheric deformation. Earth Planet. Sci. Lett. 251, 293–304. doi:10.1016/j.epsl.2006.09.018
Li, C., He, D., Sun, Y., He, J., and Jiang, Z. (2014). Structural characteristic and origin of intra-continental fold belt in the eastern Sichuan basin, South China Block. J. Asian Earth Sci. 111, 206–221. doi:10.1016/j.jseaes.2015.07.027
Li, Y., Hao, M., Song, S., Zhu, L., Cui, D., Zhuang, W., et al. (2021). Interseismic fault slip deficit and coupling distributions on the Anninghe-Zemuhe-Daliangshan-Xiaojiang fault zone, southeastern Tibetan Plateau, based on GPS measurements. J. Asian Earth Sci. 219, 104899. doi:10.1016/j.jseaes.2021.104899
Liang, S., Gan, W., Shen, C., Xiao, G., Liu, J., Chen, W., et al. (2013). Three-dimensional velocity field of present-day crustal motion of the Tibetan Plateau derived from GPS measurements. Journal of Geophysical Research Solid Earth 118 (10), 5722–5732. doi:10.1002/2013jb010503
Liang, C., Liu, Z., Hua, Q., Wang, L., Jiang, N., and Wu, J. (2020). The 3D seismic azimuthal anisotropies and velocities in the eastern Tibetan plateau extracted by an azimuth-dependent dispersion curve inversion method. Tectonics 39. doi:10.1029/2019TC005747
Liu, Q. Y., Van Der Hilst, R. D., Li, Y., Yao, H. J., Chen, J. H., Guo, B., et al. (2014). Eastward expansion of the Tibetan Plateau by crustal flow and strain partitioning across faults. Nat. Geosci. 7, 361–365. doi:10.1038/ngeo2130
Liu, C., Yao, H., Yang, H. Y., Shen, W., Fang, H., Hu, S., et al. (2019). Direct inversion for three-dimensional shear wave speed azimuthal anisotropy based on surface wave ray tracing: Methodology and application to yunnan, southwest China. J. Geophys. Res. Solid Earth 124, 11394–11413. doi:10.1029/2018JB016920
Liu, J., Wu, J., Wang, W., Fang, L., and Chang, K. (2020). Seismic anisotropy beneath the eastern margin of the Tibetan Plateau from SKS splitting observations. Tectonophysics 785, 228430. doi:10.1016/j.tecto.2020.228430
Lu, L., He, Z., Ding, Z., and Wang, C. (2014). Azimuth anisotropy and velocity heterogeneity of Yunnan area based on seismic ambient noise. Chinese Journal of Geophysics (in Chinese) 57 (3), 822–836. doi:10.6038/cjg20140312
Ma, J., Huang, J., and Fu, Y. (2022). Phase velocity tomography of Rayleigh and Love waves in the suture zone between the Yangtze and Cathaysia Blocks. Chinese Journal of Geophysics (in Chinese) 65 (4), 1255–1270. doi:10.6038/cjg2022P0217
Montagner, J. (1986). Regional three-dimensional structures using long-period surface waves. Ann. Geophys. 4 (B3), 283–294.
Pandey, P., Ramegowda, V., and Senthil-Kumar, M. (2015). Shared and unique responses of plants to multiple individual stresses and stress combinations: Physiological and molecular mechanisms. Frontiers in Plant Science 6, 723. doi:10.3389/fpls.2015.00723
Rabbel, W., and Mooney, W. D. (1996). Seismic anisotropy of the crystalline crust: What does it tell us? Terra Nova 8 (1), 16–21. doi:10.1111/j.1365-3121.1996.tb00721.x
Roger, F., Calassou, S., Lancelot, J., Malavieille, J., Mattauer, M., Zhiqin, X., et al. (1995). Miocene emplacement and deformation of the Konga Shan granite (Xianshui He fault zone, west Sichuan, China): Geodynamic implications. Earth and Planetary Science Letters 130 (1-4), 201–216. doi:10.1016/0012-821x(94)00252-t
Sato, K., Liu, Y., Wang, Y., Yokoyama, M., Yoshioka, S. Y., Yang, Z., et al. (2007). Paleomagnetic study of cretaceous rocks from Pu'er, Western yunnan, China: Evidence of internal deformation of the indochina block. Earth and Planetary Science Letters 258 (1-2), 1–15. doi:10.1016/j.epsl.2007.02.043
Shen, C., Mei, L., Xu, Z., X., Tang, J., and Tian, P. (2007). Fission track thermochronology evidence for Mesozoic-Cenozoic uplifting of Daba Mountain, central China. Acta Petrologica Sinica 23 (11), 2901–2910. doi:10.1631/jzus.2007.B0900
Shen, C. Y., Yang, G. L., Tan, H. B., Xuan, S. B., Wu, G. J., and Wang, J. (2015). Gravity anomalies and crustal density structure characteristics of profile Weixi-Guiyang. Chinese Journal of Geophysics 58 (11), 3952–3964. (in Chinese). doi:10.6038/cjg20151106
Sheng, S., Wan, Y., Hu, X., Gong, M., and Zhang, S. (2022). The influence of moderate earthquakes on the crustal stress field inferred from 5 moderate earthquakes in Yingjiang area. Chinese Journal of Geophysics 65 (6), 2063–2073. (in Chinese). doi:10.6038/cjg2022P0151
Shi, X. B., Qiu, X. L., Liu, H. L., Chu, Z. Y., and Xia, B. (2006). Thermochronological analyses on the cooling history of the Lincang granitoid bathotith, Western Yunnan. Acta Petrologica Sinica 22 (2), 465–479. doi:10.1016/j.sedgeo.2005.11.009
Shi, Y. T., Gao, Y., Wu, J., and Su, Y. J. (2009). Crustal seismic anisotropy in yunnan, southwestern China. J. Seismol. 13, 287–299. doi:10.1007/s10950-008-9128-9
Shi, Y., Gao, Y., Su, Y., and Wang, Q. (2012). Shear-wave splitting beneath yunnan area of southwest China. Earthq. Sci. 25, 25–34. doi:10.1007/s11589-012-0828-4
Shi, H., Shi, X., Glasmacher, U. A., Yang, X., and Stockli, D. F. (2016). The evolution of eastern Sichuan basin, Yangtze block since Cretaceous: Constraints from low temperature thermochronology. Journal of Asian Earth Sciences 116, 208–221. doi:10.1016/j.jseaes.2015.11.008
Silver, P. G., and Chan, W. W. (1991). Shear wave splitting and sub continental mantle deformation. J. Geophys. Res. 96, 16429–16454. doi:10.1029/91jb00899
Simons, D. (2002). Understanding effective treatments of myofascial trigger points. Journal of Bodywork and movement therapies 6 (2), 81–88. doi:10.1054/jbmt.2002.0271
Smith, M., and Dahlen, F. (1973). The azimuthal dependence of Love and Rayleigh wave propagation in a slightly anisotropic medium. Journal of Geophysical Research 78 (17), 3321–3333. doi:10.1029/jb078i017p03321
Su, Y., and Qin, J. (2001). Strong earthquake activity and relation to regional neotectonic movement in sichuan-yunnan region. Geological Review 17 (1), 24–34. (in Chinese). doi:10.3969/j.issn.1001-4683.2001.01.004
Sun, Y., Niu, F., Liu, H., Chen, Y., and Liu, J. (2012). Crustal structure and deformation of the SE Tibetan plateau revealed by receiver function data. Earth Planet. Sci. Lett. 349350, 186–197. doi:10.1016/j.epsl.2012.07.007–
Sun, Y., Liu, J., Zhou, K., Chen, B., and Guo, R. (2015). Crustal structure and deformation under the Longmenshan and its surroundings revealed by receiver function data. Phys. Earth Planet. Inter. 244, 11–22. doi:10.1016/j.pepi.2015.04.005
Tai, L. X., Gao, Y., Liu, G., and Xiao, Z. (2015). Crustal seismic anisotropy in the southeastern margin of Tibetan plateau by ChinArray data: Shear-wave splitting from temporary observations of the first phase. Chinese Journal of Geophysics 58 (11), 4079–4091. (in Chinese). doi:10.6038/cjg20151116
Tanaka, K., Mu, C., Sato, K., Takemoto, K., Miura, D., Liu, Y., et al. (2008). Tectonic deformation around the eastern Himalayan syntaxis: Constraints from the Cretaceous palaeomagnetic data of the Shan-Thai Block. Geophys. J. Int. 175, 713–728. doi:10.1111/j.1365-246X.2008.03885.x
Tarantola, A., and Valette, B. (1982). Generalized nonlinear inverse problems solved using the least squares criterion. Reviews of Geophysics 20 (2), 219–232. doi:10.1029/rg020i002p00219
Teng, J., Song, P., Dong, X., Liu, Y., Ma, X., and Yan, Y. (2019). The crust-mantle structure and geophysical boundary field characteristics of Panzhihua ancient mantle plume" relics. Chinese Journal of Geophysics 62 (9), 3296–3320. (in Chinese). doi:10.6038/cjg2019L0153
Tong, Y. B., Yang, Z., Zheng, L., Xu, Y. L., Wang, H., Gao, L., et al. (2013). Internal crustal deformation in the northern part of Shan-Thai Block: New evidence from paleomagnetic results of Cretaceous and Paleogene redbeds. Tectonophysics 608, 1138–1158. doi:10.1016/j.tecto.2013.06.031
Wang, C. Y., Flesch, L. M., Silver, P. G., Chang, L. J., and Chan, W. W. (2008). Evidence for mechanically coupled lithosphere in central Asia and resulting implications. Geology 36, 363–366. doi:10.1130/G24450A.1
Wang, F. Y., Pan, S. Z., Liu, L., Liu, B. F., Zhang, J. S., Deng, X. G., et al. (2014). Wide angle seismic exploration of yuxi-lincang profile—the research of crustal structure of the red river fault zone and southern yunnan. Chinese Journal of Geophysics 57 (10), 3247–3258. (in Chinese). doi:10.6038/cjg20141013
Wang, Q., Gao, Y., and Shi, Y. (2015). Rayleigh wave azimuthal anisotropy on the southeastern front of the Tibetan Plateau from seismic ambient noise. Chinese Journal of Geophysics 58 (11), 4068–4078. (in Chinese). doi:10.6038/cjg20151115
Wang, W., Wu, J., Fang, L., Lai, G., and Cai, Y. (2017). Crustal thickness and Poisson’s ratio in southwest China based on data from dense seismic arrays. J. Geophys. Res. Solid Earth 122, 7219–7235. doi:10.1002/2017JB013978
Wang, H., Wu, J., Zhou, S., Fang, L., Wang, W., and Liu, Y. (2020). Rayleigh wave azimuthal anisotropy in the Southeastern Tibetan Plateau from Eikonal tomography. Chinese Journal of Geophysics 63 (3), 1070–1084. (in Chinese). doi:10.6038/cjg2020N0104
Wang, J., Xu, C., Wen, Y., Zang, J., and Xian, Z. (2022). Characteristics of segmentation and interseismic coupling along the Red River fault from GPS observations. Chinese Journal of Geophysics (4), 1240–1254. (in Chinese). doi:10.6038/cjg2022P0174
Wang, M., and Shen, Z. (2020). Present-Day crustal deformation of continental China derived from GPS and its tectonic implications. J. Geophys. Res. Solid Earth 125. doi:10.1029/2019JB018774
Wu, J., Ming, Y., and Wang, C. (2004). Source mechanism of small-moderate earthquakes and tectonic stress field in Yunnan Province. Acta Seismologica Sinica 17 (5), 509–517. doi:10.1007/s11589-004-0032-2
Wu, J., Yang, T., Wang, W., Ming, Y., and Zhang, T. (2013). Three dimensional P wave velocity structure around Xiaojiang fault system and its tectonic implications. Chinese J. Geophys. 56, 2257–2267. (in Chinese). doi:10.6038/cjg20130713
Xiang, H. F., Xu, X. W., Guo, S. M., Zhang, W. X., Li, H. W., and Yu, G. H. (2002). Sinistral thrusting along the Lijiang-Xiaojinhe fault since quaternary and its geologic-tectonic significance-Shielding effect of transverse structure of intracontinental active block. Seismology and Geology 24 (2), 188–198.
Xiong, X., Gao, R., Wang, H., Zhang, J., and Guo, L. (2016). Frozen subduction in the Yangtze block: Insights from the deep seismic profiling and gravity anomaly in east Sichuan fold belt. Earthq. Sci. 29, 61–70. doi:10.1007/s11589-016-0140-9
Xu, X., Wen, X., Zheng, R., Ma, W., Song, F., and Yu, G. (2003). Pattern of latest tectonic motion and its dynamics for active blocks in Sichuan-Yunnan region, China. Science in China Series D Earth Sciences 46 (2), 210–226. doi:10.3969/j.issn.1674-7240.2003.z1.017
Xu, T., Zhang, Z., Liu, B., Chen, Y., Zhang, M., Tian, X., et al. (2015). Crustal velocity structure in the Emeishan large igneous province and evidence of the Permian mantle plume activity. Science China Earth Sciences 58 (7), 1133–1147. doi:10.1007/s11430-015-5094-6
Xu, Z., Huang, Z., Wang, L., Xu, M., Ding, Z., Wang, P., et al. (2016). Crustal stress field in yunnan: Implication for crust-mantle coupling. Earthq. Sci. 29, 105–115. doi:10.1007/s11589-016-0146-3
Xu, Y., Tong, Y., Wang, H., and Yang, Z. (2017). Paleomagnetic constrains on the reversed S shaped structure deformation of the lanping—simao basin in the southeastern xizang (tibet) plateau. Geological Review (in Chinese) 63 (3), 19. doi:10.16509/j.georeview.2017.03.002
Xu, Y. G., and Chung, S. L. (2001). The Emeishan large igneous province: Evidence for mantle plume activity and melting conditions. Geochimica 30 (1), 1–9.
Xu, Z. H. (2001). A present-day tectonic stress map for eastern Asia region. Acta Seismologica Sinica 14 (5), 524–533. doi:10.1007/bf02718059
Yang, T., Wu, J., Fang, L., and Wang, W. (2014). Complex structure beneath the southeastern Tibetan plateau from teleseismic P-wave tomography. Bull. Seismol. Soc. Am. 104, 1056–1069. doi:10.1785/0120130029
Yang, Y., Hu, S., Yao, H., Fang, L., and Wu, J. (2020). Crustal shear wave velocity and radial anisotropy in the Xiaojiang fault zone system (SE Tibet) revealed by ambient noise interferometry. Tectonophysics 792, 228594. doi:10.1016/j.tecto.2020.228594
Yang, X., Li, Y., Afonso, J. C., Yang, Y., and Zhang, A. (2021). Thermochemical state of the upper mantle beneath south China from multi-observable probabilistic inversion. J. Geophys. Res. Solid Earth 126. doi:10.1029/2020JB021114
Yao, H., Van Der Hilst, R. D., and de Hoop, M. V. (2006). Surface-wave array tomography in SE Tibet from ambient seismic noise and two-station analysis - I. Phase velocity maps. Geophys. J. Int. 166, 732–744. doi:10.1111/j.1365-246X.2006.03028.x
Yao, H., Van Der Hilst, R. D., and Montagner, J. P. (2010). Heterogeneity and anisotropy of the lithosphere of SE Tibet from surface wave array tomography. J. Geophys. Res. Solid Earth 115, B12307. doi:10.1029/2009JB007142
Yuan, P., Jiang, W., Wang, K., and Sneeuw, N. (2018). Effects of spatiotemporal filtering on the periodic signals and noise in the GPS position time series of the crustal movement observation network of China. Remote Sensing 10 (9), 1472. doi:10.3390/rs10091472
Zhang, Z., Badal, J., Li, Y., Chen, Y., Yang, L., and Teng, J. (2005). Crust-upper mantle seismic velocity structure across Southeastern China. Tectonophysics 395, 137–157. doi:10.1016/j.tecto.2004.08.008
Zhang, L., Jin, S., Wei, W., Ye, G., Jing, J., Dong, H., et al. (2015). Lithospheric electrical structure of South China imaged by magnetotelluric data and its tectonic implications. J. Asian Earth Sci. 98, 178–187. doi:10.1016/j.jseaes.2014.10.034
Zhao, B., Huang, Y., Zhang, C., Wang, W., Tan, K., and Du, R. (2015). Crustal deformation on the Chinese mainland during 1998–2014 based on GPS data. Geod. Geodyn. 6, 7–15. doi:10.1016/j.geog.2014.12.006
Zheng, C., Ding, Z. F., and Song, X. D. (2016). Joint inversion of surface wave dispersion and receiver functions for crustal and uppermost mantle structure in Southeast Tibetan Plateau. Chinese Journal of Geophysics 59 (9), 3223–3236. doi:10.6038/cjg20160908
Zheng, X. F., Yao, Z. X., Liang, J. H., and Zheng, J. (2010). The role played and opportunities provided by igp dmc of china national seismic network in wenchuan earthquake disaster relief and researches. Bull. Seismol. Soc. Am. 100, 2866–2872. doi:10.1785/0120090257
Zhu, G., Yu, J. H., Zhou, X., Wang, X., and Wang, Y. (2019). The Western boundary between the Yangtze and Cathaysia blocks, new constraints from the Pingbian Group sediments, southwest South China Block. Precambrian Res 331, 105350. doi:10.1016/j.precamres.2019.105350
Keywords: azimuthal anisotropy, ambient noise tomography (ANT), Tibetan plateau (TP), simao block, yangtze block, cathaysian block
Citation: Liu J, Wu J, Fang L, Chang K, Yang T, Wang C, Wang H and Wang S (2023) Characteristics of azimuthal anisotropy in SE Tibetan plateau and its relationship with the background of block structure. Front. Earth Sci. 11:1065911. doi: 10.3389/feart.2023.1065911
Received: 10 October 2022; Accepted: 08 February 2023;
Published: 20 February 2023.
Edited by:
Weijia Sun, Institute of Geology and Geophysics (CAS), ChinaReviewed by:
Weijuan Meng, Tsinghua University, ChinaMikhail Rodkin, Institute of Earthquake Prediction Theory and Mathematical Geophysics (RAS), Russia
Copyright © 2023 Liu, Wu, Fang, Chang, Yang, Wang, Wang and Wang. This is an open-access article distributed under the terms of the Creative Commons Attribution License (CC BY). The use, distribution or reproduction in other forums is permitted, provided the original author(s) and the copyright owner(s) are credited and that the original publication in this journal is cited, in accordance with accepted academic practice. No use, distribution or reproduction is permitted which does not comply with these terms.
*Correspondence: Jianping Wu, d2pwd3VAY2VhLWlncC5hYy5jbg==; Lihua Fang, ZmxoQGNlYS1pZ3AuYWMuY24=